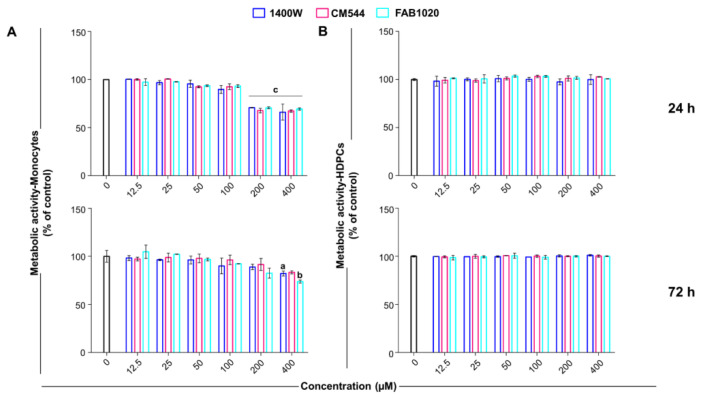
Figure 2.
Cell metabolic activity of human monocytes and HDPCs (MTS assay). Cell cultures were exposed to 1400 W, CM544 or FAB1020 for 24 or 72 h. Bars represent the percentages of cell metabolic activity in the presence of compounds (0–400 µM) in human monocytes (A) or HPDCs (B). OD values in control untreated cultures (0 µM, black bars) are set to 100%. a = p < 0.01, b = p < 0.001 and c = p < 0.0001 between treated cells and the untreated control.

