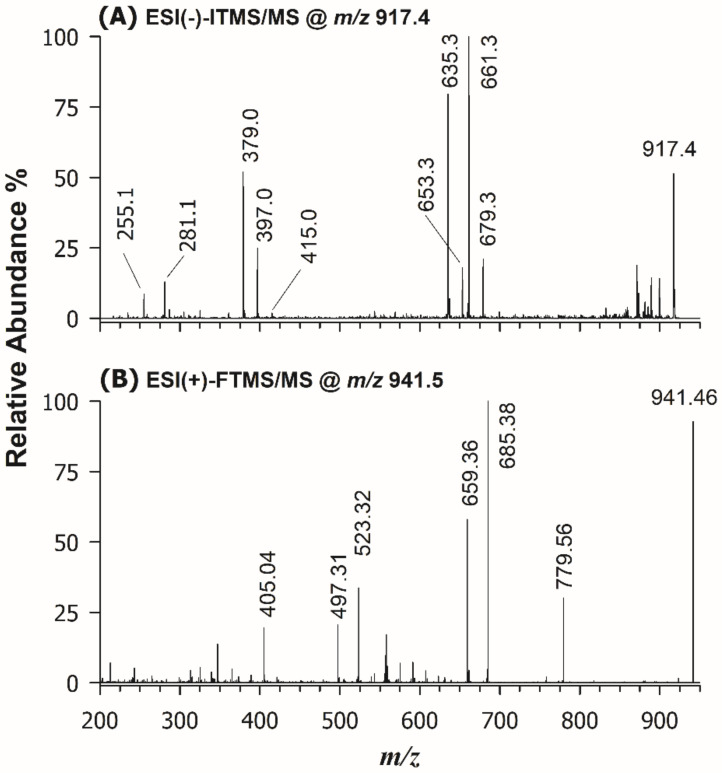
Figure 4.
(A) ESI(-)-ITMS/MS spectrum, obtained after HILIC separation of the BD extract of U. pinnatifida, of the [M-H]─ ion detected at m/z 917.4; (B) ESI(+)-FTMS/MS spectrum, obtained upon direct infusion of the same BD extract after sodium acetate addition, for the [M+Na]+ ion detected at m/z 941.46. The final assignment inferred from the two spectra was DGDG 16:0/18:1.

