

Abstract
A challenge in cancer research is the lack of physiologically responsive in vitro models that enable tracking of cancer cells in tissue-like environments. A model that enables real-time investigation of cancer cell migration, fate, and function during angiogenesis does not exist. Current models, such as 2D or 3D in vitro culturing, can contain multiple cell types, but they do not incorporate the complexity of intact microvascular networks. The objective of this study was to establish a tumor microvasculature model by demonstrating the feasibility of bioprinting cancer cells onto excised mouse tissue. Inkjet-printed DiI+ breast cancer cells on mesometrium tissues from C57Bl/6 mice demonstrated cancer cells' motility and proliferation through time-lapse imaging. Colocalization of DAPI+ nuclei confirmed that DiI+ cancer cells remained intact postprinting. Printed DiI+ 4T1 cells also remained viable after printing on Day 0 and after culture on Day 5. Time-lapse imaging over 5 days enabled tracking of cell migration and proliferation. The number of cells and cell area were significantly increased over time. After culture, cancer cell clusters were colocalized with angiogenic microvessels. The number of vascular islands, defined as disconnected endothelial cell segments, was increased for tissues with bioprinted cancer cells, which suggests that the early stages of angiogenesis were influenced by the presence of cancer cells. Bioprinting cathepsin L knockdown 4T1 cancer cells on wild-type tissues or nontarget 4T1 cells on NG2 knockout tissues served to validate the use of the model for probing tumor cell versus microenvironment changes. These results establish the potential for bioprinting cancer cells onto live mouse tissues to investigate cancer microvascular dynamics within a physiologically relevant microenvironment.
Impact statement
To keep advancing the cancer biology field, tissue engineering has been focusing on developing in vitro tumor biomimetic models that more closely resemble the native microenvironment. We introduce a novel methodology of bioprinting exogenous cancer cells onto mouse tissue that contains multiple cells and systems within native physiology to investigate cancer cell migration and interactions with nearby microvascular networks. This study corroborates the manipulation of different exogenous cells and host microenvironments that impact cancer cell dynamics in a physiologically relevant tissue. Overall, it is a new approach for delineating the effects of the microenvironment on cancer cells and vice versa.
Keywords: tumor microenvironment, bioprinting, inkjet printing, cell printing, tissue culture, intact microvasculature, angiogenesis, multicellular/microvascular interactions, multicellular system, microphysiological system, cancer cell dynamics, breast cancer cells
Introduction
Cancer represents a significant challenge to public health in the United States and worldwide and an opportunity for the biomedical engineering field. Solid tumors account for the majority of cancer-related deaths,1 yet drug attrition rates remain high for the treatment of these diseases.2,3 One potential explanation for these high attrition rates is the lack of in vitro tumor microenvironment models at the preclinical level. In addition to neoplastic cells, solid tumors comprise many host cell types within the tumor microenvironment.4 It is increasingly clear that neoplastic cells influence host cells to promote angiogenesis, growth, metastasis, drug resistance, and other tumorigenic phenotypes.5 Tumor-associated host cells and their interactions with neoplastic cells offer attractive therapeutic targets for their key roles in tumor progression.6 Therefore, understanding these cancer cell dynamics and cell-environment interactions are crucial for the development of new therapeutic modalities.
The investigation of cancer cell/host environment interactions requires models that incorporate cancer cells, stromal cells, and blood vessels. A challenge for tissue engineering is building the complexity of the cancer-host environment. To meet this challenge, tissue engineering methods have incorporated two- and three-dimensional (3D) in vitro cell assays, microfluidics, and bioprinting. Advances in these bottom-up approaches are highlighted, for example, by microfluidic models that incorporate multiple cell types, patterned channels, fluid flow, and an extracellular matrix.7 These microfluidic approaches are being used for the investigation of tumor cell migration dynamics,8,9 the effects of hypoxia on extravasation,10 and effects of environmental gradients on tumor cells.11 Another emergent technology is 3D bioprinting.12 Three-dimensional printing of complex, functional living tissues is made feasible due to the widespread use of additive manufacturing technologies with biocompatible and cell-laden biomaterials.13–15 A recent study has three-dimensionally printed a scaffold-free tumor containing fibroblasts, cancer cells, and endothelial cells that arrange themselves similar to in vivo tumors.16 Another study has focused on creating vascularized-oriented models by bioprinting a perfused channel lined with endothelial cells that is adjacent to a cluster of glioma stem cells to study glioblastoma vascular dynamics.17
Despite the advancements of these bottom-up engineered models and the demonstration of their usefulness for cancer research, the goal to recapitulate in vivo complexity motivates new approaches that intersect engineering and physiology. The objective of this study is to develop a novel tumor microenvironment in vitro model containing microvascular networks by incorporating bioprinting methodology and a recently introduced ex vivo mouse tissue culture model. Our results support the potential for bioprinting on live, mouse tissues. The top-down approach to spatially control the addition of cells to an intact tissue expands the potential applications of bioprinting and showcases a model for modulating cell and microenvironment interactions, independently.
We previously demonstrated the ability to print cancer cells on rat mesentery ex vivo using laser direct to deposit cancer cells on rat tissue.18 This was the first demonstration of printing live cells on live tissue. Herein, we now establish the ability to print on mouse tissue enabling the future use of transgenic mouse strains to probe cell versus environment mechanisms. The mesometrium tissue is a thin, translucent connective tissue that is easily harvested, self-contained, and maintained in culture.19 Its simplicity and the fact that it contains intact microvasculature makes this mouse tissue advantageous for bioprinting exogenous cells. In this study, exogenous breast cancer cells were successfully bioprinted in a pattern onto live mouse tissue that contained intact microvascular networks. The bioprinted cancer cells and the tissue remained viable during ex vivo culture for 5 days. Time-lapse imaging allowed the tracking of cancer cells, which revealed their proliferative and migratory dynamics within an intact microvasculature. Furthermore, studies with genetically modified breast cancer cells and genetically modified tissues demonstrated the ability to probe neoplastic cancer cell and host microenvironment changes.
Materials and Methods
Culturing and labeling cells
The breast cancer cell lines used in these experiments were 4T1 murine cells obtained from American Type Culture Collection (Manassas, VA). Cells were cultured in RPMI media supplemented with 10% fetal bovine serum (FBS) and maintained under normal culture conditions (37°C and 5% CO2). Cells were subcultured upon reaching 75% confluence. Nontarget (NT: SHC202V) and cathepsin L knockdown (CTSL KD: TRCN0000030580) cells were generated using Sigma Mission Lentiviral Particles (Sigma-Aldrich, St. Louis, MO). NT and KD cells were maintained under normal culture conditions in the presence of 3 μg/mL puromycin. For bioprinting, 15 million cells were labeled with Vybrant CM-DiI (Molecular Probes, Eugene, OR) as per manufacturer's protocol. Briefly, cells in suspension were centrifuged at 600 g for 5 min and then resuspended with 4 mL of minimum essential media (MEM; Gibco, Thermo Fisher Scientific, Waltman, MA) +1% Penicillin/Streptomycin (Pen-Strep; Gibco, Thermo Fisher Scientific) containing 20 μL of the DiI solution. The cells were then incubated at 37°C for 5 min following another incubation at 4°C for 15 min. They were centrifuged again at 600 g for 5 min to be washed one time with Dulbecco's phosphate buffered saline (DPBS; Gibco, Thermo Fisher Scientific) before being resuspended in 600 μL of MEM +1% Pen-Strep supplemented with 10% FBS.
Transwell assay
Transwell inserts (8 μm pore) were coated with 50 μL 1:5 dilution of Matrigel:RPMI, respectively. Inserts were then incubated at 37°C for 30 min to allow the Matrigel to solidify. Complete medium was added to the underside of the insert and 104 4T1 cells were suspended in 200 μL serum-free RPMI and plated on top of the solidified Matrigel. Cells were allowed to invade through the Matrigel for 24 h at 37°C and 5% CO2, then fixed with 70% ethanol and stained with 0.1% crystal violet. Any cells and Matrigel remaining on the top of the insert were removed with a cotton swab. Cells that invaded to the underside of the insert were counted, n = 4.
Cell proliferation assays
For in vitro cells: In a 96-well plate, 4T1 cells were seeded at 103 cells/well in a total volume of 100 μL complete media. Cells were grown at 37°C in 5% CO2. Cells were incubated with 10 μL of Cell Counting Kit-8 (CCK8; Dojindo Molecular Technologies, Rockville, MD) reagent for 1 h at 37°C. Cell proliferation was assessed by measuring the absorbance at 450 nm, n = 3.
For bioprinted cells: After 3 days of culture, mesometrium tissues with printed cancer cells were labeled for BrdU, E-Cadherin, and DAPI. Briefly, BrdU (Sigma-Aldrich) dissolved in MEM +1% Pen-Strep (1 mg/mL) was added to each well after removing old media and incubated under normal culture conditions for 2 h. Tissues were then spread on microscope slides and fixed in 4% paraformaldehyde for 10 min at room temperature. After three 10-min washes with PBS, they were placed in a 2M hydrochloric acid solution for 1 h at 37°C. Following another three 10-min washes with PBS +0.1% saponin, tissues were labeled with polyclonal rabbit anti-brdU (Abcam, Cambridge, MA) primary antibody diluted at 1:100 with PBS +0.1% saponin +2% bovine serum albumin (BSA) +5% normal goat serum (NGS) incubated at 4°C overnight. The next day, following three 10-min washes with PBS +0.1% saponin, tissues were incubated with the secondary antibody, goat anti-rabbit Alexa Fluor-594 (Jackson ImmunoResearch Laboratories, West Grove, PA), diluted at 1:100 with PBS +0.1% saponin +2% BSA +5% NGS incubated at room temperature for 1 h in the dark. After washing, they were labeled with FITC-conjugated E-Cadherin (BD Biosciences, San Jose, CA) diluted at 1:100 with PBS +0.1% saponin +2% BSA +5% NGS incubated at room temperature for 1 h in the dark. Following washes, tissues were labeled with DAPI (Thermo Fisher Scientific) stain diluted at 1:3000 with PBS +0.1% saponin +2% BSA incubated at room temperature for 10 min in the dark.
Immunoblot
Whole cell lysates were harvested in RIPA buffer supplemented with protease inhibitor (Sigma-Aldrich). Lysates were incubated on ice for 30 min with periodic vortexing before centrifugation at 10,000 rpm at 4°C. Protein concentration was normalized using BCA assay and equal concentration of proteins were diluted in Laemmli Buffer (0.125 M Tris, 4% SDS, 20% glycerol, β-mercaptoethanol) and boiled for 5 min. Lysates were run on a polyacrylamide gel and transferred to PVDF membrane before blocking in 5% milk in TBST (20 mM Tris, 137 mM NaCl, 0.1% Tween 20, pH 7.5) for 1 h. Primary antibodies utilized were against cathepsin L (R&D Systems, Minneapolis, MN) and actin (Sigma-Aldrich) used at 1:2000 and 1:20,000, respectively. Primary antibodies were incubated in 5% BSA in TBST overnight at 4°C. HRP-conjugated secondary antibodies were incubated for at least 1 h in TBST followed by detection using the Pierce ECL2 reagent (Thermo Fisher Scientific).
Animal models
All animal experiments were approved by the University of Florida's Institutional Animal and Care Use Committee. Six- to eight-week-old female BALB/c mice were injected through the tail vein with 104 NT shRNA or CTSL shRNA expressing 4T1 cells in a total volume of 100 μL PBS. Three weeks after inoculation, mice were euthanized and their lungs were harvested. The number of macroscopic lung colonies were counted, n = 10. For the mammary intraductal models, 1-year-old retired breeder female BALB/c mice were anesthetized using isoflurane and injected in their left 4th mammary with 103 NT shRNA or CTSL shRNA expressing 4T1 cells in a total volume of 10 μL. Mammary tumors were measured over time using calipers (Tumor volume = Length × width2). At humane endpoints, mice were euthanized and mammary tumors and lungs were harvested, n = 14.
Mouse mesometrium tissue harvesting
The protocol followed for tissue harvesting is from Suarez-Martinez et al.19 Briefly, 10–16 week-old, female C57BL/6, wild-type (WT) and neuron-glial antigen 2 knockout (NG2 KO) mice were euthanized by CO2 asphyxiation followed by cervical dislocation. The abdominal fur was removed and the abdomen was sterilized with 70% isopropyl and iodine. After cutting the abdominal skin and muscle and moving all the organs to expose the uterine horns, the mesometrium tissues were harvested. The mesometrium tissue is the connective tissue of the uterine horn in female mice. The dimensions of this tissue ranged approximately 6–10 mm in length, 10–15 mm in width, and 70–90 μm in thickness (data not shown). The excised tissues were rinsed in warm DPBS, transferred to warm MEM, and 1% Pen-Strep, and then moved into the incubator set to normal culture conditions.
Inkjet printing breast cancer cells
In a biosafety cabinet, individual mesometrium tissues were spread on a polycarbonate filter fitted to a cell-crown insert (Sigma-Aldrich) and then placed on a 100 mm sterile Petri dish. The dish with the tissue was then transferred out of the biosafety cabinet and on top of the stage of the inkjet bioprinter. The cell bioink used comprised DiI-positive breast cancer cells suspended in cell medium (MEM +1% Pen-Strep +10% FBS) and 2% (w/v) sodium-alginate (Acros Organics, NJ) solution mixed in a 2:1 ratio, respectively. The cell bioink was deposited using drop-on-demand inkjet printing, as illustrated in Figure 1, for its accurate performance as described in previous studies.20–22 Specifically, the cell bioink was deposited through droplets onto the mesometrium tissue using an inkjet system that comprised a 120 μm ABL piezoelectric printhead (MicroFab, Plano, TX) whose control module generated the voltage excitation waveform, an xy motorized motion stage (Aerotech, Pittsburgh, PA) to adjust the position of the printhead, and a pneumatic controller (MicroFab) ensuring enough fluid back pressure to maintain proper menisci levels of the cell bioink. Herein, the excitation waves used are described as follows: driving voltage of ±120 V, frequencies of 2 Hz, dwell/echo times of 40–45 μs, and rise and fall times of 8–10 μs. A single cancer cell spot per tissue was created, each containing 10–12 droplets of the cell bioink in the same location. Warm MEM +1% Pen-Strep was added on top of the tissue about 30 s after printing and then incubated for 5 min under normal culture conditions. The tissue with cells was then inverted into a well of a six-well culture plate with 1 mL of MEM +1% Pen-Strep supplemented with 20% FBS; 3 mL more of the culture medium was added to have a total of 4 mL of MEM +1% Pen-Strep +20% FBS. The tissues with cells were then placed in an incubator set to normal culture conditions for up to 5 days, where the culture media were changed every 24 h, n = 7 per group.
FIG. 1.
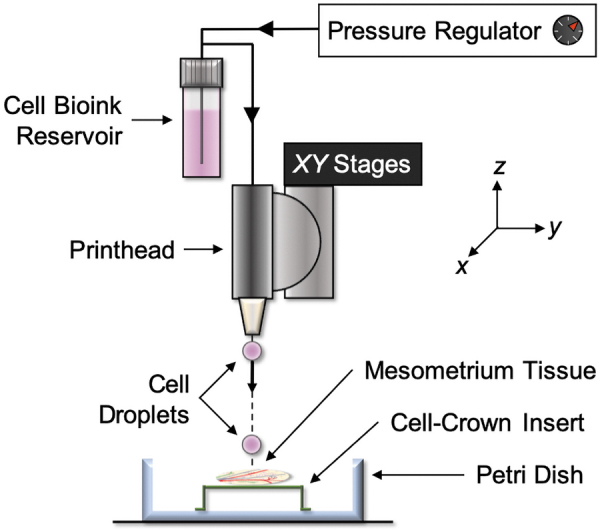
Schematic of bioprinting exogenous cells onto live, ex vivo tissue. The inkjet system comprises a 120 μm ABL piezoelectric printhead whose control module generates the voltage excitation waveform, an xy motorized motion stage that adjusts the position of the printhead, and a pneumatic pressure controller that ensures enough fluid-back pressure to maintain proper menisci levels of cell bioink. The cells were printed on top of the mesometrium tissue that is spread on a cell-crown insert and inside a 100 mm Petri dish. The excitation waves used for this inkjet printing system are the following: driving voltage of ±120 V, frequencies of 2 Hz, dwell/echo times of 40–45 μs, and rise and fall times of 8–10 μs.
Quantification of motility and proliferation of bioprinted breast cancer cells
The spot of DiI-positive breast cancer cells (NT and CTSL KD) that were bioprinted onto the mesometrium tissues were imaged every 24 h starting at Day 0 to create a time-lapse. Utilizing ImageJ software, the motility and proliferation of the printed cells were quantified. For motility calculated on Day 0, 1, and 2, a perimeter was traced to enclose the spot of DiI-positive cells measured in mm2. Motility on Day 5 was quantified from immunohistochemistry-labeled tissues by tracing the perimeter of E-Cadherin-positive cells. All area measurements correspond to the pixel per mm ratio that is determined by the objective used to create the image. For proliferation calculated on Day 0, 1, and 2, the Cell Count plugin was used to count the individual DiI-positive cells. Proliferation on Day 5 was quantified from immunohistochemistry-labeled tissues by creating a rectangle within the drawn perimeter enclosing all the E-Cadherin-positive cells. The area of the rectangle was the equivalent of 5% of the total cell area. The Cell Count plugin was then utilized to count the E-Cadherin-positive cells within the drawn rectangle containing an area that is representative of the total cell area. The total number of cancer cells on Day 5 that correlates to proliferation is calculated by multiplying the number of cells counted in the rectangle by 20.
Quantification of angiogenesis from mesometrium tissues with bioprinted breast cancer cells
ImageJ was used to quantify the microvascular remodeling of mesometrium tissues that had bioprinted breast cancer cells after a 5-day ex vivo culture. This quantification analysis was blinded. Montages of whole tissues allowed to quantify the total number of capillary sprouts, vascular segments, and vascular islands of the entire tissue. The obtained numbers were normalized with the total vascular length. These numbers were obtained using the Cell Count plug-in, whereas the length was measured using the segmented line to trace all the vasculature. The ratio of pixel per mm, according to the camera and objective, was applied to the images to acquire the correct vascular length. To ensure consistency and reproducibility while analyzing data, we clearly defined all that was quantified. A capillary sprout was defined as a blind-ended segment with only one side being connected to the network. A vascular segment was defined as a connection between two nodes within the microvascular network where capillary sprouts were not counted as vascular segments but vascular islands were counted as a vascular segment. A vascular island was defined as disconnected vascular segments that is not part of the main microvascular network, which could contain capillary sprouts. Finally, vascular length was defined as the length of all microvascular networks that excluded capillary sprouts but included vascular islands.
Immunohistochemistry
Mouse mesometrium tissues were spread on microscope slides to be fixed in 100% methanol at −20°C for 30 min and then washed three times with cold PBS +0.1% saponin for 10 min each wash. The fixed tissues were then labeled with the following antibodies: 1:200 rat anti-mouse platelet endothelial cell adhesion molecule (PECAM; BD Biosciences) with 1:500 streptavidin-CY3 (Strep-CY3; Jackson ImmunoResearch Laboratories) secondary and 1:100 FITC-conjugated E-Cadherin (E-Cadherin; BD Biosciences). All antibodies were diluted in antibody buffer solution, which contained PBS +0.1% saponin +2% BSA +5% NGS. All primary and secondary antibodies were incubated for 1 h at room temperature in the dark. After every antibody incubation, tissues were rinsed three times with cold PBS +0.1% saponin for 10 min.
Microscopy
Images were taken with a 4 × , 10 × , and 20 × oil objectives from an inverted microscope, Nikon Eclipse Ti2, paired with an Andor Zyla camera. Time-lapse images of the DiI-positive cells during culture were imaged with a 4 × and 10 × objective. Whole tissue images with PECAM and E-Cadherin labeling were acquired with a 10 × objective to extrapolate cancer cell motility and proliferation along with microvascular remodeling.
Statistical analysis
Data are presented as mean ± standard error of mean (SEM). Proliferation and motility of cancer cells were compared across different culture days with repeated measures one-way Analysis of Variance (ANOVA) followed by Tukey's multiple comparison tests to notify differences between the days. Proliferation and motility of cancer cells were compared across experimental groups (NT vs. Cathepsin L KD, WT vs. NG2 KO) with multiple unpaired two-tailed Student t-tests with Holm/Sidak correction to notify the differences between the groups per culture day. Angiogenesis and cathepsin L knockdown in vitro and in vivo data were compared using unpaired two-tailed Student's t-tests with Welch's correction. A p-value <0.05 was considered statistically significant. All the statistical analyses were executed using GraphPad Prism version 8.4 software.
Results
Bioprinted cancer cells on live tissue is viable and reproducible
Murine 4T1 breast cancer cells were bioprinted onto a live mouse mesometrium tissue through an inkjet printer that contained the cell bioink reservoir to precisely deposit 10–12 cell droplets on the middle of the tissue. A schematic of the inkjet printer setup with the different elements needed for this novel protocol is shown in Figure 1. Bioprinted cancer cells that were prelabeled with DiI revealed a circular spot of the exogenous cancer cells that adhered onto a certain predefined location of the tissue (Fig. 2A). Time-lapse imaging demonstrated the ability to observe the proliferation and motility of the bioprinted DiI-positive cancer cells during 5 days in ex vivo culture (Fig. 2A–F). A LIVE assay confirmed the viability of the bioprinted cancer cells immediately after printing (Fig. 2G–I) and after 5 days in ex vivo culture (Fig. 2J–L). DiI-positive cancer cells colocalized with DAPI-positive nuclei postprinting, further corroborating the success of cell deposition (Fig. 2M, N). Moreover, the positive BrdU labeling after 3 days of ex vivo culture confirmed cancer cell proliferation (Fig. 2O–R). E-cadherin antibody identified cancer cell clusters after 3 days (Fig. 2O). All E-cadherin-positive cancer cells had DAPI-positive nuclei, and a portion of the cells were also BrdU-positive (Fig. 2R). The quantifications for the proliferation and motility of breast cancer cells were analyzed by counting the number of cells (Fig. 2S) and measuring the cell area (Fig. 2T), respectively. Repeated-measures one-way ANOVA revealed a significant difference between all days for the number of cells (Day 0: 159 ± 41, Day 1: 370 ± 78, Day 2: 889 ± 184, Day 5: 18,031 ± 1696; p < 0.05; n = 7) and the cell area (Day 0: 0.72 ± 0.19 mm2, Day 1: 1.89 ± 0.33 mm2, Day 2: 2.92 ± 0.44 mm2, Day 5: 5.93 ± 0.75 mm2; p < 0.05; n = 7) confirming the proliferation and motility of the bioprinted cancer cells on the mesometrium tissue. Hence, the data from Figure 2 verify that the exogenous cancer cells that are bioprinted onto live mouse tissues remain viable, are proliferative and migrate away from their initial position.
FIG. 2.

Bioprinting mouse breast cancer cells on live, mouse tissue is viable and reproducible. (A–F) DiI-positive cancer cells were inkjet printed in a circular pattern (dashed circle) and time-lapse imaged for 5 consecutive days. The mesometrium tissue and the bioprinted cancer cells remained viable after printing on Day 0 (G–I), and after culture on Day 5 (J–L). (M, N) Cancer cells were also shown to be nucleated immediately after being bioprinted. (O–R) After 3 days in culture, nucleated cancer cells started to form clusters, express E-Cadherin, and be proliferative (arrowheads). Proliferation (S) and motility (T) of bioprinted cancer cells were quantified during ex vivo culture. Data are shown as the mean ± SEM and *represents p < 0.05, n = 7. Scale bars = 500 μm (A–F), 250 μm (G–N), 50 μm (O–R).
Cathepsin L is important for invasion and tumor progression in cancer
Previous studies have identified cathepsin L as a major regulator of the metastatic phenotype.23–25 Before bioprinting cathepsin L knockdown cancer cells on murine tissues, we carried out in vitro and in vivo studies to verify the functional effects of inhibiting cathepsin L expression in cancer cells. With this rational, murine 4T1 breast cancer cells that stably express either nontarget or cathepsin L shRNA were generated. Immunoblot of whole cell lysates revealed that cathepsin L was successfully knockdown using an independent cathepsin L-targeting shRNA compared with the nontarget control (Fig. 3A). Under normal in vitro culture conditions, cathepsin L knockdown cells proliferate at the same rate (Fig. 3B; Day 1: NT 0.20 ± 0.01, Cathepsin L KD 0.20 ± 0.01, p = 0.1; Day 2: NT 0.26 ± 0.03, Cathepsin L KD 0.27 ± 0.03, p = 0.8; Day 3: NT 0.39 ± 0.06, Cathepsin L KD 0.52 ± 0.03, p = 0.1; n = 3). When assayed for their ability to invade through Matrigel in a transwell invasion assay, cathepsin L knockdown cells were significantly less invasive than the nontarget shRNA-expressing controls (Fig. 3C; NT 92.5 ± 14.1, Cathepsin KD 41.7 ± 8.7, p = 0.038, n = 4). Altogether, these data suggest that cathepsin L is important for invasion, but not for in vitro proliferation.
FIG. 3.

Cathepsin L is not important for in vitro proliferation in 4T1 murine breast cancer cells, but it is for in vitro invasion and in vivo tumor progression and metastasis. (A–C) In vitro experiments using 4T1 murine breast cancer cells indicated the importance of cathepsin L in invasion but not in cell proliferation. (A) Whole cell lysates were analyzed by immunoblot. (B) Cells were plated at equal numbers and proliferation was assessed over time using the CCK8 reagent. (C) Cells were plated on top of transwell inserts and allowed to invade through Matrigel for 24 h. Cells were then fixed and stained with Crystal Violet and the number of invaded cells was counted. (D–F) In vivo experiments indicated the importance of cathepsin L in tumor progression and metastasis. Nontarget, NT, shRNA or CTSL, KD, shRNA-expressing cells were implanted in the mammary ducts of female BALB/c mice and (D) the number of days from time of injection until tumors became palpable, and (E) the number of days from injection until humane endpoints were reached were quantified. (F) Nontarget, NT, shRNA or CTSL, KD, shRNA-expressing cells were injected through the tail vein of female BALB/c mice and the number of visible nodules per lung were quantified after 3 weeks. Data are shown as the mean ± SEM and *, **, *** represent p < 0.05, p < 0.002, p < 0.0001, respectively.
The role of cathepsin L on the metastatic phenotype was also confirmed in vivo using the syngeneic BALB/c mammary intraductal (MIND) model. Briefly, 103 4T1 cells expressing nontarget or cathepsin L shRNA were implanted into the left 4th mammary duct and tumor growth was measured over time using calipers. Cathepsin L knockdown resulted in tumors that took longer to initiate (Fig. 3D; NT 19 ± 1 days, n = 14, Cathepsin KD 22 ± 1 days, n = 13, p = 0.029) and a longer time to reach humane endpoints (Fig. 3E; NT 26 ± 1 days, n = 14, Cathepsin KD 30 ± 1 days, n = 13, p = 0.005) compared with the nontarget shRNA-expressing tumors. Murine 4T1 cells are known to spontaneously metastasize to the lungs.26 As cathepsins are known to be involved in regulating multiple aspects of the metastatic cascade, we also assessed mice for spontaneous lung metastasis using the MIND model. Nontarget and cathepsin L shRNA-expressing 4T1 cells were injected into female BALB/c mice through the tail vein. Three weeks later, lungs were harvested and the number of visible tumor colonies were counted. Cathepsin L knockdown resulted in reduced number of lung nodules in this metastasis model (Fig. 3F; NT 66.8 ± 4.5, Cathepsin KD 23.7 ± 2.2, p < 0.0001, n = 10).
Bioprinted cathepsin L knockdown cancer cells on intact microvasculature have decreased proliferation and motility
Since cathepsin L has been shown to have an effect on tumor progression and metastasis, we tested the impact of cathepsin L during ex vivo culture when murine 4T1 cathepsin L knockdown breast cancer cells were bioprinted on a tissue containing intact microvasculature in its native physiology. DiI-positive nontarget (Fig. 4A–C) and cathepsin L knockdown (Fig. 4D–F) cancer cells were bioprinted on mesometrium tissues and time lapsed to assess the proliferation and motility of the two types of cells on a microenvironment that has microvascular networks. The quantification for the number of cells (Fig. 4G) and cell area (Fig. 4H) during the different time points of ex vivo culture were significantly different between the two groups after Day 1. Nontarget and cathepsin L knockdown groups were significantly different on Day 2 and Day 5 for the number of cells (Day 2: NT 889 ± 184, Cathepsin L KD 309 ± 42, p = 0.028; Day 5: NT 18,031 ± 1696, Cathepsin L KD 7060 ± 1043, p = 0.0005; n = 7) and the cell area (Day 2: NT 2.92 ± 0.44 mm2, Cathepsin L KD 1.46 ± 0.21 mm2, p = 0.033; Day 5: NT 5.93 ± 0.75 mm2, Cathepsin L KD 2.42 ± 0.45 mm2, p = 0.008; n = 7). These data suggest that cathepsin L knockdown cancer cells have a decreased proliferation and motility compared with nontarget cells when cultured after 1 day in a physiologically relevant ex vivo tissue.
FIG. 4.

Cathepsin L knockdown in breast cancer cells decrease proliferation and motility during ex vivo culture. Prelabeled DiI nontarget, NT (A–C), or cathepsin L knockdown, KD (D–F), 4T1 murine breast cancer cells were bioprinted on mesometrium tissues containing intact microvasculature with its native physiology. Proliferation (G) and motility (H) of bioprinted nontarget (black circle symbol) and cathepsin L knockdown (blue triangle symbol) cancer cells on mesometrium tissues were quantified during ex vivo culture. Data are shown as the mean ± SEM and * represents p < 0.05, n = 7. Scale bars = 500 μm.
Bioprinted cancer cells on NG2 knockout tissue with intact microvasculature have decreased proliferation and motility
To demonstrate the applicability of the model for investigating the effect of microenvironment alterations on cancer cell dynamics, we bioprinted murine 4T1 breast cancer cells on mesometrium tissues from wild-type (Fig. 5A–C) or NG2 knockout (Fig. 5D–F) mice. Time-lapse images of the DiI-positive cancer cells bioprinted on both tissue types were analyzed to identify any changes in the proliferation or motility of the cancer cells. The quantification for the number of cells (Fig. 5G) of both types of tissues during the different time points of ex vivo culture was significantly different after Day 1 (Day 2: WT 889 ± 184, NG2 KO 448 ± 76, p = 0.047; Day 5: WT 18,031 ± 1696, NG2 KO 12,994 ± 2252, p = 0.049; n = 7). Moreover, the quantification for the cell area (Fig. 5H) of both types of tissues were significantly different after Day 0 (Day 1: WT 1.89 ± 0.33 mm2, NG2 KO 0.93 ± 0.16 mm2, p = 0.049; Day 2: WT 2.92 ± 0.44 mm2, NG2 KO 1.44 ± 0.30 mm2, p = 0.049; Day 5: WT 5.93 ± 0.75 mm2, NG2 KO 2.28 ± 0.39 mm2, p = 0.004; n = 7). These data suggest that the lack of NG2 expression by cells in the host microenvironment influenced cancer cell proliferation and motility compared with a wild-type tissue microenvironment.
FIG. 5.

Bioprinted breast cancer cells on NG2 knockout tissues have decreased proliferation and motility during ex vivo culture. Prelabeled DiI 4T1 murine breast cancer cells were bioprinted on wild-type, WT (A–C), or neuron-glial antigen 2 knockout, NG2 KO (D–F) mesometrium tissues containing intact microvasculature with its native physiology. Proliferation (G) and motility (H) of bioprinted 4T1 murine breast cancer cells on wild-type (black circle symbol) and neuron-glial antigen 2 knockout (purple triangle symbol) mesometrium tissues were quantified during ex vivo culture. Data are shown as the mean ± SEM and * represents p < 0.05, n = 7. Scale bars = 500 μm.
Bioprinted cancer cells have an effect on the early stages of the angiogenic microvasculature
A key advantage of this platform is the ability to evaluate the spatial coordination and functional relationships between the exogenous, printed cancer cells, and the microvasculature. After 5 days in ex vivo culture, tissues that had bioprinted murine 4T1 breast cancer cells were fixed and labeled with E-cadherin and PECAM to visualize the cancer cells and endothelial cells, respectively (Fig. 6). Observation of the PECAM-positive blind-ended sprouts suggest that the native microvasculature in the mesometrium tissue was angiogenic (Fig. 6A, D). Furthermore, E-cadherin-positive breast cancer cell clusters (Fig. 6B, E) were observed to colocalize with high-density PECAM-positive vessel regions, characteristic of an angiogenic response (Fig. 6C, F). The changes in angiogenesis after a 5-day ex vivo culture were quantified by counting the number of capillary sprouts, vascular segments, and vascular islands from the sham control (Fig. 7A–C) and the group with bioprinted breast cancer cells (Fig. 7D–F). Although the presence of cancer cells did not appear to have a significant effect on the capillary sprout density (Fig. 7G; Sham 3.77 ± 0.36 #/mm, Cancer Cells 4.22 ± 0.35 #/mm, p = 0.38, n = 7), or the vascular segment density (Fig. 7H; Sham 7.71 ± 0.93 #/mm, Cancer Cells 11.16 ± 1.37 #/mm, p = 0.061, n = 7), there was a significant increase in the vascular island density (Fig. 7I; Sham 0.32 ± 0.08 #/mm, Cancer Cells 1.14 ± 0.31 #/mm, p = 0.036, n = 7) when compared with the sham control suggesting a differential effect on cancer cell presence on the angiogenic response to the culture conditions.
FIG. 6.

Breast cancer cells colocalize with the microvasculature after 5 days in ex vivo culture. Bioprinted 4T1 murine breast cancer cells onto wild-type mesometrium tissues were cultured ex vivo for 5 days. Tissues with cells were fixed in methanol and labeled against PECAM (A, D) and E-cadherin (B, E) to identify endothelial cells lining the microvasculature and cancer cells, respectively. After 5 days, the cancer cells colocalized with the microvasculature (C, F) which was angiogenic indicative by the capillary sprouts (arrows). Scale bars = 100 μm. PECAM, platelet endothelial cell adhesion molecule.
FIG. 7.

The presence of breast cancer cells has an effect on the early stages of the angiogenic microvasculature. Bioprinted 4T1 murine breast cancer cells onto wild-type mesometrium tissues (D–F) and sham control, excluding cancer cells (A–C) were cultured ex vivo for 5 days. Tissues with cells were fixed in methanol and labeled against PECAM to identify endothelial cells lining the microvasculature. Both groups were angiogenic indicative of the capillary sprouts (arrows), and had the presence of vascular islands, disconnected segments (*). After 5 days in culture, the number of capillary sprouts (G), vascular segments (H), and vascular islands (I) were quantified for the sham control (white circle symbol) and the bioprinted cancer cells (black circle symbol). Data are shown as the mean ± SEM and * represents p < 0.05, n = 7. Scale bars = 100 μm.
Cathepsin L knockdown in bioprinted cancer cells has a negative effect on sprout and vascular densities during angiogenesis
Since cathepsin L KD cancer cells had a decreased proliferation and motility in this ex vivo model, the impact from cathepsin L on the angiogenic microvasculature was evaluated next. Following the same protocol to assess angiogenesis, wild-type mesometrium tissues that had nontarget or cathepsin L KD cancer cells were analyzed after 5 days in ex vivo culture. PECAM labeling identified the angiogenic microvasculature from both groups, which was indicative by the capillary sprouts coming off vessels (Fig. 8A, B, D, E). To analyze angiogenesis, the number of capillary sprouts and vascular segments, which were normalized to the total vascular length were quantified. These data revealed that tissues with cathepsin L KD cancer cells had a significant decrease in the capillary sprout density (Fig. 8C; NT 4.21 ± 0.35 #/mm, Cathepsin L KD 2.34 ± 0.35 #/mm, p = 0.0027, n = 7), and vascular segment densities (Fig. 8F; NT 11.16 ± 1.37 #/mm, Cathepsin L KD 5.44 ± 0.80 #/mm, p = 0.005, n = 7) when compared with tissues with nontarget cancer cells.
FIG. 8.

Cathepsin L in breast cancer cells has a direct effect on capillary sprouts and vascular densities in the microvasculature during angiogenesis. Bioprinted nontarget, NT, (A, B) or cathepsin L knockdown, KD, (D, E) 4T1 murine breast cancer cells onto wild-type mesometrium tissues were cultured ex vivo for 5 days. Tissues with cells were fixed in methanol and labeled against PECAM to identify endothelial cells lining the microvasculature. Both groups were angiogenic indicative of the capillary sprouts (arrows). After 5 days in culture, the number of capillary sprouts (C) and vascular segments (F) were quantified for the nontarget cancer cells (black circle symbol) and the cathepsin L KD cancer cells (blue triangle symbol). Data are shown as the mean ± SEM and * represents p < 0.05, n = 7. Scale bars = 100 μm.
Discussion
The novelty of the current study is the demonstration of cancer cell bioprinting on live, mouse tissue enabling (1) the investigation of cancer cell migration in an intact, tissue environment, (2) the probing of cell versus microenvironment effects on cancer cell dynamics, and (3) the investigation of cancer cell aggregation on microvascular network growth. To our knowledge, this is the first tumor microenvironment model that incorporates exogenous cells onto live mouse tissue through inkjet printing to better recapitulate the complexity of real, vascularized tissue. While the duration limit for our model remains to be determined, application of our combined bioprinting and tissue culture method can be used to investigate how cancer cells interact with the normal microvasculature during the initial stages of cancer progression. The novelty of our approach is appreciated when compared with experiments using just endothelial cells to represent vessels or the other emergent tissue engineering techniques that interface cancer cells with relevant extracellular matrix materials or perfusion systems. Given the limitations of these models associated with simplification of the stromal component and microvasculature, we attempt to bridge the gap between current coculture models and physiological relevance.
Our study was inspired by the work of Phamduy et al. in 2015 where they laser direct-write printed breast cancer cells on live rat mesentery tissue.18 The contribution of our study is the advancement of this approach utilizing a more common inkjet method and, more impactful, the use of mouse tissue. The bioprinting on mouse tissue now can be leveraged to expand the types of cell versus microenvironment cancer research-related questions. To this end, we demonstrate the applications of the novel approach by probing the effect of cathepsin L knockdown in cancer cells and the effect of an altered tissue environment (i.e., tissues harvested from wild-type versus NG2 knockout mice).
We foresee the potential that this novel methodology can have based on its real tissue microenvironment, precise incorporation of any kind of cell type, and ability to manipulate the host environment. Recently, biomimetic models are becoming common in vitro models for cancer research, such as microfluidic devices and bioprinting fabrication. Haessler et al. used a microfluidic device to highlight the impact that interstitial flow has on cancer cell migration responses from various breast cancer cell subpopulations.9 Intravasation and extravasation of tumor cells have also been investigated using microfluidic assays.8,27,28 Most recently, Kamm and colleagues developed a microfluidic that comprised a 3D microvasculature to study how hypoxia affects the extravasation of breast cancer cells.10 Another recent study created a microfluidic model to investigate the effects under various metabolic starvation gradients.11 Utilizing bioprinting techniques to create biomimetic models for cancer research has also recently seen rapid advancements. Bioprinting has allowed the development of many different 3D cancer-type in vitro models like ovarian cancer,29 glioblastoma,17 and breast cancer.30 Most recently, Langer et al. 3D bioprinted an architecturally defined, multicell, and scaffold-free tissue that recapitulated a human primary tumor that is capable of investigating heterogeneity in therapeutic response, signaling and migration.16
Our model aims to become an intermediate model between in vitro and in vivo studies. The mouse mesometrium culture model utilized in this study is an ex vivo model that has many beneficial characteristics and capabilities: (1) containing intact microvascular networks with identifiable arterioles, venules, and capillaries, (2) containing perivascular cells like smooth muscle cells and pericytes, (3) containing lymphatics, peripheral nerves, and immune cells, (4) time-lapse imaging, and (5) inducing angiogenesis.19 While it has great advantages, limitations of the study include the lack of perfusion in the microvessels, which is known to regulate endothelial sprouting.31 Future experiments are necessary to incorporate this feature, although this is a common limitation in widely used in vitro cancer cell models and ex vivo angiogenic models like retina explant32 and aortic ring33 assays that have advanced microvascular dynamics knowledge. Another limitation is the lack of real tumor/stroma microenvironment since the mesometrium tissue is from healthy, cancer-free mice. Future experiments are needed to observe long-term cancer cell dynamics that would show the ability of the bioprinted cancer cells to form tumors. The main advantages of our model versus common in vivo models are the time-lapse capability, its simplicity, and ease of use. The ex vivo microenvironment enables future applications of time-specific cell tracking or cell/tissue treatment studies (siRNA or pharmacology), which are technically difficult in vivo.
A major challenge in bioprinting is the bioink selection. This challenge is even more highlighted when attempting to print on live tissues, as patterning, cell viability, and tissue (i.e., substrate) viability are real issues. In our study, we address this challenge by showing that the use of an alginate-based viscous cellular bioink enables printing of a reproducible cell cluster pattern without tissue death or printing tip clogging. For accurate deposition of cell bioinks, the droplet-on-demand (DOD) dispensing mechanism systems are generally preferred to produce finer features with better resolution than others based on extrusion methods.34 The main DOD bioprinting approaches include laser-induced forward transfer (LIFT)35–37 and inkjetting.20,22,38 While LIFT enables the deposition of highly viscous inks given its orifice-free nature, the droplet formation process is generally difficult to be controlled precisely.39 Therefore, to obtain repetitive and accurate deposition results, inkjet printing was chosen for this study; a simple schematic of the methodology is shown in Figure 1. Since inkjet printing is preferred for low-viscosity inks, the bioink utilized in this study was a low concentration of alginate-based cell bioink. The ink was carefully chosen because the rheological properties of the deposited cell bioink are crucial factors that determine the extent of the spreading degree of the deposited material on the receiving substrate. As such, sodium alginate, a widely utilized biomaterial,40 was chosen as a biocompatible rheology modifier to increase the viscosity of the ink ensuring a good postprinting pattern preservation. The issue of the bioink is an important one, as initial trials with a lower viscosity media resulted in lack of patterning control due to fluid dispersion over the tissue. The use of two other bioinks were attempted without success or efficiency (data not shown). We first tried cell media (MEM +1% PS +10% FBS) alone as the bioink. After printing the cell pattern, the tissue with cells was placed in the incubator for 10 min, then a thin layer of media (MEM +1% PS) was added on top of the tissue and incubated for another 10 min to allow the cells to fully adhere before platting. Although the cell pattern was maintained, the tissue was not viable. Even incubating the tissue with cells for 3 min postprinting, instead of 10 min, did not maintain the tissue alive. When the tissue with cells were subjected to 10 or 3 min in the incubator postprinting, only the cells were LIVE-positive, but most of the surrounding tissue (70–100%) did not label for LIVE. The only way to keep the tissue alive was to add media on top of it immediately after printing. The downfall of that was that the pattern was lost. Therefore, we decided to try a more viscous bioink in an attempt to maintain the cell pattern and tissue viability. Collagen type I (3%) was mixed with cell media at a 1:1 ratio to have a more viscous ink. Although the cell pattern and tissue viability were maintained after adding media on top of the tissue 30 or 60 s postprinting, the jetting time was significantly reduced to maximum 10 min due to the gelation of the collagen at room temperature. However, the most optimal bioink was utilized in these experiments because it preserved the cell pattern and tissue viability. The bioink was comprised of cell media and 2% sodium alginate with a 2:1 ratio, respectively. Specifically, a final concentration of ∼0.7% (w/v) of sodium alginate in the cell bioink was used, which helped preserve the printed droplet pattern after the addition of media to the tissue while maintaining good jetting performance of the bioink. Additionally, the incorporated exogenous cells were still able to migrate and proliferate under the presence of this low-concentration alginate solution. Our demonstration of printing a simple pattern motivates future studies to optimize the cell density, media, pattern, and accuracy limits of the method.
By inkjet printing the 4T1 breast cancer cells, we successfully deposited the exogenous cells in a circular pattern onto the mouse mesometrium tissue (Fig. 2A). The spot pattern was selected so that we could quantify radial cell migration (i.e., area expansion) of the printed cells. Murine 4T1 breast cancer cells were utilized for these experiments because this is an aggressive mammary carcinoma cell line that is highly invasive and tumorigenic.41 These characteristics enable the 4T1 cells to undergo the printing process with ease due to their resilience and to be easily incorporated into the tissue. Performing a LIVE assay and showing DAPI-positive nucleated cells, demonstrate that cancer cells remain viable (Fig. 2G–I) and intact (Fig. 2M, N) after the printing protocol. To further corroborate their viability, cells were labeled with DiI before printing to allow for short-term tracking through time-lapse imaging every 24 h. Although it was observed that the cells were migratory and proliferative during ex vivo culture for 5 days (Fig. 2A–F), only time-lapse data from Day 0 until Day 2 were analyzed to quantify the number of cells (Fig. 2S) and cell area (Fig. 2T) that correspond to proliferation and migration, respectively. The reason being that the particular labeling agent used, DiI, is incorporated into the cell membrane of each cell, which results in a decreased expression when the cells divide and proliferate. As the cells undergo mitosis, the daughter cells are only able to express half of the DiI-label compared with their parental cell and after seven generations the DiI is no longer observable. Due to this limitation and to prevent unreliable data, time-lapse images after Day 2 were not quantified. However, proliferation and migration were quantified after 5 days in culture, by fixing and labeling tissues with E-cadherin to identify the cancer cells. Since E-cadherin labels the adherens junctions between epithelial cells that form clusters,42 bioprinted DiI-positive cancer cells on Day 0 do not label for E-cadherin (data not shown). In this ex vivo mouse tissue model, the expression of E-cadherin from cancer cells begins on Day 2, where we observed very small clusters, less than 10 cells (data not shown). On Day 3, the E-cadherin-positive clusters are larger (Fig. 2O), indicating that as time progresses cancer cells begin to express more E-cadherin until large clusters are observed on Day 5.
Based on confocal imaging of DAPI-positive cells, mouse mesometrium tissues are ∼70–90 μm thick (data not shown). Importantly, after initial printing, cells are able to invade the tissue and are observed in the same focal plane with vessels (Fig. 6). In our experience, all microvessels in a tissue can be imaged within a single focal plane for a 10 × or 4 × objective. Thus, the view of the tissue with epifluorescent imaging appears two dimensional (2D), but it is in fact a thin, 3D model. Still, a potential limitation of our study is the quantification of proliferation and migration based on 2D images. Cell area analysis was done using 4 × images. A single 4 × image per tissue was sufficient to measure the cancer cell pattern area. During imaging, focusing throughout the tissue confirmed that the images displayed all of the cancer cells. For the cell number analysis, 10 × images were used. Images were focused on the plane with the most cells. Despite the difference in focal planes, identification of cells and the colocalization of DAPI-possible nuclei was possible. An important note is that images for Day 0 were taken after printing. Over time, the cells invade into the tissue and migrate. Thus, we did focus on different depths for different days to make sure that the cancer cells were being captured. Future experiments and analysis will be needed to determine the temporal dynamics of the migration versus invasion.
From a model design perspective, we focused on Cathepsin L and NG2 to verify the design functional requirements of using the model for probing cell and environment perturbations. Bioprinting cathepsin L knockdown cancer cells on wild-type mesometrium tissue support the use of our model for probing the effects of manipulating the cell type. Cathepsin L was selected as the target molecule because the cysteine cathepsin family of proteases have been proven to be implicated in cancer progression, metastasis, invasion, and proliferation (review in ref.43). More specifically, cathepsin L has been shown to be upregulated in various malignant cancers such as breast, lung, and gastric carcinomas, melanomas, and gliomas.44–47 The expression levels of cathepsin L have revealed a positive correlation with the grade of cancer malignancy and prognosis.48,49 For our study, cathepsin L knockdown 4T1 breast cancer cells were engineered and immunoblot confirmed the decrease of cathepsin L expression (Fig. 3A). In vitro testing confirmed that cathepsin L knockdown decreased cell invasion (Fig. 3C) but not proliferation (Fig. 3B), which is consistent with current literature.24,50 In vivo experiments demonstrated that cathepsin L knockdown impaired tumor progression (Fig. 3D, E) and metastasis (Fig. 3F), which also corroborates prior findings.51 Other in vivo experiments also demonstrated that cathepsin L knockdown decreased tumor mass (data not shown) suggesting an effect on in vivo proliferation, which is consistent with a study by Gocheva et al. This study showed that cathepsin L knockout mice had decreased cell proliferation in tumors assessed with BrdU labeling.51 When cathepsin L knockdown cancer cells were bioprinted onto an ex vivo tissue containing intact microvasculature with native physiology, the number of cells (Fig. 4G) and the cell area (Fig. 4H) were significantly decreased compared with nontarget on Day 2 and Day 5. Interestingly, this validates the use of our model for evaluating cathepsin L knockdown effects and more broadly for using the model to probe cell changes. Also, the effects of cathepsin knockdown on cell proliferation compared with the cell-based in vitro assay suggest that our results might be more reflective of the complex in vivo environment. Moreover, when analyzing how cathepsin L in cancer cells affects the remodeling of the existing microvasculature, our data revealed that tissues with cathepsin L KD cancer cells had a significant decrease in capillary sprout and vascular segment densities when compared with tissues with nontarget cancer cells (Fig. 8). This finding suggests that cathepsin L has a direct impact on angiogenesis in the host microenvironment, which would then have an impact on tumor progression and metastasis since both need to rapidly remodel the microvasculature to succeed. Cathepsin L having a direct effect on angiogenesis has recently been published in the literature,52–54 which verifies these results. Overall, these data regarding cathepsin L verifies the utility of this new methodology and showcases that the readouts obtained are comparable to widely accepted in vivo data. Altogether, our in vivo and ex vivo results closely align with one another and with published reports, thus supporting that our ex vivo model mimics the in vivo environment. Our results also add new information supporting the role for cathepsin L in initial triple-negative breast cancer migration in normal tissue environments.
To establish the use of our model for evaluating microenvironment changes, we bioprinted 4T1 cancer cells onto neuron-glial antigen 2 (NG2) knockout mesometrium tissues. NG2, also known as chondroitin sulfate proteoglycan-4 or melanoma chondroitin sulfate proteoglycan, is a surface type I transmembrane proteoglycan that has functional extracellular and intracellular domains, which can activate important signaling pathways in cell migration, survival, and angiogenesis. NG2 is expressed in a myriad type of cells, including, but not limited to, pericytes, smooth muscle cells, mesenchymal stem cells, osteoblasts, melanocytes, and macrophages (review in ref.55). Since the mesometrium tissue contains pericytes, smooth muscle cells, and macrophages,19 a global ablation of NG2 could have an impact on cell-to-cell interactions between the host microenvironment and exogenous cells. With regard to cancer, some tumor cells express NG2, and NG2-related signaling has been demonstrated to play a key role in tumor progression of various cancers like brain,56 breast,57 and skin.58 In our model, bioprinted cancer cells on NG2 knockout tissue resulted in a significantly decreased proliferation on Day 2 and Day 5 (Fig. 5G), and decreased migration on Day 1, 2, and 5 (Fig. 5H). These results can be explained by understanding the impact of NG2 on the stromal tissue surrounding tumors. Stromal cells of solid tumors frequently express NG2. Stallcup and colleagues designed elegant studies to investigate the contribution of NG2-expressing pericytes and macrophages on the progression of brain tumors. Their results demonstrated that pericyte- and macrophage-specific NG2 null mice had delayed brain tumor progression 10 days after receiving an injection of melanoma cells; there was an 87% decrease in tumor volume from macrophage-NG2 knockout mice and 77% decrease from pericyte-NG2 knockout mice compared with the control.59 These results suggest that expression of NG2 in the microenvironment can be essential for normal cancer cell dynamics and the ablation of NG2 in the microenvironment would therefore negatively impact cancer cell proliferation and migration. While further studies are necessary to elucidate cell-specific roles of NG2 in the host microenvironment for our studies, our findings suggest that NG2 inhibition can play a role in initial cancer cell migration dynamics and more broadly support our approach for similar mechanistic studies aimed at isolating microenvironmental contributions.
Since sustained angiogenesis is one of the hallmarks of cancer,60 we wanted to assess the effects of cancer cells on microvasculature remodeling after culture. After 5 days in ex vivo culture, PECAM and E-cadherin labeling identified capillary sprouts (Fig. 6A, D) and clustering of cancer cells (Fig. 6B, E), respectively. Capillary sprouts are defined as blind-ended, PECAM-positive segments that come off microvascular networks and are indicative of angiogenesis, which is the growth of new blood vessels from pre-existing microvessels.61 Fluorescence imaging revealed examples of breast cancer cell clusters with the angiogenic microvasculature (Fig. 6C, F). Based on a plethora of literature, it is now widely accepted that tumor cells disrupt the balance of pro- and anti-angiogenic signals to sustain the development of new blood vessels into the tumor to provide oxygen and nutrients (review in ref.62). In our model, although the angiogenic metrics analyzed (capillary sprout and vascular segment density) were not significantly different between the two groups, there was a trend where the presence of cancer cells led to a higher mean sprout and vascular density (p = 0.06). Important details to consider regarding the interpretation of these data are the number of cancer cells, the culture media, and the timing of the evaluation. The number of printed cancer cells on Day 0 ranged from 25 to 353. Additional experiments will be needed to determine whether an increased number of cells affects the angiogenic response. Also, the culture media for the cancer cell and control groups contained serum, which is known to stimulate angiogenesis.19 An alternative control group could have included bioprinted cancer cells in serum-free media. Despite these potential issues, the tissues with cancer cells displayed a significant increase in the number of vascular islands (Fig. 7I). Vascular islands are defined as disconnected, PECAM-positive segments that are not part of the main microvascular networks. Previous work from our laboratory has used similar metrics to characterize microvascular network growth and remodeling in adult rat mesentery tissues.63–67 Furthermore, our laboratory also introduced the concept of vascular island formation and reconnection as being dynamics associated with microvascular remodeling.65,68,69 Our initial characterization of the mouse mesometrium suggests analogous structural indicators of growth and remodeling (i.e., capillary sprouts, vascular segment density, and the number of vascular islands). Vascular island formation is associated with vessel dropout and reconnection can occur during growth scenarios. While their relative contribution to overall microvascular growth remains to be determined, the increased vascular islands due to the cancer cell presence suggests that the cancer cells are having an effect on the beginning stages of microvascular remodeling through the generation of disconnected endothelial cell segments. Taken together, these data support the observation of cancer cells with angiogenic microvasculature in a real-tissue microenvironment. This further suggests that the cancer cells are having an effect and motivates follow-up studies to characterize the cancer cell influence of various vessel types along a microvascular network.
Furthermore, this methodology can be applied to study different types of cancers under various conditions because our protocol preserves the structure and complexity of in vivo environments for modeling early stages of tumor development. Future studies to further validate this methodology would be to utilize a transgenic mouse that contains known cancer-related mutations to better mimic the microenvironment. These kinds of experiments would not only increase the clinical relevance but also would allow for evaluating different drug treatments or biologics and their impact on cancer cell dynamics. Cathepsin L was shown in this study to be an important mediator of breast cancer metastatic phenotypes. However, any number of anticancer therapeutic targets can be assessed, either through genetic or pharmacologic manipulation. Likewise, cell characteristics from the host microenvironment can be evaluated as potential modulators of tumorigenic phenotypes. NG2 knockout mesometrium was shown here to alter cancer cell dynamics after 1 day in culture. Furthermore, mesometrium tissue from diverse genetically modified mouse models can be readily applied to this methodology. Also, the bioprinted tissues can be cultured under different conditions, such as hypoxia or different conditioned media. The mesometrium was utilized to study multicellular microvasculature dynamics, but it can also be useful to further study neoplastic cell interactions with host immune cells since the mesometrium also has resident, CD11b-posivite macrophages. Additionally, other types of tissues can potentially be incorporated into this methodology. It is also plausible that biopsied human tissue can be utilized for this methodology, although it was not attempted in this study. Moreover, due to the advantages of inkjet printing, we would also be able to bioprint more than one cell type on the same tissue to observe their interactions with each other and the host microenvironment. For example, it would allow us to evaluate how fibroblasts or immune cells impact cancer cell dynamics and microvascular remodeling. Although this model does use mouse tissue and is currently only shown to be cultured for 5 days, this new methodology has the potential to further the cancer field by being able to shed light on initial processes of cancer cell dynamics and how it interacts with the existing microvasculature. Having the ability to independently, genetically manipulate the cancer cells and the host tissue along with its time-lapse capability would allow to specifically probe certain proteins or genes that could identify new mechanisms in cancer progression. These new mechanisms could also be used to investigate if certain drug treatments could have an effect on the mechanisms. Overall, the future data that can be gathered and evaluated from this methodology could lead to discoveries of new cancer-related mechanisms, which would then advance our knowledge of cancer biology and therefore improve therapeutics.
Conclusions
The current study introduces a novel methodology at the intersection of tissue engineering and physiology. This new demonstration of bioprinting exogenous cancer cells onto intact mouse tissue serves to expand bioprinting applications and offers a new perspective for biomimetic model development. Our results establish a novel methodology that combines inkjet printing and mouse mesometrium culture model to precisely incorporate a spot of breast cancer cells onto live, mouse tissue to investigate cancer cell dynamics and angiogenesis within an intact microvasculature during culture. This study corroborates the manipulation of different exogenous cells and different host microenvironments that impact cancer cell dynamics in a physiologically relevant tissue. This methodology motivates a new approach for basic science studies focused on delineating the effects of the microenvironment on cancer cells and vice versa. The utility of bioprinting cancer cells on live mouse tissue also enables a new platform for testing therapeutic strategies targeting cancer cell interactions with a microvascular environment.
Author Contributions
S.S.D., D.W.S., W.L.M., and Y.H. conceptualization. A.D.S.M. managed project. A.D.S.M., M.S.G., Z.R.W., S.S.D., A.B., and C.P. acquired data. A.D.S.M. and M.S.G. optimized printing methodology. A.D.S.M. and S.S.D. analyzed data. K.B. and D.M. validated data. A.D.S.M., M.S.G., Z.R.W., and S.S.D. wrote original article. A.D.S.M., M.S.G., Z.R.W., S.S.D., W.L.M., D.W.S., Y.H., and M.B. reviewed and edited the article.
Disclosure Statement
No competing financial interests exist.
Funding Information
This study was funded by NIH R01AG049821 awarded to W.L.M., by NSF CMMI-1634755 awarded to Y.H., by Thomas H. Maren Postdoctoral Fellowship awarded to S.S.D., and by NIH R01CA197477 awarded to D.W.S. The initial inkjet printing support from Shinichi Sakurada is highly appreciated.
References
- 1. Siegel, R.L., Miller, K.D., and Jemal, A.. Cancer statistics, 2020. CA Cancer J Clin 70, 7, 2020 [DOI] [PubMed] [Google Scholar]
- 2. Hutchinson, L., and Kirk, R.. High drug attrition rates—where are we going wrong? Nat Rev Clin Oncol 8, 189, 2011 [DOI] [PubMed] [Google Scholar]
- 3. Nixon, N.A., Khan, O.F., Imam, H., et al. Drug development for breast, colorectal, and non-small cell lung cancers from 1979 to 2014. Cancer 123, 4672, 2017 [DOI] [PubMed] [Google Scholar]
- 4. Bussard, K.M., Mutkus, L., Stumpf, K., Gomez-Manzano, C., and Marini, F.C.. Tumor-associated stromal cells as key contributors to the tumor microenvironment. Breast Cancer Res 18, 84, 2016 [DOI] [PMC free article] [PubMed] [Google Scholar]
- 5. Hanahan, D., and Weinberg, R.A.. Hallmarks of cancer: the next generation. Cell 144, 646, 2011 [DOI] [PubMed] [Google Scholar]
- 6. Dykes, S.S., Hughes, V.S., Wiggins, J.M., Fasanya, H.O., Tanaka, M., and Siemann, D.. Stromal cells in breast cancer as a potential therapeutic target. Oncotarget 9, 23761, 2018 [DOI] [PMC free article] [PubMed] [Google Scholar]
- 7. Jiang, K., Dong, C., Xu, Y., and Wang, L.. Microfluidic-based biomimetic models for life science research. RSC Adv 6, 26863, 2016 [Google Scholar]
- 8. Zervantonakis, I.K., Hughes-Alford, S.K., Charest, J.L., Condeelis, J.S., Gertler, F.B., and Kamm, R.D.. Three-dimensional microfluidic model for tumor cell intravasation and endothelial barrier function. Proc Natl Acad Sci USA 109, 13515, 2012 [DOI] [PMC free article] [PubMed] [Google Scholar]
- 9. Haessler, U., Teo, J.C.M., Foretay, D., Renaud, P., and Swartz, M.A.. Migration dynamics of breast cancer cells in a tunable 3D interstitial flow chamber. Integr Biol 4, 401, 2012 [DOI] [PubMed] [Google Scholar]
- 10. Song, J., Miermont, A., Lim, C.T., and Kamm, R.D.. A 3D microvascular network model to study the impact of hypoxia on the extravasation potential of breast cell lines. Sci Rep 8, 1, 2018 [DOI] [PMC free article] [PubMed] [Google Scholar]
- 11. Ayuso, J.M., Virumbrales-Munoz, M., McMinn, P.H., et al. Tumor-on-a-chip: a microfluidic model to study cell response to environmental gradients. Lab Chip 19, 3461, 2019 [DOI] [PMC free article] [PubMed] [Google Scholar]
- 12. Knowlton, S., Onal, S., Yu, C.H., Zhao, J.J., and Tasoglu, S.. Bioprinting for cancer research. Trends Biotechnol 33, 504, 2015 [DOI] [PubMed] [Google Scholar]
- 13. Murphy, S.V., and Atala, A.. 3D bioprinting of tissues and organs. Nat Biotechnol 32, 773, 2014 [DOI] [PubMed] [Google Scholar]
- 14. Huang, Y., Leu, M.C., Mazumder, J., and Donmez, A.. Additive Manufacturing: current state, future potential, gaps and needs, and recommendations. J Manuf Sci Eng 137, 014001, 2015 [Google Scholar]
- 15. Huang, Y., and Schmid, S.R.. Additive manufacturing for health: state of the art, gaps and needs, and recommendations. J Manuf Sci Eng 140, 094001, 2018 [Google Scholar]
- 16. Langer, E.M., Allen-Petersen, B.L., King, S.M., et al. Modeling tumor phenotypes in vitro with three-dimensional bioprinting. Cell Rep 26, 608, 2019 [DOI] [PMC free article] [PubMed] [Google Scholar]
- 17. Lee, V.K., Dai, G., Zou, H., and Yoo, S.-S.. Generation of 3-D glioblastoma-vascular niche using 3-D bioprinting. 2015. 41st Annu Northeast Biomed Eng Conf NEBEC. Troy, NY, USA: IEEE, 2015, pp. 1–2 [Google Scholar]
- 18. Phamduy, T.B., Sweat, R.S., Azimi, M.S., Burow, M.E., Murfee, W.L., and Chrisey, D.B.. Printing cancer cells into intact microvascular networks: a model for investigating cancer cell dynamics during angiogenesis. Integr Biol 7, 1068, 2015 [DOI] [PMC free article] [PubMed] [Google Scholar]
- 19. Suarez-Martinez, A.D., Bierschenk, S., Huang, K., et al. A novel ex vivo mouse mesometrium culture model for investigating angiogenesis in microvascular networks. J Vasc Res 55, 125, 2018 [DOI] [PMC free article] [PubMed] [Google Scholar]
- 20. Xu, C., Chai, W., Huang, Y., and Markwald, R.R.. Scaffold-free inkjet printing of three-dimensional zigzag cellular tubes. Biotechnol Bioeng 109, 3152, 2012 [DOI] [PubMed] [Google Scholar]
- 21. Christensen, K., Compaan, A., Chai, W., Xia, G., and Huang, Y.. In situ printing-then-mixing for biological structure fabrication using intersecting jets. ACS Biomater Sci Eng 3, 3687, 2017 [DOI] [PubMed] [Google Scholar]
- 22. Sakurada, S., Sole-Gras, M., Christensen, K., Wallace, D.B., and Huang, Y.. Liquid-absorbing system-assisted intersecting jets printing of soft structures from reactive biomaterials. Addit Manuf 31, 100934, 2020 [Google Scholar]
- 23. Rozhin, J., Wade, R.L., Honn, K.V., and Sloane, B.F.. Membrane-associated cathepsin L: a role in metastasis of melanomas. Biochem Biophys Res Commun 164, 556, 1989 [DOI] [PubMed] [Google Scholar]
- 24. Sudhan, D.R., and Siemann, D.W.. Cathepsin L inhibition by the small molecule KGP94 suppresses tumor microenvironment enhanced metastasis associated cell functions of prostate and breast cancer cells. Clin Exp Metastasis 30, 891, 2013 [DOI] [PMC free article] [PubMed] [Google Scholar]
- 25. Zhang, W., Wang, S., Wang, Q., Yang, Z., Pan, Z., and Li, L.. Overexpression of cysteine cathepsin L is a marker of invasion and metastasis in ovarian cancer. Oncol Rep 31, 1334, 2014 [DOI] [PubMed] [Google Scholar]
- 26. Pulaski, B.A., and Ostrand-Rosenberg, S.. Reduction of established spontaneous mammary carcinoma following immunotherapy with major histocompatibility complex class II and B7.1 Cell-based tumor vaccines. Cancer Res 58, 1486, 1998 [PubMed] [Google Scholar]
- 27. Riahi, R., Yang, Y.L., Kim, H., Jiang, L., Wong, P.K., and Zohar, Y.. A microfluidic model for organ-specific extravasation of circulating tumor cells. Biomicrofluidics 8, 024103, 2014 [DOI] [PMC free article] [PubMed] [Google Scholar]
- 28. Chen, M.B., Whisler, J.A., Fröse, J., Yu, C., Shin, Y., and Kamm, R.D.. On-chip human microvasculature assay for visualization and quantification of tumor cell extravasation dynamics. Nat Protoc 12, 865, 2017 [DOI] [PMC free article] [PubMed] [Google Scholar]
- 29. Xu, F., Celli, J., Rizvi, I., Moon, S., Hasan, T., and Demirci, U.. A three-dimensional in vitro ovarian cancer coculture model using a high-throughput cell patterning platform. Biotechnol J 6, 204, 2011 [DOI] [PMC free article] [PubMed] [Google Scholar]
- 30. Ling, K., Huang, G., Liu, J., et al. Bioprinting-based high-throughput fabrication of three-dimensional MCF-7 human breast cancer cellular spheroids. Engineering 1, 269, 2015 [Google Scholar]
- 31. Song, J.W., and Munn, L.L.. Fluid forces control endothelial sprouting. Proc Natl Acad Sci USA 108, 15342, 2011 [DOI] [PMC free article] [PubMed] [Google Scholar]
- 32. Sawamiphak, S., Ritter, M., and Acker-Palmer, A.. Preparation of retinal explant cultures to study ex vivo tip endothelial cell responses. Nat Protoc 5, 1659, 2010 [DOI] [PubMed] [Google Scholar]
- 33. Nicosia, R.F., and Ottinetti, A.. Growth of microvessels in serum-free matrix culture of rat aorta. Lab Invest 63, 115, 1990 [PubMed] [Google Scholar]
- 34. Zhang, Z., Jin, Y., Yin, J., et al. Evaluation of bioink printability for bioprinting applications. Appl Phys Rev 5, 041304, 2018 [Google Scholar]
- 35. Lin, Y., Huang, Y., and Chrisey, D.B.. Droplet formation in matrix-assisted pulsed-laser evaporation direct writing of glycerol-water solution. J Appl Phys 105, 093111, 2009 [Google Scholar]
- 36. Xiong, R., Zhang, Z., Chai, W., Huang, Y., and Chrisey, D.B.. Freeform drop-on-demand laser printing of 3D alginate and cellular constructs. Biofabrication 7, 045011, 2015 [DOI] [PubMed] [Google Scholar]
- 37. Vinson, B.T., Phamduy, T.B., Shipman, J., et al. Laser direct-write based fabrication of a spatially-defined, biomimetic construct as a potential model for breast cancer cell invasion into adipose tissue. Biofabrication 9, 025013, 2017 [DOI] [PubMed] [Google Scholar]
- 38. Christensen, K., Xu, C., Chai, W., Zhang, Z., Fu, J., and Huang, Y.. Freeform inkjet printing of cellular structures with bifurcations: approach freeform fabrication of bifurcated cellular structures by using a liquid support-based inkjet printing approach. Biotechnol Bioeng 112, 1047, 2015 [DOI] [PubMed] [Google Scholar]
- 39. Zhang, Z., Xiong, R., Mei, R., Huang, Y., and Chrisey, D.B.. Time-resolved imaging study of jetting dynamics during laser printing of viscoelastic alginate solutions. Langmuir 31, 6447, 2015 [DOI] [PubMed] [Google Scholar]
- 40. Augst, A.D., Kong, H.J., and Mooney, D.J.. Alginate hydrogels as biomaterials. Macromol Biosci 6, 623, 2006 [DOI] [PubMed] [Google Scholar]
- 41. Pulaski, B.A., and Ostrand-Rosenberg, S.. Mouse 4T1 breast tumor model. Curr Protoc Immunol Chapter 20:Unit 20.2, 2000 [DOI] [PubMed] [Google Scholar]
- 42. Rübsam, M., Mertz, A.F., Kubo, A., et al. E-cadherin integrates mechanotransduction and EGFR signaling to control junctional tissue polarization and tight junction positioning. Nat Commun 8, 1, 2017 [DOI] [PMC free article] [PubMed] [Google Scholar]
- 43. Olson, O.C., and Joyce, J.A.. Cysteine cathepsin proteases: regulators of cancer progression and therapeutic response. Nat Rev Cancer 15, 712, 2015 [DOI] [PubMed] [Google Scholar]
- 44. Castiglioni, T., Merino, M.J., Elsner, B., Lah, T., Sloane, B.F., and Emmert-Buck, M.R.. lmmunohistochemical analysis of cathepsins D, B, and L in human breast cancer. Hum Pathol 25, 857, 1994 [DOI] [PubMed] [Google Scholar]
- 45. Dohchin, A., Suzuki, J., Seki, H., Masutani, M., Shiroto, H., and Kawakami, Y.. Immunostained cathepsins B and L correlate with depth of invasion and different metastatic pathways in early stage gastric carcinoma. Cancer 89, 482, 2000 [PubMed] [Google Scholar]
- 46. Kos, J., Stabuc, B., Schweiger, A., et al. Cathepsin B, H, and L and their inhibitors stefin and cystatin C in sera of melanoma patients. Clin Cancer Res 3, 1815, 1997 [PubMed] [Google Scholar]
- 47. Jedeszko, C., and Sloane, B.F.. Cysteine cathepsins in human cancer. Biol Chem 385, 1017, 2004 [DOI] [PubMed] [Google Scholar]
- 48. Skrzypczak, M., Springwald, A., Lattrich, C., et al. Expression of cysteine protease cathepsin L is increased in endometrial cancer and correlates with expression of growth regulatory genes. Cancer Invest 30, 398, 2012 [DOI] [PubMed] [Google Scholar]
- 49. Thomssen, C., Schmitt, M., Goretzki, L., et al. Prognostic value of the cysteine proteases cathepsin B and cathepsin L in human breast cancer. Clin Cancer Res 1, 741, 1995 [PubMed] [Google Scholar]
- 50. Reinheckel, T. The lysosomal cysteine protease cathepsin L regulates keratinocyte proliferation by control of growth factor recycling. J Cell Sci 118, 3387, 2005 [DOI] [PubMed] [Google Scholar]
- 51. Gocheva, V. Distinct roles for cysteine cathepsin genes in multistage tumorigenesis. Genes Dev 20, 543, 2006 [DOI] [PMC free article] [PubMed] [Google Scholar]
- 52. Sudhan, D.R., Rabaglino, M.B., Wood, C.E., and Siemann, D.W.. Cathepsin L in tumor angiogenesis and its therapeutic intervention by the small molecule inhibitor KGP94. Clin Exp Metastasis 33, 461, 2016 [DOI] [PMC free article] [PubMed] [Google Scholar]
- 53. Pranjol, M.Z.I., Gutowski, N.J., Hannemann, M., and Whatmore, J.L.. Cathepsin L Induces proangiogenic changes in human omental microvascular endothelial cells via activation of the ERK1/2 Pathway. Curr Cancer Drug Targets 19, 231, 2019 [DOI] [PubMed] [Google Scholar]
- 54. Pan, T., Jin, Z., Yu, Z., et al. Cathepsin L promotes angiogenesis by regulating the CDP/Cux/VEGF-D pathway in human gastric cancer. Gastric Cancer 23, 974, 2020 [DOI] [PMC free article] [PubMed] [Google Scholar]
- 55. Ampofo, E., Schmitt, B.M., Menger, M.D., and Laschke, M.W.. The regulatory mechanisms of NG2/CSPG4 expression. Cell Mol Biol Lett 22, 4, 2017 [DOI] [PMC free article] [PubMed] [Google Scholar]
- 56. Brekke, C., Lundervold, A., Enger, P.Ø., et al. NG2 expression regulates vascular morphology and function in human brain tumours. NeuroImage 29, 965, 2006 [DOI] [PubMed] [Google Scholar]
- 57. Cooney, C.A., Jousheghany, F., Yao-Borengasser, A., et al. Chondroitin sulfates play a major role in breast cancer metastasis: a role for CSPG4 and CHST11gene expression in forming surface P-selectin ligands in aggressive breast cancer cells. Breast Cancer Res 13, R58, 2011 [DOI] [PMC free article] [PubMed] [Google Scholar]
- 58. Wang, J., Svendsen, A., Kmiecik, J., et al. Targeting the NG2/CSPG4 proteoglycan retards tumour growth and angiogenesis in preclinical models of GBM and Melanoma. PLoS One 6, e23062, 2011 [DOI] [PMC free article] [PubMed] [Google Scholar]
- 59. Yotsumoto, F., You, W.-K., Cejudo-Martin, P., Kucharova, K., Sakimura, K., and Stallcup, W.B.. NG2 proteoglycan-dependent recruitment of tumor macrophages promotes pericyte-endothelial cell interactions required for brain tumor vascularization. OncoImmunology 4, e1001204, 2015 [DOI] [PMC free article] [PubMed] [Google Scholar]
- 60. Hanahan, D., and Weinberg, R.A.. The Hallmarks of Cancer. Cell. 100, 57, 2000 [DOI] [PubMed] [Google Scholar]
- 61. Carmeliet, P. Angiogenesis in life, disease and medicine. Nature 438, 932, 2005 [DOI] [PubMed] [Google Scholar]
- 62. Carmeliet, P., and Jain, R.K.. Angiogenesis in cancer and other diseases. Nature 407, 249, 2000 [DOI] [PubMed] [Google Scholar]
- 63. Murfee, W.L., Rehorn, M.R., Peirce, S.M., and Skalak, T.C.. Perivascular cells along venules upregulate NG2 expression during microvascular remodeling. Microcirculation 13, 261, 2006 [DOI] [PubMed] [Google Scholar]
- 64. Stapor, P.C., and Murfee, W.L.. Identification of class III β-tubulin as a marker of angiogenic perivascular cells. Microvasc Res 83, 257, 2012 [DOI] [PubMed] [Google Scholar]
- 65. Stapor, P.C., Azimi, M.S., Ahsan, T., and Murfee, W.L.. An angiogenesis model for investigating multicellular interactions across intact microvascular networks. Am J Physiol Heart Circ Physiol 304, H235, 2013 [DOI] [PMC free article] [PubMed] [Google Scholar]
- 66. Azimi, M.S., Myers, L., Lacey, M., et al. An ex vivo model for anti-angiogenic drug testing on intact microvascular networks. PLoS One 10, e0119227, 2015 [DOI] [PMC free article] [PubMed] [Google Scholar]
- 67. Motherwell, J.M., Anderson, C.R., and Murfee, W.L.. Endothelial cell phenotypes are maintained during angiogenesis in cultured microvascular networks. Sci Rep 8, 5887, 2018 [DOI] [PMC free article] [PubMed] [Google Scholar]
- 68. Kelly-Goss, M.R., Winterer, E.R., Stapor, P.C., et al. Cell proliferation along vascular islands during microvascular network growth. BMC Physiol 12, 7, 2012 [DOI] [PMC free article] [PubMed] [Google Scholar]
- 69. Kelly-Goss, M.R., Sweat, R.S., Azimi, M.S., and Murfee, W.L.. Vascular islands during microvascular regression and regrowth in adult networks. Front Physiol 4, 108, 2013 [DOI] [PMC free article] [PubMed] [Google Scholar]