

Summary
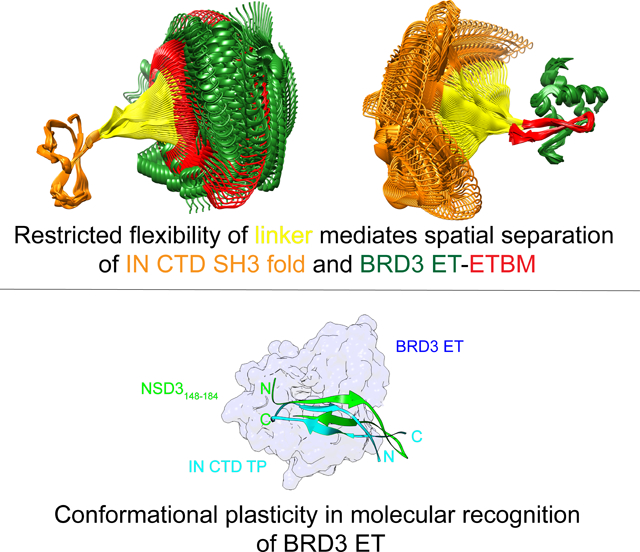
The extra-terminal (ET) domain of BRD3 is conserved among BET proteins (BRD2, BRD3, BRD4), interacting with multiple host and viral protein-protein networks. Solution NMR structures of complexes formed between BRD3-ET domain with either the 79-residue murine leukemia virus integrase (MLV-IN) C-terminal domain (IN329–408), or its 22-residue IN tail peptide (TP) (IN386–407) alone, reveal similar intermolecular three-stranded β-sheet formation. 15N relaxation studies reveal a 10-residue linker region (IN379–388) tethering the SH3 domain (IN329–378) to the ET-binding motif (IN389–405)-ET complex. This linker has restricted flexibility, impacting its potential range of orientations in the IN - nucleosome complex. The complex of the ET-binding peptide of host NSD3 protein (NSD3148–184) and BRD3-ET domain includes a similar three-stranded β-sheet interaction, but the orientation of the β-hairpin is flipped compared to the two IN : ET complexes. These studies expand our understanding of molecular recognition polymorphism in complexes of ET-binding motifs with viral and host proteins.
Graphical Abstract
Etoc Blurb
We address structurally how the MLV Integrase (IN) usurps the host function of the BET protein through comparative studies of the IN: BRD3 ET complex with that of the host NSD3. MLV integration and thus its pathogenesis is driven through protein interactions of the IN: BET family.
Introduction
Bromodomain and extra terminal domain containing proteins (BET) scan for epigenetic marks on host chromatin and also recruit large multiprotein complexes to the chromatin. We, amongst others, have shown an important role for host BET proteins BRD2, BRD3 and BRD4 to interact with the MLV IN (Aiyer et al., 2014, De Rijck et al., 2013, Sharma et al., 2013, Gupta et al., 2013). The extra terminal (ET) domain of BET proteins interacts specifically with the C-terminal domain (CTD) of MLV IN. Interaction with BET proteins is an important determinant for genomic targeting of MLV integration towards transcription start sites (TSS), CpG islands (Wu et al., 2003) and active promoters / enhancers (De Ravin et al., 2014, LaFave et al., 2014). Interestingly, the interaction of MLV IN CTD and ET domains can be disrupted by truncation of the terminal 23 amino-acid C-terminal “tail peptide” (TP) region of the CTD (Aiyer et al., 2014). The phenotypic importance of this disruption was evident due to the decreased preference for integration near TSS and CpG islands both in vitro (Aiyer et al., 2014, Sharma et al., 2013, De Rijck et al., 2013) and in vivo (Loyola et al., 2019).
The ET domain of BET proteins has been described to interact with a multitude of host proteins including NSD3, ATAD5, GLTSCR1, CHD4 and JMJD6 (Rahman et al., 2011, Wai et al., 2018), as well as the Kaposi’s sarcoma herpes virus (KSHV) latency associated nuclear antigen-1 (LANA-1) CTD (Hellert et al., 2013). The mechanism of ET domain directed protein-protein interaction is thought to be conserved across all of these complexes, based on solution NMR studies (Crowe et al., 2016, Zhang et al., 2016, Wai et al., 2018). However, the description of alternative modes of interaction (Konuma et al., 2017) and considerations that previous structural studies have probed only partial interaction interfaces suggest the possibility of plasticity in the molecular recognition mechanisms of ET domains of BET proteins. BET protein inhibitors continue to be assessed for their ability to block a range of cancers (Alqahtani et al., 2019). Accordingly, the ET binding pocket of BET proteins is a promising target site for cancer drug discovery.
Here we describe solution NMR structures of the BRD3 ET domain (residues 554 – 640) in the free form, and in three complexes: (i) bound to the MLV IN CTD TP (IN386–407), (ii) bound to the complete MLV IN CTD (IN329–408), and (iii) bound to a peptide fragment of NSD3 (NSD3148–184). This analysis was facilitated by the development of a cost-effective strategy for preparing isotopically-enriched peptides. Combining isotope-enriched TP with isotope-enriched ET provided more extensive NMR data allowing a more complete TP:ET complex structural characterization than has been previously available. The complex involves formation of an interfacial three-stranded β-sheet, stabilized by interactions with IN residues 400KIRL403, and a hydrophobic interface which includes key IN residue Trp390. Next, the structure of the larger ~21 kDa complex of MLV IN CTD with BRD3 ET domain was determined, allowing us to characterize structure-function relationships within the IN CTD, which we classify into three regions: the SH3 domain (residues 329–378), which does not interact with ET, the C-terminal ET-binding motif (ETBM, residues 389–405), which folds into a β-hairpin to form a three-stranded β-sheet with ET, and an intervening partially-flexible linker region (residues 379–388) that tethers IN to ET. 15N relaxation studies confirm that the SH3 domain and the ETBM/ET regions of the IN CTD : ET complex are dynamic with respect to each other, but with partially-restricted interdomain flexibility. Finally, the 3D structure of the complex of NSD3148–184 with ET was determined, revealing a similar three-stranded β-sheet intermolecular interaction between this ETBM and ET, stabilized by a similar hydrophobic interface and set of complementary electrostatic interactions. However, in this complex the orientation of the β-hairpin in this three-stranded β-sheet is flipped compared to the corresponding IN TP : ET complex. These structures establish a framework for the development of inhibitors that can be used for altering retroviral target site selection and disruption of protein-protein interactions, potentially leading to improved cancer therapies.
Results
Several prior solution NMR structures of complexes formed between ET domains of BET proteins and short peptide motifs of binding partners have described a two-stranded β-sheet interaction (Konuma et al., 2017, Zhang et al., 2016, Crowe et al., 2016, Wai et al., 2018). In this study, we examine larger viral and host ET binding regions to define their interactions with ET domain, including determinants of hydrophobic and electrostatic interactions. Specifically, we report the NMR solution structure of the BRD3 ET domain alone and in complex with longer polypeptides including the 22-residue MLV IN TP, the 79-residue MLV IN CTD, and 37-residue ET-binding region of the host NSD3 protein (Figure 1). The results and methods described in this study will be broadly applicable in deciphering the role of the ET domain in modulating interaction of different protein complexes with chromatin.
Fig. 1. Domain and motif constructs used in this study.
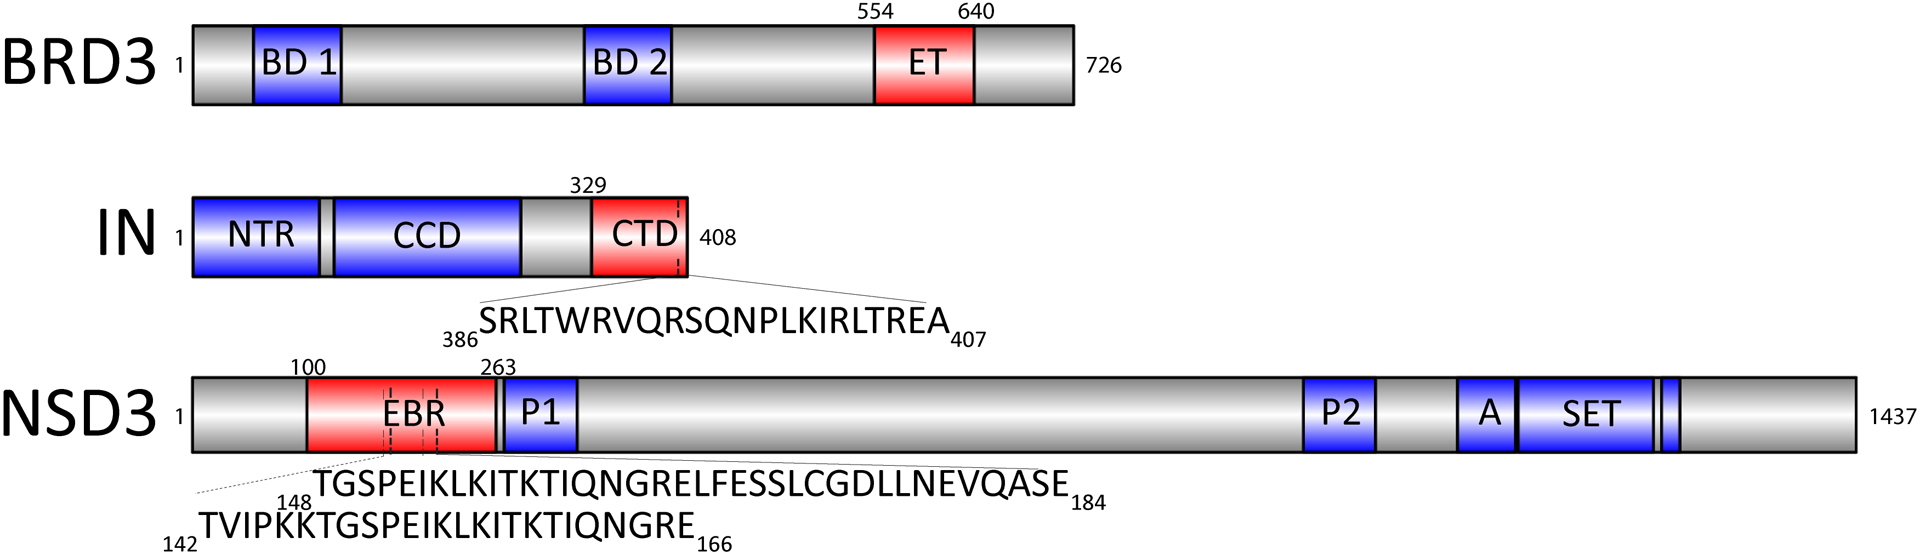
The full-length proteins are indicated, with the domains utilized in this study highlighted in red and well-annotated domains indicated in blue. BRD31–726 consists of two bromodomains (BD1 and BD2) and the extra terminal (ET) domain. MLV IN1–408 consists of the N-terminal region (NTR), catalytic core domain (CCD) and the C-terminal domain (CTD). The sequence of the 22-residue tail peptide (TP) is shown. NSD3 consists of the ET binding region (EBR), two PWWP domains (P), an AWS domain (A), a SET domain, and a post-SET domain.
Solution NMR structure of BRD3 ET.
Rotational correlation time estimates from 1D 15N T1 and T2 measurements indicate that the BRD3 ET554–640 domain is a monomer in solution (τc = 7.0 ns; ~ 11.2 kDa), which was confirmed using size-exclusion chromatography (data not shown). Extensive backbone and sidechain resonance assignments were determined using standard triple-resonance NMR methods (Figure 1 and Supplementary S1). An annotated [15N-1H]-HSQC spectrum is shown in Supplementary Figure S1. The solution NMR structure was determined from 1437 total experimental restraints correspond to 16.3 restraints per restrained residue. The resulting structure models have no significant experimental restraint violations and excellent structure quality assessment scores (Table 1 and Supplementary Table S1).
Table 1:
Summary of structural statisticsa
| Brd3 ET | IN TP - Brd3 ET | IN CTD - Brd3 ET | NSD3(148–184) - Brd3 ET | |
|---|---|---|---|---|
| Conformationallv-restrictina restraintsb | ||||
| NOE based distance restraints | 1277 | 1533 | 1996 | 1609 |
| Dihedral angle restraints | 122 | 166 | 212 | 138 |
| Hydrogen bond restraints | 38 | 22 | 56 | 52 |
| Total no. of conformationally-restraining restraints | 1437 | 1721 | 2264 | 1799 |
| No. of restraints per residue | 16.3 | 16.0 | 15.3 | 14.3 |
| Residual restraint violation statisticsb | ||||
| Average no. of distance violations per structurec | ||||
| 0.1–0.2 Å | 22.35 | 6.7 | 1.2 | 13.25 |
| 0.2–0.5 Å | 12.95 | 1.6 (0.45 Å)c | 0 | 5.1 |
| > 0.5 Å | 0.45 (0.7 Å) | 0 (0.35 Å) | 0 (0.14 Å) | 0.1 (0.57 Å) |
| Average no. of dihedral angle violations per structurec | ||||
| 1–10° | 9.9 | 8.25 | 10.15 | 4.8 |
| >10° | 0 (8°) | 0 (7°) | 0.35 (11.9°) | 0 (5.8°) |
| Model quality statisticsb | IN SH3/ETBM - ET | |||
| RMSD backbone atoms | 0.5 Å | 0.6 Å | 0.5 Å / 1.1 Å | 0.6 Å |
| RMSD heavy atoms | 1.0 Å | 1.1 Å | 0.8 Å / 1.6 Å | 1.1 Å |
| Global quality scores (Raw/Z-score)b | ||||
| Procheck (phi-psi)d | 0.03 / 0.43 | −0.03 / 0.20 | −0.43 / −1.38 | −0.24 / −0.63 |
| Procheck (all)d | −0.24 / − 1.42 | −0.12 / −0.71 | −0.56 / −3.31 | −0.24 / −1.42 |
| MolProbity clash score | 9.4/−0.09 | 6.07 / 0.48 | 7.21 / 0.29 | 5.76 / 0.54 |
| RPF scorese | ||||
| Recall/precision | 0.91 / 0.88 | 0.89 / 0.78 | 0.92 / 0.94 | 0.97 / 0.80 |
| F-measure/DP-score | 0.89 / 0.78 | 0.84 / 0.71 | 0.93 / 0.76 | 0.89 / 0.89 |
Structural statistics computed for the ensemble of 20 deposited structures.
Calculated using PSVS 1.5 (Bhattacharya et a l., 2007). Average distance violations were calculated using the sum over r−6.
Largest violation is show in parenthesis.
Based on ordered residue ranges [S(phi) + S(psi) > 1.8].
RPF-DP scores reflecting the goodness-of-fit of the final ensemble of structures (including disordered residues) to the NOESY data and resonance assignments (Huang et al., 2012).
The solution NMR structure of BRD3 ET is illustrated in Figure 2, along with its protein sequence and secondary structure. BRD3 ET belongs to the BET pfam domain fold family (El-Gebali et al., 2019), and is conserved amongst other BET proteins including BRD2, BRD3 and BRDT. Overall, this domain is rich in acidic amino acids resulting in a predicted isoelectric point of 4.9. The BRD3 ET structure includes a long unstructured N-terminal region of about 15 amino-acid residues (G554-G569) plus a 9 amino-acid residue hexahistidine purification tag (Figure 2A). The superimposed ensemble of 20-lowest energy structures is shown in panels B and C as line and ribbon diagrams, respectively. The BRD3 ET domain consists of three α-helices: α1, residues 574–586; α2, residues 590–602; and α3, residues 624–637 (Figure 2 A–C). The intervening region between α1 and α2 is separated by a kink induced by proline 588, while the α2 and α3 helices are separated by a long loop. This α2 / α3 loop, between helices 2 and 3, is composed of a motif of alternating negatively charged and hydrophobic residues for a stretch of 8 amino acids (612DEIEIDFE619) (Figure 2D). Surface representation of the hydrophobic residues and electrostatic surface potential reveal the presence of a hydrophobic pocket that is lined on one face by acidic side chains (Figure 2D, E).
Fig. 2. Solution NMR structure of BRD3 ET.
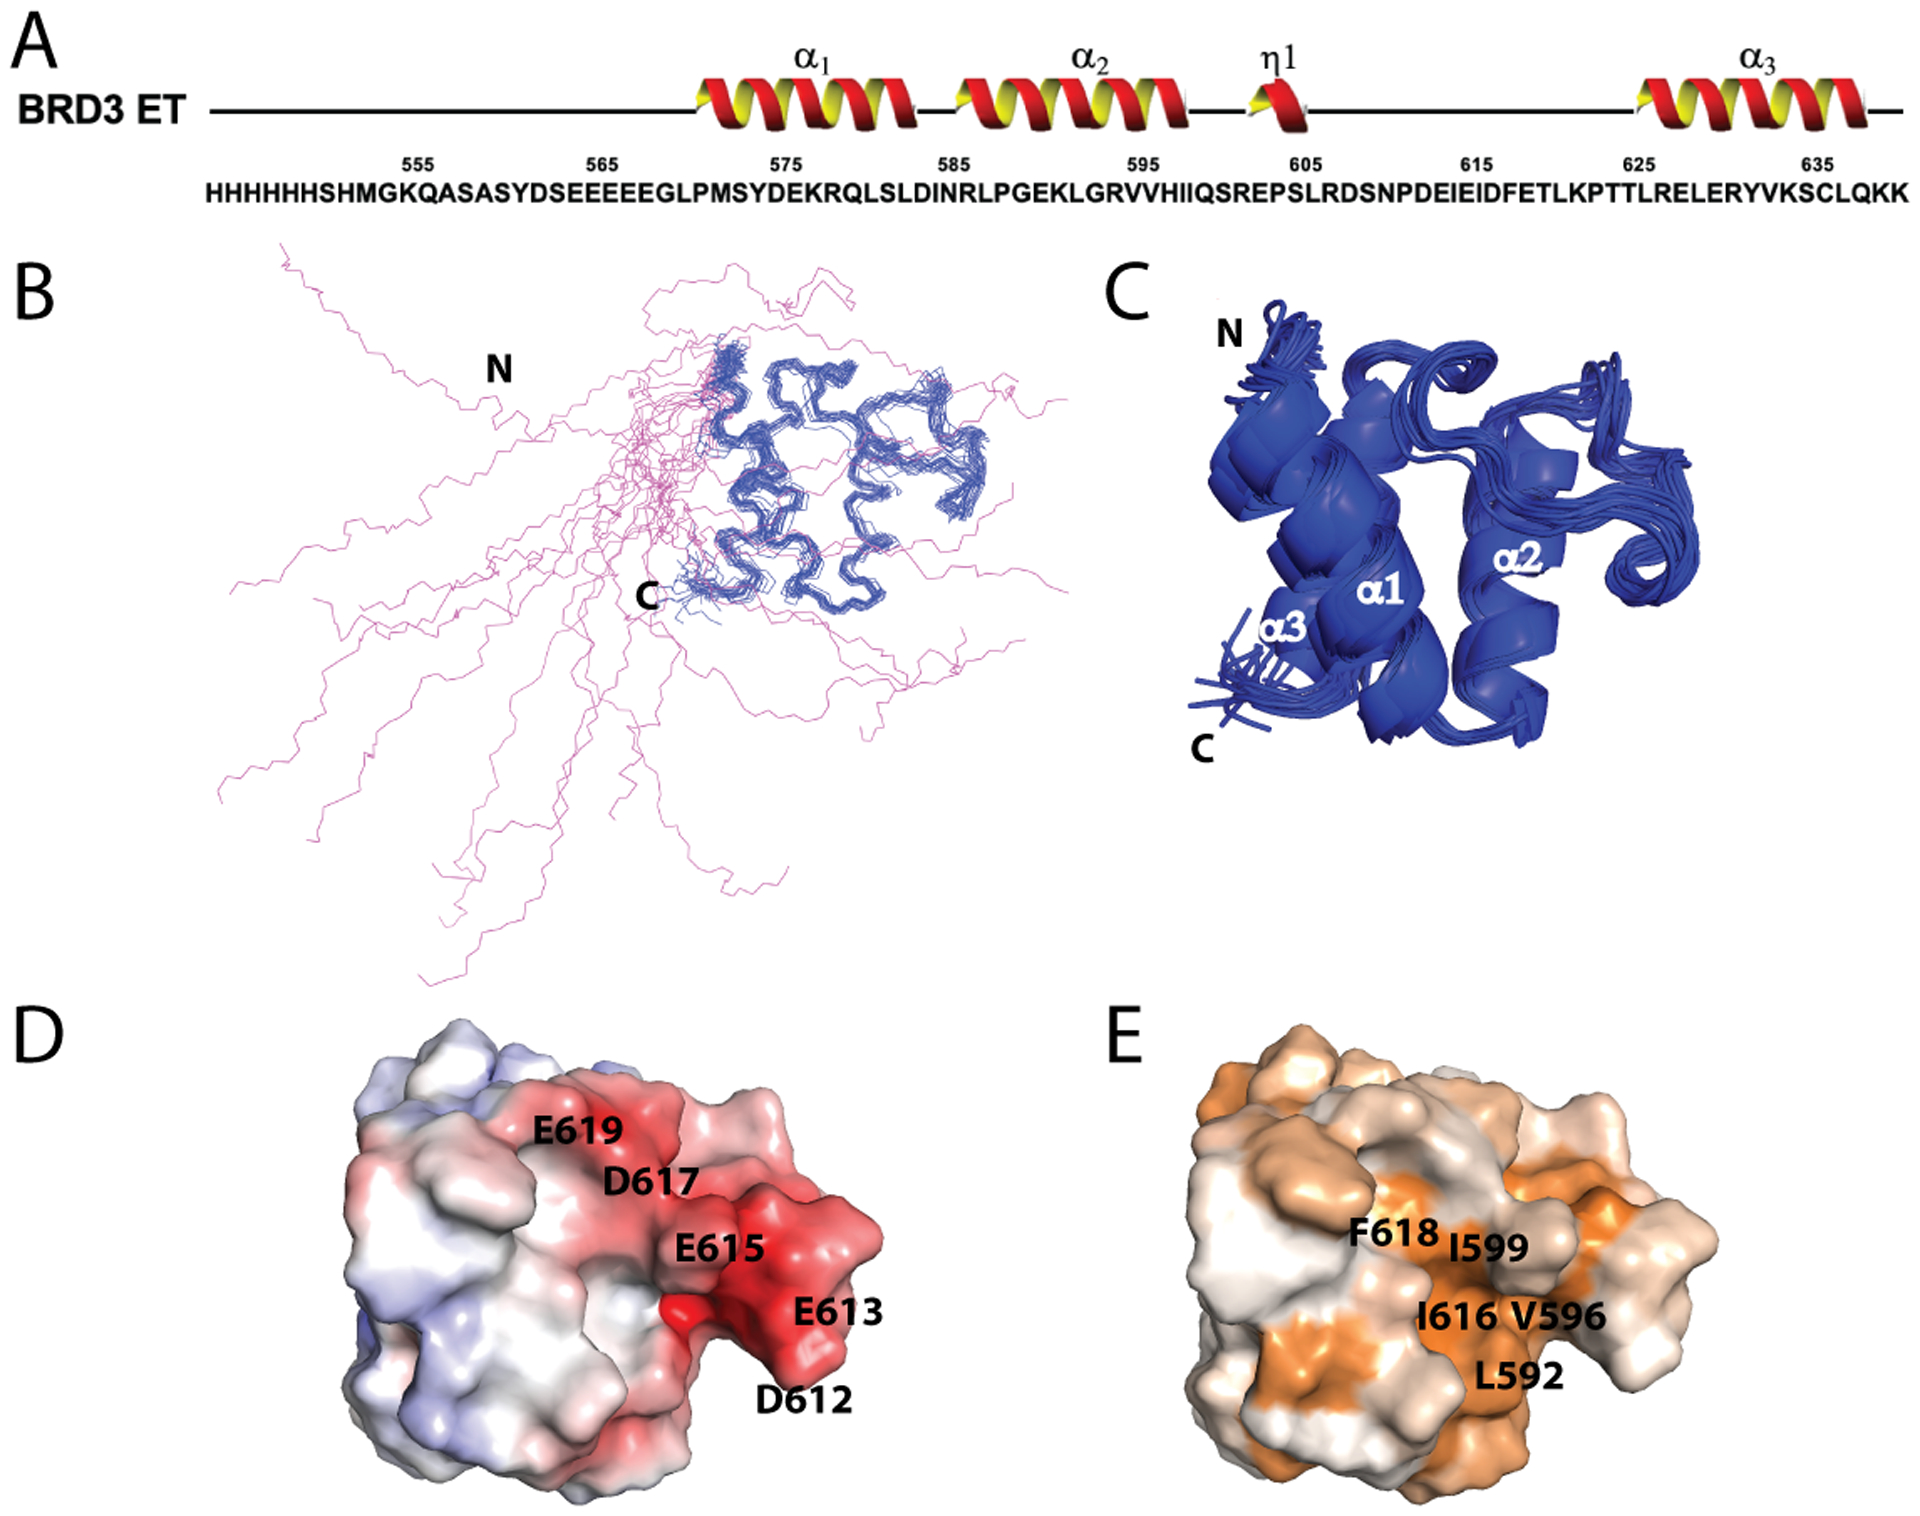
(A) Primary sequence of the BRD3 ET construct, including the His6 tag. Numbering starts with the BRD3 G554. (B) Representation of the backbone structure of the entire BRD3 ET domain (residues 554–640), including the N-terminal His6 tag. Disordered region including the N-terminal His6 tag is represented in magenta. Further analysis was performed with respect to only the ordered region (blue). (C) Ribbon representation of the ordered region of BRD3 ET domain (569–640). The 3 α-helices are α1: 574–586, α2: 590–602, and α3: 624–637. The ordered region of the protein includes residues 569–640. (D) Surface electrostatic representation of the ordered region of BRD3 ET. Fully saturated red and blue colors represent, respectively, negative and positive potentials of ± 5 kT at an ionic strength of 0.15 M at 298 K. Key negatively charged residues and residues forming the acidic cluster (D612-E619) are marked. (E) Surface representation of hydrophobic residues of BRD3 ET reveals the presence of a hydrophobic pocket. Hydrophobicity ranges from brown to white as least hydrophobic residues based on hydrophobicity scale (Eisenberg et al., 1984).
Rapid structure determination of the MLV IN CTD TP : BRD3 ET domain complex using 15N, 13C labeled purified peptides.
We have previously shown that the MLV IN CTD includes an SH3 fold, together with a long and unstructured TP region comprising of 28 amino acids (Aiyer et al., 2015, Aiyer et al., 2014). Using a 23 amino-acid residue synthetic TP polypeptide, we were able to show the competitive disruption of the BRD3 ET and MLV IN CTD interaction (Aiyer et al., 2014). In order to obtain the solution NMR structure of this IN TP bound to the ET, an intein-based self-cleavage system for production of the 15N/13C-enriched TP was developed (Supplementary Figure S2).
In the unbound state, the labeled TP alone showed an [15N-1H]-HSQC spectrum similar to that of a highly disordered protein (Supplementary Figure S1 B). On addition of unlabeled BRD3 ET domain, there is a marked difference in the [15N-1H]-HSQC spectrum, indicating disorder-to-order transition (Supplementary Figure S1 C). Using isotope-enriched TP with both isotope-enriched and unenriched samples of ET, the structure of the 14.0 kDa complex formed between the MLV IN CTD TP and BRD3 ET was determined from 1721 total experimental restraints, corresponding to 16.2 restraints per restrained residue. The resulting structure models have no significant experimental restraint violations, and excellent structure quality assessment scores (Table 1 and Supplementary Table S1).
The amino acid sequence, secondary structure, and NMR structure of the BRD3 ET in complex with the MLV IN TP are shown in Figure 3. In this complex, the MLV IN TP adopts an anti-parallel β sheet separated by a turn, which is in part mediated by the conserved Pro398 (Figure 3B and Supplementary Figure S3). Key intermolecular interactions are summarized in Supplementary Table S2. The hydrophobic cleft of the BRD3 ET accommodates the hydrophobic residues of the MLV IN TP (Figure 3 C,D). Complementary to the BRD3 ET domain, one of the β strands in TP also possesses alternating charged residues 399LKIRL403 that interleave with acidic residues 613EIEID617 of BRD3 ET to stabilize the three-stranded β-sheet interaction (Figure 3, E–G). This interaction is mediated by complementary charged surfaces along with backbone contacts and hydrophobic interactions of the alternate residues consisting of Leu or Ile. Residues Trp390 and Val392 of β6’ also show additional hydrophobic interactions sealing the pocket at the bottom of the binding interface. This interaction with Trp390 could be important due to its conservation across the retroviruses shown in Supplementary Figure S3.
Fig. 3. Interaction of MLV IN TP with BRD3 ET.
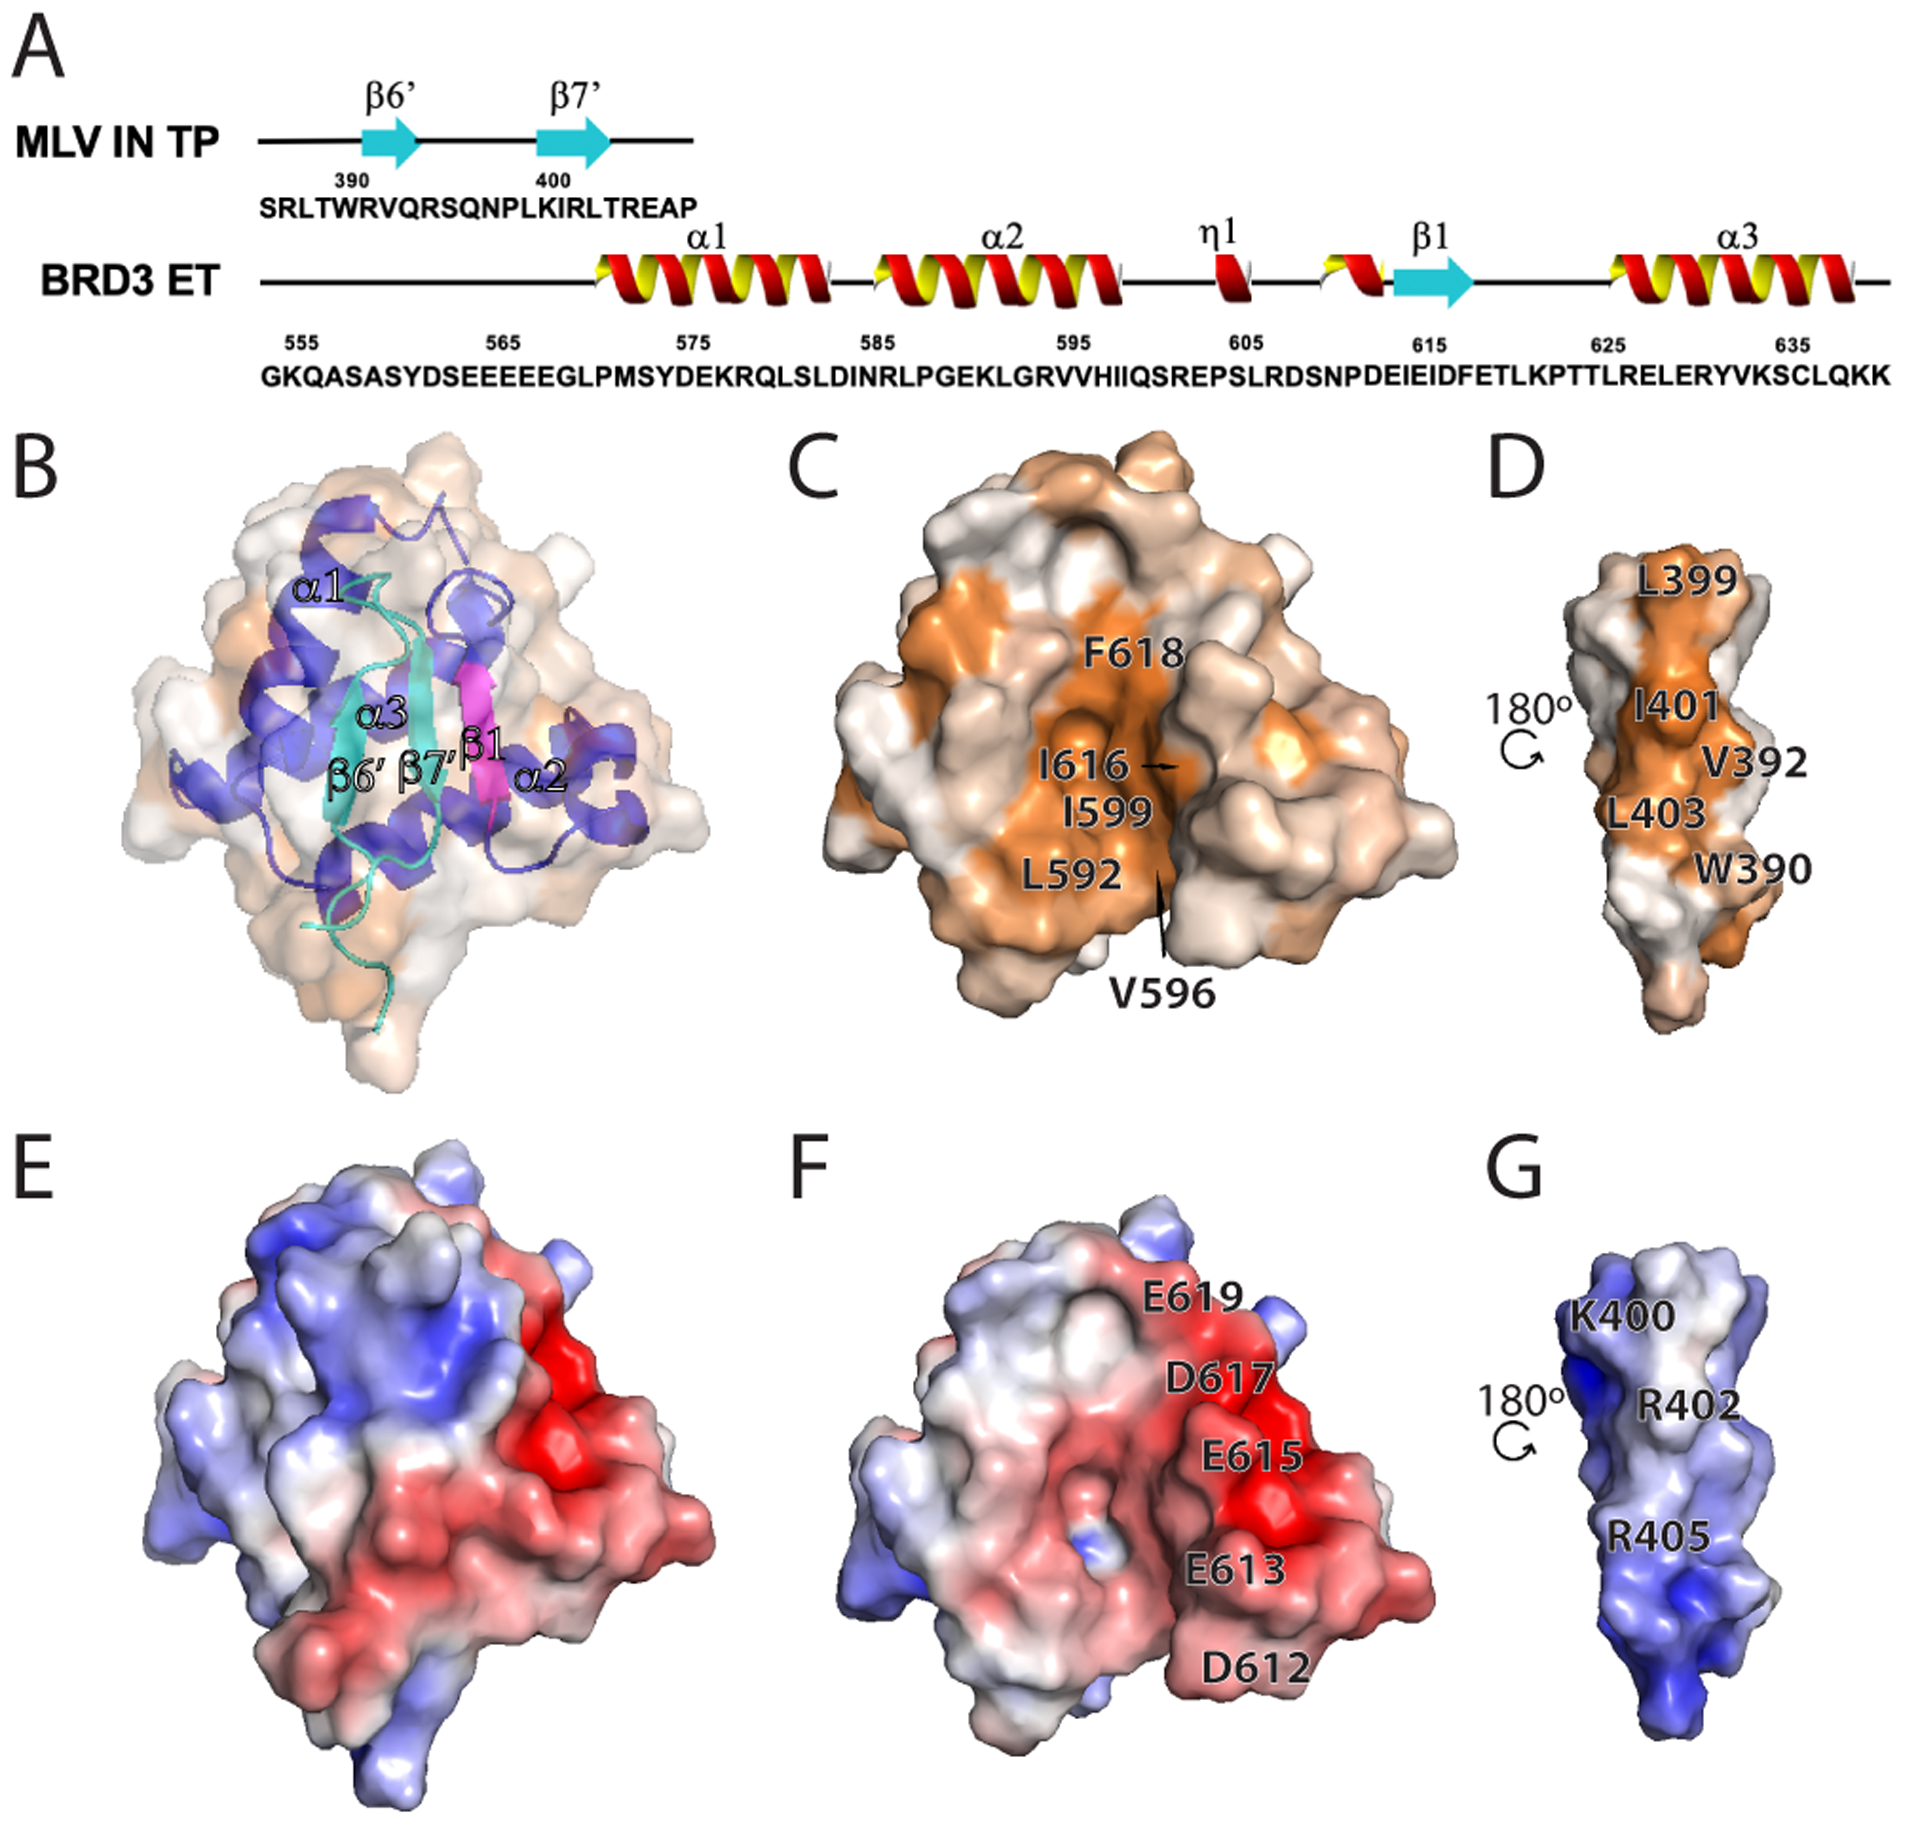
(A) Schematic of the primary sequence of the MLV IN TP and BRD3 ET regions utilized in the studies, together with the NMR defined secondary structural elements. The N-terminal BRD3 ET His6 tag is not shown. (B-D) Surface hydrophobic representations of the complex with (B) and (C) oriented in the same plane and (D) rotated along the y axis by 180°. (B) is set at 50% transparency and also shows a ribbon representation of the complex with blue/magenta showing BRD3 ET and cyan showing the MLV IN TP. The surface hydrophobicity coloring scheme is the same as in Figure 2E. (C) is the buried face of the BRD3 ET and (D) the buried face of the MLV IN TP. Key residues forming the hydrophobic pocket are indicated. (E-G) Surface electrostatic representation (coloring scheme same as Figure 2D) with (E) BRD3 ET and IN TP complex, (F) BRD3 ET and (G) MLV IN TP having identical viewing planes as in (B-D). Key residues forming intermolecular electrostatic interactions are indicated.
Interestingly, superposition of [15N-1H]-HSQC spectra of the bound and unbound BRD3 ET domain shows minor chemical shift perturbations (CSPs) throughout the entire ET domain (Supplementary Figure S4 A, C, D). While the N-terminal disordered segment (residues 554–571) exhibits little or no change upon complex formation, amide 15N-1H resonances throughout most of the rest of the domain exhibit significant CSPs (Δδ N,H > 0.05 ppm, Supplementary Figure S4 C, D). These CSP data indicate global, subtle, allosteric changes throughout the ET structure upon complex formation.
Interaction of the MLV IN CTD and BRD3 ET domain is restricted to the TP region.
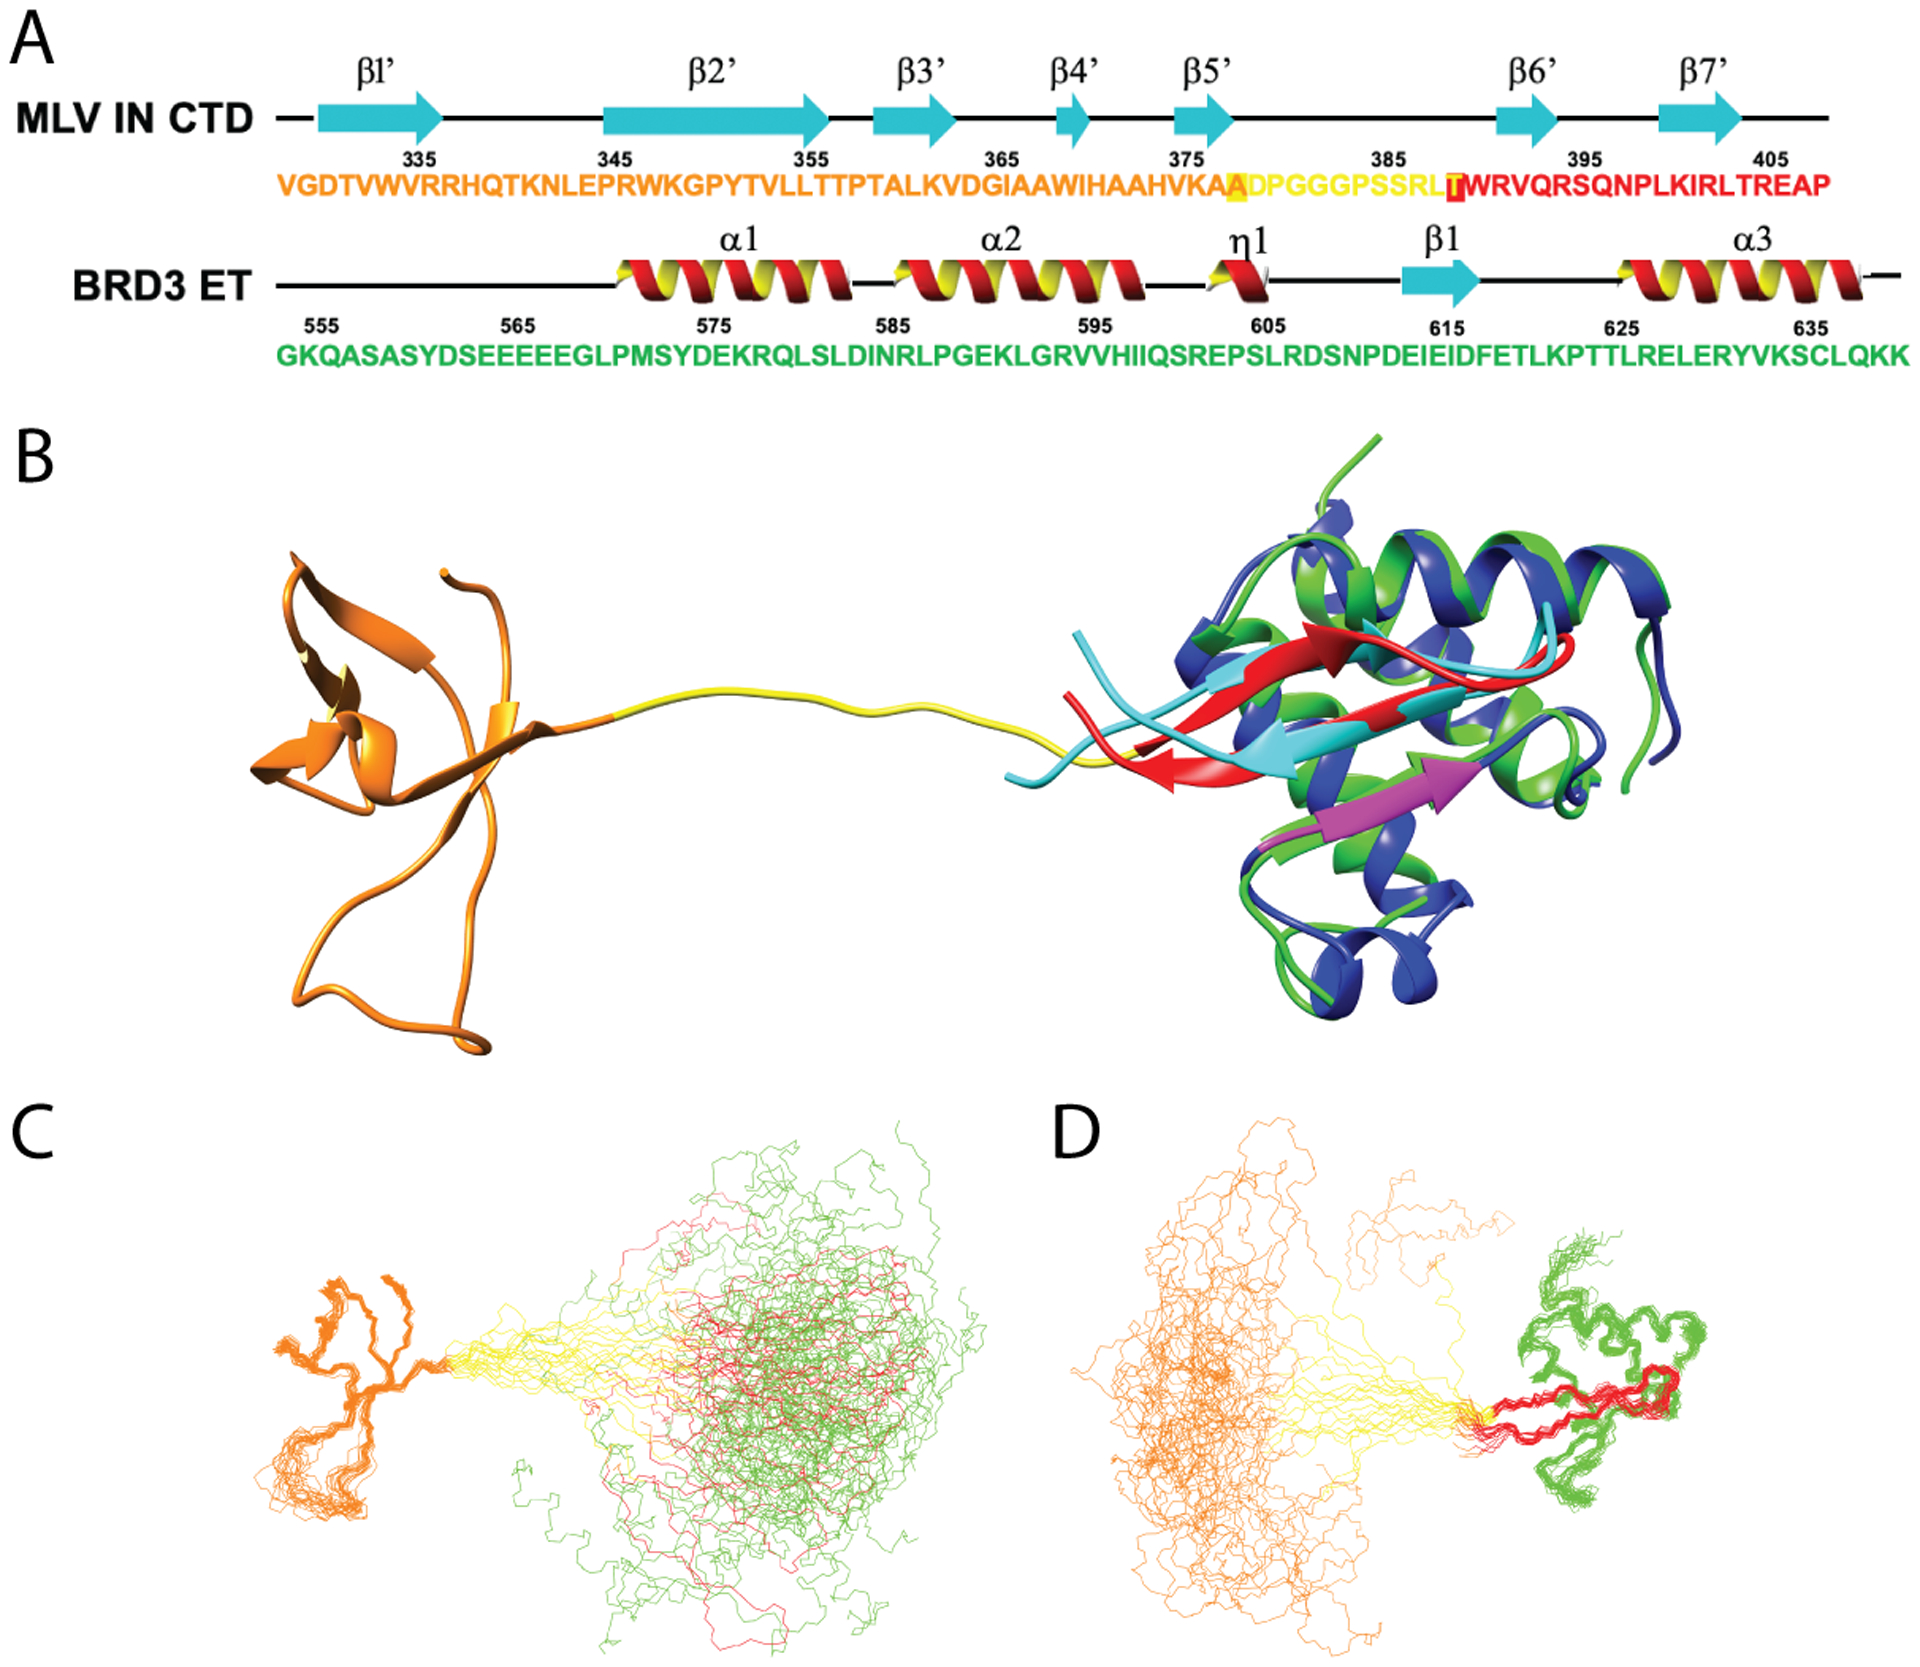
In order to determine whether other regions of the CTD SH3 fold are involved in interacting with the ET domain, we next determined the 3D structure of the 21.3 kDa heterodimeric structure of the complex formed between the MLV IN CTD and BRD3 ET. The structure was determined from 2264 total experimental restraints, corresponding to 15.3 restraints per restrained residue. Structure quality assessment scores indicate a good quality structure (Table 1 and Supplementary Table S1). In this structure (Figure 4), the SH3 domain and the complex of the ET-binding motif (ETBM) of IN CTD with ET are separated by a 10-residue linker, and the overall structure cannot be superposed due to variability in interdomain orientations. However, the SH3 domain region of IN CTD can be superimposed with rmsd of 0.5 Å for the backbone and 0.8 Å for heavy atoms of well-defined residues, and the complex of the IN CTD ETBM with ET can be superimposed with rmsd of 1.1 Å for the backbone atoms and 1.6 Å for heavy atoms of well-defined residues
Fig. 4. Linker flexibility between SH3 fold and TP of IN CTD in complex with ET.
(A) Schematic of the primary sequence and NMR defined secondary structure of the MLV IN CTD and BRD3 ET regions utilized in these studies. The SH3 fold is shown in orange, the linker between SH3 fold and TP in yellow, the structured region of the ETBM in red, and the ET domain in green. Transition residues between the SH3 / linker and linker / ETBM are boxed (see Fig. 5D). (B) Ribbon representation of the full CTD-ET complex with color scheme described in A. The ET-peptide structure (blue / magenta / cyan) is overlaid onto the full complex. (C) Backbone representation of the NMR ensemble for the complex, superimposed on the CTD SH3 fold region. (D) Backbone representation of the NMR ensemble for the complex, superimposed on the ETBM : ET domain. Coloring scheme in panels C and D is the same as in panel B. Non-native tags and the disordered ET region (residues 554–568) are not shown for clarity.
The NMR structure of the IN CTD : BRD3 ET complex is illustrated in Figure 4, along with the corresponding protein sequences and secondary structures. The overlay of the TP : BRD3 ET structure (ET, blue and magenta; TP, cyan) on the IN CTD : BRD3 ET structure (ET, green; TP, red) shows excellent superimposition of the IN ETBM regions and ET domains of these two structures (Figure 4B). No changes were observed within SH3 fold compared to the NMR structure of the IN CTD free form in the absence of the ET domain. There are no detectable NOEs between the SH3 domain and the ETBM : ET parts of the complex. Most importantly, the chemical shifts of SH3 in the complex are identical to those of SH3 in free CTD, and the chemical shifts of ET are the same in the TP : ET complex as in the CTD : ET complex (Supplementary Figure S5). These experimental data indicate that the ETBM region of IN alone mediates the interaction between the CTD and BRD3 ET.
In this structure, the orientations of MLV IN SH3 domain and ETBM : ET domain regions of the complex are not well defined with respect to each other. In forming this complex, an approximately 10 residue linker region (D379-L388) is formed between the SH3 fold and the ETBM regions of MLV IN CTD. Flexibility of this linker region can help in facilitating the strand transfer activity of IN in the nucleus. Disorder prediction analysis (Huang et al., 2014) indicates that this “linker” region has high propensity to be disordered, relative to the rest of the protein (data not shown). In aligning the backbone atoms of the 20 lowest energy conformers of SH3 fold region (Figure 4C), the ETBM : ET domain orientations are highly variable. Conversely, in aligning the ETBM : ET complex, the relative positions of the SH3 fold are highly variable (Figure 4D). In these structures, the SH3 fold remains independent of the ET domain of the BRD3 protein, separated by the 10 residue linker region. The linker region thus acts as an “tether” between the two domains (Figure 4B, C, D, yellow region).
Analysis of flexibility / rigidity of the linker region between the IN CTD and TP.
Sequence alignment of a panel of gammaretroviruses as well as viral revertants with deletions in this regions (Loyola et al., 2019) indicates that the linker region is not highly conserved (Supplemental Figure S3). To further analyze the dynamics of the linker region, we acquired and analyzed 15N nuclear relaxation and 1H-15N heteronuclear NOE data for the IN CTD : ET complex, which were used to assess variations in internal dynamic motions across the complex and to estimate the rotational correlation times (τc) of the SH3 domain and the ETBM : ET complex of the IN CTD : ET complex (Figure 5). The horizontal bars shown in Fig. 5B are the τc values estimated for these individual domains at 25 °C based on their molecular weights (Rossi et al., 2010); i.e. 4.1 ns for the SH3 domain and 8.4 ns for ETBM : ET complex. These τc values are consistent with values estimated at 25 °C for the SH3 in the larger IN CTD construct (τc = ~ 5 ns) (Aiyer et al., 2014) and for the ET alone (τc = 7.0 ns). Remarkably, the overall rotational correlation times τc for ordered residues of the SH3 domain (orange; τc ~ 12.0 ns) and ETBM:ET complex (red + green; τc ~ 13.0 ns) components of the IN CTD : ET complex are about the same, and much longer than values measured for these individual domains. In particular, the τc values for the SH3 domain in the complex (~ 12 ns) are much higher than expected if the two domains moved independently (4 – 5 ns). Rather, both the SH3 and ETBM:ET regions of the IN CTD : ET complex have rotational correlation times τc approaching the theoretical value of ~ 13.3 ns expected for a rigidly tumbling globular complex of 21 kDa at 25 °C (Aiyer et al., 2014). Overall, these results indicate an unexpected strong coupling of the tumbling rates of the two domains in the complex, despite the fact that there are no direct interactions between the domains. These 15N T1 and T2 relaxation rates and [1H-15N] heteronuclear NOE measurements (Figure 5) also indicate that the linker itself has limited flexibility. While the average τc value for ordered residues in the IN CTD : ET complex is 12.3 ± 1.5 ns, the linker region has an average τc of 7.8 ± 1.2 ns. Similarly, the average HetNOE value for ordered residues of CTD : ET complex is 0.74 ± 0.05, while the average HetNOE value in the linker region is 0.26 ± 0.02. These nuclear relaxation measurements are consistent with some degree of stiffness in the “flexible” linker region between the SH3 and ETBM : ET domains of the complex.
Fig. 5. Analysis of chemical shift perturbations and 15N-1H heteronuclear NOE data for the MLV IN CTD : BRD3 ET complex.
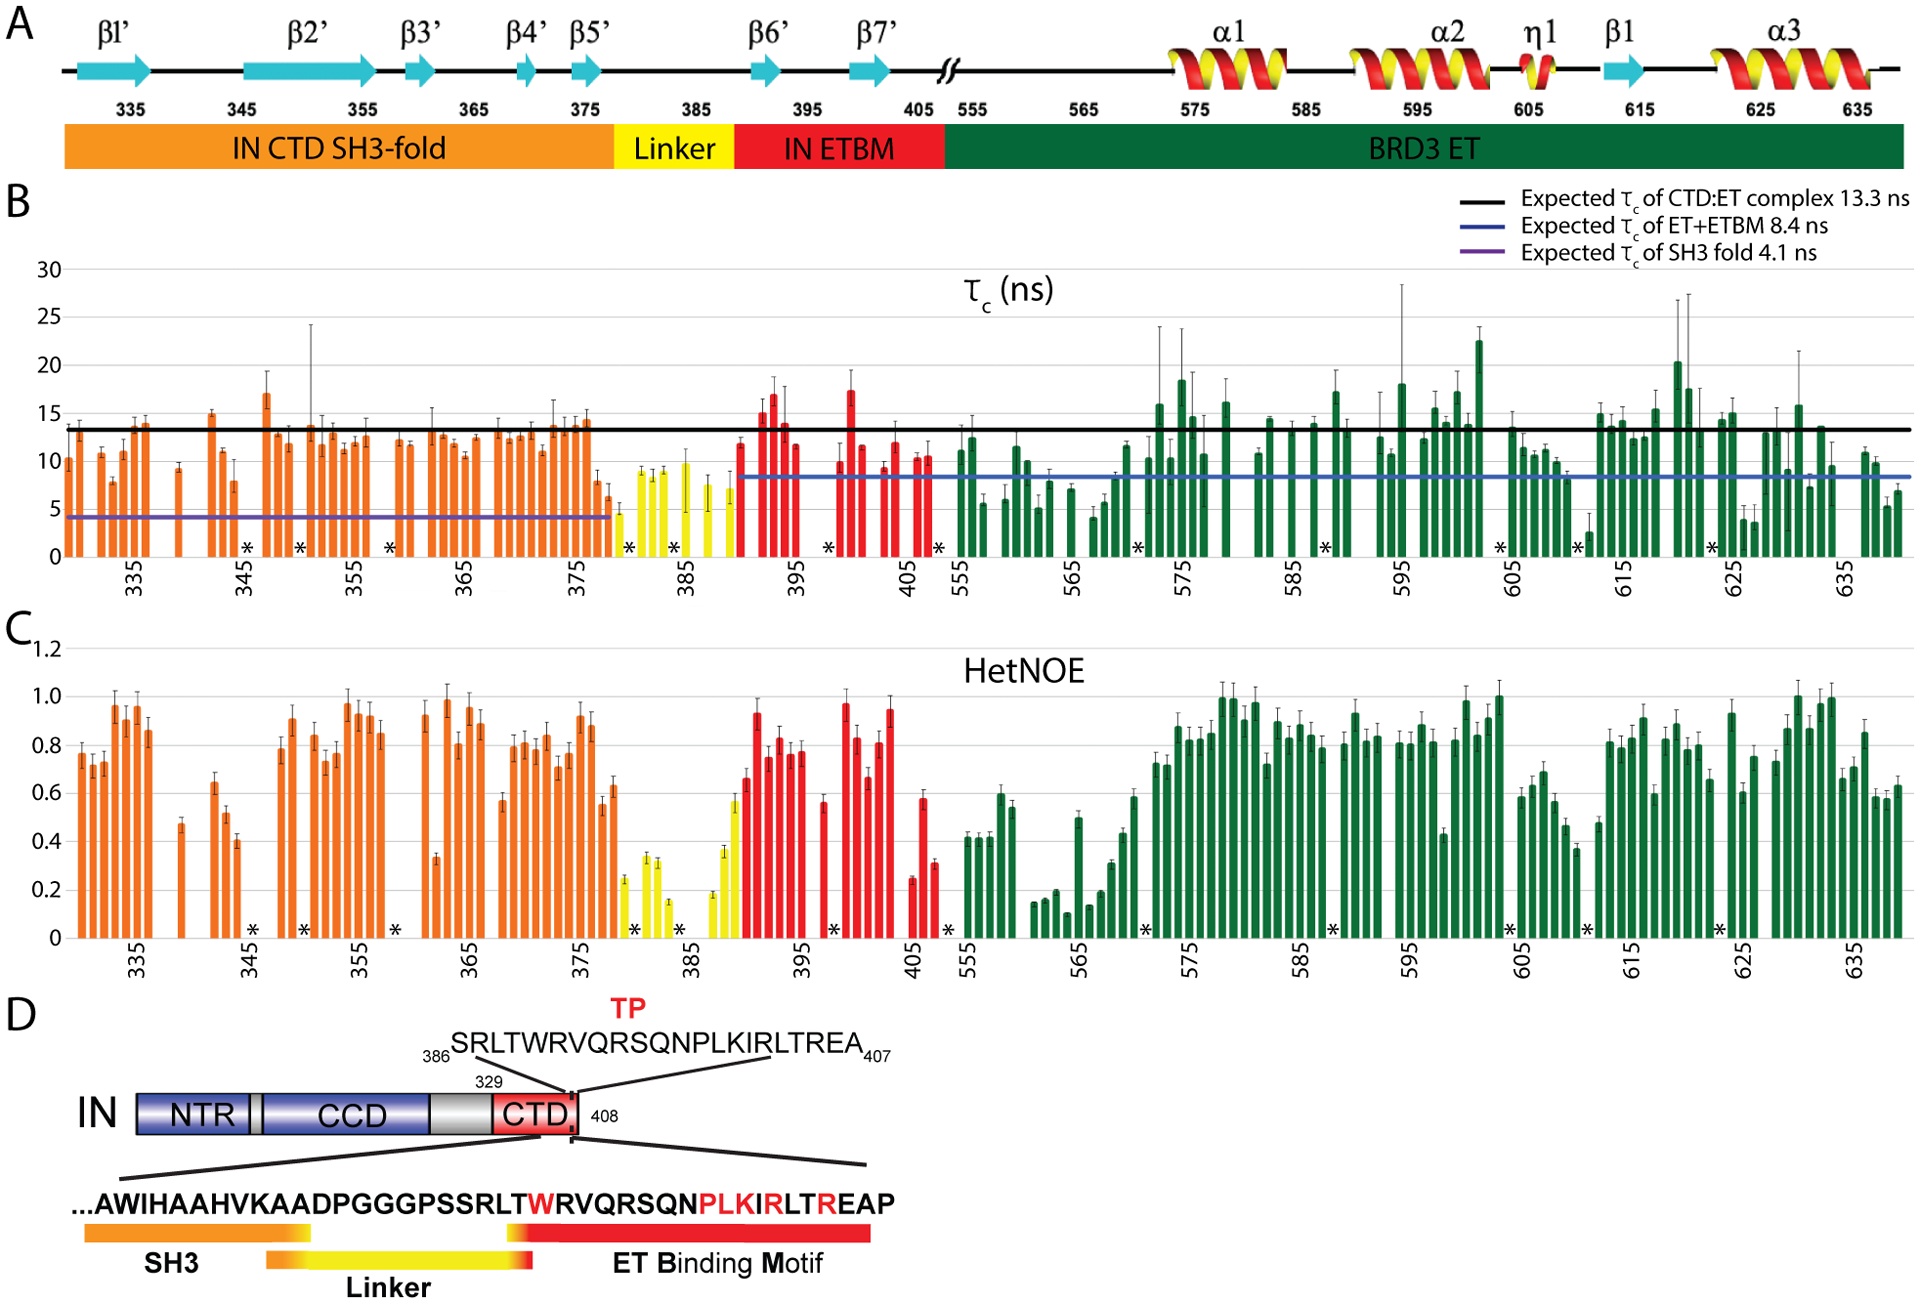
(A) Secondary structure features correlating with the amino-acid residue positions in the X-axis in panel B and C. (//) indicates the junction between the C-terminus of the IN CTD and the N-terminus of the BRD3 ET domain. Numbering corresponds to the individual domains in the corresponding full-length protein sequences. Domain/motif coloring scheme: Orange, MLV IN CTD SH3 fold; Yellow, MLV IN CTD linker region; Red, MLV IN CTD ETBM; Green, BRD3 ET domain. (B) N-H bond rotational correlation time measurements (τc in ns) for each residue across the MLV IN CTD and BRD3 ET complex. Purple horizontal line, overall τc (4.1 ns) expected for freely-mobile SH3 domain (10.1 kDa) at 25 °C. Blue horizontal line, overall τc (8.4 ns) expected for freely-mobile ETBM : BRD3 ET complex (14.2 kDa) at 25 °C; Black horizontal line, overall τc (13.3 ns) expected for rigid MLV IN CTD : ET complex (21 kDa), at 25 °C. Uncertainties of these estimates, determined as described in the STAR methods section, are indicated with error bars. (C) 1H-15N HetNOE signal (Isaturated/Iequilibrium) calculated for each residue across the complex. Uncertainties of these estimates, determined as described in the STAR methods section, are indicated with error bars. (D) Summary of motif boundaries. The sequence of the MLV IN TP used in the NMR structural studies is indicated (top). The SH3 fold (orange) transitions into the linker region at Ala377 and Ala378, which maintain higher HetNOEs compared to their τc values. The ten amino-acid residues within the Linker region are indicated in yellow. Thr389 transitions the Linker into the ETBM (red). Residues labeled with * correspond to Prolines; no values are plotted for residues that were not assigned, with poor signal-to-noise ratios, and/or with poor relaxation curve fits.
Nuclear relaxation measurements also provide data to define the boundaries of the linker region in the IN CTD : ET complex (Figure 5D). The SH3 fold transitions into the linker region starting at residues Ala377/Ala378, with both residues maintaining higher HetNOEs but lower τc values. Interestingly, in PERV-A, GaLV and KoRV-A INs, residue Ala377 is replaced with Pro, supporting this transition to linker after Lys376 (Supplementary Figure S3). Similarly, the linker region transitions to the ETBM at residue Thr389, with the ETBM starting with the highly conserved Trp390. Overall, these studies identify two functionally-distinct intrinsically-disordered regions of the IN protein. The first intrinsically-disordered region serves as a partially flexible linker that separates the catalytic and assembly functions of the viral protein : DNA integration intasome from the second intrinsically-disordered region that undergoes disorder to order transitions upon binding to the cognate host protein (ETBM).
Key hydrophobic residues in NSD3 are important for stable interaction with BRD3 ET.
To extend our interest in defining ET binding domains in the context of full-length or protein subdomains, three constructs of the host NSD3 protein were also generated and analyzed (Figure 1). Initial analysis compared the entire NSD3100–263 ETBM with the peptide NSD3142–166, which encompasses a previously published minimal ET binding peptide NSD3152–163 (Zhang et al., 2016). We observed dramatically different CSPs on BRD3 ET upon binding NSD3142–166 compared to the complex with the longer NSD3100–263 (data not shown), suggesting that there are additional uncharacterized interactions in the longer construct. This prompted us to redefine the boundary of the ET interacting region of NSD3 to include hydrophobic residues Leu167, Phe168, Leu172, Leu176 and Leu177, which are analogous to key hydrophobic residues of IN observed in our solution NMR structure of the IN-CTD : ET complex. The redefined peptide motif NSD3148–184 showed a CSP profile on ET (Supplementary Figure S4 B, E, F) similar to that observed for NSD3100–263, IN CTD, and IN TP. Significantly, similar CSPs throughout ET, attributed to subtle allosteric changes throughout the ET domain structure are observed upon complex formation with IN CTD, IN TP, and NSD3148–184 (Supplementary Figure S4). Hence, similar allosteric changes in ET distant from the peptide binding sites occur in all three of these complexes.
Using the same peptide labelling principle outlined above for IN TP, we designed a SUMO Smt3 fusion with NSD3148–184 (Supplementary Figure S2). As observed for the TP, in the unbound state, the labeled NSD3148–184 alone has an HSQC spectrum similar to that of a highly disordered protein (Supplementary Figure S1D). On addition of unlabeled BRD3 ET domain, the [15N-1H]-HSQC spectrum becomes much better dispersed, indicating disorder-to-order transition (Supplementary Figure S1E). The solution NMR structure of the 15.6 kDa complex of NSD3148–184 BRD3 ET was determined using isotope-enriched NSD3148–184 with both isotope-enriched and unenriched samples of ET, from 1799 total experimental restraints correspond to 14.3 restraints per restrained residue. The resulting structure models satisfy all of these experimental restraints, and have excellent structure quality assessment scores (Table 1 and Supplementary Table S1).
Excitingly, the intermolecular interaction in the NSD3148–184 : ET domain complex, made with a longer NSD3 construct than previously reported, now formed a 3-stranded anti-parallel β sheet (Figure 6 A, B), where the smaller NSD3152–163 construct forms only a 2-strand β sheet (Zhang et al., 2016). A summary of key intermolecular interactions is presented in Supplementary Table S2. Mapping of the hydrophobic and electrostatic surface for the NSD3148–184 : BRD3 ET complex is shown in Figure 6 B–G. Exposing the buried surface (Figure 6C, D), the hydrophobic cleft of BRD3 ET (residues Leu592, Val596, Ile599, Ile616, and Phe618) is observed to interact with NSD3 residues Ile153, Leu155, Ile157 and Phe168. The electrostatic charge distribution in the BRD3 NSD3148–184 : ET complex is shown in Figure 6E, with the components from the individual domains exposed in Figures 6F, G. The alternate acidic residues of the beta-strand formed in BRD3 ET with residues 613EIEID617 (Figure 6F) interleaving with basic residues 153IKLKI157 to form a three-stranded antiparallel beta strand (Figure 6G).
Fig. 6. Interaction of BRD3 ET with NSD3148–184 peptide.
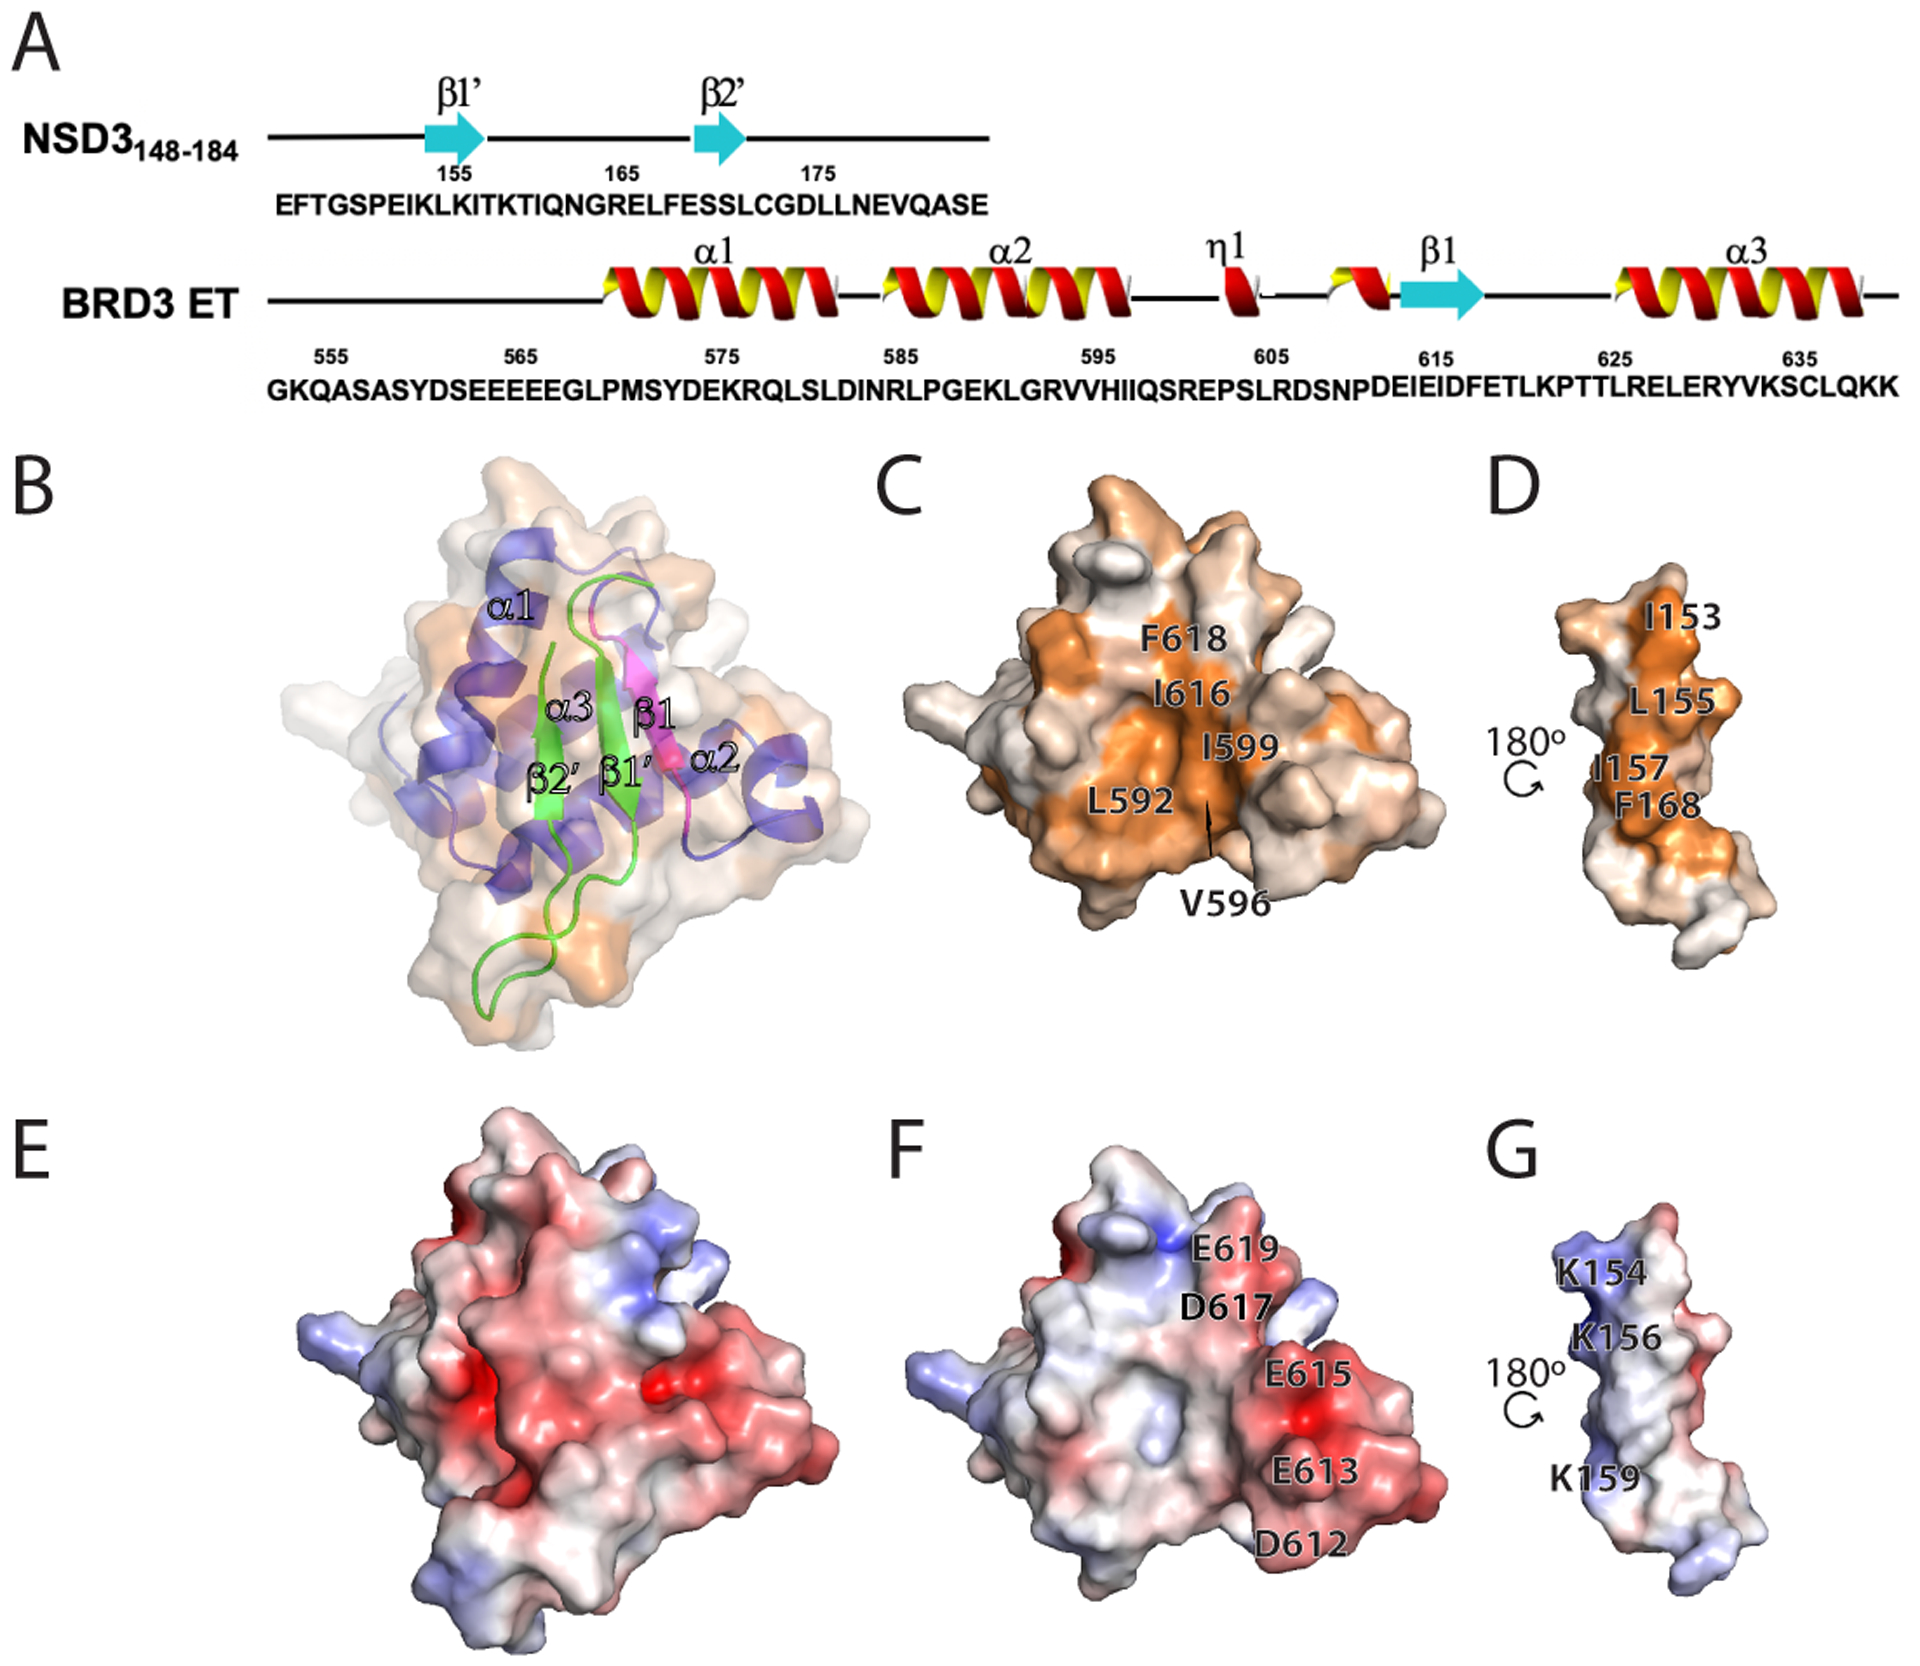
(A) Schematic of the primary sequence with NMR defined secondary structure of the NSD3148–184 and BRD3 ET (N-terminal BRD3 ET His6 tag is not shown) utilized in the studies. (B-D) Surface hydrophobic representations of the complex with (B) and (C) oriented in the same plane and (D) rotated along the y axis by 180°. (B) is set at 50% transparency and also shows a ribbon representation of the complex with blue/magenta showing BRD3 ET and green showing the NSD3148–184. The surface hydrophobicity coloring scheme is the same as in Figure 2E. (C) is the buried surface of the BRD3 ET and (D) is that of the NSD3148–184. Key residues forming the hydrophobic pocket are indicated. (E-G) Surface electrostatic representations (coloring scheme same as Figure 2D) of (E) the BRD3 ET-NSD3148–184 complex, (F) BRD3 ET and (G) NSD3148–184 having identical viewing planes as in (B-D). Key residues forming the electrostatic interactions are indicated.
Alternative binding modes of ET binding motifs.
Insights into key biophysical features of the BRD3 ET binding pocket can be obtained through comparisons of the known structures of ET complexes (Figure 7). Figures 7A and B compare the ribbon diagrams of the MLV IN TP and NSD3148–184, respectively. Both the NSD3148–184 and IN TP : ET complexes involve interactions with the alternating hydrophobic and acidic residues from the ET. However, the register of strands of the NSD3148–184 : ET domain complex is different compared to the IN329–408 : ET complex (Figure 7C). In the case of the MLV IN CTD, the second β-strand in the C-terminal ETBM interacts with the ET domain, while in the case of NSD3 it is the first strand in the ETBM that interacts with the ET domain (Figure 7C). As a result, the orientation of the peptides forming the β-hairpin in the two complexes are flipped with respect to another. Although the loop between helices α2 and α3 in the ET domain forms a favorable binding pocket for facilitating protein-protein interactions, the mechanism of interaction is distinct for different proteins.
Fig. 7. Comparison of peptide : ET complex structures.
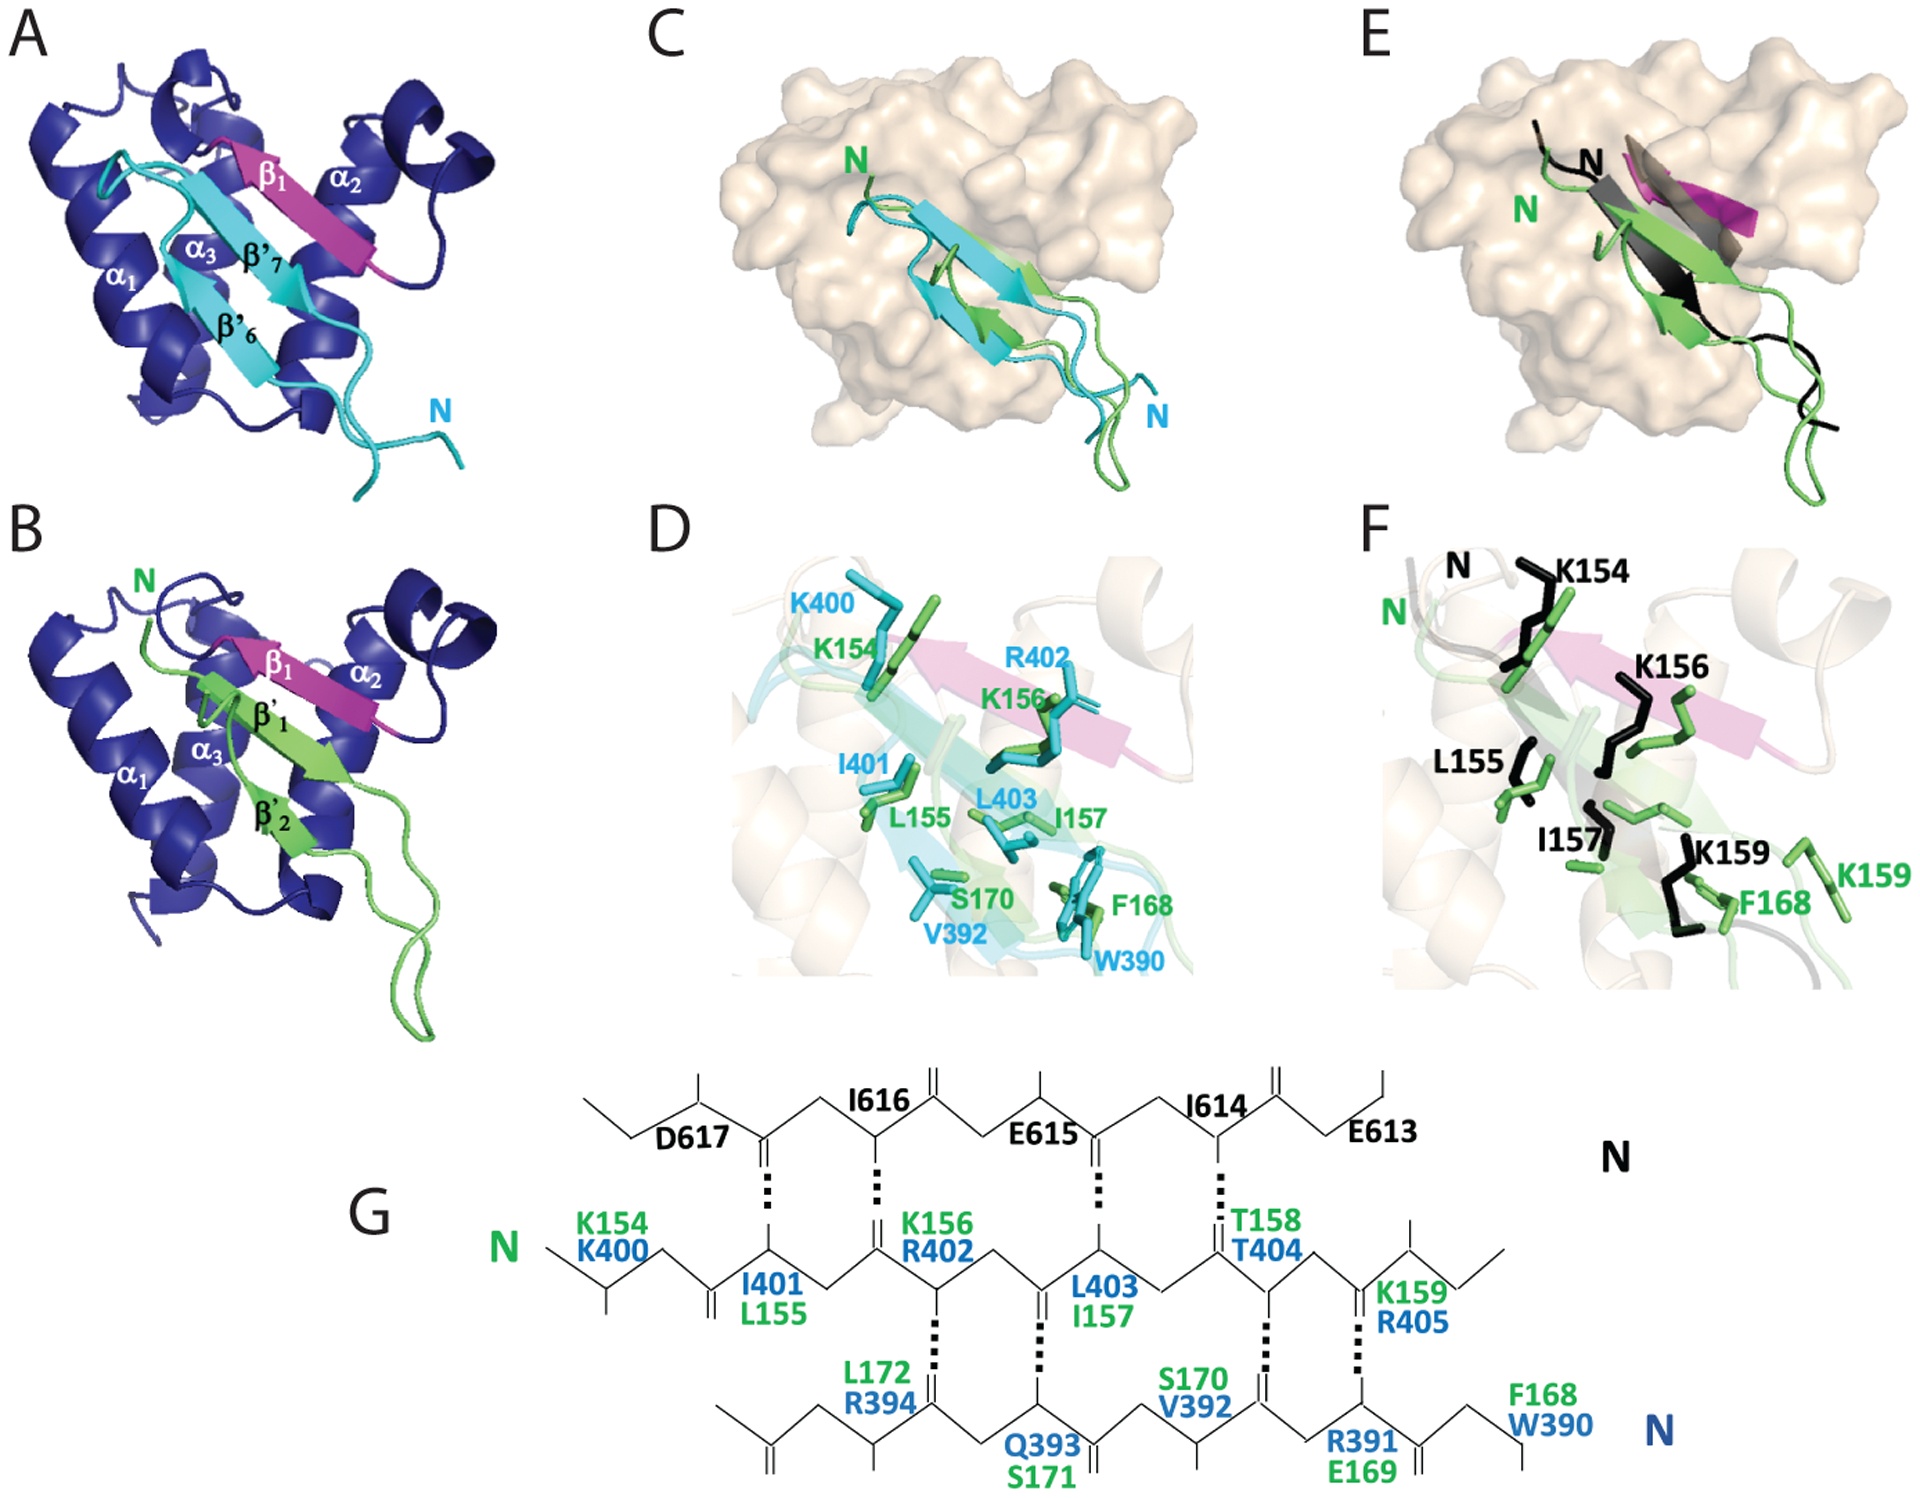
Coloring of ET domain in complex with the MLV IN TP and NSD3 peptide is as described in Figures 3 and 6. (A and B) (A) BRD3 ET (blue)-MLV IN TP (cyan) and (B) BRD3 ET (blue)-NSD3148–184 (green). (C) Space filling model of BRD3 ET (beige) overlayed with TP (cyan) and NSD3148–184 (green). (D) Side-chain orientation of key interacting residues of the TP (cyan) with NSD3148–184 (green). (E) Comparison of the single β strand formed using the short NSD3 peptide 152–163 (PDB: 2NCZ) in black and the alignment with the β strand formed in the ET domain (black), with the two β strands formed in the BRD3 ET NSD3148–184 complex in green and the alignment of the β strand of ET in magenta. (F) Side-chain orientations of key interacting residues of the NSD3152–163 (black) with NSD3148–184 (green). (G) Alignment of key interacting residues of BRD3 ET domain EIEID (black) forming antiparallel β strand with TP (blue) and NSD3148–184 peptide (green).
A superposition of the structures of the complex of BRD3 ET: IN TP and BRD3 ET :NSD3148–184, (Figures 7D and 7G) indicates that aromatic residue Phe168 of NSD3 occupies the position of Trp390 of MLV IN, sealing the hydrophobic pocket at the bottom. Interestingly, residue Phe168 is conserved in all NSD3 isolates (Supplementary Figure S3) as well as between NSD1, NSD2, and NSD3 proteins from humans (Bennett et al., 2017). As can be seen in Figure 7G, the electrostatic as well as the hydrophobic interactions observed for the TP and NSD3148–184 involve analogous residues in the antiparallel β-strand aligned with that formed in the ET domain. The β2’ strand in the latter, however, has the well conserved residue Glu169 that is negatively charged, in contrast to the IN TP which has positively charged residue Arg391 at this position. Interestingly, most gammaretroviruses maintain a positively charged residue at the position; however, both GaLV and KoRV A viruses encode a negatively charged Glu residue at the analogous site, similar to NSD3148–184 (Supplementary Figure S3).
Comparison of the extended NSD3148–184 : ET domain complex that forms the 3-strand anti-parallel β sheet with the smaller NSD3152–163 construct reported to form a 2-strand β sheet. (Zhang et al., 2016) is shown in Figure 7E as a ribbon diagram, with key residues highlight in Figure 7F. For NSD3148–184, residues Lys154, Leu155, Lys156, and Ile157 form a first anti-parallel β-strand similar to Zhang et al. (Zhang et al., 2016). However, the β-hairpin is formed with a short strand formed by Phe168, Glu169, Ser170, and Ser171. In the NSD3152–163 peptide, Lys159 has the side chain buried into the pocket increasing the hydrophobic interactions of the peptide with BRD4 ET. In the present study with NSD3148–184, we find that the aromatic side chain of Phe168 occupies this position and Lys159 provides a secondary interaction with its sidechain. For the BRD3 ET : NSD3148–184 complex, the antiparallel β-strand hairpin is buried in the hydrophobic pocket while the BRD4 ET : NSD3152–163 complex shows the anti-parallel filling the hydrophobic pocket. The orientation of the ET β1 strand 613EIEID617 is shifted to accommodate the smaller size of the binding NSD3152–163 substrate (Figure 7E).
Discussion
MLV IN CTD has no secondary interaction sites with BRD3 ET domain.
Studies of MLV virus bearing deletion of the IN TP resulted in loss of BET protein interaction and decreased integration at promoter/enhancer regions (Aiyer et al., 2014, Loyola et al., 2019, Sharma et al., 2013, De Rijck et al., 2013). However, it was noted that integrations at TSS and CpG islands did not reach baseline, implying that alternative secondary ET binding sites within IN remained a possibility (Aiyer et al., 2015). Positions within the MLV IN CCD were proposed to interact with BET proteins (Gupta et al., 2013). However, mutagenesis of these residues did not yield viable virus (Loyola et al., 2019) and homology models of the MLV CCD (Aiyer et al., 2015), indicated that the residues important for BET protein interaction are buried and close to the dimer interface of the outer and inner CCDs, thus making it an unlikely interaction interface (Loyola et al., 2019). Within the IN CTD, a mild decrease in preference for TSS and CpG islands was observed for constructs bearing substitutions in the MLV IN CTD β1-β2 loop (Aiyer et al., 2015). This prompted the NMR solution structure analysis of the complete IN CTD329–408 in complex with the BRD3 ET domain. Surprisingly, no secondary interaction sites are observed between the ET domain and CTD beyond the IN TP386–407 ET-binding motif. This does not rule out the possibility of other regions of the BET protein being involved in secondary interactions, either directly with MLV IN or indirectly through the viral preintegration complex (PIC).
Flexibility of IN linker region separating ETBM and SH3 fold.
Using 15N nuclear relaxation and 1H-15N Heteronuclear NOE measurements, we evaluated interdomain flexibility based on four key observations. First, there are no contacts indicated by NOE or CSP measurements between the SH3 and ET domains of the complex. Second, structure determination results in models in which the relative orientation between the domains is not uniquely determined. Third, estimates of the rotational correlation times τc indicate that in the complex both the SH3 and the ET domains have τc values that are significantly greater than those of these individual domains, and approaching τc values expected for a rigid complex. Finally, the HetNOE and τc values estimated within the linker indicate more order than expected for a highly disordered linker.
Linker regions have been increasingly implicated in diverse roles such as modulating propagation of allostery and restricting the sampling space of relevant conformations (Ma et al., 2011, Papaleo et al., 2016, Piai et al., 2016). We used our understanding of the structure of the ETBM together with disorder prediction methods (Huang et al., 2014) to analyze the interdomain linker regions that could form in other ET complexes. The size of this region varies among related gammaretroviruses between 6 to 19 residues (Supplementary Figure S3). For M-MLV, deletions within the ten amino-acid linker (379DPGGGPSSRL388) have been isolated in mice, the shortest of which (Δ20) encodes the linker DPGRKL that minimally maintains a single Pro residue (Supplementary Figure S3) (Loyola et al., 2019). Within all gammaretroviral linker regions, Pro, Gly, and Ser residues are highly abundant and variations in their composition in an otherwise intrinsically-disordered linker can affect the stiffness / flexibility of the linker (van Rosmalen et al., 2017). Collectively, these results indicate that while long flexible linkers are not a prerequisite for successful interaction of IN with BET proteins, the appropriate degree of flexibility in these tethers created by complex formation might play an important role in entropically stabilizing binding of IN with BET protein, thus facilitating the functional targeting of integration sites during gammaretroviral infection.
Model of MLV intasome : ET interaction based on PFV intasome : nucleosome structure.
BET proteins interact with MLV IN after p12-mediated nuclear retention of the viral PIC (Brzezinski et al., 2016a, Brzezinski et al., 2016b, Borrenberghs et al., 2019). Using FRET-based studies, the interaction of BET proteins with MLV IN was shown to cause alteration in the quaternary structure of IN within the PIC (Borrenberghs et al., 2019). An overlay of the IN CTD : BRD3 ET domain onto the PFV intasome provides a hypothetical model of the architecture of the intasome complex with host nucleosomes through BET proteins (Figure 8). The linker region of the docked model of IN CTD and ET domain required alteration of the relative domain orientations in order prevent steric clashes with the rest of the intasome. This suggests that the flexible nature of the linker separating IN and BRD3 interaction can modulate conformational changes within the PIC to engage host chromatin. Since the targeting of intasomes in vivo can be altered by truncating the ET binding motif, substituting the ET binding motif to retarget integration may require a linker region that optimally orients the SH3 domain and the retargeting module.
Fig. 8. Intasome overlay.
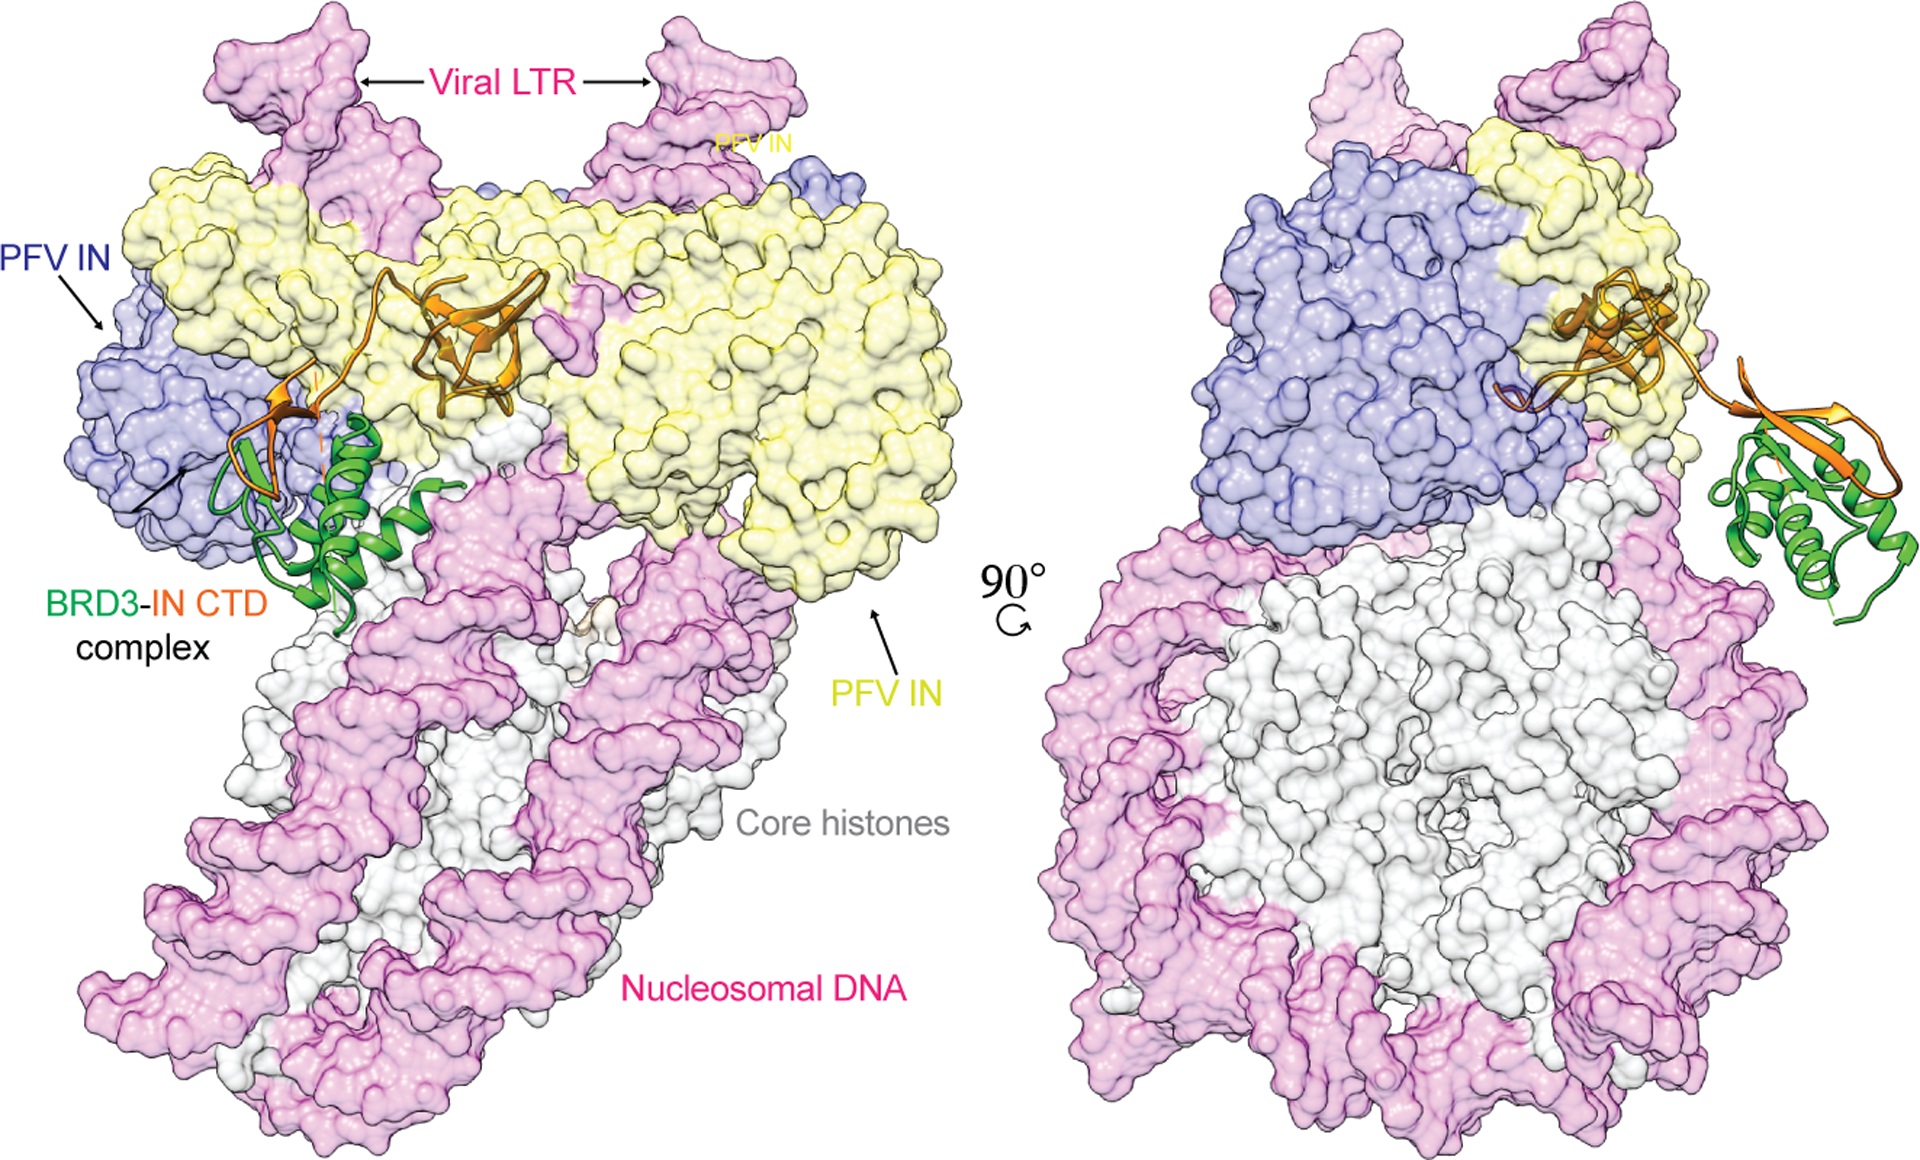
Left panel represents the overlay of PFV intasome with the MLV IN CTD and BRD3 ET complex (this study). The alignment of PFV intasome-IN CTD:ET complex onto nucleosome was guided using the PFV intasome-nucleosome cryo-EM structure (PDB ID 6RNY; EMDB ID 4960) (Wilson et al., 2019). The PFV intasome dimer of dimers is represented in yellow and blue color, the IN CTD is in orange, BRD3 ET complex is in green, the viral and target DNA is in magenta and core histone proteins are in grey. Right panel is a 90° rotation along the y-axis.
Role of hydrophobic pocket and polymorphic interactions in defining the interface with ET domain.
A key component of the interaction between the BRD3 ET domain and MLV IN CTD TP is the formation of a hydrophobic pocket that stabilizes this interaction. Substitution of a single hydrophobic amino acid in this pocket is capable of disrupting this interaction in the case of MLV IN (De Rijck et al., 2013). Unlike MLV IN TP, prior published structures of the peptide motifs of NSD3152–163, LANA CTD1133–1144, BRG11591–1602 and CHD4290–301 observe only a double-stranded interface between the peptide and the ET domain (Konuma et al., 2017, Wai et al., 2018, Zhang et al., 2016). The extended NSD3148–184 peptide defined in this study, forms a three-stranded interaction, which accommodates the binding of residue Phe168 into the hydrophobic pocket occupied by Trp390 of MLV IN (Figure 7 D, G). Interestingly, the CHD4290–301 peptide bound to the ET encodes a terminal Phe in the vicinity of this hydrophobic pocket (Wai et al., 2018). Thus, these studies extend the commonality of the minimal ligand binding by ET beyond the electrostatic recognition (Zhang et al., 2016) of the ET EIEID sequence to now include the secondary interactions within the hydrophobic pocket.
Although the hydrophobic pocket and the acidic residues that line this pocket is a common feature of these protein-protein interactions from the ET side, in this study we have shown that the interacting partners can show diverse structural features. The MLV IN CTD TP and NSD3148–184 ET binding peptide both form β-hairpins but in an inverted orientation to one another. Significantly, for both MLV IN and NSD3 the sequences in the turn region (398PLK400 for MLV and 162QNGRE166 for NSD3, Supplementary Figure S3), are also highly conserved. In all of these structures, the ET domain forms a β-strand involving the loop polypeptide segment between helices α2 and α3. However, the binding motif to ET studied within JMJD6 is reported to be an α-helix (Konuma et al., 2017), showing the potential diversity of structures capable of fitting into this cavity. Of all the available ET structures with bound peptide motifs, only the MLV IN TP complex has a binding constant in the sub-micromolar range (Crowe et al., 2016, Konuma et al., 2017) indicating the extended hydrophobic interactions are important for stable binding. Indeed, solvent accessibility studies comparing the NSD3148–184 from this study with NSD3152–163 (PDB 2NCZ) demonstrates that the 3-stranded β-sheet complexes result in an increased buried surface area (Supplementary Table S3), which should result in tighter binding for these extended structures (Konuma et al., 2017, Zhang et al., 2016).
ET domain protein:protein interactions cannot be generalized to a peptide interface.
Peptide motifs designed based on primary sequence alone as in LANA, NSD3, CHD4, BRG1 and JMJD6 (Wai et al., 2018, Konuma et al., 2017, Zhang et al., 2016) need not necessarily recapitulate interactions in the context of full-length complexes. In the case of LANA-1 CTD, the predominant peptide motif in LANA-1 CTD interacting with BRD4 ET domain localized to 1133–1144 (Zhang et al., 2016) whereas larger LANA CTD and BRD2/4 ET complexes showed the most extensive CSPs localizing to LANA CTD1125–1129 upon ET binding (Hellert et al., 2013). Our study with a peptide LANA-1 CTD1108–1141 resulted in only a weak interaction with BRD3 ET and LANA-1 CTD1108–1141 (Supplementary Figure S6 BD). This suggests that additional interfaces including the oligomeric nature of LANA-1 CTD (Hellert et al., 2013) may modulate stable interactions. Similarly, in the full length JMJD6, the α-helical region from residues 84–96 is not completely solvent exposed, and is potentially allosterically regulated by ssRNA (Konuma et al., 2017). A separate report showed that JMJD61–305, distinctly larger than JMJD684–96 peptide, was minimally required for interaction with BRD4471–730 (Liu et al., 2013). We performed [15N-1H]-HSQC experiments with isotopically enriched BRD3 ET554–640 and unlabeled JMJD61–336 (Supplemental Figure S6 CE) observing small but detectable CSPs similar to those reported in this study. Hence, at least for LANA-1 CTD and JMJD6 complex formation involves structural changes more extensive than the simple mechanism of short peptide interactions between BET proteins and their interaction partners.
ET domain is an attractive target for therapeutic inhibitors.
Currently, BET inhibitors used as potential cancer therapeutics and/or tool reagents target only the bromodomains of the BET family of proteins, either individually or in tandem (Alqahtani et al., 2019). Despite their efficacy and being clinically promising targets, bromodomain inhibitors are associated with development of drug resistance mechanisms and other toxicities (Alqahtani et al., 2019, Jin et al., 2018). There is an increasing need to tune therapeutic strategies targeting epigenetic readers like BET proteins, since their activity is highly tissue specific. The ET domain provides a flexible interacting interface enabling interaction with various host and viral proteins. This interacting interface thus provides a highly context dependent mode for the different interacting partners and can serve as a plausible drug target. NSD3 is frequently amplified or occurs as fusions in a variety of human cancers. Since BRD3 and BRD4 both interact with NSD3, the extended BRD3 ET : NSD3148–184 interface can be used as a starting platform, to design therapeutic strategies to disrupt the interaction. We believe that the plasticity of interaction mechanisms of the ET domain with other proteins can extend this strategy to serve as a platform for developing targeted therapeutic responses towards certain forms of cancers with BET protein vulnerabilities (Loven et al., 2013, Han et al., 2018).
STAR METHODS
RESOURCE AVAILABILITY
Lead Contact
Further information and requests for resources and reagents should be directed to and will be fulfilled by the designated contacts Monica J Roth (roth@rwjms.rutgers.edu) and Gaetano T. Montelione (monteg3@rpi.edu).
Materials Availability
Materials generated in this study are available upon request.
Data and Code Availability
BMRB and PDB accession numbers for the structures reported in this paper are: BRD3 ET PDB: 7JMY, BMRB: 30782; BRD 3ET : MLV IN TP PDB: 7JQ8, BMRB: 30786; BRD3 ET : MLV IN CTD PDB: 7JYZ, BMRB: 30791; BRD3 ET : NSD3 PDB: 7JYN, BMRB: 30790.
EXPERIMENTAL MODEL AND SUBJECT DETAILS
Bacterial cell culture
Two strains of E. coli were used in this study. HB101 strain (gift from Stephen Goff, Columbia University) was used for propagation of plasmids. BL21(DE3) (Novagen) was used for protein purification. Frozen stock of BL21(DE3) cells with respective expression plasmid was recovered in LB broth plus 100 mg/ml carbenicillin at 37°C overnight and used for protein expression and purification as described in Method Details.
METHOD DETAILS
Expression constructs and peptides.
Construction of pET15NESG MLV IN CTD and pET15NESG BRD3-ET domain has been described elsewhere (Aiyer et al., 2014). pGV358 (gift from Kushol Gupta, Univ. of Pennsylvania) is a pETDuet based vector that has a C-terminal Mycobacterium xenopi GyrA intein (mxe) in-frame followed by the chitin binding domain (CBD) and non-cleavable hexahistidine tag (6xHis). MLV IN CTD TP was generated as follows. Codon optimized complementary oligonucleotides (IDT) encoding for 22 amino acids of the native MLV IN CTD TP sequence and part of the mxe sequence was obtained with overhangs mimicking NdeI and SpeI restriction sites (Supplementary Table S4). The resulting vector has an open reading frame of MSRLTWRVQRSQNPLKIRLTREACITGDAL (MLV TP is underlined and mxe is italicized), which is in-frame with the rest of the mxe-CBD-6xHis construct. The oligonucleotides were annealed by heating to 94°C for 5 mins and slow cooling to 4°C for the duration of 1.5 hours. The annealed oligonucleotides were cloned by ligation into pGV358 plasmid digested with NdeI and SpeI. Construction of the CTD of LANA1108–1141 into the pGV358 vector was performed using a gene block that was synthesized with NdeI and SpeI sites (Supplementary Table S4). The corresponding DNA sequences of NSD3100–263, NSD3142–166, NSD3148–184 and JMJD61–336 sequences were encoded in pSUMO fusion vector (Wen et al., 2016) (gift from Volker Vogt, Cornell University). NSD3100–263 and NSD3148–184 cloning was facilitated by synthesizing a gene block fragment (Supplementary Table S4) which was amplified through PCR (IDT). JMJD61–336 was amplified using 100 ng of a human cDNA library (Mazari et al., 2009) from 143B cells (Supplementary Table S4). The ORF of JMJD61–336 contains an EcoRI site, therefore, the cloning was a two-step process involving ligation of an EcoRI-HindIII fragment followed by inserting of an EcoRI-EcoRI fragment. Sanger sequencing was performed to ensure the correct ORF sequences were present in all the plasmids used for expression studies. Unlabeled MLV IN CTD TP, NSD3148–184 and LANA1108–1141 peptides were procured from Peptide 2.0.
Purification of recombinant MLV IN CTD329–408 and BRD3 ET554–640.
Expression and purification of MLV IN CTD and BRD3 ET domain has been described elsewhere (Aiyer et al., 2014). Briefly, induction was carried out in LB media or MJ9 media (Jansson et al., 1996, Aiyer et al., 2014). For isotopically-enriched samples, 15NH4Cl and 13C glucose were the soles sources of nitrogen and carbon, respectively. The bacteria were harvested by centrifugation and resuspended either in lysis buffer [(50 mM Tris-HCl pH 7.5, 500 mM NaCl, 40 mM imidazole, and 1 mM Tris-(2-carboxyethyl)phosphine) or (50 mM sodium phosphate, pH 8.0, 300 mM NaCl, 10 mM imidazole, 10 mM CHAPS, 5 mM 2-mercaptoethanol)], followed by mild sonication. Following Ni-NTA resin purification (Qiagen), fractions eluted in 400 mM imidazole were pooled and concentrated to a volume of less than 250 μl using an Amicon Ultracel-3K centrifugal filter unit (Millipore) as described (Jansson et al., 1996, Aiyer et al., 2014), with the following modifications. The concentrated protein fraction was then injected into an AKTA FPLC and resolved on a Superdex 75 gel filtration column (GE Healthcare) in the buffer for NMR analysis (20 mM sodium phosphate pH 7.0, 100 mM NaCl and 2 mM 2-mercaptoethanol). The eluted fractions were then pooled and concentrated using an Amicon Ultracel-3K centrifugal filter unit (Millipore). These U-15N,13C-enriched protein samples were stored in this same buffer for NMR analysis.
Purification of isotopically-enriched MLV IN CTD TP386–407 and NSD3148–184.
Expression and purification of MLV IN CTD TP386–407-mxe-CBD-6xHis fusion protein construct from the pGV358 backbone was adapted from previous studies (Aiyer et al., 2015, Aiyer et al., 2014, Schneider et al., 2012), resulting in the IN CTP TP fused to the self-cleaving intein-Chitin binding domain (CBD). Induction for protein expression was carried out in MJ9 media (Jansson et al., 1996, Schneider et al., 2010), in which 15NH4Cl and uniformly 13C-enriched glucose are the sole sources of nitrogen and carbon, respectively. The bacteria were harvested by centrifugation and resuspended either in lysis buffer [50 mM Tris-HCl pH 7.5, 500 mM NaCl, 40 mM imidazole, and 1 mM Tris-(2-carboxyethyl)phosphine] or (50 mM sodium phosphate, pH 8.0, 300 mM NaCl, 10 mM imidazole, 10 mM CHAPS, 5 mM 2-mercaptoethanol)], followed by mild sonication. The IN TP-CBD fusion protein was purified first using NiNTA beads (Qiagen) and then bound to chitin beads (New England Biolabs) as per the respective manufacturer’s recommendations. Isotopically enriched peptide was released from the fusion protein bound to chitin agarose beads (NEB) by incubating for 48 hours at room temperature with 20 mM sodium phosphate pH 8.0, 0.2 M NaCl, 0.1 mM EDTA, 75 mM dithiothreitol (DTT) (Fluka) to initiate self-cleaving reaction under reducing conditions resulting in on-column cleavage (Mitchell and Lorsch, 2015). Unbound cleaved peptide was then separated from uncleaved fusion protein and mxe-CBD-6xHis by passing the suspension through buffer equilibrated (without DTT) fresh chitin resin (NEB) settled in a gravimetric econopack column (BioRad). Purified isotopically enriched peptide was concentrated and buffer exchanged to 20 mM sodium phosphate pH 7.0, 100 mM NaCl and 2 mM DTT using 3 kDa MWCO Ultragel Amicon filters (Millipore) or 2 kDa MWVO Hydrosart filters (Vivaspin). Homogeneity (> 95%) was validated by SDS-PAGE, and isotope-enrichment by MALDI-TOF mass spectrometry (Supplementary Figure S2).
Isotope-enriched NSD3148–184 was produced as a SUMO-fusion construct in E. coli expression hosts and cleaved with SUMO protease. Bacteria were harvested by centrifugation and resuspended in lysis buffer [50 mM Tris-HCl pH 7.5, 500 mM NaCl, 40 mM imidazole, and 1 mM Tris-(2-carboxyethyl)phosphine], followed by mild sonication. After the removal of cell debris by centrifugation at 27,000 × g for 30 min at 4 °C, the supernatant was applied to a 5 ml HisTrap™ affinity column (GE Healthcare). The column was washed with the lysis buffer and the protein was eluted using a buffer containing 50 mM Tris-HCl pH 7.5, 500 mM NaCl, 300 mM imidazole, and 1 mM Tris-(2 carboxyethyl) phosphine. Subsequently, the eluted protein sample, containing the SUMO fusion of NSD3148–184, was further purified by gel filtration (HiLoad 16/60 Superdex 75; GE Healthcare) chromatography in a cleavage buffer (50 mM Tris-HCl pH 8.0, 100 mM NaCl, and 10 mM DTT). The cleavage of the fusion protein was carried out by adding an aliquot (1:50–100 mass ratio) of yeast SUMO protease Ulp1 containing an N-terminal 6xHis tag (Ii et al., 2007), and the sample was then incubated at 25 °C for 18–24 hours. The degree of the cleavage was monitored by SDS-PAGE. To remove the uncleaved fusion protein, SUMO, and SUMO protease, the mixture was applied to a 5 ml HisTrap™ column. The flow through and wash fractions, which contain the peptide NSD3148–184 were verified by SDS-PAGE, and pooled. The purified NSD3148–184 was > 95% pure as determined by SDS-PAGE (Supplementary Figure S2).
NMR assignments and structure determination.
13C,15N-enriched samples of BRD3 ET and its complexes with MLV IN TP, MLV IN CTD and NSD3148–184 at pH 7.0 were used for structure determination. These samples are summarized in Supplementary Table S5. Samples were prepared in 3-, 4- or 5-mm Shigemi NMR tubs, or in 1.7-mm micro NMR tubes. Conventional 3D triple resonance (Baran et al., 2004, Huang et al., 2005a) and 3D NOESY NMR experiments were executed using standard Bruker NMR pulse sequences optimized for each protein sample at 25 °C on Bruker Avance III 600 MHz and Avance III 800 MHz NMR spectrometer systems. Complex formation was confirmed using 1D 15N T1 and T2 relaxation experiments to estimate rotational correlation times τc, and effective molecular weights were estimated by comparison with τc measurements made on collection of reference proteins, as described elsewhere (Rossi et al., 2010). 1D 15N T1 and T2 relaxation data was processed using Bruker Topspin 2.3 software and analyzed using the “t1guide” module in Topspin to obtain 15N T1 and T2 values. All NMR data was processed using NMRPipe (Delaglio et al., 1995) and visualized using NMRFaM SPARKY (Lee et al., 2015).
Initial backbone 1H, 13C, and 15N resonance assignments were determined automatically using both the I-Pine server (Bahrami et al., 2009, Lee et al., 2019) and AutoAssign (Zimmerman et al., 1997, Moseley et al., 2001) software, and then refined by interactive manual analysis with the program Sparky (Lee et al., 2015). Side chain resonance assignments were completed manually using Sparky. The NMR experiments used to determine these resonance assignments for each free ET and each complex are summarized in Supplementary Table S5. NMR resonance assignment validation was done using the program Assignment Validation Software (AVS) (Moseley et al., 2004).
NOESY data collection included 3D N-edited-NOESY-HSQC, 3D C-edited NOESY-HSQC, and 3D sim N,C-edited-HSQC (Cavanagh et al., 2006), and well as 3D 13C X-filtered NOESY experiments (Stuart et al., 1999) for detecting intermolecular NOE interactions between labeled and unlabeled fragments. NOESY mixing times were 100 to 120 ms. Peak intensities from a 3D NOESY spectra, together with broad dihedral angle constraints determined from backbone chemical shift data using TALOS+ (Shen and Bax, 2013) for ordered residues with TALOS+ confidence scores of 10, were used as input for structure calculations. NOESY peak assignments were made automatically using the CANDID module of Cyana (Guntert et al., 1997, Herrmann et al., 2002) together with the program ASDP (Huang et al., 2005b, Huang et al., 2006). The resulting structures were then refined in explicit water using CNS (Brunger et al., 1998).
Structure quality assessment.
Structure quality analyses were performed using the Protein Structure Validation Suite (PSVS) (Bhattacharya et al., 2007, Moseley et al., 2004), which includes the MolProbity (Lovell et al., 2003), Procheck (Laskowski R.A., 1993), Verify3D (Lovell et al., 2003) and ProsaII (Sippl, 1993), RPF (Huang et al., 2005b) and PDBStat (Tejero et al., 2013) software packages. The final ensemble of 20 models (excluding the C-terminal His6 tag), NMR resonance assignments, and extensive raw NMR fid data and spectral peak lists were deposited into the Protein Data Bank and BioMagRes Database.
15N nuclear relaxation studies of IN CTD : ET complex.
15N nuclear relaxation experiments were performed on 15N-enriched sample of the IN CTD:ET complex in 20 mM sodium phosphate, 100 mM NaCl and 2 mM 2-mercaptoethanol, at pH 7.2. A series of 2D NMR spectra were acquired as described elsewhere (Feng et al., 1998). Data collection for T1 used decays delays of 20, 50, 100, 300, 500, 700, 900, 1200 and 2000 ms, and T2 measurements were made with decay delays of 17, 34, 51, 68, 85, 96, 119, 170 and 220 ms. 1H-15N steady-state NOE values were measured with two different data sets, one collected with no initial proton saturation and a second with initial proton saturation of 3 s. These 2D NMR spectra were processed and phased identically using NMRPIPE, and peak intensities obtained using SPARKY software. Steady heteronuclear 15N-1H NOE values were obtained from the ratios of cross peak intensities in the saturated spectrum to those in the unsaturated spectrum (Isat / Ieq).
QUANTIFICATION AND STATISTICAL ANALYSIS
NMR structure quality statistics.
Structure quality assessment was done using the software packages Protein Structure Validation Suite (PSVS) (Bhattacharya et al., 2007), PDBStat (Tejero et al., 2013), and RPF (Huang et al., 2012) using statistical methods outlined in these publications. NMR ensembles were represented by 20 confomers, as indicated, and root-mean-squared deviations (rmsd’s) of atomic coordinates were computed relative to the single conformer most like all the others, called the medoid conformer, using the program PDBStat (Tejero et al., 2013). These statistical results are presented in Table 1.
Error estimates in nuclear relaxation measurements.
Curve fits to exponential decay curves for estimating transverse (T1) and longitudinal (T2) 15N relaxation rates were made using a global optimization function. Errors were estimated by Gaussian probability distribution modeling, using the standard deviation of the measured intensity uncertainties (± 5%) about each intensity in the data.
The sum over P(i) from all time series data points i in the time series is maximized to find the global best fit Ifit(i) to all the data through the measured intensities I(i). This analysis accounts for the experimental measurement uncertainty, defined by σ(i), of ± 5%. This approach results in the best fit of data to the single-exponential decay model, i.e. Ifit(i) = a * exp(−x/b) + c, given the uncertainty in the intensity values I(i) of σ(i), and maximizes the exponential fit, in particular the decay constants T1 and T2, within the one sigma bounds of the measurement uncertainties. The root mean square error of this fit was used to find the largest and smallest decay constants about this most likely fit, giving the fit uncertainties from the estimate of the possible measurement errors. The correlation time τc for each amide N-H bond vector, and its uncertainty, were then determined by finding an exact solution to the ratio of the contributing spectral densities which define T1/T2 (Carper and Keller, 1997). These T1, T2, and τc calculations and their fitted uncertainties used the minimization algorithm fminunc in Matlab (Mathworks). Heteronuclear NOE (HNOE) values (Isat/Ieq) and their uncertainties, σHNOE, were determined as described elsewhere (Feng et al., 1998), assuming a standard deviation (σi) of the measured resonance intensities I(i) of ± 5%. These statistical results are presented in Figure. 5.
Statistical analysis of chemical shift perturbation measurements.
The threshold for defining a significant chemical shift perturbation (CSP) was determined from the following iterative analysis, as described elsewhere (Ma et al., 2016). The standard deviation (σ) of the shift changes was first calculated. To prevent biasing the distribution by including the small number of residues with very large shift changes, any residues for which the shift change is greater than 3σ were excluded. The next standard deviation was then recalculated excluding residues with shift changes more than 3σ. Iteration of these calculations was performed until no further residues are excluded, resulting in deviation for unperturbed sites of 3σ = 0.02 ppm. Accordingly, we conservatively choose 0.05 ppm (50 ppb) as the threshold to minimize any false positives.
Supplementary Material
KEY RESOURCES TABLE
| REAGENT or RESOURCE | SOURCE | IDENTIFIER |
|---|---|---|
| Bacterial and Virus Strains | ||
| E. coli BL21(DE3) | Novagen | Roth lab |
| E. coli HB101 | This paper | Gift from Goff lab, Columbia University, NY NY |
| Biological Samples | ||
| 143B cDNA library | (Mazari et al., 2009) | Roth lab |
| Chemicals, Peptides, and Recombinant Proteins | ||
| MLV IN CTD386–407 peptide | Peptide 2.0 Inc | N/A |
| NSD3148–184 peptide | Peptide 2.0 Inc | N/A |
| LANA1108–1141 peptide | Peptide 2.0 Inc | N/A |
| Sodium chloride | Sigma Aldrich | Cat # 746398–2 |
| Tris | Sigma Aldrich | Cat # T1503 |
| TCEP | GoldBio | Cat # TCEP1 |
| Sodium phosphate | JT Baker/Fisher | Cat # 3828–05/S381–3 |
| 2-mercaptoethanol | BioRad | Cat # 161–0710 |
| Imidazole | JT Baker | Cat # N811–06 |
| 15N-labeled ammonium chloride | Cambridge Isotope | Cat # NLM-713-PK |
| 13C-glucose | Cambridge Isotope | Cat # CLM-1396-PK |
| NdeI | NEB | Cat # R0111L |
| SpeI | NEB | Cat # R0133S |
| EcoRI HF | NEB | Cat # R3101T |
| HindIII HF | NEB | Cat # R3104T |
| EDTA | JT Baker | Cat # 8993–01 |
| Dithiothreitol | Fluka Analytical | Cat # 43819–5G |
| Ni-NTA resin | Qiagen | Cat # 30430 |
| Bacto-Tryptone | BD | Cat # 211705 |
| Bacto Yeast extract | BD | Cat # 212750 |
| Carbenicillin disodium salt | Sigma | Cat # C1389–5G |
| Deposited Data | ||
| BRD3 ET domain. Solution NMR structure coordinates | This paper | PDB: 7JMY |
| BRD3 ET domain. NMR resonance assignments, extensive raw FID data and NOESY peak lists. | This paper | BMRB: 30782 |
| BRD3 ET domain in complex with MLV IN CTD TP. Solution NMR structure coordinates. | This paper | PDB: 7JQ8 |
| BRD3 ET domain in complex with MLV IN CTD TP. NMR resonance assignments, extensive raw FID data and NOESY peak lists. | This paper | BMRB: 30786 |
| BRD3 ET domain in complex with MLV IN CTD. Solution NMR structure coordinates. | This paper | PDB: 7JYZ |
| BRD3 ET domain in complex with MLV IN CTD. NMR resonance assignments, extensive raw FID data and NOESY peak lists. | This paper | BMRB: 30791 |
| BRD3 ET domain in complex with NSD3148-184. Solution NMR structure coordinates. | This paper | PDB: 7JYN |
| BRD3 ET domain in complex with NSD3148-184. NMR resonance assignments, extensive raw FID data and NOESY peak lists. | This paper | BMRB: 30790 |
| Solution NMR structure of BRD4 ET domain in complex with NSD3152–163 | (Zhang et al., 2016) | PDB: 2NCZ |
| Solution NMR assignments of BRD4 ET domain in complex with NSD3152–163 | (Zhang et al., 2016) | BMRB: 26041 |
| Structure of PFV intasome in complex with nucleosome | (Wilson et al., 2019) | PDB: 6RNY |
| CryoEM map of PFV intasome in complex with nucleosome | (Wilson et al., 2019) | EMDB: 4960 |
| Solution NMR structure of BRD4 ET with JMJD6 | (Konuma et al., 2017) | PDB: 6BNH |
| NMR resonance assignment of BRD4 ET with JMJD6 | (Konuma et al., 2017) | BMRB: 30373 |
| Experimental Models: Cell Lines | ||
| 143B cells | 143B cells provided by F. González-Scarano, U. Pennsylvania, Philadelphia, PA) (Bupp et al., 2005) | Roth lab |
| Oligonucleotides | ||
| List of oligonucleotides in Supplementary Table S4 | IDT | N/A |
| Recombinant DNA | ||
| pGV58 MLV IN CTD386–407 | This paper | Roth and Montelione labs |
| pET15NESG MLV IN CTD329–408 | (Aiyer et al., 2014) | Roth and Montelione labs |
| pET15NESG BRD3 ET | (Aiyer et al., 2014) | Roth and Montelione labs |
| pSUMO NSD3148–184 | This paper | Roth and Montelione labs |
| pGV3358 LANA1108–1141 | This paper | Roth and Montelione labs |
| pSUMO JMJD61–336 | This paper | Roth and Montelione labs |
| Software and Algorithms | ||
| Topspin | Bruker Biospin | https://www.bruker.com/service/supportupgrades/softwaredownloads/nmr/freetopspin-processing/nmrtopspin-license-foracademia.html |
| CYANA | (Guntert et al., 1997, Herrmann et al., 2002) | https://www.las.jp/english/products/cyana/Cyana21AcademicLicenseLAS.pdf |
| Sparky | (Lee et al., 2015) | https://nmrfam.wisc.edu/nmrfam-sparkydistribution/ |
| PyMOL | PyMOL Molecular Graphics System | https://pymol.org/2/ |
| UCSF Chimera | (Pettersen et al., 2004) | https://www.cgl.ucsf.edu/chimera/ |
| NMRPipe | (Delaglio et al., 1995) | https://www.ibbr.umd.edu/nmrpipe/install.html |
| AutoAssign | (Zimmerman et al., 1997, Moseley et al., 2001) | https://montelionelab.chem.rpi.edu/index.htm |
| I-PINE | (Bahrami et al., 2009) | http://ipine.nmrfam.wisc.edu/ |
| TALOS+ | (Shen and Bax, 2013) | https://spin.niddk.nih.gov/NMRPipe/talos/ |
| AutoStrucure with DP Score (ASDP) | (Huang et al., 2005b, Huang et al., 2006) | https://montelionelab.chem.rpi.edu/index.htm |
| Assignment Validation Software (AVS) | (Moseley et al., 2004) | https://montelionelab.chem.rpi.edu/NMRsoftware/autoassign/AAAPAVS_license.pdf |
| Protein Structure Validation Software Suite (PSVS) | (Bhattacharya et al., 2007) | https://montelionelab.chem.rpi.edu/index.htm |
| MolProbity | (Lovell et al., 2003) | http://molprobity.biochem.duke.edu/ |
| Procheck | (Laskowski R.A., 1993) | https://www.ebi.ac.uk/thorntonsrv/software/PROCHECK/ |
| Prosall | (Sippl, 1993) | https://prosa.services.came.sbg.ac.at/prosa.php |
| Verify3D | (Lovell et al., 2003) | http://services.mbi.ucla.edu/Verify_3D/ |
| PDBStat | (Tejero et al., 2013) | http://rtti7.uv.es/~roberto/Index.php?sec=pdbstat |
| RPF | (Huang et al., 2005b) | https://montelionelab.chem.rpi.edu/index.htm |
| Matlab | MATLAB, 2010. version 7.10.0 (R2010a), Natick, Massachusetts: The MathWorks Inc. | Mathworks, https://www.mathworks.com/help/optim/ug/fminunc.html |
| Illustrator for Biological Sequences | (Liu et al., 2015) | http://ibs.biocuckoo.org/download.php |
| GETAREA/PyMol | (Fraczkiewicz and Braun, 1998) | https://pymol.org/2/ |
| Clustal Omega | (Madeira et al., 2019, Sievers et al., 2011, Sievers and Higgins, 2018, Gonnet et al., 1992) | http://www.clustal.org/omega/ |
Highlights.
The BRD3 ET domain binds to key peptide motifs of diverse host and viral proteins.
These complexes reveal conformational plasticity in molecular recognition.
NMR studies demonstrate restricted interdomain motion in the IN CTD / ET complex.
A cost-effective approach is described for producing isotopically-labeled peptides.
Acknowledgment:
This work is supported by grants from NIH grants R35 GM122518, R01 GM110639 (MR) and R01 GM120574 (GTM).
Footnotes
Declaration of Interests
GTM is a founder of Nexomics Biosciences, Inc. G.L. is chief-scientific officer and director of Nexomics Biosciences, Inc. The remaining authors declare no competing interests.
References
- AIYER S, ROSSI P, MALANI N, SCHNEIDER WM, CHANDAR A, BUSHMAN FD, MONTELIONE GT & ROTH MJ 2015. Structural and sequencing analysis of local target DNA recognition by MLV integrase. Nucleic Acids Res, 43, 5647–63. [DOI] [PMC free article] [PubMed] [Google Scholar]
- AIYER S, SWAPNA GV, MALANI N, ARAMINI JM, SCHNEIDER WM, PLUMB MR, GHANEM M, LARUE RC, SHARMA A, STUDAMIRE B, KVARATSKHELIA M, BUSHMAN FD, MONTELIONE GT & ROTH MJ 2014. Altering murine leukemia virus integration through disruption of the integrase and BET protein family interaction. Nucleic Acids Res, 42, 5917–28. [DOI] [PMC free article] [PubMed] [Google Scholar]
- ALQAHTANI A, CHOUCAIR K, ASHRAF M, HAMMOUDA DM, ALLOGHBI A, KHAN T, SENZER N & NEMUNAITIS J 2019. Bromodomain and extra-terminal motif inhibitors: a review of preclinical and clinical advances in cancer therapy. Future Sci OA, 5, FSO372. [DOI] [PMC free article] [PubMed] [Google Scholar]
- BAHRAMI A, ASSADI AH, MARKLEY JL & EGHBALNIA HR 2009. Probabilistic interaction network of evidence algorithm and its application to complete labeling of peak lists from protein NMR spectroscopy. PLoS Comput Biol, 5, e1000307. [DOI] [PMC free article] [PubMed] [Google Scholar]
- BARAN MC, HUANG YJ, MOSELEY HN & MONTELIONE GT 2004. Automated analysis of protein NMR assignments and structures. Chem Rev, 104, 3541–56. [DOI] [PubMed] [Google Scholar]
- BENNETT RL, SWAROOP A, TROCHE C & LICHT JD 2017. The role of nuclear receptor-binding SET domain family histone lysine methyltransferases in cancer. Cold Spring Harb Perspect Med, 7, a026708. [DOI] [PMC free article] [PubMed] [Google Scholar]
- BHATTACHARYA A, TEJERO R & MONTELIONE GT 2007. Evaluating protein structures determined by structural genomics consortia. Proteins, 66, 778–95. [DOI] [PubMed] [Google Scholar]
- BORRENBERGHS D, ZURNIC I, DE WIT F, ACKE A, DIRIX L, CERESETO A, DEBYSER Z & HENDRIX J 2019. Post-mitotic BET-induced reshaping of integrase quaternary structure supports wild-type MLV integration. Nucleic Acids Res, 47, 1195–1210. [DOI] [PMC free article] [PubMed] [Google Scholar]
- BRUNGER AT, ADAMS PD, CLORE GM, DELANO WL, GROS P, GROSSE-KUNSTLEVE RW, JIANG JS, KUSZEWSKI J, NILGES M, PANNU NS, READ RJ, RICE LM, SIMONSON T & WARREN GL 1998. Crystallography & NMR system: A new software suite for macromolecular structure determination. Acta Crystallogr D Biol Crystallogr, 54, 905–21. [DOI] [PubMed] [Google Scholar]
- BRZEZINSKI JD, FELKNER R, MODI A, LIU M & ROTH MJ 2016a. Phosphorylation requirement of murine leukemia virus p12. J Virol, 90, 11208–11219. [DOI] [PMC free article] [PubMed] [Google Scholar]
- BRZEZINSKI JD, MODI A, LIU M & ROTH MJ 2016b. Repression of the chromatin-tethering domain of murine leukemia virus p12. J Virol, 90, 11197–11207. [DOI] [PMC free article] [PubMed] [Google Scholar]
- BUPP K, SARANGI A & ROTH MJ 2005. Probing sequence variation in the receptor-targeting domain of feline leukemia virus envelope proteins with peptide display libraries. J Virol, 79, 1463–9. [DOI] [PMC free article] [PubMed] [Google Scholar]
- CARPER WR & KELLER CE 1997. Direct determination of NMR correlation times from spin–lattice and spin–spin relaxation times. J Phys Chem A, 101, 3246–3250. [Google Scholar]
- CAVANAGH J, FAIRBROTHER W, PALMER A, SKELTON N & RANCE M 2006. Protein NMR Spectroscopy. 2 ed, Elsevier [Google Scholar]
- CROWE BL, LARUE RC, YUAN C, HESS S, KVARATSKHELIA M & FOSTER MP 2016. Structure of the Brd4 ET domain bound to a C-terminal motif from gamma-retroviral integrases reveals a conserved mechanism of interaction. Proc Natl Acad Sci U S A, 113, 2086–91. [DOI] [PMC free article] [PubMed] [Google Scholar]
- DE RAVIN SS, SU L, THEOBALD N, CHOI U, MACPHERSON JL, POIDINGER M, SYMONDS G, POND SM, FERRIS AL, HUGHES SH, MALECH HL & WU X 2014. Enhancers are major targets for murine leukemia virus vector integration. J Virol, 88, 4504–13. [DOI] [PMC free article] [PubMed] [Google Scholar]
- DE RIJCK J, DE KOGEL C, DEMEULEMEESTER J, VETS S, EL ASHKAR S, MALANI N, BUSHMAN FD, LANDUYT B, HUSSON SJ, BUSSCHOTS K, GIJSBERS R & DEBYSER Z 2013. The BET family of proteins targets moloney murine leukemia virus integration near transcription start sites. Cell Rep, 5, 886–94. [DOI] [PMC free article] [PubMed] [Google Scholar]
- DELAGLIO F, GRZESIEK S, VUISTER GW, ZHU G, PFEIFER J & BAX A 1995. NMRPipe: a multidimensional spectral processing system based on UNIX pipes. J Biomol NMR, 6, 277–93. [DOI] [PubMed] [Google Scholar]
- EISENBERG D, SCHWARZ E, KOMAROMY M & WALL R 1984. Analysis of membrane and surface protein sequences with the hydrophobic moment plot. J Mol Biol, 179, 125–42. [DOI] [PubMed] [Google Scholar]
- EL-GEBALI S, MISTRY J, BATEMAN A, EDDY SR, LUCIANI A, POTTER SC, QURESHI M, RICHARDSON LJ, SALAZAR GA, SMART A, SONNHAMMER ELL, HIRSH L, PALADIN L, PIOVESAN D, TOSATTO SCE & FINN RD 2019. The Pfam protein families database in 2019. Nucleic Acids Res, 47, D427–D432. [DOI] [PMC free article] [PubMed] [Google Scholar]
- FENG W, TEJERO R, ZIMMERMAN DE, INOUYE M & MONTELIONE GT 1998. Solution NMR structure and backbone dynamics of the major cold-shock protein (CspA) from Escherichia coli: evidence for conformational dynamics in the single-stranded RNA-binding site. Biochemistry, 37, 10881–96. [DOI] [PubMed] [Google Scholar]
- FRACZKIEWICZ R & BRAUN W 1998. Exact and efficient analytical calculation of the accessible surface areas and their gradients for macromolecules. J Computational Chemistry, 19, 319–333. [Google Scholar]
- GONNET GH, COHEN MA & BENNER SA 1992. Exhaustive matching of the entire protein sequence database. Science, 256, 1443–5. [DOI] [PubMed] [Google Scholar]
- GUNTERT P, MUMENTHALER C & WUTHRICH K 1997. Torsion angle dynamics for NMR structure calculation with the new program DYANA. J Mol Biol, 273, 283–98. [DOI] [PubMed] [Google Scholar]
- GUPTA SS, MAETZIG T, MAERTENS GN, SHARIF A, ROTHE M, WEIDNER-GLUNDE M, GALLA M, SCHAMBACH A, CHEREPANOV P & SCHULZ TF 2013. Bromo and ET domain (BET) chromatin regulators serve as co-factors for murine leukemia virus integration. J Virol, 87, 12721–12736. [DOI] [PMC free article] [PubMed] [Google Scholar]
- HAN X, PIAO L, ZHUANG Q, YUAN X, LIU Z & HE X 2018. The role of histone lysine methyltransferase NSD3 in cancer. Onco Targets Ther, 11, 3847–3852. [DOI] [PMC free article] [PubMed] [Google Scholar]
- HELLERT J, WEIDNER-GLUNDE M, KRAUSZE J, RICHTER U, ADLER H, FEDOROV R, PIETREK M, RUCKERT J, RITTER C, SCHULZ TF & LUHRS T 2013. A structural basis for BRD2/4-mediated host chromatin interaction and oligomer assembly of Kaposi sarcoma-associated herpesvirus and murine gammaherpesvirus LANA proteins. PLoS Pathog, 9, e1003640. [DOI] [PMC free article] [PubMed] [Google Scholar]
- HERRMANN T, GUNTERT P & WUTHRICH K 2002. Protein NMR structure determination with automated NOE-identification in the NOESY spectra using the new software ATNOS. J Biomol NMR, 24, 171–89. [DOI] [PubMed] [Google Scholar]
- HUANG YJ, ACTON TB & MONTELIONE GT 2014. DisMeta: a meta server for construct design and optimization. Methods Mol Biol, 1091, 3–16. [DOI] [PMC free article] [PubMed] [Google Scholar]
- HUANG YJ, MOSELEY HN, BARAN MC, ARROWSMITH C, POWERS R, TEJERO R, SZYPERSKI T & MONTELIONE GT 2005a. An integrated platform for automated analysis of protein NMR structures. Methods Enzymol, 394, 111–41. [DOI] [PubMed] [Google Scholar]
- HUANG YJ, POWERS R & MONTELIONE GT 2005b. Protein NMR recall, precision, and F-measure scores (RPF scores): structure quality assessment measures based on information retrieval statistics. J Am Chem Soc, 127, 1665–74. [DOI] [PubMed] [Google Scholar]
- HUANG YJ, ROSATO A, SINGH G & MONTELIONE GT 2012. RPF: a quality assessment tool for protein NMR structures. Nucleic Acids Res, 40, W542–6. [DOI] [PMC free article] [PubMed] [Google Scholar]
- HUANG YJ, TEJERO R, POWERS R & MONTELIONE GT 2006. A topology-constrained distance network algorithm for protein structure determination from NOESY data. Proteins, 62, 587–603. [DOI] [PubMed] [Google Scholar]
- II T, MULLEN JR, SLAGLE CE & BRILL SJ 2007. Stimulation of in vitro sumoylation by Slx5-Slx8: evidence for a functional interaction with the SUMO pathway. DNA Repair (Amst), 6, 1679–91. [DOI] [PMC free article] [PubMed] [Google Scholar]
- JANSSON M, LI Y-C, JENDEBERG L, ANDERSON S, MONTELIONE GT & NILSSON B 1996. High-level production of uniformly 15N- and 13C-enriched fusion proteins in Escherichia coli. J. Biomol. NMR, 7, 131–141. [DOI] [PubMed] [Google Scholar]
- JIN X, YAN Y, WANG D, DING D, MA T, YE Z, JIMENEZ R, WANG L, WU H & HUANG H 2018. DUB3 Promotes BET inhibitor resistance and cancer progression by deubiquitinating BRD4. Mol Cell, 71, 592–605 e4. [DOI] [PMC free article] [PubMed] [Google Scholar]
- KONUMA T, YU D, ZHAO C, JU Y, SHARMA R, REN C, ZHANG Q, ZHOU MM & ZENG L 2017. Structural mechanism of the oxygenase JMJD6 recognition by the Extraterminal (ET) domain of BRD4. Sci Rep, 7, 16272. [DOI] [PMC free article] [PubMed] [Google Scholar]
- LAFAVE MC, VARSHNEY GK, GILDEA DE, WOLFSBERG TG, BAXEVANIS AD & BURGESS SM 2014. MLV integration site selection is driven by strong enhancers and active promoters. Nucleic Acids Res, 42, 4257–69. [DOI] [PMC free article] [PubMed] [Google Scholar]
- LASKOWSKI RA, M. M. W., MOSS DS, THORNTON JM 1993. PROCHECK - a program to check the stereochemical quality of protein structures. J. Appl. Crystallogr, 26, 283–291. [Google Scholar]
- LEE W, BAHRAMI A, DASHTI HT, EGHBALNIA HR, TONELLI M, WESTLER WM & MARKLEY JL 2019. I-PINE web server: an integrative probabilistic NMR assignment system for proteins. J Biomol NMR, 73, 213–222. [DOI] [PMC free article] [PubMed] [Google Scholar]
- LEE W, TONELLI M & MARKLEY JL 2015. NMRFAM-SPARKY: enhanced software for biomolecular NMR spectroscopy. Bioinformatics, 31, 1325–7. [DOI] [PMC free article] [PubMed] [Google Scholar]
- LIU W, MA Q, WONG K, LI W, OHGI K, ZHANG J, AGGARWAL A & ROSENFELD MG 2013. Brd4 and JMJD6-associated anti-pause enhancers in regulation of transcriptional pause release. Cell, 155, 1581–1595. [DOI] [PMC free article] [PubMed] [Google Scholar]
- LIU W, XIE Y, MA J, LUO X, NIE P, ZUO Z, LAHRMANN U, ZHAO Q, ZHENG Y, ZHAO Y, XUE Y & REN J 2015. IBS: an illustrator for the presentation and visualization of biological sequences. Bioinformatics, 31, 3359–61. [DOI] [PMC free article] [PubMed] [Google Scholar]
- LOVELL SC, DAVIS IW, ARENDALL WB 3RD, DE BAKKER PI, WORD JM, PRISANT MG, RICHARDSON JS & RICHARDSON DC 2003. Structure validation by Calpha geometry: phi, psi and Cbeta deviation. Proteins, 50, 437–50. [DOI] [PubMed] [Google Scholar]
- LOVEN J, HOKE HA, LIN CY, LAU A, ORLANDO DA, VAKOC CR, BRADNER JE, LEE TI & YOUNG RA 2013. Selective inhibition of tumor oncogenes by disruption of super-enhancers. Cell, 153, 320–34. [DOI] [PMC free article] [PubMed] [Google Scholar]
- LOYOLA L, ACHUTHAN V, GILROY K, BORLAND G, KILBEY A, MACKAY N, BELL M, HAY J, AIYER S, FINGERMAN D, VILLANUEVA RA, CAMERON E, KOZAK CA, ENGELMAN AN, NEIL J & ROTH MJ 2019. Disrupting MLV integrase:BET protein interaction biases integration into quiescent chromatin and delays but does not eliminate tumor activation in a MYC/Runx2 mouse model. PLoS Pathog, 15, e1008154. [DOI] [PMC free article] [PubMed] [Google Scholar]
- MA B, TSAI CJ, HALILOGLU T & NUSSINOV R 2011. Dynamic allostery: linkers are not merely flexible. Structure, 19, 907–17. [DOI] [PMC free article] [PubMed] [Google Scholar]
- MA LC, GUAN R, HAMILTON K, ARAMINI JM, MAO L, WANG S, KRUG RM & MONTELIONE GT 2016. A Second RNA-Binding Site in the NS1 Protein of Influenza B Virus. Structure, 24, 1562–72. [DOI] [PMC free article] [PubMed] [Google Scholar]
- MADEIRA F, PARK YM, LEE J, BUSO N, GUR T, MADHUSOODANAN N, BASUTKAR P, TIVEY ARN, POTTER SC, FINN RD & LOPEZ R 2019. The EMBL-EBI search and sequence analysis tools APIs in 2019. Nucleic Acids Res, 47, W636–W641. [DOI] [PMC free article] [PubMed] [Google Scholar]
- MATHWORKS. https://www.mathworks.com/help/optim/ug/fminunc.html. [Accessed].
- MAZARI PM, LINDER-BASSO D, SARANGI A, CHANG Y & ROTH MJ 2009. Single-round selection yields a unique retroviral envelope utilizing GPR172A as its host receptor. Proc Natl Acad Sci U S A, 106, 5848–53. [DOI] [PMC free article] [PubMed] [Google Scholar]
- MITCHELL SF & LORSCH JR 2015. Protein affinity purification using Intein/Chitinbinding protein tags. Methods Enzymol, 559, 111–25. [DOI] [PubMed] [Google Scholar]
- MOSELEY HN, MONLEON D & MONTELIONE GT 2001. Automatic determination of protein backbone resonance assignments from triple resonance nuclear magnetic resonance data. Methods Enzymol, 339, 91–108. [DOI] [PubMed] [Google Scholar]
- MOSELEY HN, SAHOTA G & MONTELIONE GT 2004. Assignment validation software suite for the evaluation and presentation of protein resonance assignment data. J Biomol NMR, 28, 341–55. [DOI] [PubMed] [Google Scholar]
- PAPALEO E, SALADINO G, LAMBRUGHI M, LINDORFF-LARSEN K, GERVASIO FL & NUSSINOV R 2016. The role of protein loops and linkers in conformational dynamics and allostery. Chem Rev, 116, 6391–423. [DOI] [PubMed] [Google Scholar]
- PETTERSEN EF, GODDARD TD, HUANG CC, COUCH GS, GREENBLATT DM, MENG EC & FERRIN TE 2004. UCSF Chimera--a visualization system for exploratory research and analysis. J Comput Chem, 25, 1605–12. [DOI] [PubMed] [Google Scholar]
- PIAI A, CALCADA EO, TARENZI T, GRANDE AD, VARADI M, TOMPA P, FELLI IC & PIERATTELLI R 2016. Just a flexible linker? The structural and dynamic properties of CBP-ID4 revealed by NMR spectroscopy. Biophys J, 110, 372–381. [DOI] [PMC free article] [PubMed] [Google Scholar]
- RAHMAN S, SOWA ME, OTTINGER M, SMITH JA, SHI Y, HARPER JW & HOWLEY PM 2011. The Brd4 extraterminal domain confers transcription activation independent of pTEFb by recruiting multiple proteins, including NSD3. Mol Cell Biol, 31, 2641–52. [DOI] [PMC free article] [PubMed] [Google Scholar]
- ROSSI P, SWAPNA GV, HUANG YJ, ARAMINI JM, ANKLIN C, CONOVER K, HAMILTON K, XIAO R, ACTON TB, ERTEKIN A, EVERETT JK & MONTELIONE GT 2010. A microscale protein NMR sample screening pipeline. J Biomol NMR, 46, 11–22. [DOI] [PMC free article] [PubMed] [Google Scholar]
- SCHNEIDER WM, TANG Y, VAIPHEI ST, MAO L, MAGLAQUI M, INOUYE M, ROTH MJ & MONTELIONE GT 2010. Efficient condensed-phase production of perdeuterated soluble and membrane proteins. . J. Struct. Funct. Genomics, 11, 143–154. [DOI] [PMC free article] [PubMed] [Google Scholar]
- SHARMA A, LARUE RC, PLUMB MR, MALANI N, MALE F, SLAUGHTER A, KESSL JJ, SHKRIABAI N, COWARD E, AIYER SS, GREEN PL, WU L, ROTH MJ, BUSHMAN FD & KVARATSKHELIA M 2013. BET proteins promote efficient murine leukemia virus integration at transcription start sites. Proc Natl Acad Sci U S A, 110, 12036–12041. [DOI] [PMC free article] [PubMed] [Google Scholar]
- SHEN Y & BAX A 2013. Protein backbone and sidechain torsion angles predicted from NMR chemical shifts using artificial neural networks. J Biomol NMR, 56, 227–41. [DOI] [PMC free article] [PubMed] [Google Scholar]
- SIEVERS F & HIGGINS DG 2018. Clustal Omega for making accurate alignments of many protein sequences. Protein Sci, 27, 135–145. [DOI] [PMC free article] [PubMed] [Google Scholar]
- SIEVERS F, WILM A, DINEEN D, GIBSON TJ, KARPLUS K, LI W, LOPEZ R, MCWILLIAM H, REMMERT M, SODING J, THOMPSON JD & HIGGINS DG 2011. Fast, scalable generation of high-quality protein multiple sequence alignments using Clustal Omega. Mol Syst Biol, 7, 539. [DOI] [PMC free article] [PubMed] [Google Scholar]
- SIPPL MJ 1993. Recognition of errors in three-dimensional structures of proteins. Proteins, 17, 355–62. [DOI] [PubMed] [Google Scholar]
- STUART A, BORZILLERI K, WITHKA J & PALMER A 1999. Compensating for variations in 1H-13C scalar coupling constants in isotope-filtered NMR experiments J Am Chem Soc. , 121, 5346–7. [Google Scholar]
- TEJERO R, SNYDER D, MAO B, ARAMINI JM & MONTELIONE GT 2013. PDBStat: a universal restraint converter and restraint analysis software package for protein NMR. J Biomol NMR, 56, 337–51. [DOI] [PMC free article] [PubMed] [Google Scholar]
- VAN ROSMALEN M, KROM M & MERKX M 2017. Tuning the flexibility of glycine-serine linkers to allow rational design of multidomain proteins. Biochemistry, 56, 6565–6574. [DOI] [PMC free article] [PubMed] [Google Scholar]
- WAI DCC, SZYSZKA TN, CAMPBELL AE, KWONG C, WILKINSON-WHITE LE, SILVA APG, LOW JKK, KWAN AH, GAMSJAEGER R, CHALMERS JD, PATRICK WM, LU B, VAKOC CR, BLOBEL GA & MACKAY JP 2018. The BRD3 ET domain recognizes a short peptide motif through a mechanism that is conserved across chromatin remodelers and transcriptional regulators. J Biol Chem, 293, 7160–7175. [DOI] [PMC free article] [PubMed] [Google Scholar]
- WEN Y, DICK RA, FEIGENSON GW & VOGT VM 2016. Effects of membrane charge and order on membrane binding of the retroviral structural protein Gag. J Virol, 90, 9518–32. [DOI] [PMC free article] [PubMed] [Google Scholar]
- WILSON MD, RENAULT L, MASKELL DP, GHONEIM M, PYE VE, NANS A, RUEDA DS, CHEREPANOV P & COSTA A 2019. Retroviral integration into nucleosomes through DNA looping and sliding along the histone octamer. Nat Commun, 10, 4189. [DOI] [PMC free article] [PubMed] [Google Scholar]
- WU X, LI Y, CRISE B & BURGESS SM 2003. Transcription start regions in the human genome are favored targets for MLV integration. Science, 300, 1749–51. [DOI] [PubMed] [Google Scholar]
- ZHANG Q, ZENG L, SHEN C, JU Y, KONUMA T, ZHAO C, VAKOC CR & ZHOU MM 2016. Structural mechanism of transcriptional regulator NSD3 recognition by the ET domain of BRD4. Structure, 24, 1201–8. [DOI] [PMC free article] [PubMed] [Google Scholar]
- ZIMMERMAN DE, KULIKOWSKI CA, HUANG Y, FENG W, TASHIRO M, SHIMOTAKAHARA S, CHIEN C, POWERS R & MONTELIONE GT 1997. Automated analysis of protein NMR assignments using methods from artificial intelligence. J Mol Biol, 269, 592–610. [DOI] [PubMed] [Google Scholar]
Associated Data
This section collects any data citations, data availability statements, or supplementary materials included in this article.
Supplementary Materials
Data Availability Statement
BMRB and PDB accession numbers for the structures reported in this paper are: BRD3 ET PDB: 7JMY, BMRB: 30782; BRD 3ET : MLV IN TP PDB: 7JQ8, BMRB: 30786; BRD3 ET : MLV IN CTD PDB: 7JYZ, BMRB: 30791; BRD3 ET : NSD3 PDB: 7JYN, BMRB: 30790.