

Abstract
Fluorescence in situ hybridization (FISH) allows researchers to visualize the spatial position and quantity of nucleic acids in fixed samples. Recently, considerable progress has been made in developing oligonucleotide (oligo)-based FISH methods that have enabled researchers to study the three-dimensional organization of the genome at super-resolution and visualize the spatial patterns of gene expression for thousands of genes in individual cells. However, there are few existing computational tools to support the bioinformatics workflows necessary to carry out these experiments utilizing oligo FISH probes. Here, we introduce Paint Server and Homology Optimization Pipeline (PaintSHOP), an interactive platform for the design of oligo FISH experiments. PaintSHOP enables researchers to identify probes for their experimental targets efficiently, to incorporate additional necessary sequences such as primer pairs, and to easily generate files documenting library design. PaintSHOP democratizes and standardizes the process of designing complex probe sets for the oligo FISH community.
Editor’s summary
Paint Server and Homology Optimization Pipeline (PaintSHOP), an interactive platform for the design of oligo FISH experiments, democratizes and standardizes the process of designing complex probe sets for the oligo FISH community.
Introduction
Fluorescence in situ hybridization (FISH) is a powerful technique that allows researchers to visualize the distribution of RNA and DNA at single-cell resolution in fixed samples. Since the introduction of in situ hybridization in 19691 and the subsequent development of FISH2–4, the method has continued to be used, updated, and refined as new technologies have become available. Recent advances in DNA sequencing and synthesis technologies have spurred the development of a new generation of advanced FISH techniques that utilize oligonucleotide (oligo) libraries as a source of probe material. Oligo FISH probes offer many advantages compared to conventional probes derived directly from genomic material, as they can be optimized to have specific thermodynamic properties, engineered to bind to precisely defined targets while avoiding repetitive sequences, and programmed to utilize a variety of labeling and detection schemes. Researchers have visualized multicopy targets such as repetitive DNA5–7 and mRNA8–10 using ‘probe sets’ composed of one to a few dozen individually synthesized oligo ‘probe’ species. Approaches have also been developed to leverage complex oligo libraries created by massively parallel array synthesis11 to perform oligo FISH experiments targeting single-copy chromosomal regions12–14. The use of complex oligo libraries has enabled massively multiplexed DNA FISH experiments15–20 and spatial transcriptomics approaches targeting hundreds to thousands of individual mRNA molecules21–23.
While many experimental advances have been made using oligo FISH probes, comparatively little progress has been made in developing computational tools that support the design of these probes and probe sets. Several computational tools exist for various related problems such as designing oligo probes against targets such as bacterial rRNA24,25, large pools of oligo pairs26–29, padlock probes30,31, or for microarrays32. Previously, we introduced OligoMiner33, a bioinformatic pipeline developed to address the bottleneck of computationally designing probe sequences for Oligopaints and other oligo-based FISH approaches. Additionally, a bioinformatic resource called iFISH and the related ‘ifpd’ Python package34 were created to design “spotting probe” sets that tile along individual chromosomes or to retrieve probe sets targeting individual regions from a collection of pre-discovered probes. Most recently, a MATLAB-based program called ProbeDealer35 was introduced to support the de novo design of probe sets for MERFISH and chromosome walking experiments with a limited number of configurations. However, when it comes to supporting a wide degree of experimental designs and the necessary steps required to generate complete probe sets, these existing tools either require considerable bioinformatics expertise or lack the scalability and flexibility needed to complete the desired design workflows. To our knowledge, no framework exists to solve common problems such as the freeform appending of additional necessary sequences to probe sequences like primer pairs for PCR amplification to support a broad range of experimental designs or the batched construction of probe sets against multiple targets in parallel.
Here, we introduce Paint Server and Homology Optimization Pipeline (PaintSHOP), a platform that enables the interactive design of oligo-based FISH experiments at transcriptome- and genome-scale. PaintSHOP consists of two components: 1) a bioinformatic pipeline and resulting large-scale collection of over 298 million primary oligo probe sequences targeting the genomes and transcriptomes of 9 different experimental organisms 2) an interactive web application that facilitates the automated creation of ready-to-order probe sets against any target in the genome or transcriptome (paintshop.io) with user-specified patterns. The result is an open source, freely available community resource that bridges the gap between probe set design and experiment.
Results
Interactive probe set construction with PaintSHOP.
The computational design of an oligo-based RNA or DNA FISH experiment consists of two distinct phases. In the first phase, the sequence of a genome assembly is processed by a probe discovery algorithm such as OligoArray14,32,35, the Perl-based OligoPicker used to generate the iFISH probe database34, the command-line version of OligoMiner33, or the web-based OligoMinerApp36 that wraps the OligoMiner scripts into a graphical user interface to identify probe sequences with specified thermodynamic properties that are predicted to be specific (Fig. 1a and Supplementary Table 1). Such design algorithms typically consider length, GC content, melting temperatures, the presence of undesirable sequence stretches such as homopolymeric runs, and the propensity to form secondary structure32,33. In the second phase, these ‘primary’ probes, which often are designed at the scale of entire genomes, are processed into one or more probe sets that can be ordered from a vendor and processed as needed in vitro prior to being deployed in a hybridization reaction (Fig. 1a). While the minimum and optimal number of probes in a set will vary depending on the experimental set-up, sample type, and detection optics used, we would generally recommend using sets of >20 probes spanning a target of >400 nucleotides (nt) for RNA FISH10,37 and sets of >200 probes spanning a target of >10 kilobases (kb) for DNA FISH14. Probe sets can also be designed to consider spacing between individual probes34 (Supplementary Table 1). PaintSHOP collectively supports both design phases. Primary probes can be discovered de novo with the PaintSHOP pipeline (github.com/beliveau-lab/PaintSHOP_pipeline), which uses OligoMiner33 scripts wrapped in Snakemake38. The resulting genome-scale probe collections and pre-existing collections discovered with OligoArray, OligoMiner and iFISH are then placed in a cloud-based database which can be accessed by the PaintSHOP web application (Table 1 and Supplementary Figure 1).
Fig. 1 |. The PaintSHOP workflow.
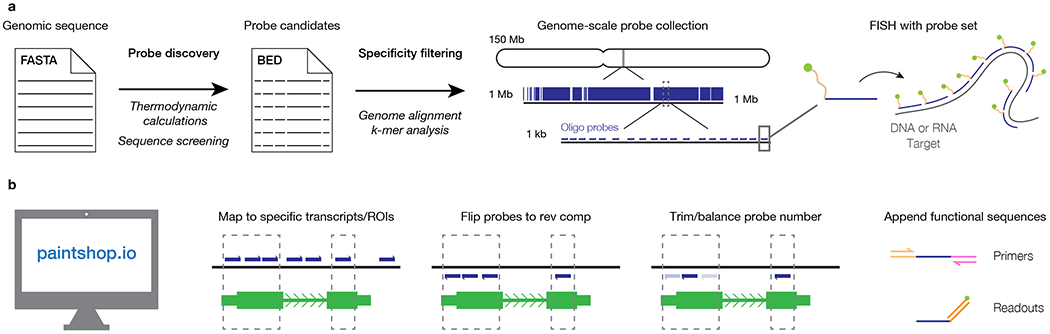
a, Overview of the genome-scale FISH probe collection design process. b, Overview the probe set creation functionality of the PaintSHOP web application.
Table 1:
Description of the genome-scale probe collections hosted on the PaintSHOP web application.
| Collection name | Organism | Genome assembly | Number of probes | Probe length (nt) | Probe Tm range (ºC) | Probe %GC (mean ± sd) | Reference |
|---|---|---|---|---|---|---|---|
| 2012 Oligopaints hg19 | Human | hg19 | 29,147,070 | 32 | 34.2–49.7 | 43.6 ± 7.1 | Beliveau et al. 2012 |
| OligoMiner hg19 balance | Human | hg19 | 15,411,378 | 35–41 | 42.0–47.0 | 46.6 ± 6.2 | Beliveau et al. 2018 |
| OligoMiner hg38 balance | Human | hg38 | 15,271,724 | 35–41 | 42.0–47.0 | 46.6 ± 6.2 | Beliveau et al. 2018 |
| iFISH4U 40-mer hg19 | Human | hg19 | 25,127,787 | 40 | 34.1–59.8 | 49.6 ± 9.3 | Gelali et al. 2019 |
| hg19 newBalance | Human | hg19 | 32,139,623 | 30–37 | 42.0–47.0 | 50.4 ± 6.8 | This study |
| hg38 newBalance | Human | hg38 | 32,307,382 | 30–37 | 42.0–47.0 | 50.4 ± 6.8 | This study |
| mm9 newBalance | Mouse | mm9 | 33,637,090 | 30–37 | 42.0–47.0 | 49.9 ± 6.1 | This study |
| mm10 newBalance | Mouse | mm10 | 33,811,899 | 30–37 | 42.0–47.0 | 49.9 ± 6.1 | This study |
| ce11 newBalance | C. elegans | ce11 | 972,051 | 30–37 | 42.0–47.0 | 47.5 ± 5.5 | This study |
| dm6 newBalance | Drosophila | dm6 | 2,265,271 | 30–37 | 42.0–47.0 | 50.5 ± 6.8 | This study |
| danRer11 newBalance | Zebrafish | danRer11 | 11,331,424 | 30–37 | 42.0–47.0 | 48.1 ± 5.8 | This study |
| TAIR10 newBalance | Arabidopsis | TAIR10 | 1,197,178 | 30–37 | 42.0–47.0 | 47.3 ± 4.9 | This study |
| sacCer3 newBalance | S. cerevisiae | sacCer3 | 146,574 | 30–37 | 42.0–47.0 | 46.7 ± 4.5 | This study |
| rn6 newBalance | Rat | rn6 | 36,842,993 | 30–37 | 42.0–47.0 | 50.0 ± 6.2 | This study |
| galGal5 newBalance | Chicken | galGal5 | 14,209,650 | 30–37 | 42.0–47.0 | 49.6 ± 6.5 | This study |
| galGal6 newBalance | Chicken | galGal6 | 14,767,514 | 30–37 | 42.0–47.0 | 49.8 ± 6.7 | This study |
The PaintSHOP web application provides an interactive framework for all facets of the probe set construction process. Users can use the PaintSHOP web application to: 1) retrieve the probes covering their RNA/DNA target(s); 2) ensure the probe sequences have the desired strand orientation; 3) consider trimming or unifying the number of probes per target in their sets; 4) append the necessary primers and barcode sequences for their experimental design (Fig. 1b). The PaintSHOP web application is designed to be modular and flexible, enabling a researcher to use only the features required for their experiment. Use cases can range from simply retrieving probes for a single RNA or DNA target to designing multi-target experiments with complex codebooks22. PaintSHOP is designed for users to be able to retrieve probes for their target from one of the 16 hosted genome-scale probe collections (Table 1), to optimize their set by adding or removing probes if necessary, to append primer and barcode sequences from 13 published and newly introduced sets that are designed to be orthogonal to the genomes of commonly used experimental organisms (Supplementary Table 2), and to generate an order file. For retrieving probes, users have the choice between two approaches: 1) RNA probe design and 2) DNA probe design. The RNA probe design option allows a user to either manually enter a list of RefSeq annotations or upload a file of annotations and returns the probes that cover the inputted targets. The DNA design option accepts BED39 coordinates (chromosome, start coordinate, stop coordinate) either entered manually or uploaded from a file (Supplementary Figure 2). Each of these set construction operations takes only a few seconds, allowing users to interactively implement both simple and complicated design schemes in a matter of minutes or less using our web-based interface.
Probe set construction options
Once users have retrieved the probes for their target(s), they have the option to use several features to optimize the probe set returned. One important feature that assists with set construction is the ability to tune several probe specificity parameters, enabling precise control over the inherent tradeoff between coverage and specificity (Supplementary Figure 3). To this end, we have created a ‘Homology Optimization Pipeline’ that employs an updated machine learning model to generate a quantitative prediction of both on-target and off-target binding for every candidate probe in all of the probe sets hosted by our web application (Supplementary Figure 4). This machine learning model builds upon our earlier work using a machine learning classifier33 to approximate the outcome of performing analytical thermodynamic calculations in NUPACK8,40–42, which provides in-depth information about the predicted behavior of nucleic acid systems but would be prohibitively slow if deployed for genome-scale probe set design. The machine learning model works by estimating the duplexing probability generated by NUPACK pairwise test-tube simulations based on numerical features computed from the pairwise alignments (Supplementary Figure 4). The underlying predictor is an XGBoost43 Regressor, which was selected as the highest performing model after an automated evaluation of the >100 supervised learning, unsupervised learning, and dataset transformation models present in the Python scikit-learn library44 by the TPOT45,46 genetic search algorithm. The model predictions achieved a root-mean-square error (RMSE) score of 0.0657, and the score between actual and predicted values on the test set (n = 101,704) was 0.974 (Supplementary Figure 4). Importantly, the ability to accurately predict the pairwise duplexing probability without directly computing NUPACK simulations is what makes the large-scale modeling of off-target binding computationally feasible. For example, as part of this work we computed >140,000,000 duplex predictions in less than one day using a computing cluster, the direct computation of which would have taken more than ~32 days with a similar number of continuously running cluster jobs. The ability to make quantitative binding predictions at scale that can be directly compared thus allows the direct comparison of predicted specificities between different probes; this type of comparison is not possible using our previously reported classifier model. On the PaintSHOP web application, researchers can interactively use these predictions to tune their probe sets by setting a maximum predicted ‘Off-Target Score’—this value is the sum of the predicted duplexing probabilities at all off target sites for a given probe, multiplied by 100. Additionally, users can interactively limit the maximum occurrence of the set of 18-mers contained in each probe sequence using ‘Max K-mer Count’, as duplexes between k-mers on this length scale have been predicted to have thermodynamically relevant binding energies in the FISH assay conditions33. Users can also select whether or not to allow the inclusion of repeat-masked47 sequences that have been annotated as being similar to highly reiterated genomic sequences in their probes. Collectively, these parameters enable users to interactively explore how specificity scores impact the number of probes covering their targets through a dynamically updating interface and potentially make trade-offs between the number of probes in the final probe set and their level of predicted specificity. This trade-off can be important as some probe collections hosted by the PaintSHOP web application have probes with ranges of predicted specificities for users to choose from (Fig. 2); in some cases, users may elect to choose a smaller population of highly specific probes, while in others where probe number is limiting or background is less problematic users may opt for all available probes.
Fig. 2 |. Probe counts for each human probe collection included in PaintSHOP.
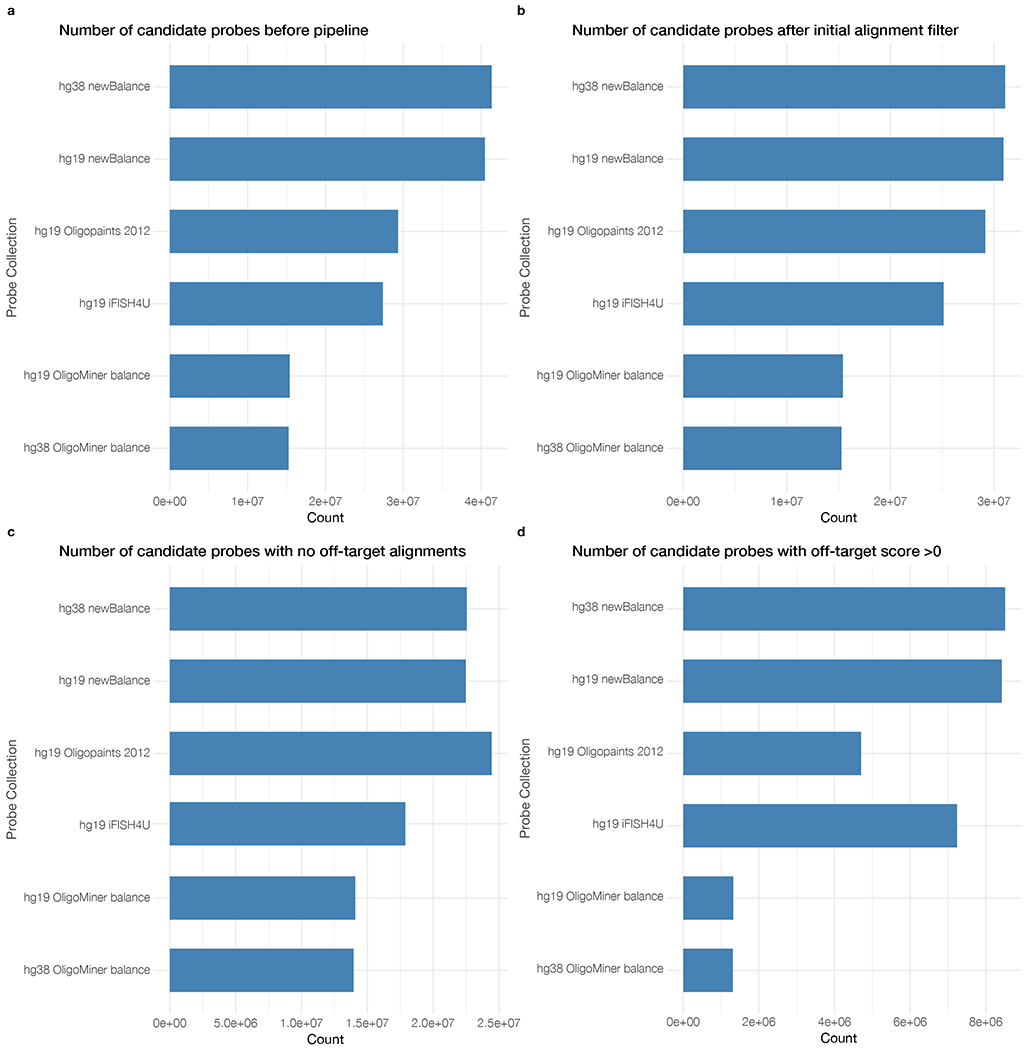
a, Counts of the number of candidate probes before any downstream processing was performed. b, The number of candidates after filtering for probes with greater than 100 off-target alignments. c, The number of remaining probes with no off-target alignments. d, The number of remaining probes with between 1 and 100 off-target alignments.
While PaintSHOP enables control of specificity parameters to selectively increase target coverage, another common scenario in probe design is that the user has a desired number of oligos per probe set to help unify signal intensity and/or to facilitate barcoding and detection schemes, as is common in applications such as MERFISH22 and chromosome walking15,16,18 experiments. In the best-case scenario, there are an excess of suitable probes at each target site. In this case, users can implement the PaintSHOP “trim” feature that simply rank orders the probes for each target based on their predicted specificity and selects from this ranked list in order until the desired number of probes is reached. In other cases, some or all of the targets may have fewer probes than desired. In this case, users can implement the PaintSHOP “unify number” feature. When using “unify number”, targets with a surplus of suitable probes have the desired number chosen using exactly the same logic as used in the “trim” feature, while targets with too few probes have their specificity parameters selectively relaxed until either the desired number is reached or the maximum possible number—being less than the target number—are returned.
A core advantage of oligo-based FISH is the precise control over the composition of the probe sequences that it provides, allowing for the incorporation of primer sequences and barcodes. For example, the Oligopaints14 technology requires the addition of PCR primer sequences to the 5’ and 3’ ends of the sequence homologous to the FISH target. The incorporation of primers enables the amplification of ssDNA oligo probes from the oligo library. Additionally, it is possible to incorporate region specific primers, allowing for more advanced imaging experiments such as “chromosome tracing”48 via sequential hybridization. In similar fashion to DNA FISH, advanced RNA FISH methods require the incorporation of multiple sequences in addition to the region homologous to the target into the final probe sequences. For example, spatial transcriptomics technologies such as MERFISH22 and seqFISH+49 require the addition of “barcode” sequences and “readout” sequences in order to perform more complicated experiments with many targets requiring successive hybridization. Similarly, SABER37, a molecular toolkit for FISH signal amplification and sequential hybridization, requires a Primer Exchange Reaction50 (PER) primer to be appended to the 3’ end of an oligo probe.
In order to accommodate a wide variety of oligo FISH technologies, PaintSHOP includes a flexible user interface for performing appending operations (Supplementary Figure 5). Through the interface it is possible to append up to three sequences to both the 5’ and 3’ end of each probe. For each sequence appended, the user can choose from a variety of encoding schemes. A detailed documentation of how to use these appending options and all of the other interactive functions on the PaintSHOP web application can be found at https://paintshop.io/user_guide/ and in Supplementary Note 1. In the simplest case, a selected sequence can be appended to all probes in a given probe set (Supplementary Figure 5). For example, a researcher can add the same 5’ primer to each probe in the set. PaintSHOP also allows a user to append a unique sequence to the probes for each target in a set (Supplementary Figure 5). Using the same example, this would mean that a unique 5’ primer would be appended to the probes for each target in a set. To add addition flexibility, users can also add multiple sequences to a single position per target (Supplementary Figure 5) or specify an entirely custom configuration. It is possible to quickly use PaintSHOP sequences provided for each position, or to upload a custom set of sequences to append. Collectively, the features in the flexible PaintSHOP appending interface can support a wide variety of oligo FISH technologies and experimental designs.
In addition to the general appending functionality, PaintSHOP provides built-in support for appending bridge sequences according to a MERFISH22 codebook. With this feature, users can upload a set of MHD4 16-bit barcodes to use with their RNA FISH targets. PaintSHOP automatically generates valid MERFISH probe sets by parsing the barcodes provided and handling the incorporation of the encoded bridge sequences into the probe sequences for each target. To demonstrate this feature, PaintSHOP was used with a set of 90 RNA FISH targets and barcodes (Supplementary Data 1, 2) and a set of 16 readout sequences (Supplementary Data 3) to create an order file for a MERFISH experiment (Supplementary Data 4). Using the hg38 newBalance probe set with default PaintSHOP parameters, the targets had an average of 65.9 probes covering them (Supplementary Figure 6). Additionally, as the targets for MERFISH and other highly multiplexed RNA FISH experiments are often chosen based on single-cell RNA sequencing datasets that do not generally have the ability to resolve the specific isoform(s) that map to a given cell, we have introduced ‘isoform flattened’ versions of the RefSeq annotations for each of the genome assemblies hosted on the PaintSHOP web application. These ‘isoform flattened’ annotation sets prioritize shared exonic sequence between isoforms (Methods) in order to maximize the chance of detection and only modestly reduce the coverage of the transcriptome when used for probe intersects (Fig. 3a). Collectively, these new resources will streamline the design and practical implementation of spatial transcriptomic experiments.
Fig. 3 |. Transcriptome and genome coverage of probe collections.
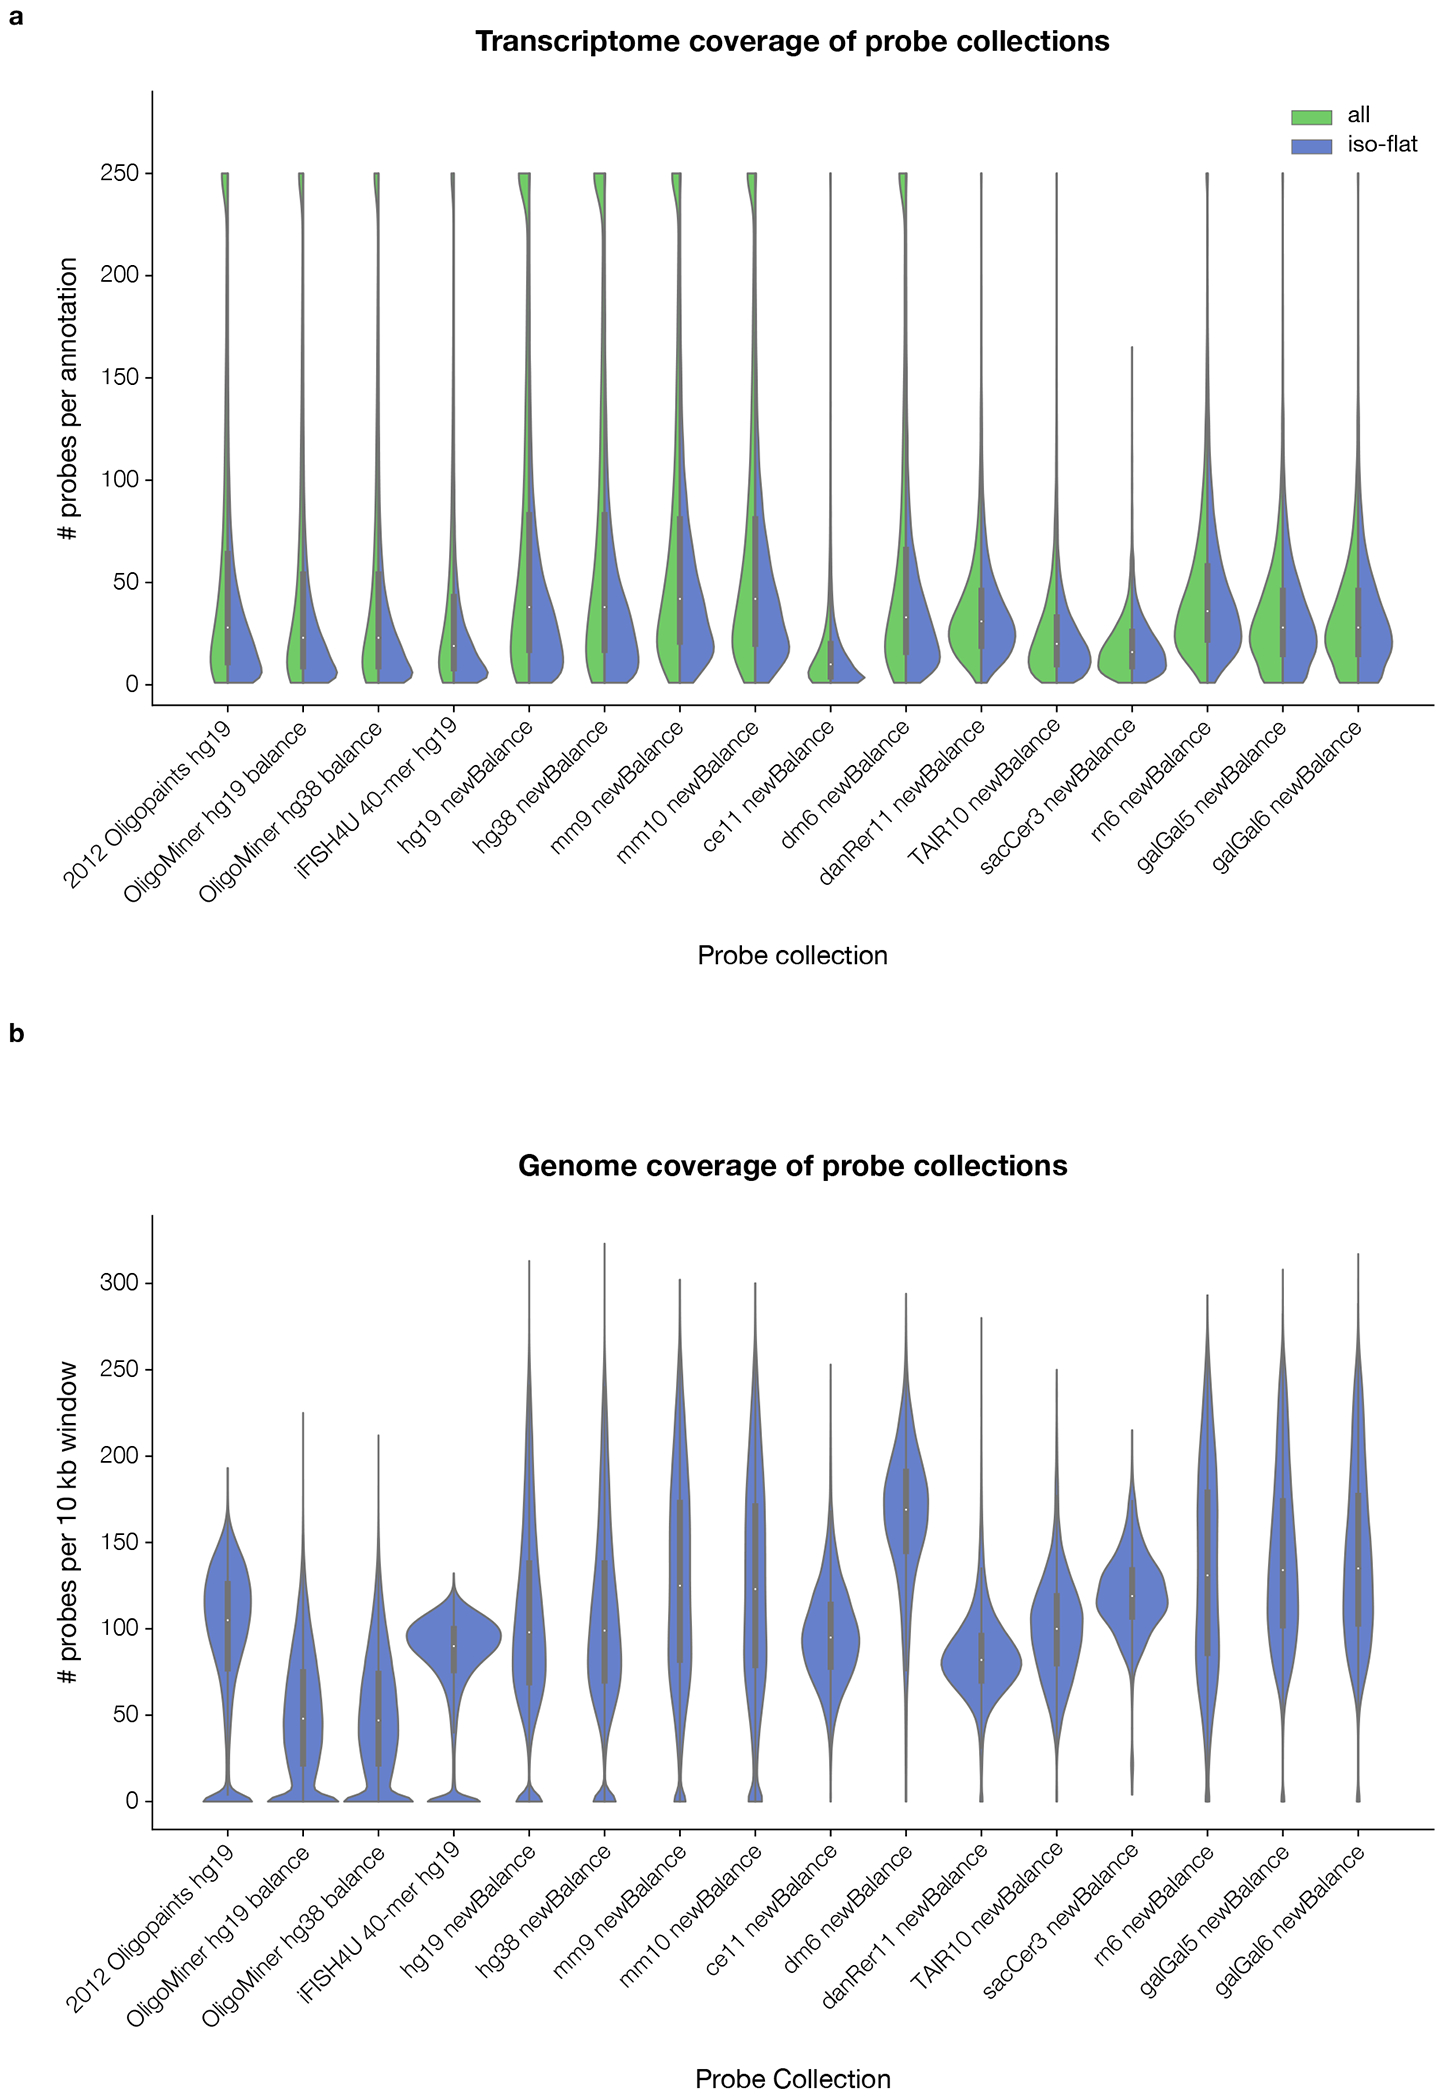
a, The number of probes per RefSeq transcript annotation (”all”; green, left side of violins) or isoform-flattened RefSeq gene annotation (”iso-flat”; blue, right side of violins) in the genome-scale probe collections hosted by PaintSHOP. Annotations with >250 probes were plotted with a value of 250 to simplify presentation. b, The number of probes per 10-kilobase window in the genome-scale probe collections hosted by PaintSHOP. Each genome was split into adjacent (i.e. non-overlapping) windows. Violin plots in a, b show a kernel density estimation (blue, green) along with traditional boxplot elements: median—white dot, quartiles 2 and 3—thick black box, quartile 1 value − 1.5 * (quartile 3 value – quartile 1 value)—lower bound of black line, quartile 3 value + 1.5 * (quartile 3 value – quartile 1 value)—upper bound of black line. The minimum value of the kernel density estimation was set to 0 for display purposes. In a, annotations with >250 probes mapping to them had their value set to ‘250’ for display purposes.
The final core feature of the PaintSHOP web application is the download functionality provided. Once a researcher has taken advantage of the features necessary for the design of their FISH experiment, they can freely download all the information necessary for a successful order of their designed library. Additionally, we provide several optional download files that promote reproducibility and clear documentation of design decisions made and primers used. The generation of these files takes only seconds, and their download time would typically be seconds to tens of seconds based on the user’s internet connection speed. By providing features for probe retrieval, set balancing and trimming, sequence appending, and the free download of completed designs, PaintSHOP aims to be the first comprehensive resource for the design of complex oligo FISH experiments.
The PaintSHOP probe collections
The PaintSHOP web application hosts four previously published and experimentally validated genome-scale probe collections for the human hg19 and hg38 genome assemblies14,33,34 (Table 1). In addition, we have also used the PaintSHOP pipeline (http://github.com/beliveau-lab/PaintSHOP_pipeline) to perform de novo probe discovery to augment these pre-existing collections with a group of novel collections (Supplementary Figure 7). Specifically, we first performed a systematic search for probe sequence parameters that increased the total number of candidates identified using thermodynamic settings used in our previously reported “Balance” probe collections (Tm 42–47ºC)33, but expanded the probe length range from 6 nt to 8 nt and used the entirety of the human hg38 to optimize the selection of the length range, whereas only 3 Mb of the hg38 chromosome X were used for length range selection in “Balance”33. This search culminated in the creation of the “newBalance” probe sets for all of the genome assemblies hosted on the PaintSHOP web application (Table 1). The newBalance probe sets have a new minimum and maximum probe length window of 30-37, and can include repeat-masked51 bases. These changes allow users to optionally include these sequences in their design if it is necessary to increase the number of possible probe candidates covering their target of interest, which can be particularly valuable for RNA FISH where repetitive sequences are less of a concern and finding enough quality probes can be challenging. We have used NUPACK52 to predict the secondary structure formation of all 16 genome-scale probe collections hosted by PaintSHOP, giving users an additional feature that can be used to tune the number of probes returned by the web application. We have validated that newBalance probes behave as expected in situ by targeting the ADAMTS5 mRNA in human kidney mesangial cells (Supplementary Figure 8 and Supplementary Table 3).
While tools exist to efficiently generate genome-scale sets of oligo probes33,34, to the best of our knowledge no comprehensive database exists to connect the coordinates of the discovered probes with the location of reference annotations such as RefSeq. We set out to create this resource in order to greatly reduce the computational difficulty of retrieving probes for single-molecule FISH10 (smFISH) experiments with multiple targets. Leveraging the ability to perform fast intersection operations on genomic coordinates with BEDTools53, we developed a flexible approach to intersect any probe set stored in Browser Extendible Data (BED) format39 with any annotation set for the assembly. This database enables the retrieval of the probes for an arbitrary number of targets with a simple lookup operation rather than performing a large number of manual intersections to retrieve probes for each target. We have used our approach to intersect the 16 genome-scale probe collections hosted by the PaintSHOP web application (Table 1) with the corresponding RefSeq and isoform-flattened annotations for each collection, producing a two transcriptome-scale subsets. We observe high transcriptome (Fig. 3a) and genome coverage (Fig. 3b) across all 16 collections, giving users a range of options to choose from based on their experimental needs. Importantly, our web application is agnostic to which probe set is used, thus allowing users to harness our newly developed newBalance probes, a number existing of publicly available probe collections, and any additional probe collections that may be released at a future date.
Programming multiplexed FISH experiments with PaintSHOP
In order to demonstrate the effectiveness of PaintSHOP for the design of multiplexed FISH experiments, we designed an oligo library to perform 30-target FISH on the human X chromosome. Specifically, we first selected 30 200 kb windows spaced roughly evenly across the entirety of the X chromosome (range 4.8–6.0 Mb separation, mean 5.2 Mb separation; Supplementary Table 4). We created a BED file containing these regions and uploaded it to PaintSHOP webserver using the ‘DNA Probe Design’ mode (Supplementary Note 2). We then employed the ‘Trim’ option to automatically select sets of exactly 1,000 probes that mapped to each of our 30 target regions (Supplementary Note 2). Finally, we used the ‘Append Sequences’ feature to add a distinct 42 nt ‘bridge’ sequence37 to each of the 30 probe sets as well as a universal pair of forward and reverse primers to allow all 30 probe sets to be amplified and processed in parallel (Supplementary Note 2 and Supplementary Data 5).
The unique bridge sequence per-target barcoding scheme designed by PaintSHOP allows for each target to be read out using any available fluorescent channel, which in turn enables the programming of color patterns that span the length of the chromosome (Fig. 4a). In order to showcase this capability, we designed two distinct chromosome-scale targeting patterns, with both being visualized by DNA-SABER37 via the recruitment of a specified SABER sequence at each site that facilitated the docking of ATTO 488, ATTO 565, or Alexa Fluor 647 labeled imager oligos as in our previous chromosome-scale DNA-SABER experiments37. In the first pattern, we programmed a three-color “side-by-side” pattern in which the first 10 target regions starting at on the distal end of the p arm were labeled with ATTO 565 (Fig. 4b, magenta), the middle 10 target regions were labeled with Alexa Fluor 647 (Fig. 4b, yellow), and the last 10 target regions ending at the distal end of the q arm were labeled with ATTO 488 (Fig. 4b, cyan). In the second pattern, we programmed a three-color “repeat” pattern where every third target starting with the first was labeled with labeled with ATTO 565 (Fig. 4c, magenta), every third target starting with the second was labeled with labeled with Alexa Fluor 647 (Fig. 4c, yellow), and every third target starting with the third was labeled with ATTO 488 (Fig. 4c, cyan). We performed DNA FISH using these patterns on XX 46N human metaphase chromosome spreads and in both cases observed specific staining patterns that matched our programmed designs (Fig. 4b,c), demonstrating the ability of PaintSHOP to facilitate the design of multiplexed FISH experiments.
Fig. 4 |. Multiplexed DNA FISH programmed by PaintSHOP.
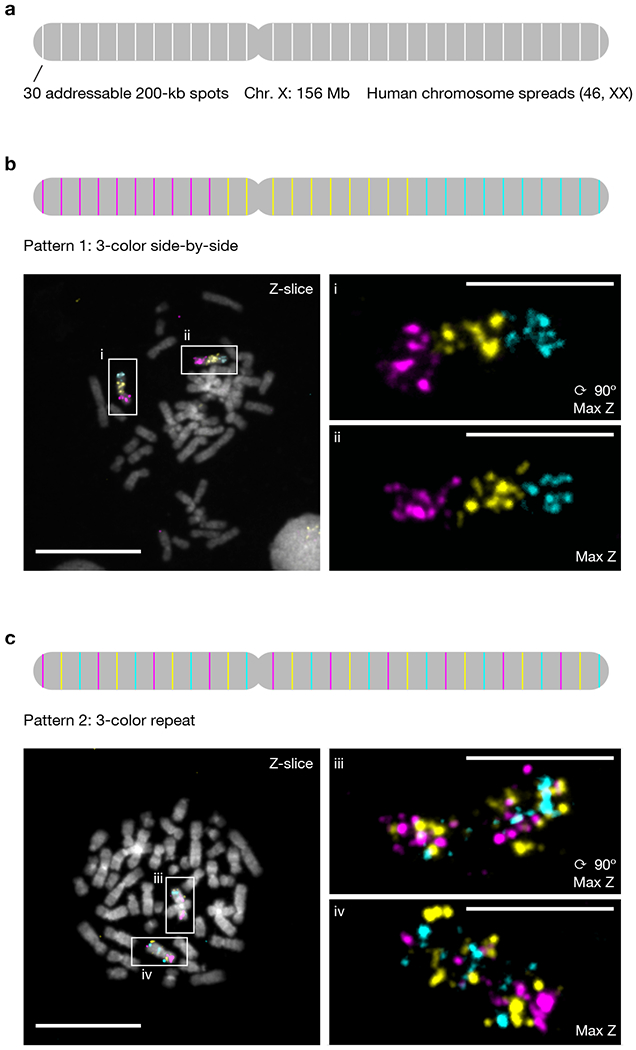
a, Overview of 30-target human X chromosome library design. Each site is individually addressable. b, A three-color “side-by-side” pattern imaged on 46 XX human metaphase chromosome spreads. c, A three-color “repeat” pattern imaged on 46 XX human metaphase chromosome spreads. Scale bars, 5 µm (spreads) or 20 µm (fields of view). Each pattern was visualized in 3 independent samples and yielded similar results.
Discussion
PaintSHOP is a freely available computational framework that enables the interactive design of transcriptome- and genome-scale oligo-based FISH experiments. PaintSHOP consists of a large database of genome-scale probe collections that are referenced by a dynamic web application that facilitates probe retrieval, library design, and the creation of complete order files. Our web application provides substantial control over parameters that impact the coverage of FISH targets, providing the flexibility needed for designing probe sets against targets that have fewer optimal probes to start. In addition to the introduction of a new pipeline and web resource, we have developed newBalance probe sets by optimizing our previously reported approach for genome scale probe mining33. The newBalance probe sets for the human, mouse, C. elegans, Drosophila, zebrafish, Arabidopsis, S. cerevisiae, rat, and chicken genomes are freely available through PaintSHOP along with many other sets created by various technologies33,34. Our goal for these technologies and resources is to democratize the ability to design the libraries needed for a wide variety of oligo FISH experiments14,22,37,49 against any target in the genome or transcriptome. We anticipate that PaintSHOP will enable researchers to perform novel FISH experiments interrogating genome organization and the spatial location of gene expression. Going forward, we expect that the set of organisms and genome assemblies supported by PaintSHOP will continue to expand, particularly as long-read sequencing technologies mature and are applied more broadly.
Methods
Probe sets and Genome Assemblies
OligoMiner hg19 and hg38 ‘balance’ probe sets were downloaded from yin.hms.harvard.edu/oligoMiner. The hg19 probe set from the original Oligopaints study14 was downloaded from oligopaints.hms.harvard.edu. The hg19 iFISH4U ‘full 40 mer’ probe set was downloaded from ifish4u.org. The ce11, danRer11, dm6, hg19, hg38, mm9, mm10, sacCer3, rn6, galGal5, and galGal6 genome assemblies were downloaded with soft-masking from genome.ucsc.edu. The tair10 genome assembly was downloaded from arabidopsis.org.
Probe Mining Optimization
OligoMiner33 was downloaded from github.com/brianbeliveau/OligoMiner. The blockParse script was modified to search for probes in soft-masked genome sequences, and to report candidates in soft-masked regions with a special flag. The modified blockParse script was used to mine for probe candidates for each genome assembly with the parameters “−l 20 −L 60 −t 42 −T 47” to identify all possible probes between 20 and 60 nucleotides in length with a Tm between 42 and 47 degrees. A sliding window was used to identify the 8-nucleotide length window with the highest number of candidates. The candidates with the newly optimized settings and specially flagged candidates in soft-masked regions were termed the ‘newBalance’ probe sets. All probe mining was performed in a Python 2.7 Anaconda environment54 with the dependencies required for OligoMiner (Python 2.7, Biopython, scikit-learn) on the Department of Genome Science ‘Grid’ Cluster at the University of Washington.
PaintSHOP Bridge Set Creation
A set of 1,500 G-depleted 46 nt DNA sequences were generated using Python with the following probabilities for incorporating each base: 0.33 for A, 0.33 for T, 0.33 for C, and 0.0 for G. The following substrings were excluded: “AAAA”, “TTTT”, and “CCC”. Each sequence had a maximum predicted Tm of 42°C33,55. Duplexing probabilities were computed for all pairwise combinations of bridge sequences and their reverse complements. 1,065 sequences with a >0.99 probability of on-target duplexing, a maximum off-target duplexing probability of <=0.015 and an average off-target duplexing probability of <=0.0006 were kept. Pairwise duplexing probabilities were computed for the remaining sequences to screen for potential dimerization between bridge sequences. All simulations were performed with the following FISH conditions: 42° C, 50% formamide, 0.390M sodium. 0.65°C per % (vol/vol) formamide was used to scale temperature values in thermodynamic calculations33,55. The 1,065 sequences were aligned to the hg38, mm10, dm6, and ce11 references genomes with Bowtie256 using the “--very-sensitive-local” settings. The 818 sequences that aligned 0 times were screened for k-mer sequences against all four reference genomes using the OligoMiner33 kmerFilter.py utility with the settings “-m 18 -k 10”. The 800 remaining sequences were used as the new PaintSHOP bridge set.
Machine Learning Model Development
Model construction was performing using the “probe-target” data set described originally in OligoMiner33. Briefly the data set consists of 406,814 pairs of “probe” and “target site” sequences. The “target sites” were generated using a combination of in-silico truncation, insertion, and point mutation of the “probe” sequences. The data set contains a Bowtie256 alignment score and the thermodynamic duplexing probability computed using NUPACK 3.040–42 for each sequence pair. The following numeric features were engineered to represent the key thermodynamic properties of the “probe” and “target site” sequences: length, GC-content, and dinucleotide counts. These features and the Bowtie2 alignment scores were used to build a machine learning model to predict the duplexing probability of the sequence pairs. The data set was randomly split into a training set and a testing set using scikit-learn44. Automatic model selection and hyperparameter optimization was performed using TPOT45,46. Negative mean squared error was used as the scoring function. After 10 generations with a population size of 100, TPOT converged on a XGBoost43 regressor. All model selection and hyperparameter optimization was performed using 5-fold cross-validation. The mean squared error (MSE)
And root mean squared error
were computed for the test set, where is the predicted value, is the actual value, and is the total number of samples. Least squares regression was also performed perform to evaluate the correlation between model predictions and actual values on the test set. Feature importance was calculated as the number of times a given feature was used to split the data across all trees.
Pipeline Development
All PaintSHOP probe collections were generated using a pipeline implemented with Snakemake38. The pipeline takes as input two files: the FASTA sequence and GTF gene annotations for a given genome assembly. Mining of initial “probe candidate” sequences is performed using steps similar to the OligoMiner workflow33, and then these sequences are scored using the homology optimization pipeline. Briefly, the pipeline aligns “candidates” to their respective genome using Bowtie256 with the settings “--very-sensitive-local -k 100”, returning up to 100 alignments. Pairwise alignments are reconstructed from the SAM format57 alignment results using sam2pairwise58. The XGBoost43 regressor is used to predict the duplexing probability of each pairwise alignment returned for all “probe candidates”. The “on-target score” is computed as
where is the duplexing probability at the intended “target” site, and the “off-target score” is computed as
where is any alignment at a site other than the “target”, and is the number of “off-target” alignments. Probabilities are scaled to the 0-100 range for user interpretability in the PaintSHOP web application. In addition to both scores, a k-mer statistic is computed. The number of times each 18-mer for a given candidate occurs within its respective genome is computed using Jellyfish59. The pipeline returns the occurrence count of the most frequently occurring 18-mer for each candidate. The scored “probe candidates” constitute the collection of genome-wide DNA-FISH probes designed for the input genome assembly, which is one of three major pipeline outputs. The other two outputs are RNA-FISH probe collections, one with isoform-specific targeting resolution, and another “isoform-flattened” set of probes targeting transcript intervals that are maximally shared across isoforms for a given gene. The isoform-resolved probe collection is generated by intersecting the exon coordinates from the GTF annotations file with the genomic coordinates of the designed probes using BEDTools53 called via the pybedtools60 Python wrapper and subsequently reverse-complementing probes when needed to account for (+)/(-)-strand annotations. The “isoform-flattened” set is generated using the same approach but first collapsing the annotated coordinates to intervals shared by the maximal number of isoforms. The pipeline is publicly available at: https://github.com/beliveau-lab/PaintSHOP_pipeline.
User Interface
A web application for interactive probe design was built using the Shiny61 web framework for the R programming language62. The back end of the application consists of two databases and a server. One database consists of the pre-computed set intersection of all probes for a given assembly with all UCSC RefSeq or isoform-flattened annotations in the assembly. The set intersection is computed using BEDTools53. The other database consists of all probes returned from the Homology Optimization Pipeline. The front end of the application enables interactive access to both databases. Users can either retrieve the probes targeting a set of RefSeq annotations or retrieve probes from the full database using any genomic coordinate in their assembly of interest. The front end also dynamically generates an interactive table for the user to view their probes, as well as a visualization of the distribution of probes per target using ggplot263. An additional core feature implemented in the front end is the ability to append the sequences necessary for an oligo library, or a SABER37 experiment. All designs can be downloaded for use directly from the application.
Chromosome X Library Design
A roughly evenly spaced set of 30 windows was upload to PaintSHOP in BED format. This file was uploaded using the DNA Probe Design feature on the PaintSHOP web interface and ‘hg38 newBalance’ probes were designed with repeats allowed, an off-target cutoff score of 100, and max k-mer cutoff of 5. The balance set feature was used to trim the probe set to 1,000 probes per target. Using the Append Sequences feature, a 5’-outer primer (ATCCTAGCCCATACGGCAATG) and 3’-outer primer (GTATCGTGCAAGGGTGAATGC), as well as per-target 5’ inner primers using the included PaintSHOP 5’ Inner Primer Set and 3’ per-target bridge sequences using the included Kishi et al. 2019 Bridges37. The resulting probes were downloaded from PaintSHOP and ordered as an Oligo Pool from Twist Bioscience. Bridge oligos were designed by reverse-complementing the Kishi et al. 2019 Bridges and appending Primer Exchange Reaction (PER) priming sequences and ordered from Integrated DNA Technologies as a 96-well plate. Also see Supplementary Note 2.
RNA SABER-FISH
The conditionally immortalized human mesangial cell line (K29Mes)64 was obtained from Dr. Moin Saleem (University of Bristol). Cells were cultured in RPMI-1640 medium supplemented with 10% FBS and ITS+ supplement. For propagation, the cells were grown at 33°C (permissive temperature). For experiments, cells were shifted to 37°C (non-permissive temperature) causing degradation of the temperature sensitive SV40 T-antigen and resulting in growth arrest. K29Mes cells were allowed to adhere to 22 x 22 #1.5 coverslips, then rinsed in 1x PBS, fixed in 4% (wt/vol) paraformaldehyde in 1x PBS for 10 minutes at room temperature, then rinsed in 1x PBS. Samples were then permeabilized in 1x PBS + 0.5% (vol/vol) Triton X-100 for 10 minutes at room temperature, then rinsed in 1x PBS + 0.1% (vol/vol) Tween-20. Samples were then transferred to 2x SSC + 1% (vol/vol) Tween-20 + 40% (vol/vol) formamide and incubated for 30 minutes at 43°C in a benchtop air incubator. Samples were then inverted onto parafilm square containing 80 ¼l of pre-warmed hybridization solution consisting of 2x SSC + 1% (vol/vol) Tween-20 + 40% (vol/vol) formamide + 10% (wt/vol) dextran sulfate and 80 ¼l of lyophilized product from a Primer Exchange Reaction (PER) reaction37,50 performed on a set of 105 oligo probes targeting the ADAMTS5 mRNA (Supplementary Table 3). The ADAMTS5 probe pool was purchased from Integrated DNA Technologies and was PER extended for 90 minutes at 37°C with a probe concentration of 1 µM and a hairpin h25.2537 concentration of 0.5 µM. Hybridization was allowed to proceed overnight (~16 hours) at 43°C in a humidified chamber placed in a benchtop air incubator. Samples were then washed 2 times for 30 minutes each in 2x SSC + 1% (vol/vol) Tween-20 + 40% (vol/vol) formamide for 30 minutes at 43°C, and then twice for 5 minutes each in 2X SSC + 0.1% (vol/vol) Tween-20 at 43°C, and then twice for 5 minutes each in 1x PBS at room temperature. Samples were then inverted onto parafilm containing 100 µl of a secondary hybridization buffer consisting of 0.16x PBS + 8% (wt/vol) dextran sulfate + 0.04% (vol/vol) Tween-20 and an ATTO565-labeled p25*.25* secondary oligo37 at 0.4 µM and incubated for 30 minutes at 37°C in a benchtop air incubator. Samples were then washed twice for 5 minutes each in 1x PBS + 0.1% (vol/vol) Tween-20 at 37°C, then stained in 0.1 µg/ml DAPI in 1x PBS for 5 minutes at room temperature. Samples were then washed for 5 minutes in 1x PBS at room temperature, then inverted onto microscope slides containing ProLong Gold Antifade Mountant which cured overnight at room temperature prior to imaging. Images were captured using a Leica SP8X laser scanning confocal microscope using a 63x oil N.A. 1.40 Plan Apo objective lens controlled using Leica LASX Expert software. Images were processed in ImageJ + Fiji65,66 and Adobe Photoshop.
ChrX library amplification and ssDNA probe synthesis
Raw library material was resuspended to a concentration of 20 ng / µl using 10 mM Tris, pH 8.0. The first PCR mix contained 34 µl dH2O, 10 µl 5X Phusion HF Buffer, 1.5 µl 10 mM dNTP Mix, 1.5 µl 10 µM F primer, 1.5 µl 10 µM R primer, 1.0 µl resuspended oligo pool, 0.5 µl Phusion DNA Polymerase (2 U / µl) for a total volume of 50 µl. The thermal cycler program comprised an initial denaturation at 95°C for 3 minutes, followed by 12 cycles of 98°C for 20 seconds, 60°C for 15 seconds, 72°C for 15 seconds, and a final extension at 72°C for 1 minute followed by a 4°C hold. The first PCR product was purified using a Zymo DNA Clean and Concentrator-5 (DCC-5) kit according to the manufacturer’s standard protocol. A dilution of the first PCR product at 20 pg / µl was prepared as a template for the second PCR. The second PCR mix contained 27 µl dH2O, 10 µl 5X Phusion HF Buffer, 1.5 µl 10 mM dNTP Mix, 5.0 µl 10 µM F Primer, 5.0 µl 10 µM R Primer, 1.0 µl diluted DNA template, 0.5 µl Phusion DNA Polymerase (2 U / µl) for a total volume of 50 µl. The thermal cycler program was the same as before but with 18 cycles instead of 12. The second PCR product was purified as before. RNA was synthesized using the NEB HiScribe T7 Quick High Yield RNA Synthesis Kit with a modified reaction mix containing 8 µl dH2O, 2.5 µl diluted DNA template, 15.0 µl NTP Buffer Mix, 3 µl T7 RNA Polymerase Mix, 1.5 µl RNaseOUT. The reaction was incubated at 37°C overnight. Enzymatic digestion of the DNA template and precipitation of the RNA using the included Lithium chloride solution were both carried out according to the manufacturer’s standard protocol. The reverse transcription reaction contained 55 µl synthesized RNA, 30 µl 5X RT Buffer, 48 µl 10 mM dNTP Mix, 10 µl 100 µM RT Primer, 3 µl RNaseOUT, and 4 µl Maxima H Minus Reverse Transcriptase (200 U / µl) for a total volume of 150 µl, which was split into four 37.5 µl reactions. The reactions were incubated at 50°C for 2 hours and then at 80 °C for 5 minutes. RNA templates were degraded enzymatically by adding 1 µl RNase to each reaction and incubating at 37 °C for 1 hour. To precipitate the final ssDNA probes, 0.1 volumes of 5 M Ammonium acetate, 0.02 volumes of 2% (wt/vol) Glycogen, and 3.0 volumes of 100% (vol/vol) Ethanol were added to the reverse transcription reaction mixture. The resulting mixture was incubated for 15 minutes at −20°C, followed by 10 minutes of centrifugation at 10,000 x g at 4°C. The pellet was washed using 750 µl of 70% (vol/vol) and centrifuged again as before. The pellet was dried for 3 minutes at room temperature and resuspended using 250 µl nuclease free water. The concentration was measured using a NanoDrop spectrophotometer and a 10 µM probe stock solution was prepared and stored at −20°C.
DNA SABER-FISH on spread metaphase chromosomes
Bridge oligos were extended using the primer exchange reaction (PER) as previously described37 with an extension time of two hours. PER-extended bridge oligos (60 pmol total) and amplified ssDNA primary probes (60 pmol total) were dried using a SpeedVac concentrator. The dried oligos were resuspended using 25 µl of an ISH solution containing 12.5 µl Formamide, 5.0 µl 50% Dextran sulfate, 4.0 µl dH2O, 2.5 µl 20X SSC, 1.0 µl RNase A (10 mg / ml). Human metaphase chromosome spreads (XX 46N, Applied Genetics Laboratories) were denatured in 70% (vol/vol) Formamide in 2X SSCT (2X SSC with 1% (vol/vol) Tween-20) at 70°C (90 seconds) and then transferred to ice-cold 70% (vol/vol) ethanol (5 minutes), to 90% (vol/vol) ethanol (5 minutes), and to 100% ethanol (5 minutes). Slides were air dried and the primary hybridization mix was added and sealed underneath a coverslip with rubber cement. Slides were placed in a humidified chamber and incubated in an oven at 37°C overnight. After hybridization, coverslips were removed and slides were washed in 2X SSCT at 60°C (15 minutes) and in 2X SSCT at room temperature (2 × 5 minutes). A 25 µl secondary hybridization solution comprising 11.0 ul dH2O, 5.0 ul 5X PBS-T (5X PBS with 0.5% (vol/vol) Tween-20), 5.0 ul 50% Dextran sulfate, and 4.0 ul 10 uM total fluorescently labeled secondary oligos. The secondary hybridization mix was added and sealed underneath a coverslip with rubber cement. Slides were placed in a humidified chamber and incubated in an oven at 37°C (1 hour). After hybridization, coverslips were removed and slides were washed in 1X PBS-T (1X PBS with 0.1% (vol/vol) Tween-20) at 37°C (3 x 15 minutes). Slides were imaged on a custom microscopy system consisting of a Nikon Eclipse Ti2 body and an attached Yokogawa CSU-W1 SoRa spinning disc confocal unit. 405 nm, 488 nm, 561 nm, or 640 nm laser excitation was emitted at 30–40% of maximal intensity inside of a Nikon LUNF 405/488/561/640NM 1F commercial launch and coupled into a single-mode optical fiber, which delivered the excitation light into the CSU-W1 SoRa unit. Excitation light was then directed through a microlens array disc and a ‘SoRa’ disc containing 50 µm pinholes and directed to the rear aperture of a 100x N.A. 1.49 Apo TIRF oil immersion objective lens by a prism in the base of the Ti2. Emission light was collected by the same objective and passed via a prism in the base of the Ti2 back into the SoRa unit, where it was relayed by a 1x lens (fields of view) or 2.8x lens (spreads) through the pinhole disc and then directed into the emission path by a quad-band dichroic mirror (Semrock Di01-T405/488/568/647-13x15x0.5). Emission light was then spectrally filtered by one of four single-bandpass filters (DAPI: Chroma ET455/50M; ATTO 488: Chroma ET525/36M; ATTO 565: Chroma ET605/50M; Alexa Fluor 647: Chroma ET705/72M) and focused by a 1x relay lens onto an Andor Sona 4.2B-11 camera with a physical pixel size of 11 µm, resulting in an effective pixel size of 110 nm (fields of view) or 39.3 nm (spreads). The Sona was operated in 16-bit mode with rolling shutter readout and a 300 ms exposure time. Acquisition was controlled by Nikon Elements software. Images were processed in ImageJ + Fiji65,66 and Adobe Photoshop.
Code Availability
The source code for the PaintSHOP web application is available as Supplementary Software 1 and at https://github.com/beliveau-lab/PaintSHOP. The source code for the Homology Optimization Pipeline is available as Supplementary Software 2 and at https://github.com/beliveau-lab/PaintSHOP_pipeline.
Data Availability
The original ‘OligoPaints 2012 hg19” genome-scale probe collection was downloaded from https://oligopaints.hms.harvard.edu/sites/oligopaints.hms.harvard.edu/files/complete-genome-files/hg19.tar.gz. The original OligoMiner hg19 ‘balance’ genome-scale probe collection was downloaded from https://yin.hms.harvard.edu/oligoMiner/probe_seqs/hg19/hg19b.tar.gz. The original OligoMiner hg38 ‘balance’ genome-scale probe collection was downloaded from https://yin.hms.harvard.edu/oligoMiner/probe_seqs/hg38/hg38b.tar.gz. The original ‘Full 40-mer’ iFISH4u hg19 genome-scale probe collection was downloaded from http://ifish4u.org/custom/dbdownload/hg19.gz. The human hg19 genome assembly was downloaded from https://hgdownload.soe.ucsc.edu/goldenPath/hg19/bigZips/hg19.fa.gz. The human hg38 genome assembly was downloaded from https://hgdownload.soe.ucsc.edu/goldenPath/hg38/bigZips/hg38.fa.gz. The mouse mm9 genome assembly was downloaded from https://hgdownload.soe.ucsc.edu/goldenPath/mm9/bigZips/mm9.fa.gz. The mouse mm10 genome assembly was downloaded from https://hgdownload.soe.ucsc.edu/goldenPath/mm10/bigZips/mm10.fa.gz. The C. elegans ce11 genome assembly was downloaded from https://hgdownload.soe.ucsc.edu/goldenPath/ce11/bigZips/ce11.fa.gz. The D. melanogaster dm6 genome assembly was downloaded from https://hgdownload.soe.ucsc.edu/goldenPath/dm6/bigZips/dm6.fa.gz. The zebrafish danRer11 genome assembly was downloaded from https://hgdownload.soe.ucsc.edu/goldenPath/danRer11/bigZips/danRer11.fa.gz. The A. thaliana TAIR10 genome assembly was downloaded from https://www.arabidopsis.org/download_files/Genes/TAIR10_genome_release/TAIR10_chromosome_files/TAIR10_chr_all.fas. The S. cerevisiae sacCer3 genome assembly was downloaded from https://hgdownload.soe.ucsc.edu/goldenPath/sacCer3/bigZips/sacCer3.fa.gz. The rat rn6 genome assembly was downloaded from https://hgdownload.soe.ucsc.edu/goldenPath/rn6/bigZips/rn6.fa.gz. The chicken galGal5 genome assembly was downloaded from https://hgdownload.soe.ucsc.edu/goldenPath/galGal5/bigZips/galGal5.fa.gz. The chicken galGal6 genome assembly was downloaded from https://hgdownload.soe.ucsc.edu/goldenPath/galGal6/bigZips/galGal6.fa.gz. All genome-scale probe collections, primer sequences, bridge sequences, SABER-associated sequences, and transcriptome intersects hosted on paintshop.io are available to download from https://github.com/beliveau-lab/PaintSHOP_resources repository. All repositories are available under the MIT license. Raw and processed microscopy images are available upon request.
Supplementary Material
Acknowledgements
The authors thank G. Nir, D. Shechner, A. Tsue, H. Nguyen, J.Y. Kishi, and J. Harke for helpful feedback during the beta testing phase of PaintSHOP, N. Peters and D. Fong for assistance with microscopy, the Genome Sciences IT team for technical assistance, and members of the Beliveau lab for feedback on the written manuscript. We also thank S. Lapan and E. West for productive discussions that inspired aspects of this work. This work was supported by a Damon Runyon Dale F. Frey Breakthrough Award (to B.J.B.), the National Institutes of Health (under grant 1R35GM137916 to B.J.B.), and the DiaCOMP consortium (under grant 19AU3987 to S.A. and B.J.B.). Imaging on the University of Washington W.M. Keck Center Lecia SP8X confocal microscopy was enabled by funding from the NIH (S10 OD016240). We would also like to thank the Allen Institute for Brain Science founder, Paul G. Allen, for his vision, encouragement, and support.
Footnotes
Competing Interests
The authors declare no competing interests.
References
- 1.Pardue ML & Gall JG Molecular hybridization of radioactive DNA to the DNA of cytological preparations. Proc. Natl. Acad. Sci. U. S. A (1969) doi: 10.1073/pnas.64.2.600. [DOI] [PMC free article] [PubMed] [Google Scholar]
- 2.Rudkin GT & Stollar BD High resolution detection of DNA-RNA hybrids in situ by indirect immunofluorescence [29]. Nature (1977) doi: 10.1038/265472a0. [DOI] [PubMed] [Google Scholar]
- 3.Bauman JGJ, Wiegant J, Borst P & van Duijn P A new method for fluorescence microscopical localization of specific DNA sequences by in situ hybridization of fluorochrome-labelled RNA. Exp. Cell Res. (1980) doi: 10.1016/0014-4827(80)90087-7. [DOI] [PubMed] [Google Scholar]
- 4.Langer-Safer PR, Levine M & Ward DC Immunological methods for mapping genes on Drosophila polytene chromosomes. Proc. Natl. Acad. Sci. U. S. A (1982) doi: 10.1073/pnas.79.14.4381. [DOI] [PMC free article] [PubMed] [Google Scholar]
- 5.Moyzis RK et al. A highly conserved repetitive DNA sequence, (TTAGGG)(n), present at the telomeres of human chromosomes. Proc. Natl. Acad. Sci. U. S. A (1988) doi: 10.1073/pnas.85.18.6622. [DOI] [PMC free article] [PubMed] [Google Scholar]
- 6.Matera AG & Ward DC Oligonucleotide probes for the analysis of specific repetitive dna sequences by fluorescence in situ hybridization. Hum. Mol. Genet 1, 535–539 (1992). [DOI] [PubMed] [Google Scholar]
- 7.Dernburg AF et al. Perturbation of nuclear architecture by long-distance chromosome interactions. Cell (1996) doi: 10.1016/S0092-8674(00)81240-4. [DOI] [PubMed] [Google Scholar]
- 8.Dirks RW et al. Simultaneous detection of different mRNA sequences coding for neuropeptide hormones by double in situ hybridization using FITC- and biotin-labeled oligonucleotides. J. Histochem. Cytochem (1990) doi: 10.1177/38.4.2108203. [DOI] [PubMed] [Google Scholar]
- 9.Femino AM, Fay FS, Fogarty K & Singer RH Visualization of single RNA transcripts in situ. Science (1998) doi: 10.1126/science.280.5363.585. [DOI] [PubMed] [Google Scholar]
- 10.Raj A, van den Bogaard P, Rifkin SA, van Oudenaarden A & Tyagi S Imaging individual mRNA molecules using multiple singly labeled probes. Nat. Methods (2008) doi: 10.1038/nmeth.1253. [DOI] [PMC free article] [PubMed] [Google Scholar]
- 11.Kosuri S & Church GM Large-scale de novo DNA synthesis: Technologies and applications. Nature Methods (2014) doi: 10.1038/nmeth.2918. [DOI] [PMC free article] [PubMed] [Google Scholar]
- 12.Yamada NA et al. Visualization of fine-scale genomic structure by oligonucleotide-based high-resolution FISH. Cytogenet. Genome Res. (2011) doi: 10.1159/000322717. [DOI] [PubMed] [Google Scholar]
- 13.Boyle S, Rodesch MJ, Halvensleben HA, Jeddeloh JA & Bickmore WA Fluorescence in situ hybridization with high-complexity repeat-free oligonucleotide probes generated by massively parallel synthesis. Chromosome Res. (2011) doi: 10.1007/s10577-011-9245-0. [DOI] [PMC free article] [PubMed] [Google Scholar]
- 14.Beliveau BJ et al. Versatile design and synthesis platform for visualizing genomes with Oligopaint FISH probes. Proc. Natl. Acad. Sci. U. S. A (2012) doi: 10.1073/pnas.1213818110. [DOI] [PMC free article] [PubMed] [Google Scholar]
- 15.Wang S et al. Spatial organization of chromatin domains and compartments in single chromosomes. Science (2016) doi: 10.1126/science.aaf8084. [DOI] [PMC free article] [PubMed] [Google Scholar]
- 16.Bintu B et al. Super-resolution chromatin tracing reveals domains and cooperative interactions in single cells. Science (2018) doi: 10.1126/science.aau1783. [DOI] [PMC free article] [PubMed] [Google Scholar]
- 17.Cardozo Gizzi AM et al. Microscopy-Based Chromosome Conformation Capture Enables Simultaneous Visualization of Genome Organization and Transcription in Intact Organisms. Mol. Cell (2019) doi: 10.1016/j.molcel.2019.01.011. [DOI] [PubMed] [Google Scholar]
- 18.Mateo LJ et al. Visualizing DNA folding and RNA in embryos at single-cell resolution. Nature (2019) doi: 10.1038/s41586-019-1035-4. [DOI] [PMC free article] [PubMed] [Google Scholar]
- 19.Su J-H, Zheng P, Kinrot SS, Bintu B & Zhuang X Genome-Scale Imaging of the 3D Organization and Transcriptional Activity of Chromatin. Cell 182, 1641–1659.e26 (2020). [DOI] [PMC free article] [PubMed] [Google Scholar]
- 20.Takei Y et al. Integrated spatial genomics reveals global architecture of single nuclei. Nature 1–7 (2021) doi: 10.1038/s41586-020-03126-2. [DOI] [PMC free article] [PubMed] [Google Scholar]
- 21.Levesque MJ & Raj A Single-chromosome transcriptional profiling reveals chromosomal gene expression regulation. Nat. Methods (2013) doi: 10.1038/nmeth.2372. [DOI] [PMC free article] [PubMed] [Google Scholar]
- 22.Chen KH, Boettiger AN, Moffitt JR, Wang S & Zhuang X Spatially resolved, highly multiplexed RNA profiling in single cells. Science (2015) doi: 10.1126/science.aaa6090. [DOI] [PMC free article] [PubMed] [Google Scholar]
- 23.Shah S et al. Dynamics and Spatial Genomics of the Nascent Transcriptome by Intron seqFISH. Cell (2018) doi: 10.1016/j.cell.2018.05.035. [DOI] [PMC free article] [PubMed] [Google Scholar]
- 24.Pernthaler J, Glöckner FO, Schönhuber W & Amann R Fluorescence in situ hybridization (FISH) with rRNA-targeted oligonucleotide probes. Methods in Microbiology (2001) doi: 10.1016/s0580-9517(01)30046–6. [DOI] [Google Scholar]
- 25.Yilmaz LS, Parnerkar S & Noguera DR MathFISH, a web tool that uses thermodynamics-based mathematical models for in silico evaluation of oligonucleotide probes for fluorescence in situ hybridization. Appl. Environ. Microbiol (2011) doi: 10.1128/AEM.01733-10. [DOI] [PMC free article] [PubMed] [Google Scholar]
- 26.Rogan PK, Cazcarro PM & Knoll JHM Sequence-based design of single-copy genomic DNA probes for fluorescence in situ hybridization. Genome Res. (2001) doi: 10.1101/gr.171701. [DOI] [PMC free article] [PubMed] [Google Scholar]
- 27.Navin N et al. PROBER: Oligonucleotide FISH probe design software. Bioinformatics (2006) doi: 10.1093/bioinformatics/btl273. [DOI] [PubMed] [Google Scholar]
- 28.Nedbal J, Hobson PS, Fear DJ, Heintzmann R & Gould HJ Comprehensive FISH Probe Design Tool Applied to Imaging Human Immunoglobulin Class Switch Recombination. PLoS ONE (2012) doi: 10.1371/journal.pone.0051675. [DOI] [PMC free article] [PubMed] [Google Scholar]
- 29.Bienko M et al. A versatile genome-scale PCR-based pipeline for high-definition DNA FISH. Nat. Methods (2013) doi: 10.1038/nmeth.2306. [DOI] [PMC free article] [PubMed] [Google Scholar]
- 30.Baner J Parallel gene analysis with allele-specific padlock probes and tag microarrays. Nucleic Acids Res. (2003) doi: 10.1093/nar/gng104. [DOI] [PMC free article] [PubMed] [Google Scholar]
- 31.Stenberg J, Nilsson M & Landegren U ProbeMaker: An extensible framework for design of sets of oligonucleotide probes. BMC Bioinformatics (2005) doi: 10.1186/1471-2105-6-229. [DOI] [PMC free article] [PubMed] [Google Scholar]
- 32.Rouillard JM, Zuker M & Gulari E OligoArray 2.0: Design of oligonucleotide probes for DNA microarrays using a thermodynamic approach. Nucleic Acids Res. (2003) doi: 10.1093/nar/gkg426. [DOI] [PMC free article] [PubMed] [Google Scholar]
- 33.Beliveau BJ et al. OligoMiner provides a rapid, flexible environment for the design of genome-scale oligonucleotide in situ hybridization probes. Proc. Natl. Acad. Sci. U. S. A. (2018) doi: 10.1073/pnas.1714530115. [DOI] [PMC free article] [PubMed] [Google Scholar]
- 34.Gelali E et al. iFISH is a publically available resource enabling versatile DNA FISH to study genome architecture. Nat. Commun. (2019) doi: 10.1038/s41467-019-09616-w. [DOI] [PMC free article] [PubMed] [Google Scholar]
- 35.Hu M et al. ProbeDealer is a convenient tool for designing probes for highly multiplexed fluorescence in situ hybridization. Sci. Rep 10, 22031 (2020). [DOI] [PMC free article] [PubMed] [Google Scholar]
- 36.Passaro M et al. OligoMinerApp: a web-server application for the design of genome-scale oligonucleotide in situ hybridization probes through the flexible OligoMiner environment. Nucleic Acids Res. 48, W332–W339 (2020). [DOI] [PMC free article] [PubMed] [Google Scholar]
- 37.Kishi JY et al. SABER amplifies FISH: enhanced multiplexed imaging of RNA and DNA in cells and tissues. Nat. Methods (2019) doi: 10.1038/s41592-019-0404-0. [DOI] [PMC free article] [PubMed] [Google Scholar]
- 38.Köster J & Rahmann S Snakemake-a scalable bioinformatics workflow engine. Bioinformatics (2012) doi: 10.1093/bioinformatics/bts480. [DOI] [PubMed] [Google Scholar]
- 39.Casper J et al. The UCSC Genome Browser database: 2018 update. Nucleic Acids Res. (2018) doi: 10.1093/nar/gkx1020. [DOI] [PMC free article] [PubMed] [Google Scholar]
- 40.Dirks RM & Pierce NA A partition function algorithm for nucleic acid secondary structure including pseudoknots. J. Comput. Chem (2003) doi: 10.1002/jcc.10296. [DOI] [PubMed] [Google Scholar]
- 41.Dirks RM & Pierce NA An algorithm for computing nucleic acid base-pairing probabilities including pseudoknots. J. Comput. Chem (2004) doi: 10.1002/jcc.20057. [DOI] [PubMed] [Google Scholar]
- 42.Dirks RM, Bois JS, Schaeffer JM, Winfree E & Pierce NA Thermodynamic analysis of interacting nucleic acid strands. SIAM Rev. (2007) doi: 10.1137/060651100. [DOI] [Google Scholar]
- 43.Chen T & Guestrin C XGBoost: A scalable tree boosting system. in Proceedings of the ACM SIGKDD International Conference on Knowledge Discovery and Data Mining (2016). doi: 10.1145/2939672.2939785. [DOI] [Google Scholar]
- 44.Pedregosa F et al. Scikit-learn: Machine learning in Python. J. Mach. Learn. Res (2011). [Google Scholar]
- 45.Olson RS et al. Automating biomedical data science through tree-based pipeline optimization. in Lecture Notes in Computer Science (including subseries Lecture Notes in Artificial Intelligence and Lecture Notes in Bioinformatics) (2016). doi: 10.1007/978-3-319-31204-0_9. [DOI] [Google Scholar]
- 46.Olson RS, Bartley N, Urbanowicz RJ & Moore JH Evaluation of a tree-based pipeline optimization tool for automating data science. in GECCO 2016 - Proceedings of the 2016 Genetic and Evolutionary Computation Conference (2016). doi: 10.1145/2908812.2908918. [DOI] [Google Scholar]
- 47.Smit A, Hubley R & Green P RepeatMasker Open-3.0. RepeatMasker Open-3.0 (1996). [Google Scholar]
- 48.Nir G et al. Walking along chromosomes with super-resolution imaging, contact maps, and integrative modeling. PLoS Genet. (2018) doi: 10.1371/journal.pgen.1007872. [DOI] [PMC free article] [PubMed] [Google Scholar]
- 49.Eng CHL et al. Transcriptome-scale super-resolved imaging in tissues by RNA seqFISH+. Nature (2019) doi: 10.1038/s41586-019-1049-y. [DOI] [PMC free article] [PubMed] [Google Scholar]
- 50.Kishi JY, Schaus TE, Gopalkrishnan N, Xuan F & Yin P Programmable autonomous synthesis of single-stranded DNA. Nat. Chem (2017) doi: 10.1038/nchem.2872. [DOI] [PMC free article] [PubMed] [Google Scholar]
- 51.Smit A, Hubley R & Green P RepeatMasker Open-4.0. 2013-2015. http://www.repeatmasker.org (2013). [Google Scholar]
- 52.Fornace ME, Porubsky NJ & Pierce NA A Unified Dynamic Programming Framework for the Analysis of Interacting Nucleic Acid Strands: Enhanced Models, Scalability, and Speed. ACS Synth. Biol 9, 2665–2678 (2020). [DOI] [PubMed] [Google Scholar]
- 53.Quinlan AR & Hall IM BEDTools: A flexible suite of utilities for comparing genomic features. Bioinformatics (2010) doi: 10.1093/bioinformatics/btq033. [DOI] [PMC free article] [PubMed] [Google Scholar]
- 54.Anaconda. Anaconda Software Distribution. Computer software (2014). [Google Scholar]
- 55.Cock PJA et al. Biopython: freely available Python tools for computational molecular biology and bioinformatics. Bioinformatics 25, 1422–1423 (2009). [DOI] [PMC free article] [PubMed] [Google Scholar]
- 56.Langmead B & Salzberg SL Fast gapped-read alignment with Bowtie 2. Nat. Methods 9, 357–359 (2012). [DOI] [PMC free article] [PubMed] [Google Scholar]
- 57.Li H et al. The Sequence Alignment/Map format and SAMtools. Bioinformatics (2009) doi: 10.1093/bioinformatics/btp352. [DOI] [PMC free article] [PubMed] [Google Scholar]
- 58.LaFave & Burgess. sam2pairwise version 1.0.0. Zenodo doi: 10.5281/zenodo.11377. [DOI] [Google Scholar]
- 59.Marçais G & Kingsford C A fast, lock-free approach for efficient parallel counting of occurrences of k-mers. Bioinformatics (2011) doi: 10.1093/bioinformatics/btr011. [DOI] [PMC free article] [PubMed] [Google Scholar]
- 60.Dale RK, Pedersen BS & Quinlan AR Pybedtools: a flexible Python library for manipulating genomic datasets and annotations. Bioinformatics 27, 3423–3424 (2011). [DOI] [PMC free article] [PubMed] [Google Scholar]
- 61.Chang W, Cheng J, Allaire JJ, Xie Y & McPherson J shiny: Web Application Framework for R. (2019). [Google Scholar]
- 62.R Core Team. R: A Language and Environment for Statistical Computing. (2019). [Google Scholar]
- 63.Wickham H ggplot2: Elegant Graphics for Data Analysis. (Springer-Verlag; New York, 2016). [Google Scholar]
- 64.Establishment of conditionally immortalized human glomerular mesangial cells in culture, with unique migratory properties | American Journal of Physiology-Renal Physiology. https://journals.physiology.org/doi/full/10.1152/ajprenal.00589.2010?url_ver=Z39.88-2003&rfr_id=ori%3Arid%3Acrossref.org&rfr_dat=cr_pub++0pubmed&. [DOI] [PMC free article] [PubMed] [Google Scholar]
- 65.Schneider CA, Rasband WS & Eliceiri KW NIH Image to ImageJ: 25 years of image analysis. Nat. Methods 9, 671–675 (2012). [DOI] [PMC free article] [PubMed] [Google Scholar]
- 66.Schindelin J et al. Fiji: an open-source platform for biological-image analysis. Nat. Methods 9, 676–682 (2012). [DOI] [PMC free article] [PubMed] [Google Scholar]
Associated Data
This section collects any data citations, data availability statements, or supplementary materials included in this article.
Supplementary Materials
Data Availability Statement
The original ‘OligoPaints 2012 hg19” genome-scale probe collection was downloaded from https://oligopaints.hms.harvard.edu/sites/oligopaints.hms.harvard.edu/files/complete-genome-files/hg19.tar.gz. The original OligoMiner hg19 ‘balance’ genome-scale probe collection was downloaded from https://yin.hms.harvard.edu/oligoMiner/probe_seqs/hg19/hg19b.tar.gz. The original OligoMiner hg38 ‘balance’ genome-scale probe collection was downloaded from https://yin.hms.harvard.edu/oligoMiner/probe_seqs/hg38/hg38b.tar.gz. The original ‘Full 40-mer’ iFISH4u hg19 genome-scale probe collection was downloaded from http://ifish4u.org/custom/dbdownload/hg19.gz. The human hg19 genome assembly was downloaded from https://hgdownload.soe.ucsc.edu/goldenPath/hg19/bigZips/hg19.fa.gz. The human hg38 genome assembly was downloaded from https://hgdownload.soe.ucsc.edu/goldenPath/hg38/bigZips/hg38.fa.gz. The mouse mm9 genome assembly was downloaded from https://hgdownload.soe.ucsc.edu/goldenPath/mm9/bigZips/mm9.fa.gz. The mouse mm10 genome assembly was downloaded from https://hgdownload.soe.ucsc.edu/goldenPath/mm10/bigZips/mm10.fa.gz. The C. elegans ce11 genome assembly was downloaded from https://hgdownload.soe.ucsc.edu/goldenPath/ce11/bigZips/ce11.fa.gz. The D. melanogaster dm6 genome assembly was downloaded from https://hgdownload.soe.ucsc.edu/goldenPath/dm6/bigZips/dm6.fa.gz. The zebrafish danRer11 genome assembly was downloaded from https://hgdownload.soe.ucsc.edu/goldenPath/danRer11/bigZips/danRer11.fa.gz. The A. thaliana TAIR10 genome assembly was downloaded from https://www.arabidopsis.org/download_files/Genes/TAIR10_genome_release/TAIR10_chromosome_files/TAIR10_chr_all.fas. The S. cerevisiae sacCer3 genome assembly was downloaded from https://hgdownload.soe.ucsc.edu/goldenPath/sacCer3/bigZips/sacCer3.fa.gz. The rat rn6 genome assembly was downloaded from https://hgdownload.soe.ucsc.edu/goldenPath/rn6/bigZips/rn6.fa.gz. The chicken galGal5 genome assembly was downloaded from https://hgdownload.soe.ucsc.edu/goldenPath/galGal5/bigZips/galGal5.fa.gz. The chicken galGal6 genome assembly was downloaded from https://hgdownload.soe.ucsc.edu/goldenPath/galGal6/bigZips/galGal6.fa.gz. All genome-scale probe collections, primer sequences, bridge sequences, SABER-associated sequences, and transcriptome intersects hosted on paintshop.io are available to download from https://github.com/beliveau-lab/PaintSHOP_resources repository. All repositories are available under the MIT license. Raw and processed microscopy images are available upon request.