Abstract
SSADH deficiency is an autosomal recessive disorder of GABA degradation, resulting in elevations of brain GABA and GHB. Previous MR spectroscopy studies have shown increased levels of Glx in SSADH deficiency patients. Here in this work we measure brain GABA in a large cohort of SSADH deficiency patients using advanced MR spectroscopy techniques that allow separation of GABA from overlapping metabolite peaks. We observed significant increases in GABA concentrations in SSADH deficiency patients for all three brain regions that were evaluated. Although GABA levels were higher in all three regions, each region had different patterns in terms of GABA changes with respect to age. We also report results from structural MRI of the same cohort compared to age matched controls. We consistently observed signal hyperintensities in globus pallidus and cerebellar dentate nucleus.
Keywords: MRI, Spectroscopy, SSADH, GABA, MEGAPRESS
INTRODUCTION
Succinic semialdehyde dehydrogenase (SSADH) deficiency is an autosomal recessive disorder of GABA metabolism1. Currently approximately 400 patients have been identified around the world, with about 85% under the age of 18. SSADH in combination with GABA transaminase converts GABA to succinate. The absence of SSADH leads to GABA buildup and conversion of GABA to γ-hydroxybutyric acid (GHB), leading to CNS GABA and γ-hydroxy butyrate (GHB) accumulation. Patients with SSADH deficiency present with motor delay, cognitive and language delay, hypotonia, ataxia, behavioural problems, hyperkinesis and seizures. The key biochemical finding is elevated GHB in urine and plasma of affected patients. SSADH deficiency does not show widespread metabolite deterioration during systemic challenges such as febrile illnesses, and the clinical phenotype is heterogeneous even within families, thus rendering the diagnosis difficult.
Neuroimaging techniques such as MRI and electrophysiologic techniques such as EEG have the potential to improve accuracy of diagnosis and monitoring of progression in SSADH deficiency patients. EEG abnormalities such as generalized and focal epileptiform discharges, photosensitivity, and background slowing have been reported in the literature2. Neuroimaging has demonstrated increased T2-weighted MRI signal affecting the globus pallidus, cerebellar dentate nucleus, and subthalamic nucleus with variable cerebral/cerebellar atrophy; in one report diffusion restriction and abnormal perfusion has also been detected in the globus pallidus3,4,5,6. Magnetic resonance spectroscopy (MRS) has shown elevated Glutamine/glutamate (Glx) peaks7. However, most of these findings are based on isolated case reports.
Here in this work, we report results from an imaging study where 18 SSADH deficiency patients and 13 age-matched controls were evaluated with a 1 hour long MRI and MRS protocol. We report our findings on structural MR imaging, particularly by evaluating globus pallidus, subthalamic nucleus and dentate nucleus. We also report our findings from single voxel spectroscopy as well as a novel approach using j-edited Mescher-Garwood Point Resolved Spectroscopy (MEGAPRESS) sequence that is capable of direct measurement of GABA.
MATERIALS and METHODS
Subjects
This study was a part of the Natural History Study of Patients With Succinic Semialdehyde Dehydrogenase (SSADH) Deficiency conducted in 4 academic institutions: Washington State University (WSU), Boston Children's Hospital (BCH), University of South Florida (USF), and University Children's Hospital Heidelberg (iNTD). A total of 25 patients were recruited at the Boston Children's Hospital. These patients underwent a comprehensive evaluation including history/physical, neuropsychological testing, EEG, TMS, MRI, and bio-specimen collection over the course of two days. The patients are also followed with questionnaires and surveys sent out every 6 months, and bio-specimen collection every year. Age-matched controls were also recruited for the study and went through the same tests for comparison.
MRI
All experiments were performed on a whole-body 3T MRI scanner (Siemens Skyra) equipped with a 64-channel phased array head coil. The study was approved by local IRB, and participants and families gave written informed consent for participation. Subjects were not sedated but were offered a movie during the scan through MR compatible goggles, to reduce the amount of motion. Among 25 subjects, 18 of them were able to complete the MRI study where at least one high quality structural image was acquired.
Structural MRI protocol and analysis
MRI protocol consisted of:
T1-weighted MPRAGE sequence; 1mm isotropic resolution
T2-weighted Fast Spin Echo image acquired in Axial and Coronal planes; 0.4mm in plane resolution with 2mm slice thickness.
Fat suppressed 3D Fluid Attenuated Inversion Recovery Sequence (FLAIR) in Sagittal plane; 0.9mm isotropic resolution.
Analysis:
Structural images were reviewed by a pediatric neuroradiologist (E.Y.) with more than 10 years experience. Table 1 summarizes the evaluation metrics and criteria. The images were also evaluated with respect to quality of images and amount of motion in the images (minimal to none, mild, moderate-severe).
Table 1:
Summary of quantitative (left) and qualitative (right) metrics used to evaluate structural MRI data.
| Ventricle size (frontal occipital horn ratio, atrial dimension) | Cerebral gray/white matter volume |
| Thickness of periatrial white matter | Cerebellar atrophy |
| Gray matter measures (e.g. coronal caudate thickness at the anterior commissure) | Myelination score (adapted from Plecko et. al 16) |
| Cerebral atrophy (subarachnoid spaces, sulci) | Dysmyelination |
| Cerebellar volume measures (transverse diameter, width of primary vermian fissure) | Parenchymal injury |
| Midpons AP dimension17 | Metabolic signal abnormality (GP, putamen, thalamus, dentate, subthalamic nucleus) |
| Corpus callosum measures (genu/splenium thickness, anteroposterior dimension)18 | Malformations (e.g. vermian hypoplasia) |
| Ellipsoid estimate for volume of globus pallidus and dentate signal abnormality | Miscellaneous (e.g. arachnoid cysts, olfactory hypoplasia) |
MR Spectroscopy protocol and analysis
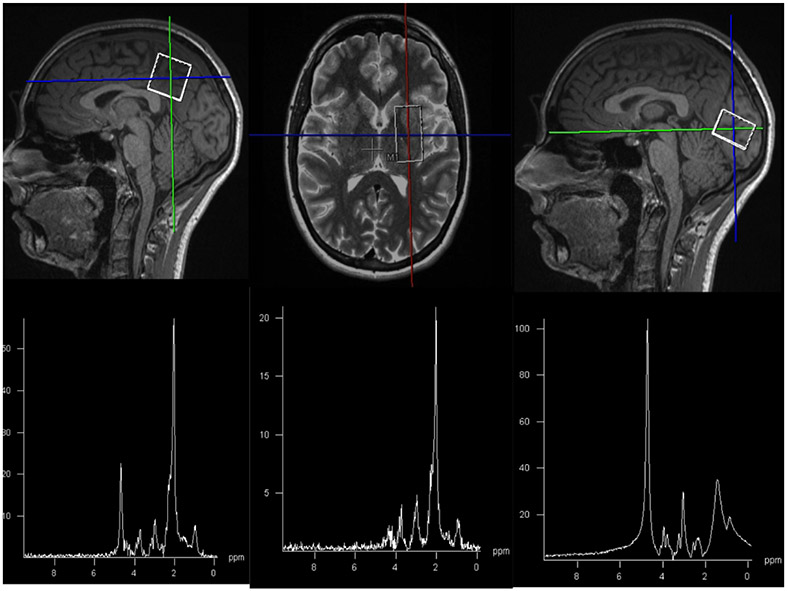
We used a GABA-specific MEGA PRESS sequence8 acquired in a single voxel with size 27 cc (30mm x 30mm x 30mm). The sequence runs two acquisitions, one with an editing pulse placed at 1.9 ppm which allows for the selective refocusing of the GABA multiplet at 3.0 ppm (called edit ON) and the other the inversion placed elsewhere (called edit OFF) which allows for GABA J-evolution. Creatine signal is suppressed and outer lines of GABA triplet (shown as a multiplet) at 3 ppm is detected when subtracting these two spectra (called the difference spectrum). Sequence parameters were repetition time (TR)=1500ms, echo time (TE)=68ms, 128 averages, bandwidth=1200Hz. Total scan time for each voxel was 6 minutes and 30 seconds.
We have collected data from three different regions in the brain of each patient:
Basal ganglia
Posterior cingulate gyrus
Occipital lobe
T1 and T2 weighted images were used for voxel placement. Sample voxel placement in these three regions and corresponding spectra are shown in Figure 1.
Figure 1:
Sample images showing voxel placement and corresponding spectra in posterior cingulate gyrus (left), basal ganglia (middle), and occipital lobe (right).
Spectroscopy Analysis:
Spectroscopy data was saved and processed offline using the LCModel9 software (version 6.3). We have used the difference spectrum from advanced spectroscopy sequence for GABA analysis using the simulated MEGAPRESS basis set provided with the software. In order to remove potential bias due to neuronal loss, we use the ratio of GABA/NAA. We have also used the OFF spectrum for PRESS analysis to calculate measurements of N-acetylaspartate (NAA), Creatine (Cr) and Choline (Cho).
Spectroscopy data quality control:
As this was a study on a group of patients that had difficulty staying still during long scan times, we performed an analysis on spectroscopy data quality. We used three metrics; 1) full width half maximum (FWHM) as a metric of linewidth; 2) signal to noise ratio (SNR), defined as the ratio of the maximum point of the spectrum to twice the residual error, as a metric of noise level; and 3) estimated standard deviations (%SD) or Cramer-Rao Lower Bound, expressed in percent of the estimated concentrations as a metric of fit quality. We set threshold suggested in literature; less than 0.08 ppm for FWHM, greater than10 for SNR and less than 20% for %SD.
Statistical analysis:
Structural MRI and MRI spectroscopy variables were tested for significance of differences between SSADH deficiency and control subjects using a twotailed t-test for continuous variables and a Chi-squared test for categorial variables. Ellipsoid estimates for the volume of dentate signal abnormality were modeled against subject age using linear regression.
RESULTS
Structural MRI recapitulated the typical imaging findings reported for SSADH deficiency. Specifically, 14 out of 16 scorable SSADH deficiency subjects demonstrated globus pallidus T2 prolongation and 17 out of 17 scorable SSADH deficiency subjects demonstrated dentate T2 prolongation (Figure 2). Though reported in the literature, subthalamic and white matter signal abnormalities were not convincingly detected in our SSADH deficiency subjects. None of these regions had signal abnormalities in any of the control subjects. While caution is warranted, we also detected a mild trend toward decreased dentate signal with SSADH deficiency subject age using an ellipsoid estimate for volume of dentate T2 hyperintensity (p=0.03). Caudate nucleus (p= 0.02) and periatrial white matter (p< 0.0001) thickness were also statistically decreased in our SSADH cohort compared to normal controls. Cerebellar atrophy and thinning of the brainstem (pons) were uniquely seen in our SSADH patients (3 subjects and 2 subjects respectively), but did not meet statistical significance.
Figure 2:
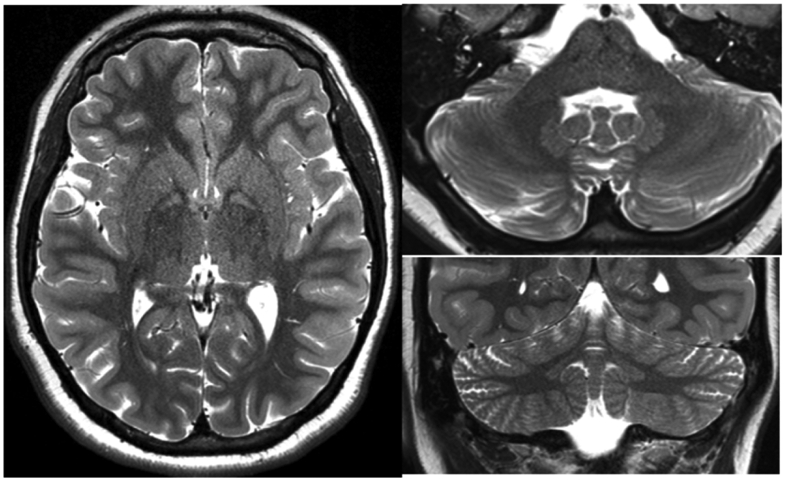
Representative T2 weighted imaging from SSADH patients, highlighting the hyperintense signal in globus pallidus (left) and dentate nuclei (right).
Figures 3 and 4 show the results from PRESS analysis. NAA/Cr ratio was significantly lower (p<0.05) in SSADHD patients in the posterior cingulate gyrus, whereas the NAA/Cr ratio was not significantly different in the basal ganglia and occipital lobe. Cho/Cr ratio was not significantly different in any of the targeted areas between SSADHD patients and control subjects.
Figure 3:
NAA/Cr ratio in three different regions, compared between SSADH patients and control subjects. Control group had a significantly higher NAA/Cr ratio.
Figure 4:
Cho/Cr ratio in three different regions, compared between SSADH patients and control subjects. There was no significant difference between two groups.
Figure 5 summarizes results from the LCModel analysis from the edited MEGAPRESS sequence. In all three regions where GABA was measured, SSADH deficiency patients had significantly higher (p<0.05) GABA/NAA ratios. In the posterior cingulate gyrus, the two groups were completely separated and on average the GABA/NAA ratio was nearly three times larger in SSADH deficiency patients. The ratio of GABA/NAA in occipital lobe of the controls was lower than posterior cingulate gyrus and basal ganglia, but again the SSADH deficiency patients had nearly three times more GABA in the occipital lobe. Although the GABA/NAA was significantly higher in basal ganglia, the difference was lower compared to the other regions.
Figure 5:
GABA/NAA ratio in three different regions, compared between SSADH patients and control subjects. In all three regions GABA/NAA was significantly higher in SSADH patients.
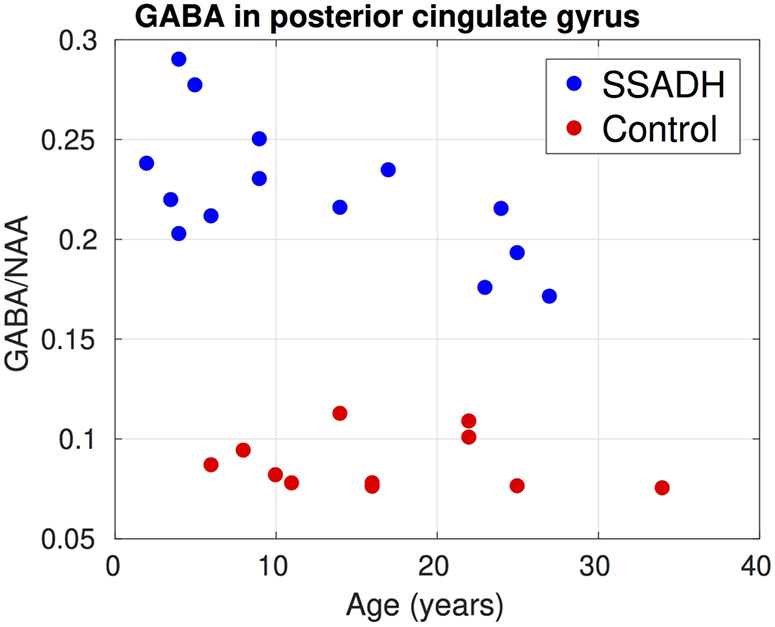
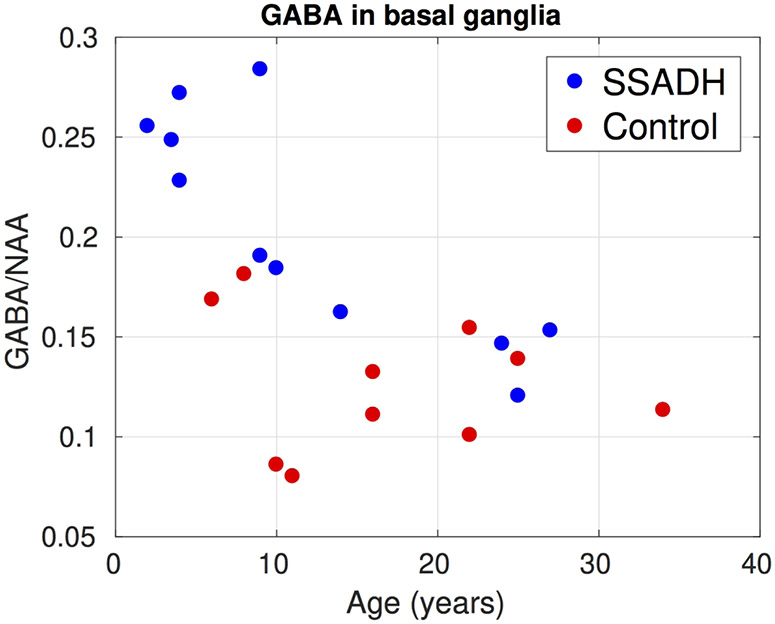
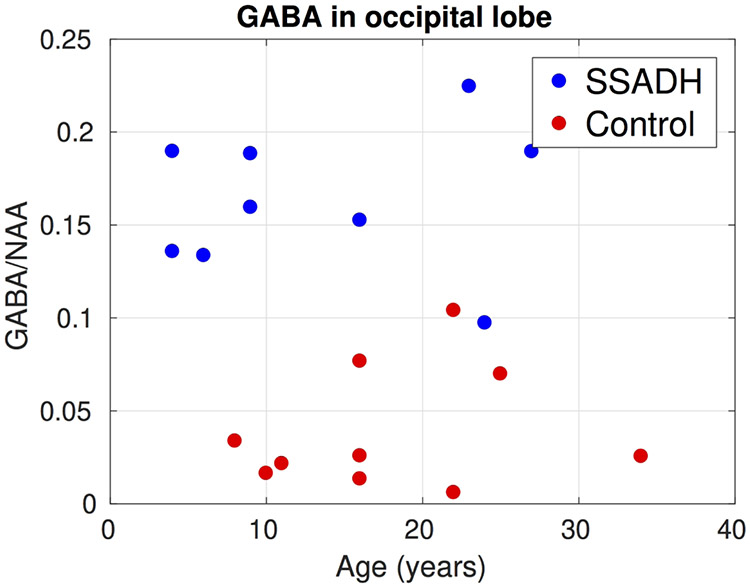
Figure 6, 7 and 8 show the change of GABA/NAA with respect to the age of subjects in the three regions where GABA was measured. In the PCG, the controls had a stable GABA/NAA ratio whereas it showed a slight decline with respect to age in SSADH deficiency patients. The change in GABA/NAA with respect to age was more pronounced in basal ganglia. For younger subjects there was a clear separation between SSADH deficiency patients and control subjects, whereas the groups were not separable for older subjects. There was no clear pattern observed in GABA/NAA in occipital lobe with respect to age.
Figure 6:
Change of GABA/NAA in the posterior cingulate gyrus with respect to subject age. Two groups were completely separated. In the controls GABA/NAA was mostly constant over age whereas in SSADH patients there was a small decline with respect to age.
Figure 7:
Change of GABA/NAA in the basal ganglia with respect to subject age. Although the GABA/NAA was higher in younger SSADH subjects, in the older subjects there was no significant difference between the two groups.
Figure 8:
Change of GABA/NAA in the occipital lobe with respect to subject age. GABA/NAA was significantly higher in SSADH deficiency patients.
DISCUSSION
We observed significant increases in GABA concentrations in SSADH deficiency patients for all three brain regions that were evaluated. Although GABA levels were higher in all three regions, each region had different patterns in terms of GABA changes with respect to age. Most strikingly we observed that GABA amounts in basal ganglia reduce with age and similar GABA levels in basal ganglia were observed in older children compared to control subjects. Similar age-related correlations with plasma GABA concentrations have been noted in SSADH deficiency10,11. In the two other regions GABA levels were higher for all age groups. It should be noted that these GABA changes were not dependent upon the NAA losses observed but that the GABA production per neuron was impacted by SSADH deficiency.
We did not observe any significant differences in Cho/Cr ratio between SSADH deficiency patients and control group. NAA/Cr ratio in posterior cingulate gyrus was significantly lower in SSADHD patients compared to controls. A previous study on postmortem tissue analysis12 observed decreased Creatine levels in SSADHD patients but the decrease was not statistically significant. Although NAA/Cr ratio was slightly lower in the occipital lobe of SSADH deficiency patients this result did not achieve statistical significance.
As this was a group of subjects that manifest developmental delay and intellectual disability, subject motion during the MRI acquisition was an important factor to consider. The MRI scanner is a confined and noisy environment and subjects were required to stay motionless during each imaging sequence (typically 5 minutes). As a result, young children and patients of all ages with developmental delay typically undergo sedation for an MRI exam. However, the MRI and MR spectroscopy were performed solely for research and therefore sedation was not used. Additionally, it has been previously shown that sedatives such as propofol may affect the GABA measurements13. Among 18 SSADH deficiency patients 5 of them had mild motion artifacts and 6 of them had moderate to severe motion artifacts. By comparison, only 1 control had mild motion artifacts and another one had moderate motion artifacts (p-value under Chi-square distribution of .04). Motion was also an important cofounder in spectroscopy data, as the MEGAPRESS sequence requires the subject to stay still during the on and off acquisitions. Therefore, only 14 subjects met the quality control metrics for inclusion in this study.
Previous neuroimaging studies of SSADH deficiency patients have shown increased T2-weighted MRI signal affecting the globus pallidus, cerebellar dentate nucleus, and subthalamic nucleus with variable cerebral and cerebellar atrophy. In our uniformly ascertained cohort, we consistently observed signal hyperintensities in globus pallidus and cerebellar dentate nucleus, but not in the subthalamic nucleus. Motion artifact could potentially explain this lack of subthalamic signal though the subthalamic site is less consistently reported in the literature, suggesting that it may be a less common imaging manifestation of SSADH deficiency. While not reaching statistical significance, 3 of 18 SSADH deficiency patients and no control patients demonstrated cerebellar atrophy.
The symmetric, mass neutral, and homogeneous T2 hyperintensity of the globus pallidi and dentate nuclei in SSADH deficiency patients is not pathognomonic. Nonetheless, this pattern suggests a limited number of toxic/metabolic conditions14,15. For example, globus pallidus signal abnormality is common in organic acidoses, and some of the diagnoses in this category are also commonly associated with dentate signal abnormality (e.g. L-2 hydroxyglutaric aciduria, glutaric acidemia type 1). However, disorders in this category often have additional signal abnormalities which are not reported in SSADH deficiency: L-2-hydroxyglutaric aciduria is associated with subcortical T2 prolongation, and glutaric acidemia type 1 is associated with broader signal abnormality in the central tegmental tracts and thalami as well as opercular widening. Like mitochondrial disorders which can have myriad imaging manifestations including pallidal/dentate signal abnormality, organic acidemias also differ from SSADH deficiency by their propensity for metabolic crises and periods of developmental regression. Infantile gangliosidoses may also involve the basal ganglia and have cerebellar atrophy. However, they are frequently seen in association with broad disturbances of myelination and other abnormalities unique to this class of disorders (e.g. cherry red macule, low T2 signal of the thalami). Gangliosidosis related basal ganglia signal abnormality is also typically not confined to the globus pallidus. Guanidinoacetate N-Methyltransferase (GAMT) Deficiency is associated with globus pallidus abnormalities and can have similar clinical symptomatology to SSADH deficiency (i.e. seizures, developmental delay, and behavioral problems). However, GAMT deficiency does not have dentate signal abnormality and has a unique appearance on MR spectroscopy, namely depressed creatine levels. Toxic causes of dentate and globus pallidus signal abnormalities include vigabatrin exposure and kernicterus. However, these entities can be distinguished by their typically broader, heterogeneous pattern of signal abnormality (e.g. thalami and central tegmental tracts with vigabatrin and hippocampus in kernicterus) as well as medication and birth history. Therefore, the finding of globus pallidus and dentate signal abnormality should prompt consideration of SSADH deficiency, especially in the setting of clinical data arguing against disorders with partly overlapping imaging features.
While there is not a confirmed correlation between phenotype severity with imaging in SSADH deficiency, reports of choreoathetosis, especially in acute infantile presentations3,6, and ataxia as a common manifestation 4,5, may correlate with consistent signal abnormalities in the basal ganglia and cerebellar dentate nuclei. The current natural history study in progress is designed to detect correlations between the imaging findings and clinical manifestations as well as metabolite concentrations from the accumulating biorepository.
While GABA spectroscopy shows excellent discrimination of normal versus SSADH deficiency patients, edited MR spectroscopy is not a routinely available sequence outside of research centers at present time, limiting its application in evaluating potential SSADH patients. However, routine proton MR spectroscopy does still have a role. Specifically, it can be used to exclude creatine deficiency syndromes (i.e. GAMT deficiency) and signs of a mitochondrial disorder (i.e. lactate).
The j-edited MEGAPRESS sequences allowed us to directly measure GABA; however, it should be noted that there is a small contribution of macromolecule signals, particularly those arising from spins at 3 ppm coupled to spins at 1.7 ppm that are affected by the editing pulses. This is an issue that all studies using MEGAPRESS must acknowledge as there are not well documented solutions to the problem14.
CONCLUSION
Here in this work we report our findings from an MRI study on a large cohort of SSADH deficiency patients, compared to age matched controls. By using advanced spectroscopy techniques we directly measured GABA in three different regions and show differences in GABA levels between SSADH deficiency patients and controls. We also report signal abnormalities in globus pallidus and cerebellar dentate nucleus, and also reduced cerebral volume.
Acknowledgments
Study funding: Research reported in this publication was supported in part by the National Institutes of Health (NIH) under Award Numbers R01 HD091142; The content is solely the responsibility of the authors and does not necessarily represent the official views of the NIH.
Appendix
Contributing Authors for the SSADH Deficiency Investigators Consortium (SDIC):
Phillip L Pearl1, Jean-Baptiste Roullet2, K. Michael Gibson2, Christos Papadelis3, Thomas Opladen4, Alexander Rotenberg1, Kiran Maski1, Melissa Tsuboyama1, Simon Warfield5, Onur Afacan5, Edward Yang5, Carolyn Hoffman6, Kathrin Jeltsch4, Jeffrey Krischer7, M. Ángeles Garcia Cazorla8, Erland Arning9
1 Department of Neurology, Boston Children’s Hospital, Harvard Medical School, Boston, MA; 2 College of Pharmacy, Department of Pharmacotherapy, Washington State University, Spokane, WA; 3 Jane and John Justin Neuroscience Center, Cook Children's Health Care System, 1500 Cooper Street, Fort Worth, TX 76104, USA; Department of Pediatrics, TCU and UNTHSC School of Medicine, Fort Worth, TX, USA; Laboratory of Children's Brain Dynamics, Division of Newborn Medicine, Boston Children's Hospital, Harvard Medical School, Boston, MA, USA; 4 Department of Child Neurology and Metabolic Disorders, University Children's Hospital, Heidelberg, Germany; 5 Department of Radiology, Boston Children’s Hospital, Harvard Medical School, Boston, MA; 6 SSADH Association; 7 Health Informatics Institute, Morsani College of Medicine, University of South Florida, Tampa, FL, USA; 8 Servicio de Neurologia and CIBERER, ISCIII, Hospital San Joan de Deu, Barcelona, Spain; 9 Institute of Metabolic Disease, Baylor Research Institute, Dallas, Texas, USA
Footnotes
Disclosure of Conflict of Interests:
The authors have no conflicts of interest.
References:
- 1.Gibson KM, Gupta M, Pearl PL, et al. Significant behavioral disturbances in succinic semialdehyde dehydrogenase (SSADH) deficiency (gamma-hydroxybutyric aciduria). Biol Psychiatry. 2003. doi: 10.1016/S0006-3223(03)00113-6 [DOI] [PubMed] [Google Scholar]
- 2.Kim KJ, Pearl PL, Jensen K, et al. Succinic semialdehyde dehydrogenase: Biochemical-molecular-clinical disease mechanisms, redox regulation, and functional significance. Antioxidants Redox Signal. 2011. doi: 10.1089/ars.2010.3470 [DOI] [PMC free article] [PubMed] [Google Scholar]
- 3.Pearl PL, Wiwattanadittakul N, Roullet J-B, Gibson KM. Succinic semialdehyde dehydrogenase deficiency. In: GeneReviews®[Internet]. University of Washington, Seattle; 2016. [PubMed] [Google Scholar]
- 4.Pearl PL, Novomy EJ, Acosta MT, Jakobs C, Gibson KM. Succinic semialdehyde dehydrogenase deficiency in children and adults. In: Annals of Neurology. ; 2003. doi: 10.1002/ana.10629 [DOI] [PubMed] [Google Scholar]
- 5.Acosta MT, Munasinghe J, Pearl PL, et al. Cerebellar atrophy in human and murine succinic semialdehyde dehydrogenase deficiency. J Child Neurol. 2010. doi: 10.1177/0883073810368137 [DOI] [PMC free article] [PubMed] [Google Scholar]
- 6.Wang KY, Barker PB, Lin DDM. A case of acute onset succinic semialdehyde dehydrogenase deficiency: neuroimaging findings and literature review. Child’s Nerv Syst ChNS Off J Int Soc Pediatr Neurosurg. 2016;32(7):1305–1309. doi: 10.1007/s00381-015-2942-9 [DOI] [PubMed] [Google Scholar]
- 7.Parviz M, Vogel K, Gibson KM, Pearl PL. Disorders of GABA metabolism: SSADH and GABA-transaminase deficiencies. J Pediatr epilepsy. 2014;3(4):217–227. [DOI] [PMC free article] [PubMed] [Google Scholar]
- 8.Mescher M, Merkle H, Kirsch J, Garwood M, Gruetter R. Simultaneous in vivo spectral editing and water suppression. NMR Biomed An Int J Devoted to Dev Appl Magn Reson Vivo. 1998;11(6):266–272. [DOI] [PubMed] [Google Scholar]
- 9.Provencher SW. Automatic quantitation of localized in vivo1H spectra with LCModel - Provencher - 2001 - NMR in Biomedicine - Wiley Online Library. NMR Biomed. 2001. [DOI] [PubMed] [Google Scholar]
- 10.DiBacco ML, Roullet JB, Kapur K, et al. Age-related phenotype and biomarker changes in SSADH deficiency. Ann Clin Transl Neurol. 2019. doi: 10.1002/acn3.696 [DOI] [PMC free article] [PubMed] [Google Scholar]
- 11.Jansen EE, Vogel KR, Salomons GS, Pearl PL, Roullet JB, Gibson KM. Correlation of blood biomarkers with age informs pathomechanisms in succinic semialdehyde dehydrogenase deficiency (SSADHD), a disorder of GABA metabolism. J Inherit Metab Dis. 2016. doi: 10.1007/s10545-016-9980-7 [DOI] [PMC free article] [PubMed] [Google Scholar]
- 12.Kirby T, Walters DC, Brown M, et al. Post-mortem tissue analyses in a patient with succinic semialdehyde dehydrogenase deficiency (SSADHD). I. Metabolomic outcomes. Metab Brain Dis. 2020. doi: 10.1007/s11011-020-00550-1 [DOI] [PMC free article] [PubMed] [Google Scholar]
- 13.Ruesch D, Neumann E, Wulf H, Forman SA. An allosteric coagonist model for propofol effects on $α$1$β$2$γ$2L $γ$-aminobutyric acid type A receptors. Anesthesiol J Am Soc Anesthesiol. 2012; 116(1):47–55. [DOI] [PMC free article] [PubMed] [Google Scholar]
- 14.Yang E, Prabhu SP. Imaging Manifestations of the Leukodystrophies, Inherited Disorders of White Matter. Radiol Clin North Am. 2014. doi: 10.1016/j.rcl.2013.11.008 [DOI] [PubMed] [Google Scholar]
- 15.Rodan L and Yang E “Metabolic Imaging in Metabolic Movement Disorders” in Movement Disorders and Inherited Metabolic Disorders: Recognition, Understanding, Improving Outcomes, Pearl PL and Ebrahimi-Fakhri D, Cambridge Press; 2020 [Google Scholar]
- 16.Plecko B, Stöckler-Ipsiroglu S, Gruber S, et al. Degree of hypomyelination and magnetic resonance spectroscopy findings in patients with Pelizaeus Merzbacher phenotype. Neuropediatrics. 2003. doi: 10.1055/s-2003-41276 [DOI] [PubMed] [Google Scholar]
- 17.Jandeaux C, Kuchcinski G, Ternynck C, et al. Biometry of the cerebellar vermis and brain stem in children: MR imaging reference data from measurements in 718 children. Am J Neuroradiol. 2019;40(11): 1835–1841. [DOI] [PMC free article] [PubMed] [Google Scholar]
- 18.Garel C, Cont I, Alberti C, Josserand E, Moutard ML, le Pointe HD. Biometry of the corpus callosum in children: MR imaging reference data. Am J Neuroradiol. 2011;32(8): 1436–1443. [DOI] [PMC free article] [PubMed] [Google Scholar]


