

Abstract
Background
Although muscle quality evaluations are currently considered important for diagnosing sarcopenia, data from the general population are lacking. This study used mid‐thigh computed tomography measurements to evaluate age‐related and sex‐related differences in quadriceps femoris muscle quality and mass and their relationships with knee extension strength (KES).
Methods
Cross‐sectional data from 520 Japanese individuals (273 men and 247 women, mean age: 63.1 ± 10.6 years) were analysed. Mass and quality were assessed using quadriceps cross‐sectional areas (CSAs) and computed tomography values (CTVs), respectively. The four constituent muscles, intermuscular adipose tissue, and entire quadriceps area (total quadriceps muscles + intermuscular adipose tissue) were assessed, and the data were stratified by five age groups and sex. To evaluate age‐related decline, linear and quadratic equations were tested for fit according to the constituent muscles and sex. KES could be measured in 472 of the 520 participants (254 men and 218 women, mean age: 62.3 ± 10.3). Multiple linear regression analyses with age‐adjusted models were then used for evaluating the relationships between KES and quadriceps measurements.
Results
All muscle CSAs and CTVs showed downward trends with age (men: P < 0.001 for all; women: vastus medialis CTV, P = 0.004; others, P < 0.001); the intermuscular adipose tissue CSA did not show any trend (men: P = 0.938; women: P = 0.139), although its percentage of the entire quadriceps area showed an upward trend in both sexes (P < 0.001). Men exhibited a quadratic decline in the CSAs for the entire quadriceps area (P = 0.016), total quadriceps muscles (P = 0.021), the vastus medialis (P = 0.010) and vastus lateralis (P = 0.038), and all CTVs (rectus femoris, P = 0.044; others, P < 0.001). Women exhibited a quadratic equation in the CTV for rectus femoris (P = 0.031), but a linear decline in the other variables (P < 0.001 for all). Both the total quadriceps muscles CSA and CTV were significantly associated with KES in both sexes (P < 0.001). For each muscle, the CSAs of the vastus medialis (P < 0.001) and vastus intermedius (P = 0.001) were significantly associated with KES in men, whereas the vastus medialis CSA (P < 0.001), vastus lateralis CSA (P = 0.006), rectus femoris CSA (P = 0.020), and vastus intermedius CTV (P = 0.025) were significantly associated with KES in women
Conclusions
Age‐related quadriceps femoris changes in mass and quality differed by sex and the constituent muscles. The constituent muscles contributing to KES differed between men and women. Quadriceps CSA and CTV measurements are useful for objectively assessing age‐related and sex‐related muscle deterioration and KES.
Keywords: Computed tomography, Quadriceps femoris, Muscle quality, Muscle mass, Aging, Sarcopenia
Introduction
In 2018, the European Working Group on Sarcopenia in Older People considered muscle quality and muscle mass as parameters for sarcopenia diagnosis. 1 Qualitative changes in skeletal muscle are caused by a reduction in type II fibre size, 2 , 3 intramyocellular lipid and intramuscular and intermuscular fat accumulation, 4 , 5 and muscle fibrosis. 6 Imaging modalities, such as computed tomography (CT) and magnetic resonance imaging, enable detailed cross‐sectional assessments of the muscle components and are useful for assessing muscle quality. 7 , 8 Accordingly, although it is difficult to strictly distinguish intramyocellular and extramyocellular lipids, researchers have attempted to evaluate thigh and abdominal muscle fat infiltration using CT values (CTVs) indicating muscle attenuation. 9 , 10 Considering that the volume of muscle mass loss that occurs with age is twice as large in the lower extremities than in the upper extremities, age‐related differences are more evident in the lower extremities. 11 , 12 Moreover, reports have shown that the quadriceps muscle (Qc) exhibits greater muscle mass loss with age than do the hamstrings and other posterior thigh muscles. 13 As such, a detailed evaluation of age‐related differences in Qc may lead to a reasonable assessment of age‐related sarcopenic changes. Therefore, this study aimed to describe and evaluate age‐related and sex‐related differences in Qc muscle mass and quality and their relationships with knee extension strength (KES) using mid‐thigh CT measurements, focusing on the entire Qc and its constituent muscles and adipose tissues, in community‐living middle‐aged and older Japanese individuals.
Subjects and methods
Participants
The National Institute for Longevity Sciences‐Longitudinal Study of Aging (NILS‐LSA) is a longitudinal study on age‐related differences among randomly selected middle‐aged and older community dwellers aged ≥40 years from the resident registrations in Obu city and Higashiura town (Aichi prefecture, Japan). The NILS‐LSA is operated as a dynamic cohort that includes age‐related and sex‐matched random participants of the same number of dropout participants and participants aged 40 years who are newly recruited every year. 14 The seventh wave of the NILS‐LSA was conducted in July 2010 to July 2012 and included 2330 participants. Of the 2330 participants, 525 consecutive participants after 2 February 2012 were included in this study. The right mid‐thigh CT data of the participants were stored in the digital imaging and communications in medicine format with measurable CTVs. Of the 525 consecutive participants during this period, 520 (273 men and 247 women; mean age: 63.1 years, age range: 40–91 years) were included in the study, excluding 5 who refused or were unable to undergo CT imaging or whose images were of poor quality and difficult to evaluate. Among the included subjects, 48 who could not be tested owing to illness on the day of the study (e.g. knee pain, back pain, fatigue or light headedness), schedule delays, or severe comorbidities were excluded, and 472 (254 men and 218 women; mean age: 62.3 years, age range: 40–89 years) whose right KES could be measured were included in the KES analysis. Written informed consent was obtained from all the participants. This research was approved by the institutional ethics committee with certification No. 1361 and performed in accordance with the ethical standards laid down in the 1964 Declaration of Helsinki and its later amendments.
Quadriceps femoris computed tomography
The participants underwent a single‐slice CT examination of the right mid‐thigh (location: midpoint of the superior pole of the patella and inguinal crease; settings: 120 kV, 120 mA; rotation time: 1 s; and field of view: 233 mm) using the SOMATOM Sensation 64™ (Siemens, Munich, Germany). The cross‐sectional areas (CSAs) and CTVs from the CT images were analysed using SliceOmatic software, Version 5.0 (Tomovision, Magog, Canada). The CSAs were evaluated as a measure of muscle and intermuscular fat mass, and CTVs were evaluated as a measure of muscle quality and reflected the intramuscular fat and intramyocellular lipids. Manual range selection was used for each Qc constituent muscle [vastus medialis (VM), vastus lateralis (VL), vastus intermedius (VI), and rectus femoris (RF)], after which their CSAs and average CTVs were calculated and added [i.e. the Qc (total Qc) CSA and mean CTV of the four constituent muscles, VM, VL, VI, and RF, without the intermuscular adipose tissue (IMAT) were calculated]. Moreover, manual range selection was used for measuring the entire Qc, including the IMAT (entire Qc), followed by calculation of the CSA and average CTV. The IMAT CSA was calculated as the entire Qc CSA minus the total Qc CSA, but the IMAT CTV was not measured because the IMAT was completely made of adipose tissue. All measurements were made once by a trained research assistant blinded to the subject data. For confirmation, all measurements were re‐examined by another trained assistant, and questionable measurements were discussed by two investigators, Y.M. and Y.S., who made the final decisions (Figure 1).
Figure 1.
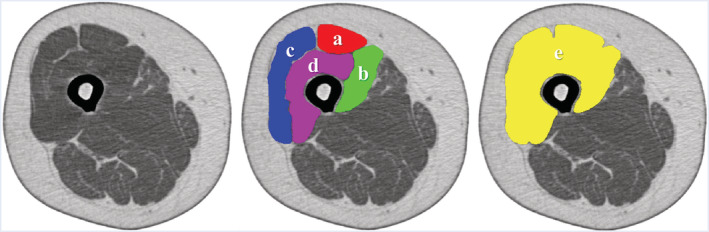
Measurement of quadriceps femoris using computed tomography (CT). Mid‐thigh CT (reversed color). a: Rectus femoris. b: Vastus medialis. c: Vastus lateralis. d: Vastus intermedius. a + b + c + d: Total quadriceps femoris. e: Entire quadriceps femoris. e − a − b − c − d: Intermuscular adipose tissue.
Knee extension strength
Isometric KES was measured using T.K.K.1281a (Takei Scientific Instruments, Niigata, Japan). The participants were seated on a chair with their hip and knee joints flexed to 90°, after which isometric KES was measured three times; the highest measured value was used for evaluation. The measurements are presented in newtons (N).
Skeletal muscle mass measured using dual‐energy X‐ray absorptiometry
Skeletal muscle mass was also measured using QDR‐4500 DXA (Hologic, Bedford, MA, USA). The subjects were placed in the supine position on the dual‐energy X‐ray absorptiometry (DXA) table with their limbs close to their body. The whole‐body lean soft tissue mass comprised the soft tissue masses of the arms, legs, and trunk. Appendicular skeletal muscle mass (ASM) was determined by combining the lean soft tissue masses of the arms and legs. The skeletal muscle mass index (SMI) (kg/m2) was calculated as ASM/height2. ASM, SMI, the right lower extremity lean mass (rLM), and rLM/height2 were included in the analysis as reference values of muscle mass.
Other parameters
The body height and weight of all participants were assessed. Body mass index (BMI) was calculated as weight/height2 (kg/m2). The participants' medical history and smoking status were obtained using questionnaires, and total physical activity was obtained through participant interviews with trained interviewers using a semi‐quantitative assessment method. Total caloric and alcohol intakes were assessed using a 3 day dietary record.
Statistical analysis
Statistical analysis was performed using SAS, Version 9.3 (SAS Institute, NC, USA), with p < 0.05 indicating statistical significance. The data for the CSAs, CTVs, area percentages of the Qc constituents, DXA measurements, and KES were stratified by five age groups (40s, 40–49 years; 50s, 50–59 years; 60s, 60–69 years; 70s, 70–79 years; 80s‐, 80–91 years) and sex, and trends were identified using a general linear model. The relationships between age groups and sex were further analysed using a general linear model analysis adjusted for participant characteristics. Variables showing an interaction between age groups and sex were further analysed using the Tukey–Kramer method for post hoc multiple comparisons; comparisons were made between men and women within the same‐age groups. Moreover, multiple regression analyses were performed according to sex, with the muscle CSAs, CTVs, ASM, and rLM included as objective variables and age and age quadratic terms included as explanatory variables. A single regression analysis for age alone was performed when the quadratic term was not significant. The regression equation including terms determined to be significant was used to examine the type of decline. Only variables showing linear decline in both sexes were tested for differences in slope by assessing the interaction between age and sex. The coefficient of determination (R 2) indicating the fit of the regression equation is shown in the graphs. Multiple regression analysis was performed to examine the relationship between each variable and KES according to sex, with KES as the objective variable; total Qc CSA, total Qc CTV, and IMAT CSA as the explanatory variables in the non‐age‐adjusted and age‐adjusted models; and CSA and CTV of the Qc constituent muscles and IMAT CSA as the explanatory variables in the non‐age‐adjusted and age‐adjusted models.
Results
The participant characteristics are summarized in Table 1. The men had a mean age of 62.9 ± 10.4 years, a mean height of 166.2 ± 6.4 cm, a mean weight of 64.3 ± 9.2 kg, and a mean BMI of 23.2 ± 2.7 kg/m2, whereas the women had a mean age of 63.3 ± 10.9 years, a mean height of 153.5 ± 6.0 cm, a mean weight of 53.3 ± 9.6 kg, and a mean BMI of 22.6 ± 3.5. Although no significant differences in age were observed between the men and women (P = 0.659), the men had significantly higher values for height (P < 0.001), weight (P < 0.001), BMI (P < 0.015), alcohol intake (P < 0.001), and total caloric intake (P < 0.001) but lower values for total physical activity (P < 0.001) than the women. Moreover, a history of heart disease (P = 0.041) and smoking (P < 0.001) were significantly more common in the men than in the women, whereas a history of dyslipidaemia (P = 0.043) was significantly more common in the women than in the men. No significant differences regarding a history of hypertension (P = 0.113), diabetes mellitus (P = 0.173), or stroke (P = 0.125) were noted between the men and women.
Table 1.
Subject characteristics
| Characteristic | Men n = 273 | Women n = 247 | P value | ||
|---|---|---|---|---|---|
| Age | 62.87 | ±10.4 | 63.28 | ±10.9 | 0.659 |
| 40s, n (%) | 22 | (8.1%) | 23 | (9.3%) | 0.935 |
| 50s, n (%) | 90 | (33.0%) | 77 | (31.2%) | |
| 60s, n (%) | 86 | (31.5%) | 75 | (30.4%) | |
| 70s, n (%) | 57 | (20.9%) | 52 | (21.1%) | |
| 80s‐, n (%) | 18 | (6.6%) | 20 | (8.1%) | |
| Body height (cm) | 166.2 | ±6.4 | 153.5 | ±6.0 | <0.001 |
| Body weight (kg) | 64.29 | ±9.2 | 53.29 | ±9.6 | <0.001 |
| Body mass index (kg/m2) | 23.24 | ±2.7 | 22.57 | ±3.5 | 0.015 |
| Stroke, n (%) | 5 | (1.8%) | 11 | (4.5%) | 0.125 |
| Heart disease, n (%) | 22 | (8.1%) | 9 | (3.6%) | 0.041 |
| Diabetes, n (%) | 30 | (11.0%) | 18 | (7.3%) | 0.173 |
| Hypertension, n (%) | 99 | (36.3%) | 73 | (29.6%) | 0.113 |
| Hyperlipidaemia, n (%) | 58 | (21.2%) | 72 | (29.1%) | 0.043 |
| Smoker, n (%) | 60 | (22.0%) | 8 | (3.2%) | <0.001 |
| Alcohol intake (g/day) | 14.89 | ±18.4 | 3.06 | ±9.0 | <0.001 |
| Total caloric intake (kcal/day) | 2157 | ±418 | 1792 | ±298 | <0.001 |
| Total physical activity (METs × min × 10−3/year) | 686.7 | ±68.0 | 715.2 | ±49.4 | <0.001 |
Values are expressed as number (%). Mean ± standard deviation. P values were obtained using the t‐test for continuous data and the χ 2 test and Fisher's exact test for categorical data. Age groups: 40s, 40–49 years; 50s, 50–59 years; 60s, 60–69 years; 70s, 70–79 years; 80s‐, 80–91 years.
METs, metabolic equivalents.
Table 2 shows the mean CSAs, mean CTVs for each muscle, mean DXA measurements, and mean KES by sex for each age group. Except for IMAT CSA, SMI, and rLM/height2, all the variables exhibited a significant downward trend with age in both sexes (men: P < 0.001 for all; women: VM CTV, P = 0.004; others, P < 0.001), and SMI and rLM/height2 showed a significant downward trend only in the men (P = 0.004 and 0.007, respectively). Considering the percentage of the entire Qc area, among the Qc constituents, only the RF in the men showed a significant downward trend (P = 0.038) with age, whereas IMAT showed a significant upward trend in both sexes (P < 0.001). In Table 3, the non‐adjusted general linear models presented sex‐related differences in all variables except RF CTV, which had higher mean values for the men (RF CTV, P = 0.402; others, P < 0.001). The general linear models adjusted for BMI, medical history, smoking status, alcohol intake, total caloric intake, and total physical activity revealed a main age group effect for all variables, except for IMAT CSA (IMAT CSA, P = 0.651; SMI, P = 0.010; rLM/height2, P = 0.017; others, P < 0.001); a main sex effect for all variables (RF CTV, P = 0.005; others, P < 0.001); and an interaction between sex and age for RF CTV (P = 0.002), VL CTV (P = 0.029), VI CTV (P = 0.036), entire Qc CTV (P = 0.008), total Qc CTV (P = 0.006), and KES (P = 0.008). Post hoc multiple comparison tests for the variables with interaction effects showed that the KES values were significantly higher in the men than in the women within the same‐age group (40s–70s, P < 0.001; 80s‐, P = 0.045). However, VL CTV and Qc CTVs showed significant sex‐related differences among the individuals in their 40s, 50s, 60s, and 70s, but not among those in their 80s‐ (VL CTV 40s, P = 0.009; 50s–70s, P < 0.001; 80s‐, P = 0.888; entire Qc CTV 40s, P = 0.004; 50s–70s, P < 0.001; 80s‐, P = 0.960; total Qc CTV 40s, P = 0.010; 50s–70s, P < 0.001; 80s‐, P = 0.926). RF CTV showed significant sex‐related differences only in the subjects in their 60s (60s, P = 0.007; others, P > 0.05). VI CTV showed significant sex‐related differences in the subjects in their 60s and 70s (60s–70s, P < 0.001; others, P > 0.05). Among the same‐age groups that showed significant sex‐related differences, the least square mean values for the men were higher.
Table 2.
Quadriceps cross‐sectional area, computed tomography attenuation value, and muscle mass measurements according to dual‐energy X‐ray absorptiometry
| Variable | Men | Women | |||||||||||
|---|---|---|---|---|---|---|---|---|---|---|---|---|---|
| 40s (n = 22) | 50s (n = 90) | 60s (n = 86) | 70s (n = 57) | 80s‐ (n = 18) | P for trend | 40s (n = 23) | 50s (n = 77) | 60s (n = 75) | 70s (n = 52) | 80s‐ (n = 20) | P for trend | ||
| Cross‐sectional area (cm 2 ) | |||||||||||||
| a. Rectus femoris | 7.68 ± 0.33 | 7.19 ± 0.16 | 6.48 ± 0.17 | 5.60 ± 0.20 | 4.99 ± 0.36 | <0.001 | 5.75 ± 0.23 | 5.18 ± 0.13 | 4.86 ± 0.13 | 4.27 ± 0.15 | 4.24 ± 0.25 | <0.001 | |
| b. Vastus medialis | 13.1 ± 0.6 | 13.4 ± 0.3 | 12.5 ± 0.3 | 11.0 ± 0.4 | 9.80 ± 0.67 | <0.001 | 10.3 ± 0.4 | 9.14 ± 0.22 | 8.04 ± 0.23 | 7.98 ± 0.27 | 6.90 ± 0.44 | <0.001 | |
| c. Vastus lateralis | 21.3 ± 0.7 | 20.2 ± 0.4 | 19.5 ± 0.4 | 16.8 ± 0.5 | 15.3 ± 0.8 | <0.001 | 16.4 ± 0.6 | 15.6 ± 0.3 | 13.4 ± 0.3 | 12.9 ± 0.4 | 11.2 ± 0.6 | <0.001 | |
| d. Vastus intermedius | 19.9 ± 0.7 | 19.4 ± 0.4 | 17.6 ± 0.4 | 15.6 ± 0.4 | 14.3 ± 0.8 | <0.001 | 14.2 ± 0.5 | 13.5 ± 0.3 | 12.5 ± 0.3 | 11.6 ± 0.4 | 10.4 ± 0.6 | <0.001 | |
| e. Entire quadriceps | 63.6 ± 1.8 | 62.1 ± 0.9 | 58.1 ± 0.9 | 50.9 ± 1.1 | 46.1 ± 2.0 | <0.001 | 48.3 ± 1.3 | 45.2 ± 0.7 | 40.4 ± 0.7 | 38.2 ± 0.9 | 34.4 ± 1.4 | <0.001 | |
| f. Total quadriceps | 61.9 ± 1.8 | 60.1 ± 0.9 | 56.1 ± 0.9 | 49.0 ± 1.1 | 44.3 ± 2.0 | <0.001 | 46.6 ± 1.3 | 43.5 ± 0.7 | 38.9 ± 0.7 | 36.7 ± 0.9 | 32.8 ± 1.4 | <0.001 | |
| g. Intermuscular adipose tissue | 1.69 ± 0.11 | 1.99 ± 0.06 | 1.93 ± 0.06 | 1.84 ± 0.07 | 1.78 ± 0.13 | 0.938 | 1.69 ± 0.09 | 1.72 ± 0.05 | 1.58 ± 0.05 | 1.55 ± 0.06 | 1.56 ± 0.10 | 0.139 | |
| h. Percentage of constituents a:b:c:d:g (%) a | 12:20:33:31:3 | 12:22:32:31:3 | 11:21:34:30:3 | 11:22:33:31:4 | 11:21:33:31:4 | a: 0.038g: <0.001 | 12:21:34:29:4 | 12:20:35:30:4 | 12:20:33:31:4 | 11:21:34:30:4 | 12:20:33:30:5 | g: <0.001 | |
| Computed tomography attenuation value (HU) | |||||||||||||
| i. Rectus femoris | 56.6 ± 0.8 | 54.0 ± 0.4 | 54.2 ± 0.4 | 52.2 ± 0.5 | 49.4 ± 0.9 | <0.001 | 56.6 ± 0.9 | 54.3 ± 0.5 | 52.6 ± 0.5 | 51.8 ± 0.6 | 52.2 ± 0.9 | <0.001 | |
| j. Vastus medialis | 58.5 ± 0.7 | 58.3 ± 0.4 | 57.6 ± 0.4 | 55.4 ± 0.5 | 53.2 ± 0.8 | <0.001 | 52.9 ± 0.8 | 53.4 ± 0.4 | 51.8 ± 0.4 | 50.1 ± 0.5 | 51.0 ± 0.9 | 0.004 | |
| k. Vastus lateralis | 56.5 ± 0.8 | 54.8 ± 0.4 | 54.6 ± 0.4 | 51.6 ± 0.5 | 49.3 ± 0.9 | <0.001 | 52.8 ± 0.8 | 51.7 ± 0.5 | 49.8 ± 0.5 | 47.9 ± 0.6 | 48.5 ± 0.9 | <0.001 | |
| l. Vastus intermedius | 58.7 ± 0.7 | 56.5 ± 0.4 | 56.4 ± 0.4 | 53.1 ± 0.4 | 49.8 ± 0.8 | <0.001 | 56.7 ± 0.8 | 55.2 ± 0.5 | 52.9 ± 0.5 | 50.1 ± 0.6 | 49.0 ± 0.9 | <0.001 | |
| m. Entire quadriceps | 57.0 ± 0.7 | 55.0 ± 0.3 | 54.7 ± 0.3 | 51.6 ± 0.4 | 48.5 ± 0.8 | <0.001 | 53.2 ± 0.8 | 52.1 ± 0.4 | 50.0 ± 0.4 | 47.8 ± 0.5 | 47.9 ± 0.8 | <0.001 | |
| n. Total quadriceps | 57.6 ± 0.6 | 56.0 ± 0.3 | 55.8 ± 0.3 | 53.0 ± 0.4 | 50.4 ± 0.7 | <0.001 | 54.5 ± 0.7 | 53.5 ± 0.4 | 51.6 ± 0.4 | 49.6 ± 0.4 | 49.7 ± 0.7 | <0.001 | |
| Dual‐energy X‐ray absorptiometry | |||||||||||||
| o. Appendicular skeletal muscle mass (kg) | 21.9 ± 0.6 | 21.9 ± 0.3 | 20.8 ± 0.3 | 19.5 ± 0.4 | 17.8 ± 0.6 | <0.001 | 15.6 ± 0.4 | 15.0 ± 0.2 | 14.2 ± 0.2 | 13.6 ± 0.3 | 13.3 ± 0.5 | <0.001 | |
| p. Skeletal muscle mass index (kg/m2) | 7.46 ± 0.16 | 7.69 ± 0.08 | 7.62 ± 0.08 | 7.24 ± 0.10 | 6.95 ± 0.18 | 0.004 | 6.01 ± 0.16 | 6.18 ± 0.09 | 6.07 ± 0.09 | 5.97 ± 0.11 | 5.98 ± 0.17 | 0.574 | |
| q. Lean mass of right lower extremity (kg) | 8.14 ± 0.22 | 8.08 ± 0.11 | 7.67 ± 0.11 | 7.20 ± 0.14 | 6.65 ± 0.24 | <0.001 | 6.00 ± 0.18 | 5.67 ± 0.10 | 5.32 ± 0.10 | 5.15 ± 0.12 | 5.06 ± 0.19 | <0.001 | |
| r. Lean mass of right lower extremity/height2 | 2.77 ± 0.06 | 2.83 ± 0.03 | 2.81 ± 0.03 | 2.67 ± 0.04 | 2.59 ± 0.07 | 0.007 | 2.31 ± 0.06 | 2.35 ± 0.03 | 2.28 ± 0.03 | 2.26 ± 0.04 | 2.28 ± 0.07 | 0.431 | |
| Knee extension strength | (n = 22) | (n = 85) | (n = 82) | (n = 50) | (n = 15) | (n = 23) | (n = 73) | (n = 65) | (n = 46) | (n = 11) | |||
| s. Knee extension strength (N) | 537.6 ± 19.1 | 499.7 ± 9.7 | 458.2 ± 9.9 | 364.6 ± 12.7 | 326.9 ± 23.1 | <0.001 | 333.9 ± 14.5 | 314.6 ± 8.2 | 297.5 ± 8.7 | 259.4 ± 10.3 | 205.0 ± 21.0 | <0.001 | |
Age groups: 40s, 40–49 years; 50s, 50–59 years; 60s, 60–69 years; 70s, 70–79 years; 80s‐, 80–91 years. Values are expressed as mean ± standard error.
Percentage of the area of each muscle (a–d) and intermuscular adipose tissue (g) in the area of the entire quadriceps. Only age‐related trends in the proportions of each constituent that were significantly different are shown.
Table 3.
Non‐adjusted general linear models and general linear models adjusted for body mass index, medical history, smoking status, alcohol intake, total caloric intake, and total physical activity: the relationships between age groups and sex
| Variable | Non‐adjusted model | Adjusted model | |||||||||||||||||
|---|---|---|---|---|---|---|---|---|---|---|---|---|---|---|---|---|---|---|---|
| Mean | Main effect | Interaction effect | Age groups showing sex‐related differences* in the same age group with interaction effect | Main effect | Interaction effect | Age groups showing sex‐related differences* in the same age group with interaction effect | |||||||||||||
| Age group | Sex | Age group | Sex | ||||||||||||||||
| Men | Women | P | P | P | P | P | P | ||||||||||||
| Cross‐sectional area | |||||||||||||||||||
| a. | Rectus femoris | 6.39 ± 0.10 | 4.86 ± 0.10 | <0.001 | <0.001 | 0.061 | — | <0.001 | <0.001 | 0.119 | — | ||||||||
| b | Vastus medialis | 11.9 ± 0.2 | 8.48 ± 0.18 | <0.001 | <0.001 | 0.040 | 40s | 50s | 60s | 70s | 80s‐ | <0.001 | <0.001 | 0.200 | — | ||||
| c. | Vastus lateralis | 18.6 ± 0.2 | 13.9 ± 0.2 | <0.001 | <0.001 | 0.057 | — | <0.001 | <0.001 | 0.198 | — | ||||||||
| d. | Vastus intermedius | 17.4 ± 0.2 | 12.4 ± 0.2 | <0.001 | <0.001 | 0.093 | — | <0.001 | <0.001 | 0.096 | — | ||||||||
| e. | Entire quadriceps | 56.2 ± 0.6 | 41.3 ± 0.6 | <0.001 | <0.001 | 0.033 | 40s | 50s | 60s | 70s | 80s‐ | <0.001 | <0.001 | 0.093 | — | ||||
| f. | Total quadriceps | 54.3 ± 0.6 | 39.7 ± 0.6 | <0.001 | <0.001 | 0.030 | 40s | 50s | 60s | 70s | 80s‐ | <0.001 | <0.001 | 0.080 | — | ||||
| g. | Intermuscular adipose tissue | 1.85 ± 0.04 | 1.62 ± 0.04 | 0.035 | <0.001 | 0.358 | — | 0.651 | <0.001 | 0.604 | — | ||||||||
| Computed tomography attenuation value | |||||||||||||||||||
| i. | Rectus femoris | 53.3 ± 0.3 | 53.5 ± 0.3 | <0.001 | 0.402 | 0.025 | <0.001 | 0.005 | 0.002 | 60s | |||||||||
| j. | Vastus medialis | 56.6 ± 0.3 | 51.8 ± 0.3 | <0.001 | <0.001 | 0.090 | — | <0.001 | <0.001 | 0.370 | — | ||||||||
| k. | Vastus lateralis | 53.4 ± 0.3 | 50.1 ± 0.3 | <0.001 | <0.001 | 0.052 | — | <0.001 | <0.001 | 0.029 | 40s | 50s | 60s | 70s | |||||
| l. | Vastus intermedius | 54.9 ± 0.3 | 52.8 ± 0.3 | <0.001 | <0.001 | 0.056 | — | <0.001 | <0.001 | 0.036 | 60s | 70s | |||||||
| m. | Entire quadriceps | 53.3 ± 0.3 | 50.2 ± 0.3 | <0.001 | <0.001 | 0.017 | 40s | 50s | 60s | 70s | <0.001 | <0.001 | 0.008 | 40s | 50s | 60s | 70s | ||
| n. | Total quadriceps | 54.6 ± 0.2 | 51.8 ± 0.2 | <0.001 | <0.001 | 0.009 | 40s | 50s | 60s | 70s | <0.001 | <0.001 | 0.006 | 40s | 50s | 60s | 70s | ||
| Dual Energy X‐ray Absorptiometry | |||||||||||||||||||
| o. | Appendicular skeletal muscle mass | 20.4 ± 0.2 | 14.3 ± 0.2 | <0.001 | <0.001 | 0.049 | 40s | 50s | 60s | 70s | 80s‐ | <0.001 | <0.001 | 0.060 | — | ||||
| p. | Skeletal muscle mass index | 7.39 ± 0.06 | 6.04 ± 0.06 | <0.001 | <0.001 | 0.202 | — | 0.010 | <0.001 | 0.272 | — | ||||||||
| q. | Lean mass of right lower extremity | 7.55 ± 0.07 | 5.44 ± 0.07 | <0.001 | <0.001 | 0.117 | — | <0.001 | <0.001 | 0.160 | — | ||||||||
| r. | Lean mass of right lower extremity/height2 | 2.74 ± 0.02 | 2.29 ± 0.02 | 0.003 | <0.001 | 0.317 | — | 0.017 | <0.001 | 0.485 | — | ||||||||
| Knee extension strength | |||||||||||||||||||
| s. | Knee extension strength | 437.4 ± 6.4 | 282.1 ± 7.0 | <0.001 | <0.001 | 0.001 | 40s | 50s | 60s | 70s | 80s‐ | <0.001 | <0.001 | 0.008 | 40s | 50s | 60s | 70s | 80s‐ |
Mean values are expressed as least square mean ± standard error.
Post hoc Tukey–Kramer test (P < 0.05).
Figure 2 shows the CSA for each muscle, ASM, and rLM in the form of a scatter plot and regression equation. Among the men, the entire Qc (P = 0.016), total Qc (P = 0.021), VM (P = 0.010), VL (P = 0.038), and ASM (P = 0.037) showed a quadratic decline with a significant quadratic term, whereas all other variables showed a linear decline with a nonsignificant quadratic term (P < 0.001 for all). Among the women, however, all variables showed a linear decline (P < 0.001 for all). The slope of the regression equation for the men was larger in the variables showing a linear decline in both sexes (RF, P = 0.001; VI, P = 0.002; rLM, P = 0.022).
Figure 2.
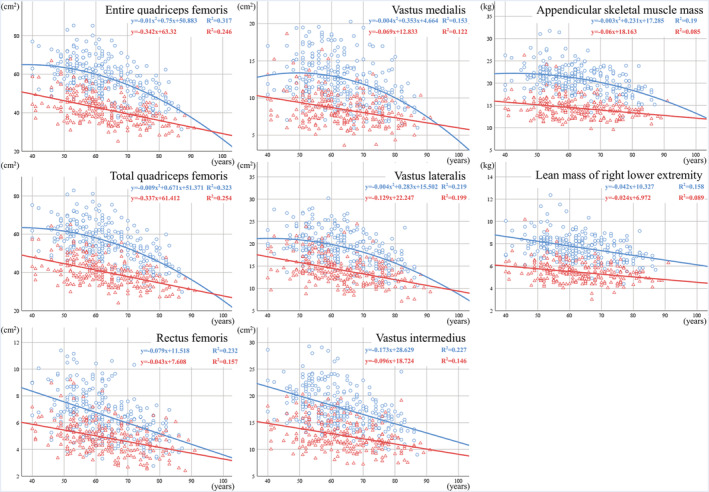
Quadriceps femoris cross‐sectional area and dual‐energy X‐ray absorptiometry (DXA) measurements.  , men;
  , women. Horizontal axis: age (years) vertical axis: cross‐sectional area (cm2) or DXA measurement (kg).
Figure 3 shows the CTV of each muscle in the form of a scatter plot and regression equation. Accordingly, the men showed a quadratic decline in all muscles, with a significant quadratic term (RF, P = 0.044; others, P < 0.001). Moreover, the women showed a significant quadratic term for the RF (P = 0.031), but a linear decline in the other muscles (P < 0.001 for all). The slope of these regression equations showed that VI CTV had the largest age‐related decline among the constituent muscles in both men and women.
Figure 3.

Quadriceps femoris computed tomography (CT) attenuation value.  , men;
  , women. Horizontal axis: age (years) vertical axis: CT attenuation value (HU).
Table 4 shows the results of multiple regression analysis for KES and all the Qc constituents. Both the non‐age‐adjusted and age‐adjusted models revealed significant differences in the total Qc CSA and CTV in both men and women. In particular, KES analysis of age‐adjusted model showed that the total Qc CSA (β = 0.48 for men, 0.65 for women; P < 0.001 for both) and total Qc CTV (β = 0.15 for men, 0.16 for women; P = 0.004 and 0.007, respectively) were independently and significantly associated with KES in both sexes; however, no such association was observed for IMAT CSA in either sex (P = 0.367 for men, 0.520 for women). The variance inflation factor in all models ranged from 1.17 to 1.74 for all variables.
Table 4.
Multiple regression analysis for knee extension strength as the objective variable and total quadriceps femoris as the explanatory variables
| Men | Non‐age‐adjusted model | Age‐adjusted model | ||||||
|---|---|---|---|---|---|---|---|---|
| n = 254 | Standardized coefficient | Standard error | Significance | Standardized coefficient | Standard error | Significance | ||
| Variable | β | P | Adjusted R 2 | β | P | Adjusted R 2 | ||
| Total quadriceps CSA | 0.58 | 0.05 | <0.001 | 0.48 | 0.05 | <0.001 | ||
| Total quadriceps CTV | 0.24 | 0.05 | <0.001 | 0.15 | 0.05 | 0.004 | ||
| Intermuscular adipose tissue CSA | 0.04 | 0.05 | 0.474 | 0.04 | 0.05 | 0.367 | ||
| Age | −0.25 | 0.06 | <0.001 | |||||
| 0.478 | 0.514 | |||||||
| Women | Non‐age‐adjusted model | Age‐adjusted model | ||||||
|---|---|---|---|---|---|---|---|---|
| n = 218 | Standardized coefficient | Standard error | Significance | Standardized coefficient | Standard error | Significance | ||
| Variable | β | P | Adjusted R 2 | β | P | Adjusted R 2 | ||
| Total quadriceps CSA | 0.66 | 0.06 | <0.001 | 0.65 | 0.06 | <0.001 | ||
| Total quadriceps CTV | 0.16 | 0.05 | 0.003 | 0.16 | 0.06 | 0.007 | ||
| Intermuscular adipose tissue CSA | −0.04 | 0.06 | 0.517 | −0.04 | 0.06 | 0.520 | ||
| Age | −0.004 | 0.06 | 0.945 | |||||
| 0.482 | 0.480 | |||||||
CSA, cross‐sectional area; CTV, computed tomography attenuation value.
Table 5 shows the results of multiple regression analysis for KES and Qc constituents. Non‐age‐adjusted model showed that VM CSA, VI CSA, VI CTV, and RF CSA were significantly associated with KES (β = 0.26, 0.24, 0.17, and 0.17, respectively; P < 0.001, P < 0.001, P = 0.008, and P = 0.031, respectively) in the men. Age‐adjusted model showed that only VM CSA and VI CSA were significantly and independently associated with KES (β = 0.26 and 0.24, respectively; P < 0.001 and P = 0.001, respectively) in the men, but no such association was observed for IMAT or CTVs. Among the women, both the non‐age‐adjusted and age‐adjusted models showed significant association in the same variables: VM CSA, VL CSA, VI CTV, and RF CSA. In age‐adjusted model, VM CSA, VL CSA, VI CTV, and RF CSA were significantly and independently associated with KES (β = 0.32, 0.20, 0.20, and 0.18, respectively; P < 0.001, P = 0.006, P = 0.025, and P = 0.020, respectively), but no such association was observed for IMAT. The variance inflation factor in all models ranged from 1.23 to 3.97 for all variables. No significant differences in subject characteristics, including those listed in Table 1, were observed between the 472 subjects whose KES was measured and all 520 subjects (data not shown).
Table 5.
Multiple regression analysis for knee extension strength as the objective variable and quadriceps constituents as the explanatory variables
| Men | Non‐age‐adjusted model | Age‐adjusted model | ||||||
|---|---|---|---|---|---|---|---|---|
| n = 254 | Standardized coefficient | Standard error | Significance | Standardized coefficient | Standard error | Significance | ||
| Variable | β | p | Adjusted R 2 | β | P | Adjusted R 2 | ||
| Rectus femoris CSA | 0.17 | 0.06 | 0.008 | 0.10 | 0.06 | 0.139 | ||
| Vastus medialis CSA | 0.26 | 0.06 | < 0.001 | 0.23 | 0.06 | < 0.001 | ||
| Vastus lateralis CSA | 0.11 | 0.06 | 0.083 | 0.11 | 0.06 | 0.075 | ||
| Vastus intermedius CSA | 0.24 | 0.06 | < 0.001 | 0.21 | 0.06 | 0.001 | ||
| Rectus femoris CTV | −0.05 | 0.06 | 0.401 | −0.06 | 0.06 | 0.319 | ||
| Vastus medialis CTV | 0.00 | 0.05 | 0.956 | −0.02 | 0.06 | 0.773 | ||
| Vastus lateralis CTV | 0.12 | 0.08 | 0.137 | 0.13 | 0.08 | 0.106 | ||
| Vastus intermedius CTV | 0.17 | 0.08 | 0.031 | 0.08 | 0.08 | 0.298 | ||
| Intermuscular adipose tissue CSA | 0.03 | 0.05 | 0.554 | 0.04 | 0.05 | 0.395 | ||
| Age | −0.25 | 0.06 | < 0.001 | |||||
| 0.480 | 0.515 | |||||||
| Women | Non‐age‐adjusted model | Age‐adjusted model | ||||||
|---|---|---|---|---|---|---|---|---|
| n = 218 | Standardized coefficient | Standard error | Significance | Standardized coefficient | Standard error | Significance | ||
| Variable | β | P | Adjusted R 2 | β | P | Adjusted R 2 | ||
| Rectus femoris CSA | 0.17 | 0.07 | 0.018 | 0.18 | 0.07 | 0.020 | ||
| Vastus medialis CSA | 0.32 | 0.07 | <0.001 | 0.32 | 0.07 | < 0.001 | ||
| Vastus lateralis CSA | 0.20 | 0.07 | 0.006 | 0.20 | 0.07 | 0.006 | ||
| Vastus intermedius CSA | 0.14 | 0.07 | 0.066 | 0.14 | 0.07 | 0.067 | ||
| Rectus femoris CTV | −0.07 | 0.07 | 0.313 | −0.07 | 0.07 | 0.326 | ||
| Vastus medialis CTV | 0.03 | 0.06 | 0.607 | 0.03 | 0.06 | 0.598 | ||
| Vastus lateralis CTV | 0.04 | 0.10 | 0.696 | 0.04 | 0.10 | 0.706 | ||
| Vastus intermedius CTV | 0.19 | 0.08 | 0.022 | 0.20 | 0.09 | 0.025 | ||
| Intermuscular adipose tissue CSA | −0.04 | 0.06 | 0.555 | −0.04 | 0.06 | 0.549 | ||
| Age | 0.01 | 0.07 | 0.855 | |||||
| 0.485 | 0.483 | |||||||
CSA, cross‐sectional area; CTV, computed tomography attenuation value.
Discussion
The present study described for the first time details regarding the CSA and CTV for each Qc constituent muscle and IMAT CSA and investigated their relationships with sex, age, and KES in the general population. Most studies have shown that men have larger muscle mass than women, 12 , 15 and the present study showed that men generally have larger muscle CSAs than women. In another study, men had 36% greater skeletal muscle mass than women, even after the models were adjusted for height and weight, 11 and this finding is considered to have been caused by the effects of sex hormones. 16 Men exhibited greater muscle mass loss with age than women in another study, even after the models were adjusted for height and weight. 15 Although studies have shown an accelerated decline in muscle mass with the square of age 11 and a linear decline from a plateau state or increase phase, 12 women have shown a slower decline in both cases. The present study revealed that men exhibit an accelerated decline in the entire and total Qc CSAs, VM CSA, and VL CSA with age, whereas women show a linear decline in all CSAs, wherein the slope was smaller for women than that for men. Regarding the percentage of the entire Qc area, RF CSA exhibited a linear and rapid decline in the men, and the RF was the only constituent muscle to show a decreasing trend with age. Although VM and VL showed an accelerated decline in real area during older ages, no significant changes in their proportions were observed with age. Furthermore, no significant differences in the proportions of each muscle with age were noticed among the women. The differences in the aforementioned types of muscle mass loss by sex and constituent muscles may be attributed to multiple factors, including differences in the amount and type of decline in sex hormones, 16 differences in muscle composition, 17 and changes in lower limb alignment and knee osteoarthritis. 18 Marked atrophy of type II fibres has been observed with age, 2 , 3 with one study further suggesting that a significant decrease in type II fibre CSA being observed only in men. 19 The CSA and muscle fibre types of the VL have been well studied. Accordingly, a study among young adults reported that men have a larger CSA corresponding to each fibre type than women and showed that type II fibres are larger than type I fibres in men whereas type I fibres are larger than type II fibres in women. 17 This difference in the CSA of type II fibres may explain the underlying sex differences in the Qc constituent muscle CSAs and the subsequent differences in the type of decline observed in this study. Atrophy of type II fibres may have a significant effect on such differences, especially considering the decrease in the proportion of the RF and quadratic decrease in the VM and VL CSAs observed among the men included in this study. However, studies on the VL have reported controversial results with regard to the percentage of type I or type II fibres, 17 , 20 perhaps because the CSA and type of muscle fibres differ by the muscle biopsy location and depth, sex, physical activity level, age, and weight. 21 , 22 On the contrary, previous studies evaluating the RF, VM, and VL have consistently shown that the RF and VL have a larger proportion of type II fibres across all depths and locations, whereas the VM has a larger proportion of type II fibres at the surface and a larger proportion of type I fibres at deeper levels. 21 Moreover, studies evaluating the VL and VI have consistently shown that the VL has a larger proportion of type II fibres than VI, 23 which may partly support the results of the present study.
Studies have shown that men have a greater CTV than women, 4 , 24 which is mostly consistent with the results of the present study. This difference may be explained by the fact that the adipose tissue mass is larger among women than among men with the same body weight 25 ; women have more intramyocellular lipids than men, 26 and differences exist in muscle composition between men and women because the intracellular fat content is considered to be higher in type I fibres than in type II fibres. 17 , 27
In this study, RF was found to be a unique muscle with a relatively higher CTV among the constituent muscles in women, although RF showed sex‐related differences in the type of decline and CTV of the women was similar to that of the men in most same‐age groups. Considering that the degree of fat infiltration into the skeletal muscle can differ according to muscle and fibre types, 28 this finding may be attributed to the many unique features of RF relative to other Qc constituent muscles, such as its muscle fibres being smaller and denser than those of the vastus muscles, 29 its configuration being complex, and its being the only bipartite muscle involved in motor control and affected by the hip joint within the Qc muscles. Given that women have significantly greater hip flexion and less knee extension before initial contact during gait than men, 30 sex‐related differences in the use and frequency of the hip and knee joints during activities as common as walking may also have an effect. Some special muscles appear to exist that exhibit little sex‐related differences, such as RF, but still no clear answer has been proposed to explain this. Increases in adipose tissue can be caused by oestrogen and androgen deficiencies, unloading, exposure to glucocorticoids, and reduced capacity for lipid oxidation. 28 , 31 The volumes of intramuscular and intermuscular adipose tissues in the thighs have been reported to increase with age. 24 , 32 Likewise, as CTVs are smaller among older people and the percentage of IMAT CSA relative to the entire Qc area tends to increase in older people for both sexes, the detailed evaluation of Qc in the present study also showed an increase in intramuscular and intermuscular fats. Detailed analysis of the constituent muscles revealed that VI exhibits the largest decrease in CTV with age among the sexes. In addition to the aforementioned specific type of reduction in RF CTV, the morphology of fat infiltration can also differ among the Qc constituent muscles. The present study showed that men exhibit an accelerated decline in Qc CTVs, whereas women exhibit a linear decline, with the sex‐related difference disappearing among those in their 80s‐. Although the underlying mechanism is not well understood, some muscles such as the erector spinae and psoas muscles have been reported to show more fatty degeneration with age in men than in women, 33 which was observed in the Qc in this study. This finding suggests that although women have more fat in their muscles in the whole Qc than men up to older ages, aging appears to cause fat accumulation in men to the same extent as in women.
Type I fibres tend to accumulate more intramyocellular lipids with age than type II fibres. 34 It has been reported that when the CSA of type II fibres decreases and the fibres transition from muscle type II fibres to type I fibres, 35 the contractile capacity of both the type I and type II fibres can be impaired, leading to a dramatic decline in muscle strength with age. 28 Although previous studies have shown that mid‐thigh CTV is related to KES, 4 the relationships between KES and the constituents of Qc are yet to be investigated. This study showed that whole Qc muscle mass and muscle quality are useful objective indicators of KES in both sexes. In the age‐adjusted model of Qc constituents, there were differences in the constituents contributing to muscle strength differences by sex such that although VM CSA was associated with KES in both sexes, RF CSA, VL CSA, and VI CTV showed associations only in the women, and VI CSA showed an association only in the men. IMAT was not related to muscle strength in any of the models, which is consistent with the finding of a previous study. 4 Sex‐related differences in muscle composition 17 and activation 36 and arthrogenic muscle inhibition caused by knee osteoarthritis, 18 which is generally more prevalent in women, may be involved in this sex‐related difference; however, the cause of this difference in this study is difficult to determine. RF CSA and VI CTV also showed a relationship with KES in the men in the non‐age‐adjusted model, which may have occurred because these variables showed the most rapid age‐related declines among the Qc constituents, which may be indirect, objective predictive indicators of age‐related muscle weakness. Regarding the relationship between VI and KES, one study using Qc ultrasonography showed that the structure of VI was most predictive of extensor strength, 37 whereas another study that investigated the role of VI in extensor strength during low‐intensity isometric knee extension exercises showed that VI had a contribution of approximately 50% to knee extension torque. 38 The size principle 39 suggests that type I fibres are more likely to work at relatively low torque values in the early stages of knee extension, whereas reduced VI CTV due to fat infiltration may result in type I fibre dysfunction, which leads to reduced KES. One reason why CSAs were more suitable for modelling than most CTVs and IMAT is that KES is one of the most directly related measures to muscle CSA. The relationship of muscle mass and quality may be different for other movements that require more agility or endurance, and the relationships with the content and quality of exercise requires further verification in the future. In addition to the importance of assessing CSA for each constituent muscle of Qc, further assessment of CTV may improve the understanding of KES decline due to the age‐related muscle deterioration in middle‐aged and older individuals. Detailed evaluations by CT are expected to provide some estimates on age‐related changes in the Qc and its contribution to KES and may help determine and adjust clinical training methods according to age and sex.
The present study has several limitations that should be recognized. A cross‐sectional design was used, and the changes in CSA and CTV for each individual are unknown. The term “age‐related differences” if more accurately described is in fact “age cohort‐related differences” because age and cohort differences cannot be clearly separated. Future follow‐up studies using a longitudinal approach are therefore desirable. Given that this study was conducted only in an Asian population, specifically, a Japanese population, our results may not be generalizable to populations of other ethnicities or races. In 2010, the average life expectancies of Japanese men and women were 79.55 and 86.30 years, respectively, which are among the longest life expectancies worldwide. However, large sex differences in life expectancies have been recognized, which may have affected the regression equations for the type of CSA and CTV decline (i.e. survivorship bias). Some limitations with regard to the use of CT are present. First, exposure to radiation is unavoidable, albeit it is small with one‐slice scans. Second, using CT to distinguish between intramuscular lipids and intramyocellular lipids is difficult, making identification of the details of the fat infiltration site challenging. However, given that the level of detail needed remains unclear, the present methods may be sufficient for clinical practice. Highly objective and detailed data on the Qc acquired using CT, as in the present study, are valuable. We believe that these results will be useful as reference values; will be useful for confirming the validity and reproducibility of evaluations with non‐invasive devices, such as ultrasound systems, which tend to have a narrower imaging range and lower reproducibility; and will contribute to the development of other modalities.
In conclusion, this is the first study to investigate details regarding the relationship between Qc CSAs and CTVs and age, sex, and KES for each constituent Qc muscle. Accordingly, the Qc CSAs and CTVs decreased with age in both sexes; however, the type of decline varied by sex and depended on the divergences of constituent muscles, especially RF, which was noteworthy. Moreover, the total Qc CSA and CTV were significantly associated with KES in both sexes; however, there were differences in the Qc constituents that contributed to sex differences in muscle strength. VI was a unique muscle, especially in women, because its CTV was the only one of its constituent muscles to show a relationship with KES.
Conflict of interest
The authors have no conflicts of interest to disclose.
Acknowledgements
The authors thank all the participants, health professionals, and researchers from the Section of the NILS‐LSA who were involved in data collection and analyses. This study was supported by JSPS KAKENHI (Grant 19K09638) and Research Funding for Longevity Sciences (19‐10) from the National Center for Geriatrics and Gerontology, Japan. The authors of this manuscript certify that they comply with the ethical guidelines for authorship and publishing in the Journal of Cachexia, Sarcopenia and Muscle. 40
Mizuno T., Matsui Y., Tomida M., Suzuki Y., Nishita Y., Tange C., Shimokata H., Imagama S., Otsuka R., and Arai H. (2021) Differences in the mass and quality of the quadriceps with age and sex and their relationships with knee extension strength, Journal of Cachexia, Sarcopenia and Muscle, 12, 900–912, 10.1002/jcsm.12715
References
- 1. Cruz‐Jentoft AJ, Bahat G, Bauer J, Boirie Y, Bruyère O, Cederholm T, et al. Sarcopenia: revised European consensus on definition and diagnosis. Age Ageing 2019;48:16–31. [DOI] [PMC free article] [PubMed] [Google Scholar]
- 2. Lexell J, Taylor CC, Sjöström M. What is the cause of the ageing atrophy? Total number, size and proportion of different fiber types studied in whole vastus lateralis muscle from 15‐ to 83‐year‐old men. J Neurol Sci 1988;84:275–294. [DOI] [PubMed] [Google Scholar]
- 3. Nilwik R, Snijders T, Leenders M, Groen BBL, van Kranenburg J, Verdijk LB, et al. The decline in skeletal muscle mass with aging is mainly attributed to a reduction in type II muscle fiber size. Exp Gerontol 2013;48:492–498. [DOI] [PubMed] [Google Scholar]
- 4. Goodpaster BH, Carlson CL, Visser M, Kelley DE, Scherzinger A, Harris TB, et al. Attenuation of skeletal muscle and strength in the elderly: the health ABC study. J Appl Physiol 2001;90:2157–2165. [DOI] [PubMed] [Google Scholar]
- 5. Azzabou N, Hogrel JY, Carlier PG. NMR based biomarkers to study age‐related changes in the human quadriceps. Exp Gerontol 2015;70:54–60. [DOI] [PubMed] [Google Scholar]
- 6. Brack AS, Conboy MJ, Roy S, Lee M, Kuo CJ, Keller C, et al. Increased Wnt signaling during aging alters muscle stem cell fate and increases fibrosis. Science 2007;317:807–810. [DOI] [PubMed] [Google Scholar]
- 7. Sergi G, Trevisan C, Veronese N, Lucato P, Manzato E. Imaging of sarcopenia. Eur J Radiol 2016;85:1519–1524. [DOI] [PubMed] [Google Scholar]
- 8. McGregor RA, Cameron‐Smith D, Poppitt SD. It is not just muscle mass: a review of muscle quality, composition and metabolism during ageing as determinants of muscle function and mobility in later life. Longev Heal 2014;3:1–8. [DOI] [PMC free article] [PubMed] [Google Scholar]
- 9. Speliotes EK, Massaro JM, Hoffmann U, Vasan RS, Meigs JB, Sahani DV, et al. Fatty liver is associated with dyslipidemia and dysglycemia independent of visceral fat: the Framingham heart study. Hepatology 2010;51:1979–1987. [DOI] [PMC free article] [PubMed] [Google Scholar]
- 10. Goodpaster BH, Kelley DE, Thaete FL, He J, Ross R. Skeletal muscle attenuation determined by computed tomography is associated with skeletal muscle lipid content. J Appl Physiol 2000;89:104–110. [DOI] [PubMed] [Google Scholar]
- 11. Janssen I, Heymsfield SB, Wang ZM, Ross R. Skeletal muscle mass and distribution in 468 men and women aged 18‐88 yr. J Appl Physiol 2000;89:81–88. [DOI] [PubMed] [Google Scholar]
- 12. Gallagher D, Visser M, De Meersman RE, Sepúlveda D, Baumgartner RN, Pierson RN, et al. Appendicular skeletal muscle mass: effects of age, gender, and ethnicity. J Appl Physiol 1997;83:229–239. [DOI] [PubMed] [Google Scholar]
- 13. Kasai T, Ishiguro N, Matsui Y, Harada A, Takemura M, Yuki A, et al. Sex‐ and age‐related differences in mid‐thigh composition and muscle quality determined by computed tomography in middle‐aged and elderly Japanese. Geriatr Gerontol Int 2015;15:700–706. [DOI] [PubMed] [Google Scholar]
- 14. Shimokata H, Ando F, Niino N, Shimokata H. A new comprehensive study on aging‐the National Institute for Longevity Sciences, Longitudinal Study of Aging (NILS‐LSA). J Epidemiol 2000;10:1–9. [DOI] [PubMed] [Google Scholar]
- 15. Gallagher D, Heymsfield SB. Muscle distribution: variations with body weight, gender, and age. Appl Radiat Isot 1998;49:733–734. [DOI] [PubMed] [Google Scholar]
- 16. Rosenbaum M, Leibel RL. Clinical review 107: role of gonadal steroids in the sexual dimorphisms in body composition and circulating concentrations of leptin. J Clin Endocrinol Metab 1999;84:1784–1789. [DOI] [PubMed] [Google Scholar]
- 17. Staron RS, Hagerman FC, Hikida RS, Murray TF, Hostler DP, Crill MT, et al. Fiber type composition of the vastus lateralis muscle of young men and women. J Histochem Cytochem 2000;48:623–629. [DOI] [PubMed] [Google Scholar]
- 18. Rice DA, McNair PJ. Quadriceps arthrogenic muscle inhibition: neural mechanisms and treatment perspectives. Semin Arthritis Rheum 2010;40:250–266. [DOI] [PubMed] [Google Scholar]
- 19. Yu F, Hedström M, Cristea A, Dalén N, Larsson L. Effects of ageing and gender on contractile properties in human skeletal muscle and single fibres. Acta Physiol 2007;190:229–241. [DOI] [PubMed] [Google Scholar]
- 20. Simoneau JA, Lortie G, Boulay MR, Thibault MC, Thériault G, Bouchard C. Skeletal muscle histochemical and biochemical characteristics in sedentary male and female subjects. Can J Physiol Pharmacol 1985;63:30–35. [DOI] [PubMed] [Google Scholar]
- 21. Johnson MA, Polgar J, Weightman D, Appleton D. Data on the distribution of fibre types in thirty‐six human muscles. An autopsy study. J Neurol Sci 1973;18:111–129. [DOI] [PubMed] [Google Scholar]
- 22. Scelsi R, Marchetti C, Poggi P. Histochemical and ultrastructural aspects of M. vastus lateralis in sedentary old people (age 65‐89 years). Acta Neuropathol 1980;51:99–105. [DOI] [PubMed] [Google Scholar]
- 23. Edgerton VR, Smith JL, Simpson DR. Muscle fibre type populations of human leg muscles. Histochem J 1975;7:259–266. [DOI] [PubMed] [Google Scholar]
- 24. Forsberg AM, Nilsson E, Werneman J, Bergstrom J, Hultman E. Muscle composition in relation to age and sex. Clin Sci 1991;81:249–256. [DOI] [PubMed] [Google Scholar]
- 25. Legato MJ. Gender‐specific aspects of obesity. Int J Fertil Womens Med 2005;42:184–197. [PubMed] [Google Scholar]
- 26. Devries MC, Lowther SA, Glover AW, Hamadeh MJ, Tarnopolsky MA. IMCL area density, but not IMCL utilization, is higher in women during moderate‐intensity endurance exercise, compared with men. Am J Physiol Regul Integr Comp Physiol 2007;293:2336–2342. [DOI] [PubMed] [Google Scholar]
- 27. Schrauwen‐Hinderling VB, Hesselink MKC, Schrauwen P, Kooi ME. Intramyocellular lipid content in human skeletal muscle. Obesity 2006;14:357–367. [DOI] [PubMed] [Google Scholar]
- 28. Hamrick MW, McGee‐Lawrence ME, Frechette DM. Fatty infiltration of skeletal muscle: mechanisms and comparisons with bone marrow adiposity. Front Endocrinol (Lausanne) 2016;7:1–7. [DOI] [PMC free article] [PubMed] [Google Scholar]
- 29. Kobayashi K. Myofibrous organization in human quadriceps femoris muscles. J Showa Med Assoc 1991;51:186–196. [Google Scholar]
- 30. Kerrigan DC, Todd MK, Della Croce U. Gender differences in joint biomechanics during walking: normative study in young adults. Am J Phys Med Rehabil 1998;77:2–7. [DOI] [PubMed] [Google Scholar]
- 31. Simoneau JA, Colberg SR, Thaete FL, Kelley DE. Skeletal muscle glycolytic and oxidative enzyme capacities are determinants of insulin sensitivity and muscle composition in obese women. FASEB J 1995;9:273–278. [PubMed] [Google Scholar]
- 32. Delmonico MJ, Harris TB, Visser M, Park SW, Conroy MB, Velasquez‐Mieyer P, et al. Longitudinal study of muscle strength, quality, and adipose tissue infiltration. Am J Clin Nutr 2009;90:1579–1585. [DOI] [PMC free article] [PubMed] [Google Scholar]
- 33. Anderson DE, D'Agostino JM, Bruno AG, Demissie S, Kiel DP, Bouxsein ML. Variations of CT‐based trunk muscle attenuation by age, sex, and specific muscle. J Gerontol A Biol Sci Med Sci 2013;68:317–323. [DOI] [PMC free article] [PubMed] [Google Scholar]
- 34. Gueugneau M, Coudy‐Gandilhon C, Théron L, Meunier B, Barboiron C, Combaret L, et al. Skeletal muscle lipid content and oxidative activity in relation to muscle fiber type in aging and metabolic syndrome. J Gerontol A Biol Sci Med Sci 2015;70:566–576. [DOI] [PubMed] [Google Scholar]
- 35. Mastrocola R, Collino M, Nigro D, Chiazza F, D'Antona G, Aragno M, et al. Accumulation of advanced glycation end‐products and activation of the SCAP/SREBP lipogenetic pathway occur in diet‐induced obese mouse skeletal muscle. PLoS One 2015;10:e0119587. [DOI] [PMC free article] [PubMed] [Google Scholar]
- 36. Krishnan C, Williams GN. Sex differences in quadriceps and hamstrings emg‐moment relationships. Med Sci Sports Exerc 2009;41:1652–1660. [DOI] [PMC free article] [PubMed] [Google Scholar]
- 37. Ando R, Saito A, Umemura Y, Akima H. Local architecture of the vastus intermedius is a better predictor of knee extension force than that of the other quadriceps femoris muscle heads. Clin Physiol Funct Imaging 2015;35:376–382. [DOI] [PubMed] [Google Scholar]
- 38. Zhang LQ, Wang G, Nuber GW, Press JM, Koh JL. In vivo load sharing among the quadriceps components. J Orthop Res 2003;21:565–571. [DOI] [PubMed] [Google Scholar]
- 39. Henneman E, Somjen GC, Carpenter DO. Functional significance of cell size in spinal motoneurons. J Neurophysiol 1965;28:560–580. [DOI] [PubMed] [Google Scholar]
- 40. von Haehling S, Morley JE, Coats AJS, Anker SD. Ethical guidelines for publishing in the journal of cachexia, sarcopenia and muscle: update 2019. J Cachexia Sarcopenia Muscle 2019;10:1143–1145. [DOI] [PMC free article] [PubMed] [Google Scholar]