

Abstract
Fused deposition modeling (FDM) 3D printers, the most popular choice among home hobbyists, have been shown to release volatile organic chemicals (VOCs) and billions of airborne particles per minute, indicating the potential for consumer inhalation exposure and consequent health risks. Publications on FDM 3D printer emissions however, contain large heterogeneity of testing methods and analytical procedures making it difficult to reach overall conclusions for particle characteristics or particle number emission rates across the field. In this publication, data were collected over the printing time from 3D printer emission studies including particle count diameters (PCDs) (nanometers), particle number concentrations (PNCs) (particles/cm3), and particle number emission rates (PNERs) (particles min−1). Despite heterogeneity in methods, the majority of particles released were reported as ultrafine in size (i.e., <100 nm) indicating that using both acrylonitrile butadiene styrene (ABS) and poly-lactic acid (PLA) may present a risk of exposure to respirable particles. Mean PNC emitted in 3D printing tests ranged over several orders of magnitude across publications with overall means of 300,980 particles/cm3 for ABS and 65,482 particles/cm3 for PLA. Although mean PNC data were available from only 7 of the 16 papers reviewed, ABS resulted in greater particle numbers than PLA suggesting increased exposure to ultrafine particles. A linear mixed model was fitted for mean PNCs to further explore the impact of nozzle temperature and filament material. Finally, the PNER calculation method especially regarding losses, varied widely across studies, and directly impacted the PNERs reported. To strengthen direct comparability of results going forward, it is recommended that standard emissions testing protocols be developed for FDM 3D printers and particle influxes and losses be more uniformly calculated.
Keywords: ABS, Emission rate, Filament, PLA, Ultrafine
Graphical Abstract

1. Introduction
3D printers are gaining popularity around the world for at-home and office use. Between 2016 and 2018, it is estimated that 528,952 desktop 3D printers priced at under $5000 were sold worldwide (McCue, 2018). In particular, Fused Deposition Modeling (FDM) printers have become the most popular choice for home hobbyists (de Leon et al., 2016). A 2017 industry report on the state of 3D printing showed that 85% of over 1000 survey respondents who owned a 3D printer used a FDM 3D printer (Coré-Baillais et al., 2017). These printers are popular because of their low cost, low weight of filaments, processing flexibility and ease of use (de Leon et al., 2016).
The most popular filament materials used in FDM 3D printers are poly-lactic acid (PLA) and acrylonitrile butadiene styrene (ABS). PLA is derived from renewable sources like corn and is advertised for its ability to reduce greenhouse gases during use and manufacturing. PLA is also popular because of its mechanical properties, biodegradability and low cost (Raquez et al., 2013). ABS is a petrochemical derived copolymer created by the copolymerization of monomers acrylonitrile, 1,3-butadiene and styrene. It is widely used in industry because of its superior chemical resistance, mechanical properties and ease of processing (Jyoti et al., 2015).
The FDM 3D printing process uses thermoplastic filaments that are extruded through a high temperature nozzle at around 200 °C. This partially melts the filaments to form a 3D shape one layer at a time (Yi et al., 2016). The 3D printing process releases particles, which are mostly ultrafine (<100 nm. in diameter), and volatile organic chemicals (VOCs) from the melting thermoplastic filaments. Ultrafine particles are released at rates of billions of particles per minute during operation (Stefaniak et al., 2017; Stephens et al., 2013). Across the literature, it is generally concluded that ABS filament produces higher particle number emission rates than PLA (Azimi et al., 2016; Stefaniak et al., 2017). Stefaniak et al. (2017) found that ABS released thirteen detectable VOCs while PLA released nine detectable VOCs with four common between the two filaments. Other studies have found varying compositions of VOCs released (Azimi et al., 2016; Floyd et al., 2017; Vance et al., 2017).
The particles and VOCs released during 3D printing have the potential to be inhaled by 3D printer users. Inhaled ultrafine particles have been linked to a variety of health effects including increased oxidative stress, inflammation, cardiovascular effects and cytotoxicity (Madl and Pinkerton, 2009; Stefaniak et al., 2017). Because of their small size, ultrafine particles penetrate deeper into the respiratory system than larger particles and may be harder to clear from the body (Bierkandt et al., 2018). In addition, VOCs may contribute to the development of asthma, allergies, obstructive pulmonary disease and lung cancer with 1,3-butadiene classified as carcinogenic to humans (Gałęzowska et al., 2016; IRIS, 2002; Lee et al., 2006). These VOCs may adsorb to the surface of particles and travel with them through the respiratory tract(Roberts et al., 2018).
The severity of health effects caused by the inhalation of ultrafine particles has been linked to the physical properties of particles, including their size, and the number of particles an individual is exposed to over time (Madl and Pinkerton, 2009). Thus, the count of particles emitted per minute in particles per cubic centimeter (particle number emission rates or PNERs), and the sizes of particles based on their individual particle diameter in nanometers (particle count diameters or PCDs) emitted by a 3D printer, are important parameters to assess exposure potential. However, PNERs are affected by the assumptions used to create the mass balances that serve as the basis of PNER calculations (Zhang et al., 2017). Consequently, variations in these assumptions and how they affect the calculated PNER values across these studies should be evaluated (Azimi et al., 2016; Vance et al., 2017; Yi et al., 2016). Particle number concentrations (PNCs) over the printing time in particles per cubic centimeter are direct measurements of particle counts per unit volume and do not depend on the assumptions of potential particle losses in a system. As the PNC value increases, it can, like PNER, indicate a greater potential for inhalation of particles. Additional considerations such as room size, air exchange rates, printer enclosures, etc., will also likely have a significant impact on particle and VOC exposure.
Measurements of PCDs, PNCs and PNERs during printing of PLA and ABS filaments are reported across the 3D printing literature under many different conditions. Nozzle temperatures used in 3D printer studies range from 180 °C to 280 °C (Deng et al., 2016). Test chamber sizes range from a 0.085 m3 chamber to a 776.9 m3 room (Steinle, 2016; Vance et al., 2017). There are also large variations in the range of particle sizes sampled, test chamber characteristics, air flow rates and, significantly, assumptions of particle influxes and losses during the experiment that are used to calculate PNERs. Influx of non-printer generated particles into the test chambers through air inflow systems has not been uniformly considered across studies (Azimi et al., 2016; Stefaniak et al., 2017). Particles can also be lost through unaccounted leakages, outflow, settling, adhering to chamber walls and agglomeration, which were considered together or separately depending on the study (Floyd et al., 2017; Kim et al., 2015; Vance et al., 2017). In some studies, a particle loss coefficient was calculated based on the natural exponential decay of particles after printing was stopped to quantify losses (Floyd et al., 2017; Vance et al., 2017; Zhang et al., 2017).
Despite the publication of at least 16 studies in the scientific literature looking at 3D printer emissions, the emissions of these printers across the literature have not yet been evaluated in a systematic way. The variability in testing and reporting makes it difficult to synthesize information about FDM 3D printers (Pelley, 2018). Based on the studies available, it is not clear if choosing ABS or PLA will result in different PCDs or PNCs across a wide variety of testing environments or if the PNER calculation methods influence PNERs significantly. This publication is an attempt to synthesize information from the peer-reviewed literature about particles emitted from 3D printers using ABS and PLA filaments. PCDs, PNCs, and PNERS were compared using descriptive statistics. In addition, a meta-analysis was conducted on mean PNCs to understand the significance of nozzle temperature and filament type. Comparison of mean PCDs suggested that there was not a biologically significant difference between filament types, and therefore a meta-analysis was not pursued for PCDs. PNER calculations were explored in detail to understand the impact of particle loss assumptions on final results. Accordingly, the specific objectives were to (1) compare and contrast ABS and PLA particle emissionsfrom select studies with an emphasis on differences of PCDs and PNCs and (2) compare and contrast PNER calculations used in several studies.
2. Methods
2.1. Collection and comparison of data across publications using scatterplots
Data were systematically collected following guidance from the PRISMA statement (Moher et al., 2009). Literature was first collected by the authors and the EPA Research Triangle Park library staff. Search terms included, “3D printers”, “nozzle”, “Fused Deposition Modeling”, “emissions”, “FDM”, “filaments”, “ABS”, and “PLA”. Databases including Web of Science, Science Direct and Google Scholar were used to collect literature. In addition, a general Google search was done. Through our search, approximately one thousand titles of peer-reviewed publications were viewed (Fig. 1).
Fig. 1.

Identification, used a key word search (3D printers, nozzle, Fused Deposition Modeling, emissions, FDM, filaments, ABS and PLA). Screening criteria involved an indication of the measurement of particulate emissions during printer operation. Eligibility criteria for studies included in the overall analysis were: (1) the study collected and analyzed emissions from an operating FDM printer using ABS or PLA filament; (2) the study provided data on size, concentration and/or emission rates of emitted particles and (3) the study was peer-reviewed. Studies included in the meta-analysiseither directly reported mean particle number concentrations for PLA and ABS polymer filaments or this value could be calculated from available data. In addition, these studies had three or more observations for both ABS and PLA.
Of these one thousand titles, approximately fifty publications were downloaded and reviewed in detail. All other studies were excluded at this stage because they contained titles and/or abstracts that did not indicate they would contain relevant particle emission characteristic data related to 3D printer use. Of the approximately fifty publications reviewed in detail, sixteen were ultimately selected. These sixteen studies met the following criteria: (1) the study collected and analyzed emissions from an operating FDM 3D printer using PLA or ABS filament; (2) the study provided data on size, concentration and/or emission rates of emitted particles and (3) the study was peer-reviewed. All other studies, approximately thirty-four, were related to 3D printing but did not contain relevant emission data from 3D printer tests. Seven studies out of the final sixteen selected were used in our meta-analysismodel of mean PNCs. They: (1) directly reported mean particle number concentrations for PLA and ABS polymer filaments or this value could be calculated from available data and (2) these studies had three or more observations for both ABS and PLA.
Data were collected by manual extraction into Excel (Microsoft Corp., USA) spreadsheets. The six dependent summary statistics considered for this study included mean PCDs, mode PCDs, mean PNCs, peak PNCs, mean PNERs and peak PNERs (see Table S1a in the Supplemental section for frequency). WebPlotDigitizer was used to extract some values from figures when numerical data were not available in text (Table S1a and Fig. S2 in the Supplemental section) (Rohatgi, 2018). Mean and peak PNCs were also calculated from the raw data of one author to have the correct values for published runs (Table S1a in the Supplemental section).
Independent variables that were initially considered included filament type, color, nozzle temperature, bed temperature, test environment volume, test environment characteristics, air changes per hour, printer model, number of printers operating, and range of PCDs measured. Nozzle temperature and filament type were chosen to be directly compared against the six dependent summary statistics in scatterplots. Nozzle temperature was chosen as the parameter to plot these data against as it was the most commonly reported printing parameter and has been reported to influence emissions from a 3D printer, especially at mid-range bed temperatures (Azimi et al., 2016; Mendes et al., 2017). In addition, it is central to the melt extrusion process and reasonably should affect particle emissions (Turner et al., 2014). Filament type influenced PNC and PNER values across several 3D printer emission studies (Azimi et al., 2016; Kwon et al., 2017; Mendes et al., 2017). These scatterplots were created using R and their distributions were assessed in box plots created using SAS SGPANEL (Fig. S5 in the Supplemental section).
Mean PCDs were further compared quantitatively using descriptive statistics. ABS and PLA may breakdown into their monomer components during printing either as VOCs or ultrafine particles (Vance et al., 2017). It was not clear from the available literature whether or not there was a significant difference in the sizes of emitted particles between ABS and PLA. We evaluated mean PCD instead of modes or medians because mean values were reported more frequently and could capture data from a larger number of studies. In addition, for most cases, the PCD size distribution was not heavily skewed in either direction, indicating that mean could be used as a measure of central tendency (Mendes et al., 2017; Vance et al., 2017; Yi et al., 2016; Zhang et al., 2017). Finally, means were heavily correlated with modes and medians, so we decided to use only one statistic.
2.2. Development of a linear mixed model to perform a meta-analysis
Several publications have reported that ABS resulted in higher concentrations of particle emissions than PLA (Stefaniak et al., 2017). However, it is not known whether this relationship holds when considering many different print conditions. We wanted to understand if using ABS resulted in larger particle number emissions than PLA when considered across select studies. We chose to look at mean PNC, rather than peak PNC, because means were reported more frequently and peak PNC may not be representative of the entire print duration. Peak PNC could, for example, be affected by printer malfunctioning or sudden changes in testing environment.
Mean PNC values were subjected to meta-analysis to test differences of ABS and PLA across the studies using a linear mixed model fitted in the SAS MIXED procedure (SAS Institute Inc., 2015). Specifically, log-transformed mean PNC data were modeled using restricted maximum likelihood (REML) to assess the fixed effects of filament (ABS versus PLA) and nozzle temperature within filament and the random effect of study. The logarithmic transformation was used to stabilize variance, as indicated by graphical assessment and Shapiro-Wilks tests of normality for model residuals. As mentioned in Section 2.1, studies with data for both filament types and with 3 or more data observations (total) were included in the model; remaining studies of the 16 papers reviewed were omitted since their study-specific mean filament differences could not be estimated. Frequency counts, means, standard deviations, and confidence interval endpoints by filament type and study were calculated for 3D printer test data observations used in the model (Table S3 in the Supplemental section). Model code is given in the supplementary information (Fig. S4 in the Supplemental section).
The linear mixed model estimated the variability in the mean PNC dependent variable through random effects for the between-studies variability and repeated measures for the within-study variability (Dempster et al., 1984; Riley et al., 2010; Sutton and Higgins, 2008). The random effect for between-studies variability was used to capture, for example, the effect of studies using different testing environments and methods. Repeated measures estimated the within-study variability of 3D printer observations for study-level clusters using (default) compound symmetry covariance structure grouped by study. The Kenward-Roger method was used to calculate the denominator degrees of freedom; it is protective against Type I error and corrects test statistics and standard errors for bias (Guerin and Stroup, 2000; Kenward and Roger, 1997).
2.3. Particle number emission rate calculations analysis
In addition to peak and mean PNERs compared in scatterplots, PNER calculations were compared across five different publications. This was done to determine the effect of using five different PNER calculation methods on one set of PNC data. The PNER equations used in these publications were selected because they (1) relied on methods that calculated PNER at each time step and were not just a summary PNER for the entire run; (2) were unique in their assumptions about particle influxes and losses or equation construction as compared to other methods; (3) were all based on a dynamic mass balance; and (4) provided sufficient methodological detail for analysis, either through the publication and/or correspondence with the author. Three authors were then asked for PNC data for use in the five different PNER calculations to derive numerical outputs of PNERs, like those presented across the literature.
The PNER equations used in the five different publications are displayed (Table 1). Each equation is kept in its original notation. Key assumptions for each equation are shown on the right (see Section S7 in the Supplemental section for definitions of loss terms). Eq. (5) was taken from a paper by Zhang et al. (2017) and is the same equation published by in “RAL-UZ 171” (Barthel et al., 2013; Zhang et al., 2017). Three raw datasets of PNCs were kindly provided by three authors, Stefaniak et al. (2017), Zhang et al. (2017) and Azimi et al. (2016) (S8 in the Supplemental section). Each one of these datasets was used as PNC data for the five different PNER equations (Table 1).
Table 1.
Particle number emission rate equations.
| Emission Rate Equation | Loss Assumptions | Study | ||
|---|---|---|---|---|
|
Particles lost in chamber are negligible; particles flowing into chamber are negligible; particles lost through outflow are significant | (Stefaniak, LeBouf, Yi. et al., 2017) | ||
|
Particles lost in chamber and outflow are significant; particles flowing into chamber are significant | (Azimi et al., 2016) | ||
|
Particles lost in chamber are significant; particles lost through outflow are calculated separately and significant; particles flowing into chamber are negligible | (Vance et al., 2017) | ||
|
Particles lost in chamber and outflow are significant; particles flowing into chamber are negligible | (Floyd et al., 2017) | ||
|
Particles lost in chamber are significant; particles flowing into chamber are negligible | (Barthel et al., 2013) |
Throughout the literature, numerical methods based on the mass balance of particles have been used to calculate PNERs. Each of these methods were similar in that they were derived from a dynamic mass balance by treating the test environments as a continuously stirred tank reactor with the printer as the sole emitter of particles (S9 in the Supplemental section) (Zhang et al., 2017). The first term in every method relied on the difference in PNCs between two time steps. Despite the common basis for the derivation of PNER equations (Table 1), different assumptions were made about terms for loss of particles in the systems (S7 in the Supplemental section). In the publication containing Eq. (1), it was stated that when compared to Eq. (5), they found that their loss coefficient was on the order of 10−4 s−1and was deemed negligible. Thus, they dropped any other loss terms from their analysis (Stefaniak et al., 2017).
Eq. (2) incorporated particles going into the chamber, losses within the chamber, and particles leaving the chamber through flow going out (Azimi et al., 2016). A decay loss term, LUFP, was determined based on the exponential decay of PNC when the printer was turned off. This was then paired with the background PNCs to describe particles flowing into the chamber. It was also paired with particles leaving the chamber to describe losses from settling and particles lost by flowing out of the chamber (Azimi et al., 2016).
Eq. (3) described losses from the chamber outflow by pairing flow, Q, through the chamber with the particle number concentrations in the chamber at time tn−1, C(tn−1). A decay loss term, β, was created similarly to Eq. (2) by taking the linear regression of the decay of particles after the printer was turned off. However, in this case, β was calculated when flow was turned off so that it only represented wall losses of particles and was calculated for each PCD bin. This was then paired with a volume term and PNC term within the chamber at some time tn-1. Air flowing into the chamber was filtered through a high efficiency particulate air filter so that only particles generated by the printer were considered (Vance et al., 2017).
Eqs. (4) and (5), despite the different nomenclature, are essentially the same. They were both based on Eq. (4) (Barthel et al., 2013). The only difference was that Eq. (5) in Table 1 was derived using a Taylor series approximation (S10 in the Supplemental section). KL was calculated using linear regression similarly to the method used in Eq. (2) to calculate the Lufp value. The beta value in Eq. (5) was calculated the same way except it had the opposite sign and was thus used in the PNER equation with an opposite sign making it equivalent to KL (Floyd et al., 2017). Across the selected literature there was no standard equation for measuring PNERs. Though these five equations are all based on a dynamic mass balance they make different assumptions about particle influxes and losses (Zhang et al., 2017).
3. Results
3.1. Data collection and study characteristics
Sixteen studies fit our inclusion criteria. Test environment volume, test environment description, printer model, filament, size range of particles measured, and instruments used to measure particle count and/or size were recorded (Table 2). Each publication used different instruments or procedures for counting and sizing particles, resulting in different ranges of particle count diameters measured. The ranges used for particle sizing versus particle counting are not differentiated in this table. Descriptive statistics for mean PNC and mean PCD were calculated (Table 3). Rao et al. (2017) reported values in terms of mass, rather than particle count, and was not included in Table 3 (Table S1a in the Supplemental section) (Rao et al., 2017).
Table 2.
Study characteristics.
| Study | Test environment volume (m3) | Test environment description | Printer model | Filament | Size range of particles measured (nm) | Instruments used to measure particle number and/or count diameter |
|---|---|---|---|---|---|---|
| Stephens et al., 2013 | 45.0 | Office space | Not given | ABS/PLA | 10–420 | TSI NanoScan SMPS 3910 |
| Kim et al., 2015 | 1.0 | Acrylic chamber | Cube 3D | ABS/PLA | 10–420, 20–1000 | TSI NanoScan SMPS 3910, TSI P-Trak CPC 8525 |
| 1.0 | Acrylic chamber | 3DISON Plus | PLA | 10–420, 20–1000 | ||
| Zhou et al., 2015 | 60.0 | Clean room | Flashforge Creator | ABS | 250–320 | Grimm 1.109 |
| Azimi et al., 2016 | 3.6 | Stainless steel chamber | Flashforge Creator | ABS/PLA | 10–1000 | TSI CPC 3007, TSI NanoScan SMPS 3910 |
| 3.6 | Stainless steel chamber | Dremel 3D idea builder | PLA | 10–1000 | ||
| 3.6 | Stainless steel chamber | xyzprinting da Vinci 1.0 | ABS | 10–1000 | ||
| 3.6 | Stainless steel chamber | Lulzbot Mini | ABS/PLA | 10–1000 | ||
| 3.6 | Stainless steel chamber | Makerbot Replicator 2X | ABS | 10–1000 | ||
| Deng et al., 2016 | 8.0 | Clean room | Flashforge Creator | ABS/PLA | 2.5–3000 | TSI CPC 3776 |
| Stabile et al., 2017 | 40.0 | Room, closed door | RepRap Prusa i3 | PLA | 6–220, 4–3000 | TSI SMPS 3936, TSI CPC 3775 |
| Steinle, 2016 | 0.1 | Acrylic glass chamber | Cube 2nd generation | ABS/PLA | 7–400, 180–20,000 | Electrical Diffusion Battery, DiSCmini, Promo mobile ASM |
| Yi et al., 2016 | 0.5 | Stainless steel chamber | Makerbot Replicator 2X | ABS/PLA | 20–1000, 300–20,000, 24–9380, 14.6–660, 10–360 | TSI P-Trak 8525, Grimm 1.108, ELPI Classic, TSI SMPS 3910, TSI NanoScan SMPS 3910 |
| Zontek et al., 2017 | 600.0 | Laboratory | Makerbot Replicator 2X | PLA | 10–1000, 2–300, 300–10,000 | TSI CPC 3007, TSI SMPS 3080 with TSI nano DMA 3085 or TSI DMA 3081, TSI OPS |
| 147.0 | Storage room | xyzprinting da Vinci 1.03D | ABS | 10–1000, 2–300, 300–10,000 | ||
| Floyd et al., 2017 | 0.0 | Transparent glass box | RepRap Prusa i3 | ABS/PLA | 16.8–532.8, 500–20,000 | TSI SMPS 3936, TSI APS 3314 |
| Kwon et al., 2017 | 2.5 | Chamber | 3DISON Multi 2 | ABS/PLA | 10–420, 300–10,000 | TSI NanoScan 3910, TSI OPS 3330 |
| Mendes et al., 2017 | 0.2 | Chamber | miniFactory Oy-model 3 | ABS/PLA | 1–3, 2.02–63.8/4.45–140.7, 5.5–350, 10–1000, 10–700 | PSM A11 nCNC, TSI 3080N classifier with TSI UCPC 3776, Grimm SMPS+C series 5.400, TSI CPC 3007, DiSCmini |
| 81.0 | Room, stainless steel and glass walls | miniFactory Oy-model 3 | ABS/PLA | 1–3, 2.02–63.8/4.45–140.7, 5.5–350, 10–1000, 10–700 | ||
| Rao et al., 2017 | 0.1 | Chamber | Up Plus2 | ABS | <25,000 | Hanwang Co. haze detector |
| Stefaniak et al., 2017 | 0.5 | Stainless steel chamber | Makerbot Replicator 2X | ABS/PLA | 14.6–660, 650–20,000, 24–9380 | TSI SMPS 3910, Grimm OPS 1.108, ELPI Classic |
| Vance et al., 2017 | 0.5 | Polyethylene chamber | H480 Afinia 3D | ABS/PLA | 14.6–680 | TSI SMPS 3936NL |
| 777.0 | Office space | Makerbot Replicator 2X | ABS | 14.6–680 | ||
| 36.2 | Office space | H480 Afinia 3D | ABS | 14.6–680 | ||
| 140.5 | Laboratory | Makerbot Replicator 2X | ABS | 14.6–680 | ||
| 57.9 | Laboratory | Cubify Cube | ABS | 14.6–680 | ||
| 286.0 | Classroom | Makerbot Replicator 2X | ABS | 14.6–680 | ||
| Zhang et al., 2017 | 1.0 | Stainless steel chamber | Five different printers labeled A, B, C, D, E, and F | ABS/PLA | 7–3000, 7–300, 300–25,000 | TSI CPC 3022A, TSI SMPS 3080 with DMA 3081 and TSI CPC 3785, TSI AeroTrak 9306–01 |
Table 3.
Overall descriptive statistics for mean particle count diameters and mean particle number concentrations.
| Study | Filament | Mean particle count diameter (nm) | Mean particle number concentration (#/cm3) | ||||||||
|---|---|---|---|---|---|---|---|---|---|---|---|
| n | Mean | SD | Min | Max | n | Mean | SD | Min | Max | ||
| Stefaniak et al., 2017 | ABS | 4 | 53.0 | 7.6 | 45.3 | 63.1 | |||||
| PLA | 4 | 36.7 | 0.7 | 36.1 | 37.7 | ||||||
| Stephens et al., 2013 | ABS | 1 | 39.3 | NA | 39.3 | 39.3 | 0 | NA | NA | NA | NA |
| PLA | 1 | 56.7 | NA | 56.7 | 56.7 | 1 | 13,900 | NA | 13,900 | 13,900 | |
| Floyd et al., 2017 | ABS | 1 | 47.4 | NA | 47.4 | 47.4 | 1 | 654,000 | NA | 654,000 | 654,000 |
| PLA | 1 | 44.7 | NA | 44.7 | 44.7 | 1 | 641,000 | NA | 641,000 | 641,000 | |
| Yi et al., 2016 | ABS | 4 | 66.0 | 14.8 | 44.6 | 78.9 | 8 | 126,975 | 72,735 | 38,900 | 240,000 |
| PLA | 4 | 29.6 | 2.2 | 27.5 | 32.4 | 11 | 115,173 | 71,955 | 38,234 | 302,292 | |
| Mendes et al., 2017 | ABS | 10 | 10.5 | 2.7 | 7.8 | 15.5 | 10 | 533,800 | 912,900 | 26,000 | 2,800,000 |
| PLA | 3 | 14.0 | 10.8 | 7.6 | 26.4 | 4 | 93,608 | 184,267 | 290 | 370,000 | |
| Kwon et al., 2017 | ABS | 4 | 48.0 | 6.8 | 43.0 | 58.0 | 4 | 68,175 | 59,205 | 14,100 | 128,000 |
| PLA | 2 | 42.2 | 21.2 | 27.2 | 57.2 | 2 | 21,635 | 28,518 | 1470 | 41,800 | |
| Azimi et al., 2016 | ABS | 7 | 347,286 | 204,164 | 112,000 | 647,000 | |||||
| PLA | 4 | 1600 | 418 | 1280 | 2190 | ||||||
| Steinle, 2016 | ABS | 1 | 10,600 | NA | 10,600 | 10,600 | |||||
| PLA | 1 | 89,000 | NA | 89,000 | 89,000 | ||||||
| Zhang et al., 2017 | ABS | 8 | 88.5 | 24.3 | 40.7 | 118.3 | |||||
| PLA | 9 | 38.0 | 14.3 | 16.8 | 63.2 | ||||||
| Zontek et al., 2017 | ABS | 2 | 37,640 | 47,885 | 3780 | 71,500 | |||||
| PLA | 1 | 76,300 | NA | 76,300 | 76,300 | ||||||
| Deng et al., 2016 | ABS | 5 | 52,698 | 58,518 | 4890 | 153,000 | |||||
| PLA | 5 | 6736 | 7949 | 2420 | 20,900 | ||||||
| Kim et al., 2015 | ABS | 1 | 32.6 | NA | 32.6 | 32.6 | 1 | 1,740,000 | NA | 1,740,000 | 1,740,000 |
| PLA | 2 | 108.1 | 113.3 | 27.9 | 188.2 | 2 | 49,000 | 4243 | 46,000 | 52,000 | |
| Zhou et al., 2015 | ABS | 2 | 18 | 1 | 18 | 19 | |||||
| PLA | 0 | NA | NA | NA | NA | ||||||
| Overall | ABS | 33 | 48.5 | 32.6 | 7.8 | 118.3 | 41 | 287,827 | 541,546 | 18 | 2,800,000 |
| PLA | 26 | 40.4 | 33.0 | 7.6 | 188.2 | 32 | 82,590 | 132,981 | 290 | 641,000 | |
Note: “NA” indicates values that could not be calculated because there was only one statistic or no statistics reported. Vance et al. (2017) and Stabile et al. (2017) did not directly report mean PCD or mean PNC and were not included in Table 2.
3.2. Particle count diameter data
Mean PCDs were plotted against the nozzle temperature used for that study (Fig. 2left). Mode PCDs were plotted against the nozzle temperature used for that study (Fig. 2 right). Descriptive statistics for mean PCDs were calculated (Table 3). Mean PCD values revealed a difference of 8.1 nm between ABS and PLA for the seven studies that reported them.
Fig. 2.

The relationship of particle count diameter to nozzle temperature across selected studies. (Left) Contains mean particle count diameters from authors that reported these. (Right) Contains mode particle count diameter from authors that reported these. Each symbol represents a different author that an individual run was taken from.
Mean PCDs were compared to the PCD range measured for each study (Table 4). Each set of data represents an individual run from that publication. Mendes et al. (2017) and Zhang et al. (2017) reported numerous runs and mean PCDs in their studies (Mendes et al., 2017; Zhang et al., 2017). Mode PCDs were compared for each publication and the corresponding measured PCD size range for that study (Table S1b in the Supplemental section). Mode PCDs are reported simply for further exploration as some studies reported modes and not means. It was determined that regardless of the PCD range measured, the majority of PCD means and modes were found to be in the ultrafine size range (i.e. <100 nm).
Table 4.
Mean particle count diameters across studies.
| Study | Filament | Mean particle count diameter (nm) | Particle count diameter range measured by instrumentation (nm) |
|---|---|---|---|
| Stephens et al., 2013 | PLA | 56.7 | 10–420 |
| ABS and PLA | 39.3 | 10–420 | |
| Kim et al., 2015 | PLA | 27.9 | 10–420 |
| PLA | 188.2 | 10–420 | |
| ABS | 32.6 | 10–420 | |
| Yi et al., 2016 | ABS | 70.2 | 14.6–660 |
| ABS | 78.9 | 14.6–660 | |
| ABS | 70.1 | 14.6–660 | |
| ABS | 44.6 | 14.6–660 | |
| PLA | 28.3 | 14.6–660 | |
| PLA | 27.5 | 14.6–660 | |
| PLA | 30.1 | 14.6–660 | |
| PLA | 32.4 | 14.6–660 | |
| Floyd et al., 2017 | ABS | 47.4 | 16.8–532.8 |
| PLA | 44.7 | 16.8–532.8 | |
| Kwon et al., 2017 | ABS | 45.6 | 10–420 |
| ABS | 58 | 10–420 | |
| ABS | 43 | 10–420 | |
| ABS | 45.2 | 10–420 | |
| PLA | 57.2 | 10–420 | |
| PLA | 27.2 | 10–420 | |
| Mendes et al., 2017 | ABS | 8.8 | 1–3, 2–63.8/4.45–140.7, 5.5–350 |
| ABS | 15.5 | 1–3, 2–63.8/4.45–140.7, 5.5–350 | |
| ABS | 7.9 | 1–3, 2–63.8/4.45–140.7, 5.5–350 | |
| ABS | 12.8 | 1–3, 2–63.8/4.45–140.7, 5.5–350 | |
| ABS | 10.5 | 1–3, 2–63.8/4.45–140.7, 5.5–350 | |
| PLA | 7.9 | 1–3, 2–63.8/4.45–140.7, 5.5–350 | |
| ABS | 8.2 | 1–3, 2–63.8/4.45–140.7, 5.5–350 | |
| ABS | 14 | 1–3, 2–63.8/4.45–140.7, 5.5–350 | |
| ABS | 7.8 | 1–3, 2–63.8/4.45–140.7, 5.5–350 | |
| ABS | 9.6 | 1–3, 2–63.8/4.45–140.7, 5.5–350 | |
| ABS | 9.9 | 1–3, 2–63.8/4.45–140.7, 5.5–350 | |
| PLA | 26.4 | 1–3, 2–63.8/4.45–140.7, 5.5–350 | |
| PLA | 7.6 | 1–3, 2–63.8/4.45–140.7, 5.5–350 | |
| Stefaniak et al., 2017 | ABS | 53.7 | 24–9380 |
| ABS | 63.1 | 24–9380 | |
| ABS | 49.9 | 24–9380 | |
| ABS | 45.3 | 24–9380 | |
| PLA | 36.4 | 24–9380 | |
| PLA | 36.1 | 24–9380 | |
| PLA | 36.5 | 24–9380 | |
| PLA | 37.7 | 24–9380 | |
| Zhang et al., 2017 | ABS | 98.6 | 7–300, 300–25,000 |
| ABS | 90.4 | 7–300, 300–25,000 | |
| ABS | 40.7 | 7–300, 300–25,000 | |
| ABS | 103 | 7–300, 300–25,000 | |
| ABS | 92 | 7–300, 300–25,000 | |
| ABS | 118.3 | 7–300, 300–25,000 | |
| ABS | 66 | 7–300, 300–25,000 | |
| ABS | 99.2 | 7–300, 300–25,000 | |
| PLA | 16.8 | 7–300, 300–25,000 | |
| PLA | 38.9 | 7–300, 300–25,000 | |
| PLA | 63.2 | 7–300, 300–25,000 | |
| PLA | 50.6 | 7–300, 300–25,000 | |
| PLA | 49.5 | 7–300, 300–25,000 | |
| PLA | 35.4 | 7–300, 300–25,000 | |
| PLA | 27.9 | 7–300, 300–25,000 | |
| PLA | 31.2 | 7–300, 300–25,000 | |
| PLA | 28.1 | 7–300, 300–25,000 |
Note: Majority of mean particle count diameters fell below 99.2 nm. The “/” indicates the instrument could be set to measure either particle range.
3.3. Particle number concentration data and meta-analysis
Mean PNCs were plotted against the nozzle temperature (Fig. 3 left). Peak PNCs were plotted against the nozzle temperature (Fig. 3 right). Meta-analysis of the published individual mean PNCs tests the difference of ABS and PLA filaments and is based on the seven publications with 3 or more observations (Azimi et al., 2016; Deng et al., 2016; Kim et al., 2015; Kwon et al., 2017; Mendes et al., 2017; Yi et al., 2016; Zontek et al., 2017). Mean PNCs for Yi et al. (2016) were calculated from PNC data provided by the author (Table S1a in the Supplemental section). Descriptive statistics for these publications were calculated with overall means of 300,980 particles/cm3 for ABS and 65,482 particles/cm3 for PLA, yielding 235,498 particles/cm3 as the overall difference of means (Table S3 in the Supplemental section). After adjusting for nozzle temperature within filament (F 31.49 p < 0.0001), the linear mixed model for log-transformed mean PNCs is suggestive of an association with the fixed effect of filament at α = 0.05 (F 3.14, p0.0802) and a difference of ABS and PLA least squares means (t 2.08, p 0.0538). Forest plots were created of the mean PNC data used in the model for the ABS and PLA filaments (Fig. 4) and diagnostics of model residuals were performed (Fig. S6 in the Supplemental section). SAS code corresponding to Fig. 4 is included in this publication as well (S4 in the Supplemental section).
Fig. 3.
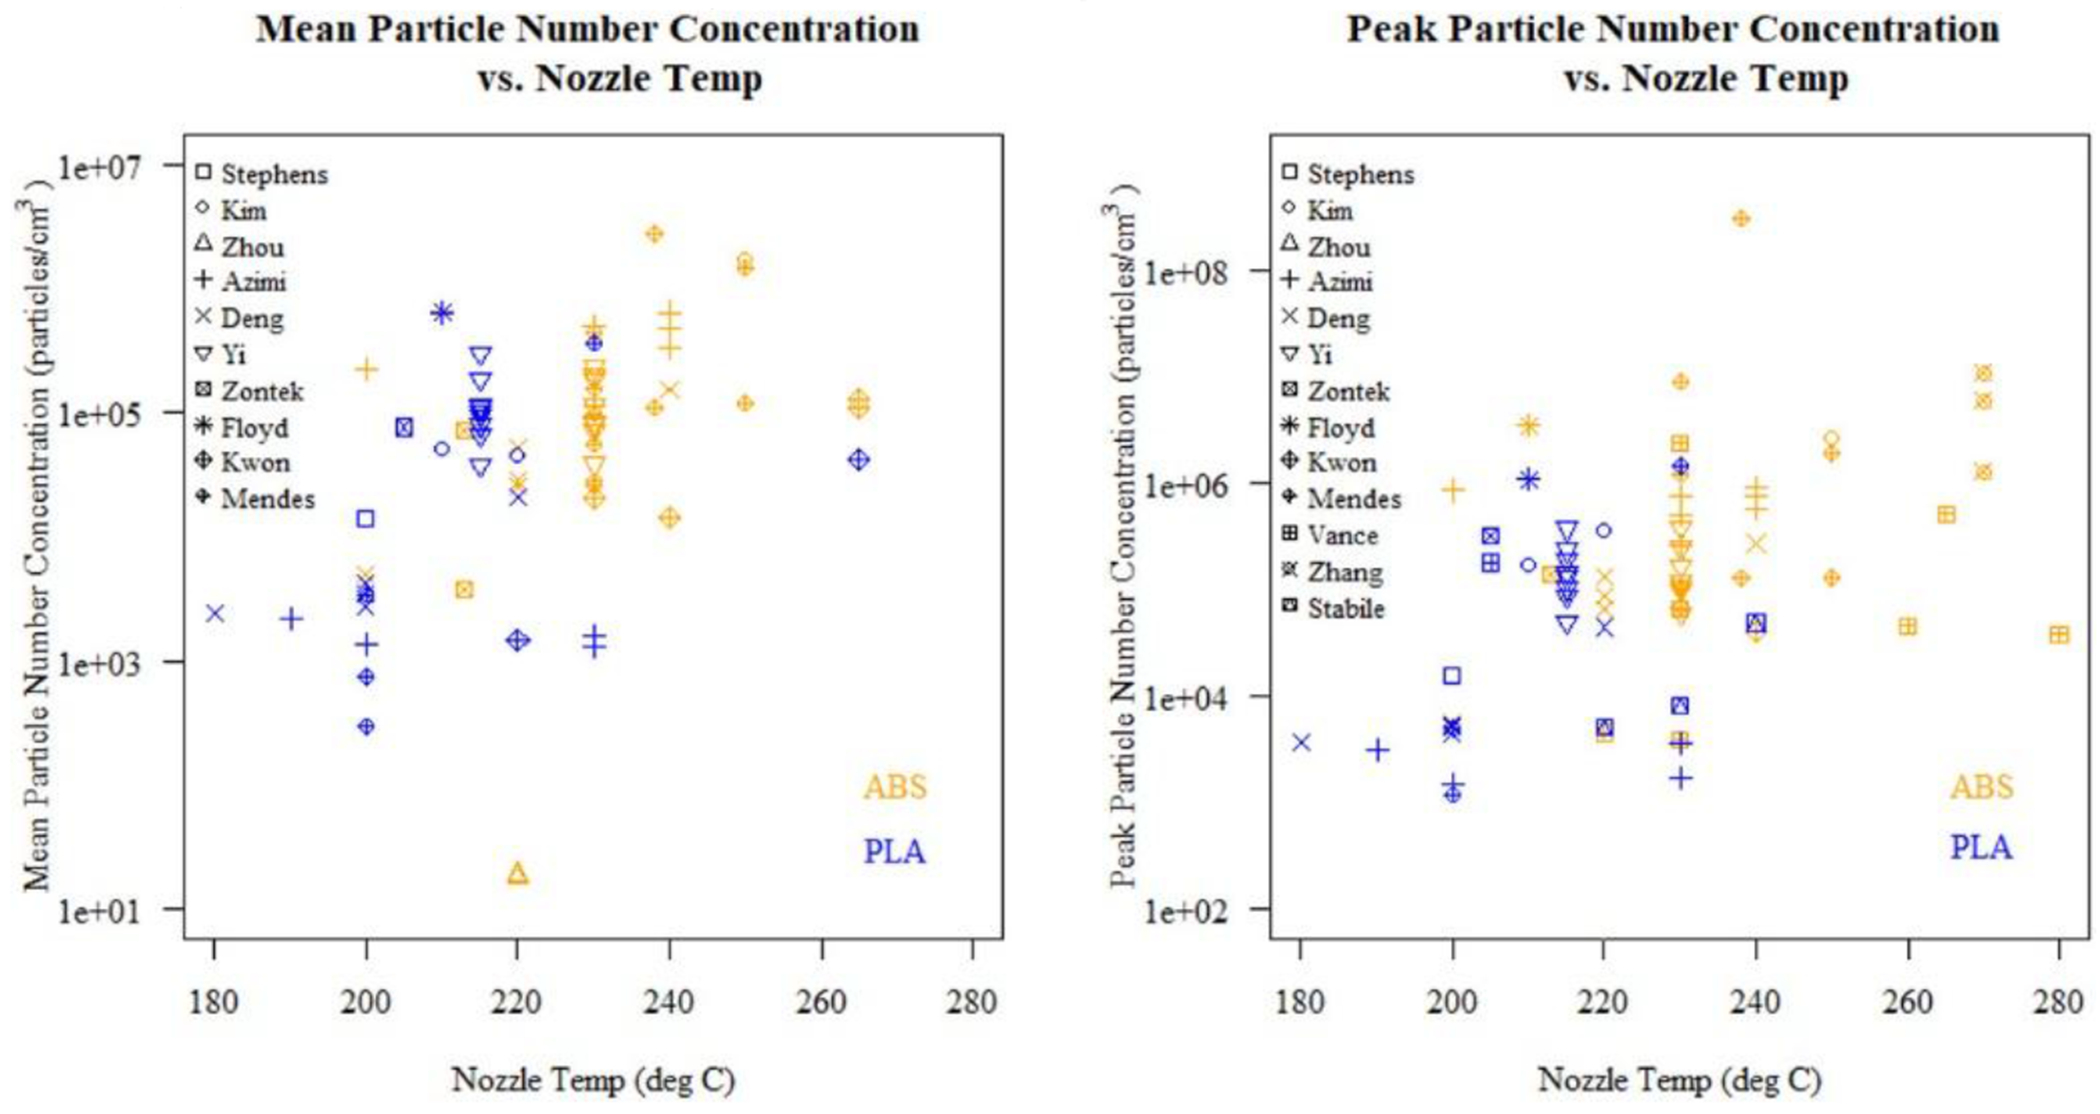
The relationship of mean particle number concentration to nozzle temperature across selected studies. (Left) Contains mean particle number concentrations from authors that reported them. (Right) Contains peak particle number concentrations from authors that reported them. Each symbol represents a different author that an individual run was taken from.
Fig. 4.

Forest plot of mean particle number concentrations and their 95% confidence intervals left-truncated at zero. (Left) Includes mean particle number concentrations for ABS filament. (Right) Includes mean particle number concentrations for PLA filament.
3.4. Particle number emission rates
Mean PNERs were plotted against the nozzle temperature used for that study (Fig. 5left). Peak PNERs were plotted against the nozzle temperature used for that study (Fig. 5 right). Three studies used summaries of PNERs across the entire print time to calculate mean PNERs instead of calculating values at each step in a time series (Kim et al., 2015; Kwon et al., 2017; Mendes et al., 2017). These were included in the comparison of mean PNERs to nozzle temperature (Fig. 5).
Fig. 5.

The relationship of particle number emission rate to nozzle temperature across selected studies. (Left) Contains mean particle number emission rates from authors that reported them. (Right) Contains peak particle number emission rates from authors that reported them. Each symbol represents a different author that an individual run was taken from.
The results of the PNER equations when using PNC data from Stefaniak et al. (2017), Zhang et al. (2017) and Azimi et al. (2016) were plotted over the active print time (Fig. 6). The calculated PNER for each time step is plotted on the y-axis. Mean and peak PNERs were calculated from each dataset of PNCs (Table 5).
Fig. 6.

The relationship between the effect of different particle number emission rate calculations on three different recorded concentrations across 3D printer studies. (Upper left) The results of particle number emission rate calculations using raw data from Stefaniak et al. (2017). (Upper right) The results of particle number emission rate calculations using raw data from Zhang et al. (2017). (Bottom left) The results of emission rate calculations using raw data from Azimi et al. (2016). Each symbol and color represents a different calculation method found in Table 4. (Bottom right) A table that summarizes mean and peak values across the previous 3 figures.
4. Discussion
Sixteen papers were reviewed that tested FDM 3D printers emissions. From these papers, mean PCD, mode PCD, mean PNC, peak PNC, mean PNER and peak PNER were extracted. Despite heterogeneity in PCD ranges measured, almost all mean PCD and mode PCD values were considered ultrafine. Descriptive statistics for mean PCD revealed a difference of 8.1 nm between ABS and PLA. A meta-analysis of PNC data after adjusting for nozzle temperature suggested an association with filament type. Lastly, PNER calculation method drastically influenced PNER values for the same PNC dataset.
4.1. Particle count diameter
There were a wide range of mean and mode PCDs reported in the studies analyzed. These data were compared for ABS and PLA in box plots (S5 in the Supplemental section). The observed difference in means of 8.1 nm (48.5 nm for ABS minus 40.4 nm for PLA) was statistically significant. However, both particle sizes are considered within the ultrafine range and would be approximately equivalent in their respiratory tract deposition and predicted to reach the tracheobronchial and alveolar/pulmonary regions of the human lower respiratory system (Table 3) (Miller et al., 2016). There was an extremely wide range of PCD size ranges tested across the studies (Table 4). Several studies used multiple devices to measure different ranges of PCDs and PNCs for the same test (Table 2) (Mendes et al., 2017; Stefaniak et al., 2017; Yi et al., 2016; Zhang et al., 2017). However, despite the differences in PCD ranges measured and instruments used, most PCD means and modes were reported in the ultrafine size range. Although Zhou et al. (2015) reported a high mode of 265 nm, the instrument used had a lower limit of 250 nm (Table S1b in the Supplemental section).
For studies that reported distributions of PNCs by PCD bin size, data showed no heavy skewness or outliers outside of the ultrafine range (0–100 nm) (Mendes et al., 2017; Stabile et al., 2017; Steinle, 2016; Vance et al., 2017; Yi et al., 2016; Zhang et al., 2017; Zontek et al., 2017). Ultrafine particles have been shown to have unique health risks compared to larger particles including deep penetration into the lungs, higher retention than larger particles and the potential ability to translocate to a number of organ systems (Gate et al., 2017; Valavanidis et al., 2008). These studies suggest that 3D printers may pose a unique health hazard under certain use conditions.
4.1.1. Particle count diameter analysis limitations
There are several limitations for the analysis for PCDs. One limitation, based on differences in instrumentation, is that the studies were not standardized for the range of PCDs measured, and the different ranges affect the comparability of the means. In addition, several studies reported PCD data that were created using several different PCD sizing instruments. These studies then combined data differently, affecting the way PCD means or modes were calculated (Floyd et al., 2017; Mendes et al., 2017; Zhang et al., 2017). A third limitation is the lack of reporting PCD measurements, or reporting data in figures that could not be digitized using WebPlotDigitizer.
In our analysis, we also did not account for time sensitive changes in particle diameter nor did we account for particle mass, surface area or chemical composition. Zhang et al. (2017) and Vance et al. (2017) found that particle diameter increased farther into the print time. In addition, Zhang et al. (2017) found that while particle number was dominated by particles < 100 nm in diameter, total particle mass and total surface area were dominated by particles > 100 nm. Lastly, the mean PCD difference of 8.1 nm between ABS and PLA does not account for chemical compositions of emissions which may differentially affect overall health risks caused by particle inhalation.
4.2. Particle number concentration
A higher nozzle temperature typically results in higher PNCs (Fig. 3). This is also supported by box plots (Fig. S5 in the Supplemental section). These observations raise several questions. For example, are PNCs higher for ABS because of the material being inherently different than PLA, or because the nozzle temperature typically tends to be higher when using ABS? Several studies were available that used ABS and PLA at the same temperature, showing that ABS PNCs tend to be higher than PLA PNCs (Fig. 3). In contrast, Mendes et al. (2017) does show PLA PNCs to be higher than ABS PNCs at the same nozzle temperature. However, Mendes et al. (2017) acknowledged that printing PLA at 230 °C was higher than what is typically used which could lead to further decomposition (Mendes et al., 2017). Steinle (2016), not included in Fig. 3, found PLA PNCs to be higher than for ABS. However, the study did not report a nozzle temperature.
As stated earlier, ABS was typically run at a higher nozzle temperature than PLA, and our linear mixed model for log-transformed mean PNCs included an adjustment for nozzle temperature within filament. The results of this model suggested that the increased mean PNCs when using ABS was correlated with nozzle temperature, less so for filament type after adjusting for nozzle temperature, and that the difference of ABS and PLA least squares means indicated that filament type had an effect that was on the threshold of significance.
4.2.1. Particle number concentration analysis limitations
The analysis of PNCs has several limitations. One limitation, as for the PCDs, is the lack of measurement data for mean PNCs across the selected literature, including data presented in figures that could not be quantified using WebPlotDigitizer. Another limitation may be due to bias present in the reported PNC data. 3D printers have nozzles that jam due to collection of filament material at the head. As the number of successful print runs increase, the chance of filament material collected at the nozzle increases. This collection of material at the nozzle head can lead to higher PNCs (Mendes et al., 2017). Most authors did not discuss the influence of filament accumulation on their results and no authors reported the number of previous runs performed. By not reporting concentrations that are recorded during misprints, authors could be biasing concentrations to be lower than seen for all runs (Mendes et al., 2017). Also, by not reporting the number of previous runs, authors could be biasing PNCs to be higher or lower depending on the amount of filament material collected at the nozzle. Finally, the meta-analysis of mean PNC data was based on limited data from 7 papers.
4.3. Particle number emission rate analysis
The PNER values for ABS tended to be higher than PLA (Fig. 5). These values were taken directly from PNER means and peaks reported in each study. Given the discrepancies in PNER calculation methods across selected studies, it was found that PNER calculation methods would need to be investigated further.
To understand how the different assumptions in the five selected PNER calculation methods could affect their outcomes, these five methods were tested against three different sets of data from three different authors (Azimi et al., 2016; Stefaniak et al., 2017; Zhang et al., 2017). These three systems were similar in terms of the size and composition of the test chambers. Particles emitted from the 3D printer may have different amounts of electrostatic attraction to chamber sidewall materials, so the comparison was limited to chambers constructed of the same material (McMurry and Rader, 2007). The first author, Stefaniak, used a 0.5 m3 stainless steel chamber with an air exchange rate (AER) of 3 h−1 (Stefaniak et al., 2017). The second author, Zhang, used a 1 m3 stainless steel chamber with an AER of 1 h−1 (Zhang et al., 2017). The third author, Azimi, used a 3.6 m3 stainless steel chamber with an AER of 1 h−1(Azimi et al., 2016). All three sets of data used an ABS filament.
We ran PNC time series data produced by Stefaniak through the particle number emission equations (Stefaniak et al., 2017). Although the PNC values differed for each particle number emission equation, they were similar in terms of their summary statistics. The relative standard deviation (standard deviation divided by the mean) of the PNERs across the values was 41.14% while the relative standard deviation of the peak values was 0.11%, indicating that peak values were nearly identical. This indicated that while there was variability in individual values at each time step, the means were relatively close together.
The second set of data examined was from Zhang et al. (2017). The PNC data showed an overall downward trend. PNC datasets found in the literature may have a drop in PNC after reaching their maximum value at the beginning of the printing process (Azimi et al., 2016; Zhang et al., 2017). One explanation for this drop is that as the particles begin to form and aggregate, they provide a surface for VOC adsorption, lowering the overall number of particles measured (Zhang et al., 2017). As VOCs move away from the high temperature nozzle head, they may cool off and partition onto surfaces and larger particles more readily (Wei et al., 2018). This particular dataset represents a point in the 3D printing process where particles are still beginning to aggregate into larger ones with VOCs attaching to them (Zhang et al., 2017).
The mass balance numerical models used to compute PNERs at each time step were not viable (Table 5). Most of the values of each method, except for those of Eqs. (2) and (3), yielded negative values. This of course, is impossible in terms of a physical understanding and is explained in the next section. The relative standard deviation of the mean PNERs across the values was 148.21%, while the relative standard deviation of the peak values was 47.90%. These values are much larger than those from the previous run and show that magnitude of losses was larger for this set of PNC data.
Interestingly, it was also shown that Eqs. (4) and (5) differ more for the Zhang et al. (2017) dataset than other PNC time series. This may be related to the time interval between each data point. Zhang et al. (2017) used an interval of 2 min and 15 s, Azimi et al. (2016) used an interval of 1 min, and Stefaniak et al. (2017) used an interval of 1 s. Eq. (5) converted from Eq. (4) relies on the assumption that Δt is small. The larger that Δt becomes, the more the results of Eqs. (4) and (5) differ (S10 in the Supplemental section).
For the data from Azimi et al. (2016), we selected a PNC time series that followed both an up and down trend to act as a “middle” example between the data from Stefaniak et al. (2017) and Zhang et al. (2017). Again, values differed by orders of magnitude. The mean PNERs had a relative standard deviation of 126.94% while the relative standard deviation of the peak values was 38.36%. There were two “dips” in the overall curves that resulted in some negative values across the print time.
4.3.1. Negative emission rates and the variation in emission rates
3D printers are either off and not emitting particles or on and emitting particles. Negative PNERs indicate that there are losses in the system that are unaccounted for (L) and/or the influx of particles (QinCin) is overcounted in the PNER calculation (S9 in the Supplemental section). As the slope of the PNC data becomes more negative, this causes the time step term at the beginning of the equation to become more negative as well. This then drives the entire result of the equation at that time, t, to become negative. The lack of a loss term, L, of a large enough magnitude or the presence of an influx of particles term, QinCin, that was too large resulted in a negative PNER. This inability to accurately calculate losses and particle influxes resulted in differences among the five methods. Azimi et al. (2016) stated that the uncertainty of their time-varying UFP emission rate calculations was about 45%. For PNC datasets where there was a larger negative slope, there was a large amount of discrepancy between the mean PNERs and PNER time series curves over the print time among the five different methods.
It is important to note that in Stefaniak et al. (2017) the AER was reported as 3.0 h−1while the AERs reported in Zhang et al. (2017) and Azimi et al. (2016) were 1.0 h−1. For chamber studies of hard copy devices (printers), an AER above about 1.3 h−1causes outflow to dominate particles losses as compared to deposition on particle walls and coagulation (Barthel et al., 2013). In addition, VOCs reach steady-state particle/gas equilibriums more easily at smaller air exchange rates (Wei et al., 2018). Thus, it is reasonable to assume that the PNER equation used in Stefaniak et al. (2017) (Eq. (1)) can account for most of the particles in their system. However, Eq. (1) cannot account for all of the particles emitted in the studies by Zhang et al. (2017) or Azimi et al. (2016) where deposition and coagulation contribute more to a loss factor other than outflow, as indicated by the lower air exchange rate.
Pelley (2018) argued that there was a strong need for a standard testing procedure for 3D printers. Our evaluation of PNC data using different calculation methods supports the need to use a standard PNER equation with a standard experimental setup. Zhang et al. (2017) suggests several experimental setup characteristics that should be followed including a two-hour print time to allow concentrations to reach steady state. Currently, there are discrepancies in the methods across the literature that make PNER comparisons difficult. A standard and more precise accounting of influx and loss terms is needed when considering design setup and PNER analysis in future studies.
4.3.2. Particle number emission rate analysis limitations
Our results indicate that assumptions about particle influxes and losses can influence the resultant PNER means and peaks for the same PNC data. However, additional experimental factors such as the geometry of the chambers (which affects particle mixing), the position of particle counting devices, temperature, and humidity also differ across studies. Given this heterogeneity in experimental conditions, there is limited ability to understand how experiment characteristics can influence PNC data and subsequent PNER data.
4.4. The impact of VOCs on PCDs, PNCs and PNERs
Several authors found that ABS released different and greater amounts of VOCs than PLA when used in 3D printer studies (Kim et al., 2015; Stefaniak et al., 2017; Vance et al., 2017). Zhang et al. (2017) and Vance et al. (2017) found that over the printing time, VOCs may be condensing and creating larger particles later in the print cycle. VOCs adhering to walls and larger particles may also partition back into the gas phase when leaving through the chamber outflow, affecting PNC values. The increase in PNCs at higher nozzle temperatures may be in part to the desorption of VOCs at higher nozzle temperatures. In a thermal degradation study, it was found that ABS released greater amounts of VOCs than PLA (Wojtyla et al., 2017). At higher temperatures, there was greater partitioning of VOCs into the gas phase, which could result in increased PNCs as they condense into particles (Wei et al., 2018). Operators of FDM 3D printers using filaments at higher nozzle temperatures may be exposed to larger amounts of VOCs. The use of ABS or PLA may also result in differing compositions of VOCs in the environment, which could lead to different health effects. The relative health risks of using PLA or ABS, however, is not fully understood (Vance et al., 2017).
To lessen the effect of VOC absorption onto larger particles when calculating PNERs, negative PNERs are removed before calculating total aerosol emissions in Vance et al. (2017) and Azimi et al. (2016). Azimi et al. (2016) attempted to estimate individual emission rates for a variety of VOCs; however, the effect of VOC partitioning between phases on overall PNERs has not been quantified in these 3D printer studies. The effects of VOC partitioning between phases on reported PNCs is not considered in the dynamic mass balances throughout the 3D printing literature leading to incomplete mass balance models which, along with other unrecorded losses, can lead to negative PNERs.
Peak PNERs generally had closer values than mean PNERs but still had large deviations from each other. These peak PNERs seem to occur at the same time in each PNC dataset (Fig. 6). As suggested by Zhang et al. (2017) as PNC increases, more semi-volatile compounds will adhere to larger particle surfaces and reach equilibrium with the gas phase. Thus, this extra loss may not yet be affecting peak PNERs early in the printing process as PNC increase and fits with our hypothesis that loss terms may be the overall factor determining differences in PNER values from the same PNC data.
4.5. Ultrafine particles emitted from laser printers as compared to 3D printers
PNERs across the selected literature were not found to be directly comparable because of differences in PNER calculation methods. However, currently available data can be used to draw broad conclusions when compared to other known particle emission sources. Several European countries have set emission standards for 2D office printers including the emission of volatile organic compounds (VOCs), formaldehyde, dust and ozone (Li et al., 2016). In addition, there have been many publications on the emissions of aerosols from traditional 2D printers such as laser printers. A recent 2017 study compared 110 different laser printer models in a simulated office setting and found PNERs to be between 3.39 × 10⁸ particles min−1and 1.61 × 10¹² particles min−1 (Scungio et al., 2017). Our collected data for 3D printers showed that mean PNERs varied between 107 particles min−1 and 2 × 10¹² particles min−1. Although it was suggested that the ultrafine particle exposure for laser printer operation was relatively low compared to other typically encountered sources, it was further suggested that low ventilation, close proximity and constant operation could significantly increase the exposure to ultrafine particles (Scungio et al., 2017).
4.6. Reporting of printing parameters
During the operation of 3D printers, there are a number of factors in addition to nozzle temperature that may affect PCDs and PNCs. However, many of these printing parameters including print speed (or extruder speed), printer nozzle size, printed layer height, and in some cases, bedplate temperature were not reported in many of the studies examined. These values are typically set by the operator or are left as manufacturer defaults. It is usually assumed that nozzle temperature plays the largest role in particle number concentrations from 3D printers and, thus, nozzle temperature was commonly reported across the literature. However, nozzle temperature has not been proven to be the most important parameter to affect printer emissions and other parameters such as bed temperature may also influence emissions (Azimi et al., 2016). The lack of data for these printing parameters makes it impossible to determine how they influence emissions. With this report, we encourage future publications regarding 3D printer emissions to provide greater detail of printer parameters.
5. Conclusions
Our investigation into the characteristics of particles emitted from FDM 3D printers resulted in several findings. Presently, there is a large amount of heterogeneity in terms of reporting of parameters and methods used for measuring 3D printer emissions between studies. Despite this heterogeneity, the majority of particles released were ultrafine in size (i.e., <100 nm) indicating that 3D printers using ABS and PLA may result in inhalation of ultrafine particles for 3D printer operators. Although the literature suggests that exposures to ultrafine particles may lead to deleterious health effects, the particle concentration that one may be exposed to during 3D printer operation depends on a number of factors such as room size, ventilation, printer enclosure, etc.
Mean PNCs emitted in 3D printing tests ranged over several orders of magnitude across publications with overall means of 300,980 particles/cm3 for ABS and 65,482 particles/cm3 for PLA. The linear mixed model for mean PNCs suggests association with filament (p 0.0802) and the difference (235,498 particles/cm3) in overall means to be substantive after adjusting for nozzle temperature. This indicates that use of ABS as a 3D printing filament may result in exposure to larger numbers of particles than when using PLA and that nozzle temperature does affect the number of particles emitted in these studies.
PNERs were generally higher when using ABS than PLA filaments. However, because PNERs were calculated across studies using different methods, further investigation is needed for methods used to report these values. The calculation of particle influxes and losses varied widely across studies and directly impacted the PNERs reported. Using PNC data requested from three authors, we report that using different published calculation methods for PNERs on each set of PNC data resulted in values for PNER that in some cases were orders of magnitude different. To strengthen direct comparability of results going forward, it is recommended that standard emissions testing protocols be developed for FDM 3D printers and particle influxes and losses be more carefully considered including the partitioningof VOCs between the gas phase and adhering to surfaces. Finally, it was shown that 3D printer PNERs are comparable to those released by 2D laser printers across a wide variety of conditions despite heterogeneity in particle sizes and methods and that reporting of more 3D printing parameters is encouraged for future studies to understand their impacts on emissions.
Supplementary Material
Acknowledgements
We would like to thank Dr. Aleks Stefaniak at the National Institute of Occupational Safety and Health for letting us use extract mean and peak particle number concentration data from his raw data and for his advice on 3D printer emissions. We would also like to thank Dr. Rodney Weber and Qian Zhang at the Georgia Institute of Technology, and Dr. Brent Stephens and Dr. Parham Azimi at the Illinois Institute of Technology for letting us look over some of their raw particle number concentration data and use one of their PNC datasets each for our analysis. We would like to thank the EPA Research Triangle Park library staff for helping with the literature search and the EPA OARM Graphics staff for creating the graphical abstract. Finally, we thank Dr. Vernon Benignus, Dr. Mike Messner and Dr. Mark Higuchi at the Environmental Protection Agency for comments on a previous version of the manuscript.
Funding
This work was supported by the intramural research program of the U.S. EPA Office of Research and Development. Funding for Dr. Byrley was provided by the EPANSSC program.
Footnotes
Conflicts of interest
The authors have no conflict of interest.
References
- Azimi P, Zhao D, Pouzet C, Crain NE, Stephens B, 2016. Emissions of ultrafine particles and volatile organic compounds from commercially available desktop threedimensional printers with multiple filaments. Environ. Sci. Technol 50 (3), 1260–1268. [DOI] [PubMed] [Google Scholar]
- Barthel M, Seeger S, Rothhardt M, Wilke O, Horn W, Juritsch E, … Jann O, 2013. Measurement of Fine and Ultrafine Particles From Office Devices During Printing in Order to Develop a Test Method for the Blue Angel Ecolabel for Office-based Printing Devices. [Google Scholar]
- Bierkandt FS, Leibrock L, Wagener S, Laux P, Luch A, 2018. The impact of nanomaterial characteristics on inhalation toxicity. Toxicol. Res (Camb.) 7 (3), 321–346. [DOI] [PMC free article] [PubMed] [Google Scholar]
- Coré-Baillais Marine, Bensoussan H, Richardot A, Kusnadi H, 2017. The State of 3D Printing Edition 2017. [Google Scholar]
- Dempster A, Patel C, Selwyn M, Roth A, 1984. Statistical and computational aspects of mixed model analysis. Appl. Stat 33 (2), 203–214. [Google Scholar]
- Deng Y, Cao S-J, Chen A, Guo Y, 2016. The impact of manufacturing parameters on submicron particle emissions from a desktop 3D printer in the perspective of emission reduction. Build. Environ 104, 311–319. [Google Scholar]
- Floyd EL, Wang J, Regens JL, 2017. Fume emissions from a low-cost 3-D printer with various filaments. J. Occup. Environ. Hyg 14 (7), 523–533. [DOI] [PubMed] [Google Scholar]
- Gałęzowska G, Chraniuk M, Wolska L, 2016. In vitro assays as a tool for determination of VOCs toxic effect on respiratory system: a critical review. TrAC Trends Anal. Chem 77, 14–22. [Google Scholar]
- Gate L, Disdier C, Cosnier F, Gagnaire F, Devoy J, Saba W, … Mabondzo A, 2017. Biopersistence and translocation to extrapulmonary organs of titaniumdioxide nanoparticles after subacute inhalation exposure to aerosol in adult and elderly rats. Toxicol. Lett 265, 61–69. [DOI] [PubMed] [Google Scholar]
- Guerin L, Stroup WW, 2000. A simulation study to evaluate proc mixed analysis of repeated measures data. Conference on Applied Statistics in Agriculture. [Google Scholar]
- IRIS, 2002. 1,3-Butadiene; CASRN 106-99-0. U.S. EPA National Center for Environmental Assessment. [Google Scholar]
- Jyoti J, Basu S, Pratap Singh B, Dhakate SR, 2015. Superior mechanical and electrical properties of multiwall carbon nanotube reinforced acrylonitrile butadiene styrene high performance composites. Compos. B 83 (1), 58–65. [Google Scholar]
- Kenward M, Roger J, 1997. Small sample inference for fixed effects fromrestrictedmaximum likelihood. Biometrics 53, 983–997. [PubMed] [Google Scholar]
- Kim Y, Yoon C, Ham S, Park J, Kim S, Kwon O, Tsai PJ, 2015. Emissions of nanoparticles and gaseous material from 3D printer operation. Environ. Sci. Technol 49 (20), 12044–12053. [DOI] [PubMed] [Google Scholar]
- Kwon O, Yoon C, Ham S, Park J, Lee J, Yoo D, Kim Y, 2017. Characterization and control of nanoparticle emission during 3D printing. Environ. Sci. Technol 51 (18), 10357–10368. [DOI] [PubMed] [Google Scholar]
- Lee CW, Dai YT, Chien CH, Hsu DJ, 2006. Characteristics and health impacts of volatile organic compounds in photocopy centers. Environ. Res 100 (2), 139–149. [DOI] [PubMed] [Google Scholar]
- de Leon AC, Chen Q, Palaganas NB, Palaganas JO, Manapat J, Advincula RC, 2016. High performance polymer nanocomposites for additive manufacturing applications. React. Funct. Polym 103, 141–155. [Google Scholar]
- Li N, Georas S, Alexis N, Fritz P, Xia T, Williams MA, … Nel A, 2016. A work group report on ultrafine particles (AAAAI)why ambient ultrafine and engineered nanoparticles should receive special attention for possible adverse health outcomes in human subjects. J. Allergy Clin. Immunol 138 (2), 386–396. [DOI] [PMC free article] [PubMed] [Google Scholar]
- Madl AK, Pinkerton KE, 2009. Health effects of inhaled engineered and incidental nanoparticles. Crit. Rev. Toxicol 39 (8), 629–658. [DOI] [PubMed] [Google Scholar]
- McCue T, 2018. Wohlers Report 2018: 3D printing industry surpassed $7 billion. Forbes.com. [Google Scholar]
- McMurry PH, Rader DJ, 2007. Aerosol wall losses in electrically charged chambers. Aerosol Sci. Technol 4 (3), 249–268. [Google Scholar]
- Mendes L, Kangas A, Kukko K,Mølgaard B, Säämänen A, Kanerva T, … Viitanen A-K, 2017. Characterization of emissions from a desktop 3D printer. J. Ind. Ecol 21 (S1), S94–S106. [Google Scholar]
- Miller FJ, Asgharian B, Schroeter JD, Price O, 2016. Improvements and additions to the Multiple Path Particle Dosimetry model. J. Aerosol Sci 99, 14–26. [Google Scholar]
- Moher D, Liberati A, Tetzlaff J, Altman DG, Group TP, 2009. Preferred reporting items for systematic reviews and meta-analyses: the PRISMA statement. PLoS Med. 6 (7). [DOI] [PMC free article] [PubMed] [Google Scholar]
- Pelley J, 2018. Safety standards aim to Rein in 3-D printer emissions. ACS Cent. Sci 4 (2), 134–136. [DOI] [PMC free article] [PubMed] [Google Scholar]
- Rao C, Gu F, Zhao P, Sharmin N, Gu H, Fu J, 2017. Capturing PM2.5 emissions from 3D printing via nanofiber-based air filter. Sci. Rep 7 (1), 10366. [DOI] [PMC free article] [PubMed] [Google Scholar]
- Raquez J-M, Habibi Y, Murariu M, Dubois P, 2013. Polylactide (PLA)-based nanocomposites. Prog. Polym. Sci 38 (10–11), 1504–1542. [Google Scholar]
- Riley RD, Lambert PC, Abo-Zaid G, 2010. Meta-analysis of individual participant data: rationale, conduct, and reporting. BMJ 340, c221. [DOI] [PubMed] [Google Scholar]
- Roberts SM, Rohr AC, Mikheev VB, Munson J, Sabo-Attwood T, 2018. Influence of airborne particulates on respiratory tract deposition of inhaled toluene and naphthalene in the rat. Inhal. Toxicol 30 (1), 19–28. [DOI] [PubMed] [Google Scholar]
- Rohatgi, 2018. WebPlotDigitizer. Retrieved from https://automeris.io/WebPlotDigitizer. [Google Scholar]
- SAS Institute Inc., B, 2015. SAS/STAT® 9.3 User’s Guide. SAS Institute Inc., Cary, NC. [Google Scholar]
- Scungio M, Vitanza T, Stabile L, Buonanno G, Morawska L, 2017. Characterization of particle emission from laser printers. Sci. Total Environ 586, 623–630. [DOI] [PubMed] [Google Scholar]
- Stabile L, Scungio M, Buonanno G, Arpino F, Ficco G, 2017. Airborne particle emission of a commercial 3D printer: the effect of filament material and printing temperature. Indoor Air 27 (2), 398–408. [DOI] [PubMed] [Google Scholar]
- Stefaniak AB, LeBouf RF, Yi J, Ham J, Nurkewicz T, Schwegler-Berry DE, … Virji MA, 2017. Characterization of chemical contaminants generated by a desktop fused deposition modeling 3-dimensional printer. J. Occup. Environ. Hyg 14 (7), 540–550. [DOI] [PMC free article] [PubMed] [Google Scholar]
- Steinle P, 2016. Characterization of emissions from a desktop 3D printer and indoor air measurements in office settings. J. Occup. Environ. Hyg 13 (2), 121–132. [DOI] [PubMed] [Google Scholar]
- Stephens B, Azimi P, El Orch Z, Ramos T, 2013. Ultrafine particle emissions from desktop 3D printers. Atmos. Environ 79, 334–339. [Google Scholar]
- Sutton AJ, Higgins JP, 2008. Recent developments in meta-analysis. Stat. Med 27 (5), 625–650. [DOI] [PubMed] [Google Scholar]
- Turner B, Strong R, Gold S, 2014. A review of melt extrusion additive manufacturing processes: 1. Process design and modeling. Rapid Prototyp. J 20 (3), 192–204. [Google Scholar]
- Valavanidis A, Fiotakis K, Vlachogianni T, 2008. Airborne particulatematter and human health: toxicological assessment and importance of size and composition of particles for oxidative damage and carcinogenic mechanisms. J. Environ. Sci. Health C Environ. Carcinog. Ecotoxicol. Rev 26 (4), 339–362. [DOI] [PubMed] [Google Scholar]
- Vance ME, Pegues V, Van Montfrans S, Leng W, Marr LC, 2017. Aerosol emissions from fuse-deposition modeling 3D printers in a chamber and in real indoor environments. Environ. Sci. Technol 51 (17), 9516–9523. [DOI] [PubMed] [Google Scholar]
- Wei W, Mandin C, Ramalho O, 2018. Influence of indoor environmental factors on mass transfer parameters and concentrations of semi-volatile organic compounds. Chemosphere 195, 223–235. [DOI] [PubMed] [Google Scholar]
- Wojtyla S, Klama P, Baran T, 2017. Is 3D printing safe? Analysis of the thermal treatment of thermoplastics: ABS, PLA, PET, and nylon. J. Occup. Environ. Hyg 14 (6), D80–D85. [DOI] [PubMed] [Google Scholar]
- Yi J, LeBouf RF, Duling MG, Nurkiewicz T, Chen BT, Schwegler-Berry D, … Stefaniak AB, 2016. Emission of particulate matter from a desktop three-dimensional (3D) printer. J. Toxicol. Environ. Health A 79 (11), 453–465. [DOI] [PMC free article] [PubMed] [Google Scholar]
- Zhang Q, Wong JPS, Davis AY, Black MS, Weber RJ, 2017. Characterization of particle emissions from consumer fused deposition modeling 3D printers. Aerosol Sci. Technol 51 (11), 1275–1286. [Google Scholar]
- Zhou Y, Kong X, Chen A, Cao S, 2015. Investigation of ultrafine particle emissions of desktop 3D printers in the clean room. Procedia Eng. 121, 506–512. [Google Scholar]
- Zontek TL, Ogle BR, Jankovic JT, Hollenbeck SM, 2017. An exposure assessment of desktop 3D printing. J. Chem. Health Saf 24 (2), 15–25. [Google Scholar]
Associated Data
This section collects any data citations, data availability statements, or supplementary materials included in this article.