

Abstract
Background
The use of accurate prediction tools and early intervention are important for addressing severe coronavirus disease 2019 (COVID-19). However, the prediction models for severe COVID-19 available to date are subject to various biases. This study aimed to construct a nomogram to provide accurate, personalized predictions of the risk of severe COVID-19.
Methods
This study was based on a large, multicenter retrospective derivation cohort and a validation cohort. The derivation cohort consisted of 496 patients from Jiangsu Province, China, between January 10, 2020, and March 15, 2020, and the validation cohort contained 105 patients from Huangshi, Hunan Province, China, between January 21, 2020, and February 29, 2020. A nomogram was developed with the selected predictors of severe COVID-19, which were identified by univariate and multivariate logistic regression analyses. We evaluated the discrimination of the nomogram with the area under the receiver operating characteristic curve (AUC) and the calibration of the nomogram with calibration plots and Hosmer-Lemeshow tests.
Results
Three predictors, namely, age, lymphocyte count, and pulmonary opacity score, were selected to develop the nomogram. The nomogram exhibited good discrimination (AUC 0.93, 95% confidence interval [CI] 0.90–0.96 in the derivation cohort; AUC 0.85, 95% CI 0.76–0.93 in the validation cohort) and satisfactory agreement.
Conclusions
The nomogram was a reliable tool for assessing the probability of severe COVID-19 and may facilitate clinicians stratifying patients and providing early and optimal therapies.
Keywords: Nomogram, Predict, Severe, COVID-19, Regression
1. Introduction
Coronavirus disease 2019 (COVID-19) is a respiratory disease caused by the novel coronavirus severe acute respiratory syndrome coronavirus 2 (SARS-CoV-2). Patients with COVID-19 may be asymptomatic, have mild to moderate symptoms (such as cough, fever, dyspnea, and pneumonia), be in severe or critically ill condition, or even die. The COVID-19 pandemic has placed an unprecedented burden on the world economy and health care [1]. Delayed treatment for severe COVID-19 in particular can lead to a prolonged hospitalization duration, increased mortality and a heavier financial burden [2,3]. Risk factors for severe COVID-19 are currently considered to be age, comorbidities, dyspnea, chest pain, cough, expectoration, lower lymphocyte and higher leukocyte counts, blood urea nitrogen/creatinine ratios and serum ferritin, pulmonary opacity, and so on [[4], [5], [6], [7], [8], [9]]. As there are many related risk factors, the use of accurate prediction tools and early intervention are important in addressing severe COVID-19.
However, the prediction models of severe COVID-19 available to date are subject to various biases related to data quality (the presence and handling of missing data), flaws in the statistical analysis (lack of internal and external validation and categorization of continuous predictors and hence loss of information and weak assessment of model calibration and discrimination) and poor reporting (no mention of missing data) [[9], [10], [11], [12], [13], [14], [15], [16], [17], [18]].
A nomogram is a two-dimensional graphical representation of a scoring model consisting of multiple scale axes designed to quickly, visually calculate the probability of having an outcome with acceptable accuracy. The axis on the top is the point scale, which is followed by scale axes for the selected predictors, the total point scale, and then the probability scale. Each value on a predictor axis corresponds vertically to a point on the point scale. After determining the points for all the predictors from the point scale and adding them to obtain the total number of points, we can find a corresponding probability on the probability scale. Compared with other risk estimates and decision-making aid tools (risk groupings, artificial neural networks, probability tables, classification and regression tree analyses), nomograms provide a user-friendly interface (no computer software is required for interpretation and prediction) with consistent, highly accurate risk estimates [19].
Therefore, this study aimed to construct a nomogram based on a large number of COVID-19 patients to provide accurate, personalized predictions of severe COVID-19.
2. Methods
2.1. Study design and subjects
This study was based on a large, multicenter retrospective derivation cohort and a validation cohort. Patients were included if they fulfilled the diagnostic criteria of the “Diagnosis and Treatment Protocol for Novel Coronavirus Pneumonia (Trial Version 7)” released by the National Health Commission & National Administration of Traditional Chinese Medicine of China [20]. Patients without medical records or computed tomography (CT) information were excluded. The derivation cohort consisted of 496 patients from Jiangsu Province, China, between January 10, 2020 and March 15, 2020, and the validation cohort contained 105 patients from Huangshi, Hunan Province, China, between January 21, 2020, and February 29, 2020.
2.2. Variables measured
The primary outcome was severe or critical illness within the follow-up period. According to disease severity, patients were categorized into two groups: (1) the asymptomatic/mild/moderate group and (2) the severely or critically ill group [20]. Asymptomatic disease was defined as the absence of clinical symptoms and a positive nucleic acid test (real-time reverse transcriptase–polymerase chain reaction assay (RT-PCR) for SARS-CoV-2). Mild disease was defined as the presence of mild clinical symptoms without respiratory distress and the absence of imaging manifestations of pneumonia. Moderate disease was the presence of fever with respiratory symptoms and imaging manifestations of pneumonia. Severe disease was the presence of at least one of the three following conditions: respiratory distress, a respiratory rate ≥ 30 breaths/min; oxygen saturation (SpO2) ≤ 93%; or arterial blood oxygen partial pressure (PaO2)/fraction of inspired oxygen (FiO2) ≤ 300 mm Hg (1 mm Hg = 0.133 kPa). Critical illness was having respiratory failure requiring mechanical ventilation, shock or combined organ failure requiring intensive care unit (ICU) monitoring and treatment.
Disease severity was assessed at days 1, 2, 3, 4, 5, 6, 7 and 14 after admission (except for those who were discharged before day 14), the highest degree of severity was selected for analysis, and patients were followed up to discharge. Data were collected using medical records. Predictive baseline variables included sex, age, time from illness onset to admission (days), fever, cough, dyspnea, Charlson comorbidity index (CCI, a weighted index considering comorbidities associated with mortality [21]), white blood cell count, lymphocyte count, platelet count, creatinine level, C-reactive protein (CRP) level, procalcitonin level, D-dimer level, radiologic quadrant score and pulmonary opacity score.
Imaging grading was performed by two independent radiologists with more than 5 years of experience in pulmonary imaging. Axial chest CT sections were divided into quadrants (left, right, anterior, and posterior) by drawing horizontal and vertical lines through the center of the chest. Quadrant scores were estimated as the sum of quadrants with pulmonary opacities extending from the proximal to the distal end of the chest and ranged from 0 to 4. The pulmonary opacity score was visually assessed as the percentage of bilateral lung area with pulmonary opacity rounded to the nearest 5%.
2.3. Statistical analysis
Baseline characteristics of the derivation and validation cohorts are summarized as the median (interquartile range [IQR]) or frequency (percentage) and were compared using the Mann–Whitney U test for continuous variables and the χ 2 test or Fisher exact test for categorical variables.
Univariate binary logistic regression analysis was performed to select potential predictors of severe COVID-19. In addition to considering the clinical significance, collinearity analysis was conducted to exclude variables with slight collinearity (Spearman's rank correlation coefficient > 0.2) before univariate analysis. To determine the optimal combination of baseline characteristics for predicting severe COVID-19, a multivariate logistic regression model with variables selected via a backward stepwise process based on the smallest Akaike information criterion was established. Odds ratios (ORs) and 95% confidence intervals (95% CIs) were used to evaluate associations between predictors and severe COVID-19. No categorical data were missing, and missing continuous data were imputed with medians. A nomogram for the prediction of severe COVID-19 was established with the determined predictors.
The nomogram was internally validated on the derivation cohort using the bootstrap method and further externally validated on a separate independent validation cohort from Huangshi. Discrimination ability and calibration were used to assess the performance of the nomogram. The area under the receiver operating characteristic curve (AUC) and its 95% CI were used to evaluate model discrimination (0.5–1.0, the higher the better). Calibration plots were presented using the bootstrap resampling method (1000 resamples). Calibration plots are a good way to visually compare the accordance (agreement) between the predicted and actual absolute risk. The ideal calibration curve is located on the 45-degree diagonal, which reflects perfect consistency. Hosmer-Lemeshow tests were also conducted (P ≥ 0.05 indicates that the model fits the data well [well-calibrated]).
The 2-tailed P < 0.05 was set as the significance level. Statistical analyses were performed using R software (version 3.6.0, http://www.R-project.org). The “rms” package was used to derive a user-friendly nomogram.
3. Results
A total of 601 patients were included in the study, with 496 patients in the derivation cohort and 105 patients in the external validation cohort. During the 14-day hospitalization period, in the derivation and validation cohorts, 58 (11.7%) and 27 (25.7%) patients had severe COVID-19, and 438 (88.3%) and 78 (74.3%) patients had nonsevere COVID-19, respectively (P < 0.001). The patients' median age was 49 years (IQR, 35–60), and 53.9% were male (Table 1 ). Most of the baseline characteristics were significantly different between the two cohorts, including age, time from illness onset to admission, dyspnea, CCI, lymphocyte count, platelet count, CRP level, procalcitonin level, D-dimer level, radiologic quadrant score and pulmonary opacity score (all P < 0.05).
Table 1.
Patient baseline characteristics for the derivation and validation cohorts.a
| Characteristics | Overall cohort |
Derivation cohort |
Validation cohort |
P value |
|---|---|---|---|---|
| (N = 601) | (N = 496) | (N = 105) | ||
| Sex | 0.650 | |||
| Female | 277 (46.1%) | 226 (45.6%) | 51 (48.6%) | |
| Male | 324 (53.9%) | 270 (54.4%) | 54 (51.4%) | |
| Age (years) | 49.0 (35.0–60.0) | 47.0 (32.5–57.0) | 60.0 (50.0–69.0) | <0.001 |
| Time from onset to admission (days) | 5.0 (2.5–8.0) | 5.00 (2.0–8.0) | 6.0 (5.0–9.0) | <0.001 |
| Fever | 0.124 | |||
| No | 199 (33.1%) | 157 (31.7%) | 42 (40.0%) | |
| Yes | 402 (66.9%) | 339 (68.3%) | 63 (60.0%) | |
| Cough | 0.094 | |||
| No | 253 (42.1%) | 217 (43.8%) | 36 (34.3%) | |
| Yes | 348 (57.9%) | 279 (56.2%) | 69 (65.7%) | |
| Dyspnea | <0.001 | |||
| No | 566 (94.2%) | 493 (99.4%) | 73 (69.5%) | |
| Yes | 35 (5.8%) | 3 (0.6%) | 32 (30.5%) | |
| CCI | <0.001 | |||
| 0 | 511 (85.0%) | 440 (88.7%) | 71 (67.6%) | |
| ≥1 | 90 (15.0%) | 56 (11.3%) | 34 (32.4%) | |
| WBC (109/L) | 4.84 (3.88–6.01) | 4.84 (3.88–5.96) | 4.95 (3.92–6.23) | 0.473 |
| Lymphocyte count (109/L) | 1.20 (0.79–1.63) | 1.28 (0.90–1.72) | 0.95 (0.62–1.33) | <0.001 |
| Platelet count (109/L) | 165 (130–208) | 182 (149–218) | 127 (120–136) | <0.001 |
| Creatinine (μmol/L) | 63.0 (51.0–78.0) | 64.0 (51.0–78.2) | 60.5 (50.4–74.1) | 0.325 |
| C-reactive protein (mg/L) | 11.1 (4.67–34.4) | 10.0 (4.04–25.2) | 30.8 (13.5–68.7) | <0.001 |
| Procalcitonin (ng/mL) | 0.06 (0.02–0.20) | 0.04 (0.02–0.20) | 0.10 (0.07–0.15) | <0.001 |
| D-dimer (mg/L) | 0.25 (0.13–0.41) | 0.26 (0.16–0.42) | 0.11 (0.04–0.35) | <0.001 |
| Quadrant score (0–4) | 3.00 (1.00–4.00) | 2.00 (1.00–4.00) | 4.00 (4.00–4.00) | <0.001 |
| Pulmonary opacity score (%) | 20.0 (5.00–40.0) | 20.0 (5.00–40.0) | 25.0 (10.0–45.0) | 0.030 |
Abbreviations: CCI, Charlson comorbidity index; WBC, white blood cell.
Descriptive statistics: frequency (percentage), median (interquartile range).
Considering the clinical significance and collinearity shown in Supplementary Fig. S1, the radiologic quadrant score was excluded in the univariate logistic regression analysis due to the high correlation with pulmonary opacity score. The univariate analysis revealed that age, time from illness onset to admission, fever, cough, dyspnea, CCI, lymphocyte count, platelet count, CRP, D-dimer and pulmonary opacity score were statistically significant risk factors for severe COVID-19 (Table 2, all P < 0.05).
Table 2.
Factors associated with severe COVID-19 in the derivation cohort (univariate logistic regression).
| Characteristics | OR (95% CI) | P value |
|---|---|---|
| Sex, Male vs. Female | 1.42 (0.81–2.54) | 0.218 |
| Age (years) | 1.07 (1.05–1.09) | <0.001 |
| Time from onset to admission (days) | 1.07 (1.01–1.13) | 0.031 |
| Fever, Yes vs. No | 2.11 (1.10–4.42) | 0.024 |
| Cough, Yes vs. No | 2.01 (1.13–3.75) | 0.018 |
| Dyspnea, Yes vs. No | 14.52 (1.16–460.18) | 0.039 |
| CCI, ≥1 vs. 0 | 2.95 (1.53–5.51) | 0.002 |
| WBC (109/L) | 0.96 (0.82–1.12) | 0.595 |
| Lymphocyte count (109/L) | 0.04 (0.02–0.10) | <0.001 |
| Platelet count (109/L) | 0.99 (0.99–1.00) | 0.001 |
| Creatinine (umol/L) | 1.01 (1.00–1.02) | 0.165 |
| C-reactive protein (mg/L) | 1.02 (1.01–1.03) | <0.001 |
| Procalcitonin (ng/mL) | 1.03 (0.98–1.07) | 0.244 |
| D-dimer (mg/L) | 1.33 (1.11–1.59) | 0.002 |
| Pulmonary opacity score (%) | 1.07 (1.05–1.08) | <0.001 |
Abbreviations: OR, odds ratio; CI, confidence interval; CCI, Charlson comorbidity index; WBC, white blood cell.
Subsequent multivariate analyses identified significant independent predictors of severe COVID-19, including age, lymphocyte count, and pulmonary opacity score (Table 3). Since the variance inflation factor value of predictors in the final model was less than 10, the multicollinearity was considered acceptable.
Table 3.
The final multivariate logistic regression model on which the nomogram was based.a
| Variable | Coefficient | OR | 95% CI | P value |
|---|---|---|---|---|
| Age (years) | 0.059 | 1.061 | 1.028–1.095 | <0.001 |
| Lymphocyte count (109/L) | −2.567 | 0.077 | 0.023–0.257 | <0.001 |
| Pulmonary opacity score (%) | 0.053 | 1.055 | 1.035–1.075 | <0.001 |
Abbreviations: OR, odds ratio; CI, confidence interval; AUC, area under the receiver operating characteristic curve.
AUC: 0.93 (95% CI, 0.90–0.96) in the derivation cohort; 0.85 (95% CI, 0.76–0.93) in the validation cohort.
A nomogram was established based on the above three variables, which could predict the probability of severe COVID-19 in an individual patient (Fig. 1 ). Lymphocyte count had the largest regression coefficient absolute value and was used as a reference, and its range (3.5–0) corresponded vertically to the point range (0−100) of the point scale. According to the absolute value of the regression coefficient, each value of the remaining predictors (age and pulmonary opacity score) also corresponds to a point on the point scale vertically. The probability of severe COVID-19 in an individual patient can be determined on the probability scale, which corresponds vertically to the total point scale.
Fig. 1.

Predictive nomogram for the probability of severe COVID-19.
The proposed nomogram showed good discrimination for predicting severe COVID-19 (Fig. 2 ; AUC 0.93, 95% CI 0.90–0.96 in the derivation cohort; AUC 0.85, 95% CI 0.76–0.93 in the validation cohort). Furthermore, calibration plots and Hosmer-Lemeshow tests (P = 0.66 in the derivation cohort; P = 0.59 in the validation cohort) revealed that the nomogram was well calibrated and that the actual risks of severe COVID-19 were in good agreement with the predicted risks of severe COVID-19 in both the derivation and validation cohorts (Fig. 3 ).
Fig. 2.
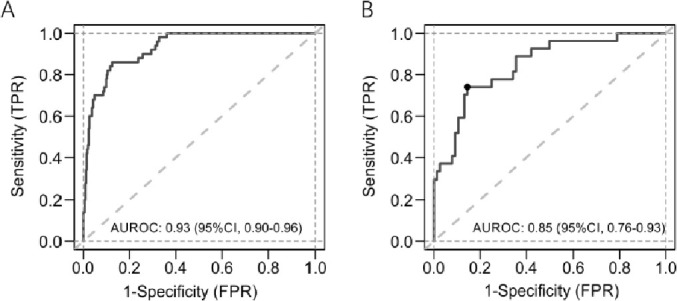
Receiver operating characteristic curves of the nomogram in the derivation and external validation cohorts.
Fig. 3.
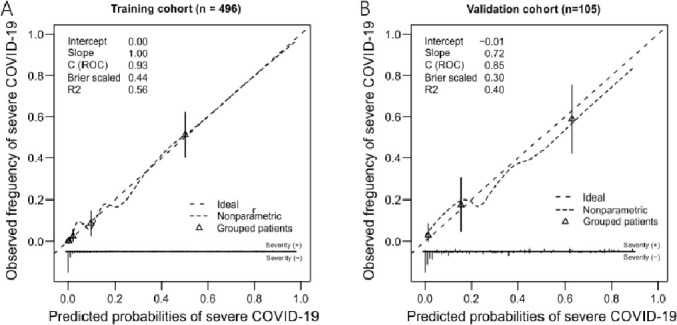
Calibration plots of the nomogram in the derivation and external validation cohorts. The 45-degree straight line represents ideal agreement between the actual and predicted probability. The vertical bars represent the 95% confidence interval of the actual probability.
An online tool for automatically calculating prediction probabilities (http://www.China-critcare.com/covid/calculate_en.html) (Fig. 4 ) was created to make the prediction model easier to use.
Fig. 4.

Screenshot of the nomogram website.
4. Discussion
By employing a large, multicenter retrospective cohort, we constructed a practical nomogram comprised of a few readily available baseline demographic, clinical and CT features (age, lymphocyte count and pulmonary opacity score) to predict severe COVID-19. The model quantifies the individual probability of having severe COVID-19 with good discrimination and agreement, which enables physicians to identify patients with high risk early and correctly and take proactive measures accordingly.
The incidences of severe COVID-19 among our derivation and validation cohorts were significantly different (11.7% vs. 25.7%). Most of the baseline characteristics were also significantly different between the two cohorts, which may be due to the difference in the incidence of severe COVID-19. A meta-analysis showed that compared with patients with nonsevere COVID-19, patients with severe COVID-19 had elevated levels of procalcitonin, CRP, and D-dimer but lower albumin levels [22]. External validation partially identified the general applicability of our nomogram.
In the current prediction model, age was one of the predictors of severe COVID-19. Two previously developed nomograms also incorporated older age in early risk estimations for severe COVID-19 [13,23]. The relationship between age and severe disease may be related to angiotensin converting enzyme-2 (ACE2). A study showed that ACE2 has an important salutary function: ACE2 limits several detrimental effects, including vasoconstriction and enhanced inflammation and thrombosis, but it is markedly downregulated by the entry of SARS-CoV-2 into cells, which may be especially detrimental in elderly individuals with age-related baseline ACE2 deficiency [24]. In addition, compared with younger COVID-19 patient groups, the elderly (≥65 years) patient population had the highest risk of severe or critical illness, intensive care use, and respiratory failure and the longest hospital stay, which may be partly due to their higher incidence of comorbidities (such as dementia and Parkinson's disease) and age-related degeneration of the immune system (known as immunosenescence) and hence impaired immunity to SARS-CoV-2 [[25], [26], [27]].
This study showed that a prolonged time from illness onset to admission may increase the risk of severe COVID-19, which is likely attributed to the delay of treatment. This is consistent with previous research [28,29]. Having symptoms (fever, cough and dyspnea) and a greater CCI (a weighted index considering comorbidities) on admission may also increase the risk of severe COVID-19. Previous studies have largely reported the association between comorbidities and COVID-19 severity [5,6,8].
Laboratory parameters, including lymphocyte count, platelet count, CRP level and D-dimer level, were found to be associated with severe COVID-19 in the univariate logistic regression analysis of this study, which is in accordance with previous research [4,5,8,9]. Among these laboratory parameters, only lymphocyte count was identified as an independent predictor of severe COVID-19. Two previously developed clinical risk scoring systems also included lymphocyte count in the prediction of COVID-19 severity [13,30]. A previous study proposed four potential mechanisms for reduced lymphocyte levels in COVID-19: lymphocytes are a direct target of viruses because they express the coronavirus receptor ACE2, lymphatic organs are destroyed by SARS-CoV-2, lymphocyte deficiency is induced by pro-inflammatory cytokines, and lymphocyte inhibition results from metabolic disorders [31]. A study showed that the antiviral protein interferon-inducible transmembrane protein 3 (IFITM3) is low in immune cells (including lymphocytes), indicating that SARS-CoV-2 may attack lymphocytes and induce cytokine release syndrome [32].
In terms of radiologic features, the pulmonary opacity score was identified as a predictor of severe COVID-19 in this study. A deep learning-based model also demonstrated that CT imaging can accurately predict the severity of COVID-19 [14]. The mechanism of COVID-19-induced organ damage may be related to ACE2. ACE2 is widely expressed in the lungs (particularly in type 2 pneumocytes and macrophages) [24]. SARS-CoV-2 enters its host cell through the receptor ACE2 and causes diseases [33]. In the lungs, after viral invasion via ACE2, the dysregulation resulting from ACE2 deficiency promotes inflammation and thrombosis triggered by local angiotensin II hyperactivity, leading to cell death and lung damage [24]. In patients infected with SARS-CoV-2, angiotensin II levels were positively linearly correlated with viral load and lung injury [34]. A mouse model demonstrated that severe acute respiratory syndrome coronavirus (SARS-CoV) replicated more efficiently and that pulmonary lesions were more severe in the lungs of transgenic mice with the human gene for ACE2 than in those of wild-type mice [35]. Another mouse model showed that pathologic alterations in the lungs were reduced in ACE2 knockout mice with SARS-CoV compared to wild-type mice with SARS-CoV [36]. Several possible treatment options related to ACE2 have been proposed [[37], [38], [39]]. On the other hand, the expression of the antiviral protein IFITM3 in the lung is much lower than that in other tissues, which may be associated with severe lung symptoms in COVID-19 [32].
The current nomogram was built based on a relatively large, representative dataset from 24 centers, was externally and independently validated and had good prediction accuracy. Although most of the baseline characteristics were significantly different between the derivation and validation cohorts, the nomogram had decent generalizability for the data obtained outside of Jiangsu Province where the nomogram was established. All patients in this study were discharged from the hospital at the end of the study, so the severity data did not change and were correct. In addition, collinearity analysis was conducted to select variables to avoid having too many candidate variables for the multivariate logistic regression analysis.
This study has several limitations. First, the model needs to be verified by larger studies and international studies. Second, the derivation cohort, on which the nomogram was based, was composed only of those from Jiangsu Province who had CT information available. Nevertheless, this nomogram performed well in predicting severe COVID-19 in both the derivation and validation cohorts. Third, due to the nature of retrospective research, other potential factors (such as lactate dehydrogenase and erythrocyte sedimentation rate) were unavailable for analysis. Fourth, the pulmonary opacity score was visually estimated and hence was a subjective measurement. However, the scores were estimated by two radiologists with rich experience in pulmonary imaging, and agreement was reached through consultation if discrepancies in pulmonary opacity score occurred, which may have reduced the measurement bias. Finally, the study used CCI ≥1 as a measurement of comorbidities, rather than information on specific comorbidities, and thus some information may be lost.
5. Conclusion
We established a nomogram with age, lymphocyte count, and pulmonary opacity score for predicting severe COVID-19 during a 14-day hospitalization. When externally verified, the nomogram performed well in discrimination ability and calibration, but it still needs to be verified by larger studies and international studies. The nomogram enables clinicians to accurately estimate the probability of developing severe COVID-19 and conduct beneficial preventive management for individual patients.
Authors' contributions
All authors have read and agreed to the published version of the manuscript.
Data availability
The data used to support the findings of this study are available from the corresponding author upon request.
Funding statement
This work was supported, in part, by the National Major Scientific and Technological Special Project for significant new drug development (2020ZX09201015), the National Natural Science Foundation of China (81971885, 81971888) and the Scientific Research Project of Jiangsu Health Committee (H2018048, BE2018743).
Institutional review board statement
The study was conducted according to the guidelines of the Declaration of Helsinki and approved by the Ethics Committee of Zhongda Hospital, Affiliated with Southeast University (2020ZDSYLL013–P01 and 2020ZDSYLL019–P01).
Informed consent statement
Patient informed consent was waived due to the retrospective study design.
Disclosures
The funder had no role in the study design, data collection and analysis, decision to publish, or preparation of the manuscript.
Declaration of Competing Interest
None.
Appendix A. Supplementary data
The following is the supplementary data related to this article.
Results of the collinearity analysis. Abbreviations: CCI, Charlson comorbidity index; WBC, white blood cell.
References
- 1.Shrestha N., Shad M.Y., Ulvi O., et al. The impact of COVID-19 on globalization [published online ahead of print, 2020 Oct 13] One Health. 2020:100180. doi: 10.1016/j.onehlt.2020.100180. [DOI] [PMC free article] [PubMed] [Google Scholar]
- 2.Mokhtari T., Hassani F., Ghaffari N., Ebrahimi B., Yarahmadi A., Hassanzadeh G. COVID-19 and multiorgan failure: a narrative review on potential mechanisms. J Mol Histol. 2020;51:613–628. doi: 10.1007/s10735-020-09915-3. [DOI] [PMC free article] [PubMed] [Google Scholar]
- 3.Rees E.M., Nightingale E.S., Jafari Y., et al. COVID-19 length of hospital stay: a systematic review and data synthesis. BMC Med. 2020;18:270. doi: 10.1186/s12916-020-01726-3. [DOI] [PMC free article] [PubMed] [Google Scholar]
- 4.Huang G., Kovalic A.J., Graber C.J. Prognostic value of leukocytosis and lymphopenia for coronavirus disease severity. Emerg Infect Dis. 2020;26:1839–1841. doi: 10.3201/eid2608.201160. [DOI] [PMC free article] [PubMed] [Google Scholar]
- 5.Liu S., Luo H., Wang Y., et al. Clinical characteristics and risk factors of patients with severe COVID-19 in Jiangsu province, China: a retrospective multicentre cohort study. BMC Infect Dis. 2020;20:584. doi: 10.1186/s12879-020-05314-x. [DOI] [PMC free article] [PubMed] [Google Scholar]
- 6.Huang J., Zhu L., Bai X., et al. Multidimensional analysis of risk factors for the severity and mortality of patients with COVID-19 and diabetes [published online ahead of print, 2020 Oct 28] Infect Dis Ther. 2020:1–22. doi: 10.1007/s40121-020-00359-6. [DOI] [PMC free article] [PubMed] [Google Scholar]
- 7.Ramadan H.K., Mahmoud M.A., Aburahma M.Z., et al. Predictors of severity and co-infection resistance profile in COVID-19 patients: first report from upper Egypt. Infect Drug Resist. 2020;13:3409–3422. doi: 10.2147/IDR.S272605. [DOI] [PMC free article] [PubMed] [Google Scholar]
- 8.Li K., Wu J., Wu F., et al. The clinical and chest CT features associated with severe and critical COVID-19 pneumonia. Invest Radiol. 2020;55:327–331. doi: 10.1097/RLI.0000000000000672. [DOI] [PMC free article] [PubMed] [Google Scholar]
- 9.Ok F., Erdogan O., Durmus E., Carkci S., Canik A. Predictive values of blood urea nitrogen/creatinine ratio and other routine blood parameters on disease severity and survival of COVID-19 patients [published online ahead of print, 2020 Jul 14] J Med Virol. 2020 doi: 10.1002/jmv.26300. [DOI] [PMC free article] [PubMed] [Google Scholar]
- 10.Collins G.S., Wilkinson J. Statistical issues in the development of COVID-19 prediction models [published online ahead of print, 2020 Aug 4] J Med Virol. 2020 doi: 10.1002/jmv.26390. [DOI] [PMC free article] [PubMed] [Google Scholar]
- 11.Wynants L., Van Calster B., Collins G.S., et al. Prediction models for diagnosis and prognosis of covid-19 infection: systematic review and critical appraisal [published correction appears in BMJ. 2020 Jun 3;369:m2204] BMJ. 2020;369 doi: 10.1136/bmj.m1328. [DOI] [PMC free article] [PubMed] [Google Scholar]
- 12.Sun L., Song F., Shi N., et al. Combination of four clinical indicators predicts the severe/critical symptom of patients infected COVID-19. J Clin Virol. 2020;128:104431. doi: 10.1016/j.jcv.2020.104431. [DOI] [PMC free article] [PubMed] [Google Scholar]
- 13.Wu G., Yang P., Xie Y., et al. Development of a clinical decision support system for severity risk prediction and triage of COVID-19 patients at hospital admission: an international multicentre study. Eur Respir J. 2020;56:2001104. doi: 10.1183/13993003.01104-2020. [DOI] [PMC free article] [PubMed] [Google Scholar]
- 14.Xiao L.S., Li P., Sun F., et al. Development and validation of a deep learning-based model using computed tomography imaging for predicting disease severity of coronavirus disease 2019. Front Bioeng Biotechnol. 2020;8:898. doi: 10.3389/fbioe.2020.00898. [DOI] [PMC free article] [PubMed] [Google Scholar]
- 15.Xiao L.S., Zhang W.F., Gong M.C., et al. Development and validation of the HNC-LL score for predicting the severity of coronavirus disease 2019. EBioMedicine. 2020;57:102880. doi: 10.1016/j.ebiom.2020.102880. [DOI] [PMC free article] [PubMed] [Google Scholar]
- 16.Zhang C., Qin L., Li K., et al. A novel scoring system for prediction of disease severity in COVID-19. Front Cell Infect Microbiol. 2020;10:318. doi: 10.3389/fcimb.2020.00318. [DOI] [PMC free article] [PubMed] [Google Scholar]
- 17.Zhou C., Huang Z., Tan W., et al. Predictive factors of severe coronavirus disease 2019 in previously healthy young adults: a single-center, retrospective study. Respir Res. 2020;21:157. doi: 10.1186/s12931-020-01412-1. [DOI] [PMC free article] [PubMed] [Google Scholar]
- 18.Zhou Y., He Y., Yang H., et al. Development and validation a nomogram for predicting the risk of severe COVID-19: a multi-center study in Sichuan, China. PLoS One. 2020;15 doi: 10.1371/journal.pone.0233328. [DOI] [PMC free article] [PubMed] [Google Scholar]
- 19.Shariat S.F., Capitanio U., Jeldres C., Karakiewicz P.I. Can nomograms be superior to other prediction tools? BJU Int. 2009;103:492–497. doi: 10.1111/j.1464-410X.2008.08073.x. [DOI] [PubMed] [Google Scholar]
- 20.National Health Commission & National Administration of Traditional Chinese Medicine Diagnosis and treatment protocol for novel coronavirus pneumonia (trial version 7) Chin. Med. J. 2020;1:133. doi: 10.1097/CM9.0000000000000819. [DOI] [PMC free article] [PubMed] [Google Scholar]
- 21.Charlson M.E., Pompei P., Ales K.L., MacKenzie C.R. A new method of classifying prognostic comorbidity in longitudinal studies: development and validation. J Chronic Dis. 1987;40:373–383. doi: 10.1016/0021-9681(87)90171-8. [DOI] [PubMed] [Google Scholar]
- 22.Hariyanto T.I., Japar K.V., Kwenandar F., et al. Inflammatory and hematologic markers as predictors of severe outcomes in COVID-19 infection: a systematic review and meta-analysis. Am J Emerg Med. 2021;41:110–119. doi: 10.1016/j.ajem.2020.12.076. [DOI] [PMC free article] [PubMed] [Google Scholar]
- 23.Gong J., Ou J., Qiu X., et al. A tool for early prediction of severe coronavirus disease 2019 (COVID-19): a multicenter study using the risk nomogram in Wuhan and Guangdong, China. Clin Infect Dis. 2020;71:833–840. doi: 10.1093/cid/ciaa443. [DOI] [PMC free article] [PubMed] [Google Scholar]
- 24.Verdecchia P., Cavallini C., Spanevello A., Angeli F. The pivotal link between ACE2 deficiency and SARS-CoV-2 infection. Eur J Intern Med. 2020;76:14–20. doi: 10.1016/j.ejim.2020.04.037. [DOI] [PMC free article] [PubMed] [Google Scholar]
- 25.Luo H., Liu S., Wang Y., et al. Age differences in clinical features and outcomes in patients with COVID-19, Jiangsu, China: a retrospective, multicentre cohort study. BMJ Open. 2020;10 doi: 10.1136/bmjopen-2020-039887. [DOI] [PMC free article] [PubMed] [Google Scholar]
- 26.Hariyanto T.I., Putri C., Situmeang R.F.V., et al. Dementia is a predictor for mortality outcome from coronavirus disease 2019 (COVID-19) infection. Eur Arch Psychiatry Clin Neurosci. 2021;271:393–395. doi: 10.1007/s00406-020-01205-z. [DOI] [PMC free article] [PubMed] [Google Scholar]
- 27.Putri C., Hariyanto T.I., Hananto J.E., et al. Parkinson’s disease may worsen outcomes from coronavirus disease 2019 (COVID-19) pneumonia in hospitalized patients: a systematic review, meta-analysis, and meta-regression. Parkinsonism Relat Disord. 2021;87:155–161. doi: 10.1016/j.parkreldis.2021.04.019. [DOI] [PMC free article] [PubMed] [Google Scholar]
- 28.Chen T., Wu D., Chen H., et al. Clinical characteristics of 113 deceased patients with coronavirus disease 2019: retrospective study [published correction appears in BMJ. 2020 Mar 31;368:m1295] BMJ. 2020;368 doi: 10.1136/bmj.m1091. [DOI] [PMC free article] [PubMed] [Google Scholar]
- 29.Linton N.M., Kobayashi T., Yang Y., et al. Incubation period and other epidemiological characteristics of 2019 novel coronavirus infections with right truncation: a statistical analysis of publicly available case data. J Clin Med. 2020;9:538. doi: 10.3390/jcm9020538. [DOI] [PMC free article] [PubMed] [Google Scholar]
- 30.Dong Y., Zhou H., Li M., et al. A novel simple scoring model for predicting severity of patients with SARS-CoV-2 infection [published online ahead of print, 2020 May 29] Transbound Emerg Dis. 2020 doi: 10.1111/tbed.13651. [DOI] [PMC free article] [PubMed] [Google Scholar]
- 31.Tan L., Wang Q., Zhang D., et al. Lymphopenia predicts disease severity of COVID-19: a descriptive and predictive study. Signal Transduct Target Ther. 2020;5:33. doi: 10.1038/s41392-020-0148-4. [DOI] [PMC free article] [PubMed] [Google Scholar]
- 32.Dai Y.J., Zhang W.N., Wang W.D., He S.Y., Liang C.C., Wang D.W. Comprehensive analysis of two potential novel SARS-CoV-2 entries, TMPRSS2 and IFITM3, in healthy individuals and cancer patients. Int J Biol Sci. 2020;16:3028–3036. doi: 10.7150/ijbs.51234. [DOI] [PMC free article] [PubMed] [Google Scholar]
- 33.Hoffmann M., Kleine-Weber H., Schroeder S., et al. SARS-CoV-2 cell entry depends on ACE2 and TMPRSS2 and is blocked by a clinically proven protease inhibitor. Cell. 2020;181:271–280. doi: 10.1016/j.cell.2020.02.052. (e8) [DOI] [PMC free article] [PubMed] [Google Scholar]
- 34.Liu Y., Yang Y., Zhang C., et al. Clinical and biochemical indexes from 2019-nCoV infected patients linked to viral loads and lung injury. Sci China Life Sci. 2020;63:364–374. doi: 10.1007/s11427-020-1643-8. [DOI] [PMC free article] [PubMed] [Google Scholar]
- 35.Yang X.H., Deng W., Tong Z., et al. Mice transgenic for human angiotensin-converting enzyme 2 provide a model for SARS coronavirus infection. Comp Med. 2007;57:450–459. [PubMed] [Google Scholar]
- 36.Kuba K., Imai Y., Rao S., et al. A crucial role of angiotensin converting enzyme 2 (ACE2) in SARS coronavirus-induced lung injury. Nat Med. 2005;11:875–879. doi: 10.1038/nm1267. [DOI] [PMC free article] [PubMed] [Google Scholar]
- 37.Offringa A., Montijn R., Singh S., Paul M., Pinto Y.M., Pinto-Sietsma S.J. The mechanistic overview of SARS-CoV-2 using angiotensin-converting enzyme 2 to enter the cell for replication: possible treatment options related to the renin-angiotensin system. Eur Heart J Cardiovasc Pharmacother. 2020;6:317–325. doi: 10.1093/ehjcvp/pvaa053. [DOI] [PMC free article] [PubMed] [Google Scholar]
- 38.Zhang H., Penninger J.M., Li Y., Zhong N., Slutsky A.S. Angiotensin-converting enzyme 2 (ACE2) as a SARS-CoV-2 receptor: molecular mechanisms and potential therapeutic target. Intensive Care Med. 2020;46:586–590. doi: 10.1007/s00134-020-05985-9. [DOI] [PMC free article] [PubMed] [Google Scholar]
- 39.Pang X., Cui Y., Zhu Y. Recombinant human ACE2: potential therapeutics of SARS-CoV-2 infection and its complication. Acta Pharmacol Sin. 2020;41:1255–1257. doi: 10.1038/s41401-020-0430-6. [DOI] [PMC free article] [PubMed] [Google Scholar]
Associated Data
This section collects any data citations, data availability statements, or supplementary materials included in this article.
Supplementary Materials
Results of the collinearity analysis. Abbreviations: CCI, Charlson comorbidity index; WBC, white blood cell.
Data Availability Statement
The data used to support the findings of this study are available from the corresponding author upon request.