

Dear Editor,
Currently, breast cancer (BC) diagnosis relies on mammography guided by Breast Imaging Reporting and Data System (BI‐RADS) and biopsy when necessary. 1 Effective blood‐based biomarkers for diagnosing BC remain insufficiently unveiled. Semaphorin4C (SEMA4C) was highly expressed in BC‐associated lymphatic endothelial cells, and soluble SEMA4C could be obtained when membrane‐bound SEMA4C was cleaved by matrix metalloproteinases. 2 The biological significance of SEMA4C/PlexinB2 signaling in BC has been highlighted by Gurrapu et al, revealing that SEMA4C is overexpressed in BC cells, and SEMA4C/PlexinB2 signaling is essential for the growth of BC cells. 3 Herein, we assessed serum SEMA4C as a diagnostic biomarker for BC, compared it with mammography and ultrasound, and explored the combined diagnosis of the biomarker and imaging.
We included consecutive adult women inpatients with pathologic diagnosis for breast lesions (n = 1833) between January 2015 and September 2019 at Tongji Hospital, Hubei Cancer Hospital, and Qilu Hospital. Patients with hepatic or renal diseases were excluded because dysfunction of the two organs could affect the clearance and excretion of serum proteins. 4 , 5 Detailed eligibilities are available in Supporting Information. Pathologic diagnosis, the reference standard, was performed in local centers and confirmed by the consensus of two pathologists in Tongji Hospital. Clinical data were retrospectively extracted from electronic health records by two researchers and assessed by the third investigator.
Procedures for serum SEMA4C measurements using enzyme‐linked immunosorbent assay are elaborated in Supporting Information. Serum samples were sent to Tongji Hospital for measurements, which were conducted by two researchers independently without knowledge of pathologic diagnosis and imaging assessments, and the average value was used for analysis. Machines utilized to record images and image interpretations are detailed in Supporting Information. Images were recorded by trained examiners in contributing hospitals in accordance with Mammography Quality Standards Act. 6 Images were independently interpreted in Tongji Hospital by two radiologists with over 5 years of experience following BI‐RADS with a third radiologist as an adjudicator, 7 being blinded to serum SEMA4C levels and pathologic diagnosis. BI‐RADS 2 and 3 breast lesions were regarded as image‐recognized benign diseases and category 4 and 5 ones as malignant. 8
Receiver operating characteristic curve was plotted to determine the area under the curve (AUC), sensitivity, and specificity. Sensitivity, specificity, and AUC were calculated with a 95% confidence interval. The optimum cut‐off value was identified using a method depicted in other literature. 9 Statistical analyses were performed by utilizing SPSS v23.0 (IBM Corp, NY, USA) and R v3.4.1 (www.r‐project.org), and detailed in Supporting Information. p values < 0.05 were regarded statistically significant.
The study design is shown in Figure 1. We included 1624 inpatients (malignant, n = 1027; benign, n = 597), and their baseline characteristics are available in Table 1. Serum SEMA4C concentration in BC (7.31 standard deviation [SD]±2.75 ng/ml) was significantly higher than that in benign breast tumors (3.54 [SD]±1.64 ng/ml). The determined optimal threshold of the biomarker for diagnosis was 5.00 ng/ml. Serum SEMA4C exhibited a higher AUC of 0.927 (95% CI 0.907–0.946) with enhanced specificity (84.8% [78.8%–89.3%]) and compromised sensitivity (83.9% [80.7%–86.7%]) to diagnose BC than mammography, which displayed an AUC of 0.788 (0.754–0.823), a specificity of 61.3% (54.5%–68.1%), and a sensitivity of 96.4% (94.9%–97.8%) (Figure 2A and Table 2). Compared with breast ultrasound, serum SEMA4C demonstrated a significantly greater AUC to identify BC (0.907 [0.891–0.922] versus 0.804 [0.783–0.825], p < 0.05, Figure 2B). While serum SEMA4C yielded a sensitivity of 81.8% (78.9%–84.3%) and a specificity of 83.1% (79.7%–86.0%), ultrasound demonstrated a sensitivity of 87.8% (85.6%–90.1%) and a specificity of 73.0% (69.4%–76.6%) to detect BC.
FIGURE 1.
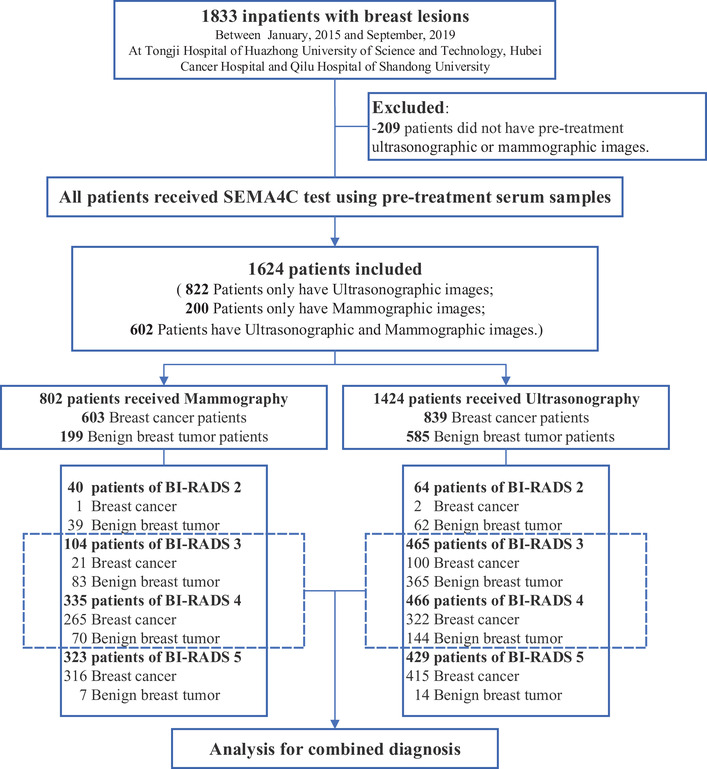
Patient enrollment flow chart. Abbreviation: BI‐RADS, breast imaging reporting and data system
TABLE 1.
Baseline characteristics
| Characteristics | Overall (n = 1624) | Patient with mammography (n = 802) | Patient with ultrasonography (n = 1424) |
|---|---|---|---|
| Median age, years | 47.0 (40.0, 54.0) | 48.0 (42.0, 56.0) | 47.0 (40.0, 53.0) |
| Age, years | |||
| <35 | 200 (12.31) | 45 (5.61) | 191 (13.41) |
| 35–49 | 776 (47.78) | 384 (47.88) | 687 (48.24) |
| 50–70 | 599 (36.88) | 339 (42.27) | 507 (35.60) |
| >70 | 39 (2.40) | 28 (3.49) | 32 (2.25) |
| Missing, n | 10 (0.62) | 6 (0.75) | 7 (0.49) |
| Diagnosis | |||
| Breast cancer | 1027 (63.24) | 603 (75.19) | 839 (58.92) |
| Non‐cancer | 597 (36.76) | 199 (24.81) | 585 (41.08) |
|
Breast cancer Histological types |
|||
| Ductal carcinoma in situ (DCIS) | 68 (6.62) | 33 (5.47) | 58 (6.91) |
| Invasive ductal carcinoma (IDC) | 918 (89.39) | 552 (91.54) | 742 (88.44) |
| Invasive lobular carcinoma (ILC) | 13 (1.27) | 5 (0.83) | 13 (1.55) |
| Missing, n | 28 (2.73) | 13 (2.16) | 26 (3.10) |
| Tumor Size, cm | |||
| <2 | 480 (46.74) | 229 (37.98) | 389 (46.36) |
| ≥2, ≤5 | 421 (40.99) | 274 (45.44) | 338 (40.29) |
| <5 | 49 (4.77) | 23 (3.81) | 43 (5.13) |
| Missing, n | 77 (7.50) | 77 (12.77) | 69 (8.22) |
| Regional lymph node | |||
| Negative | 751 (73.13) | 443 (73.47) | 587 (69.96) |
| Positive | 276 (26.87) | 160 (26.53) | 252 (30.04) |
| Metastasis | |||
| Negative | 1023 (99.61) | 602 (99.83) | 835 (99.52) |
| Positive | 4 (0.39) | 1 (0.17) | 4 (0.48) |
| Clinical pathological subtype | |||
| HER2–/HR+ | 420 (40.90) | 251 (41.63) | 417 (49.70) |
| HER2+/HR+ | 318 (30.96) | 181 (30.02) | 191 (22.77) |
| HER2+/HR– | 143 (13.92) | 87 (14.43) | 116 (13.83) |
| TNBC | 88 (8.57) | 55 (9.12) | 68 (8.10) |
| Missing, n | 58 (5.65) | 29 (4.81) | 47 (5.60) |
Continuous variables were presented as mean and interquartile range, and categorical data were summarized as absolute frequencies and percentages.
Abbreviations: DCIS, ductal carcinoma in situ; HER2, human epidermal growth factor receptor 2; HR, hormonal receptor; HR+, estrogen receptor and(or) progesterone receptor positive; HR‐, estrogen receptor and progesterone receptor negative; IDC, invasive ductal carcinoma; ILC, invasive lobular carcinoma; TNBC, triple negative breast cancer.
FIGURE 2.
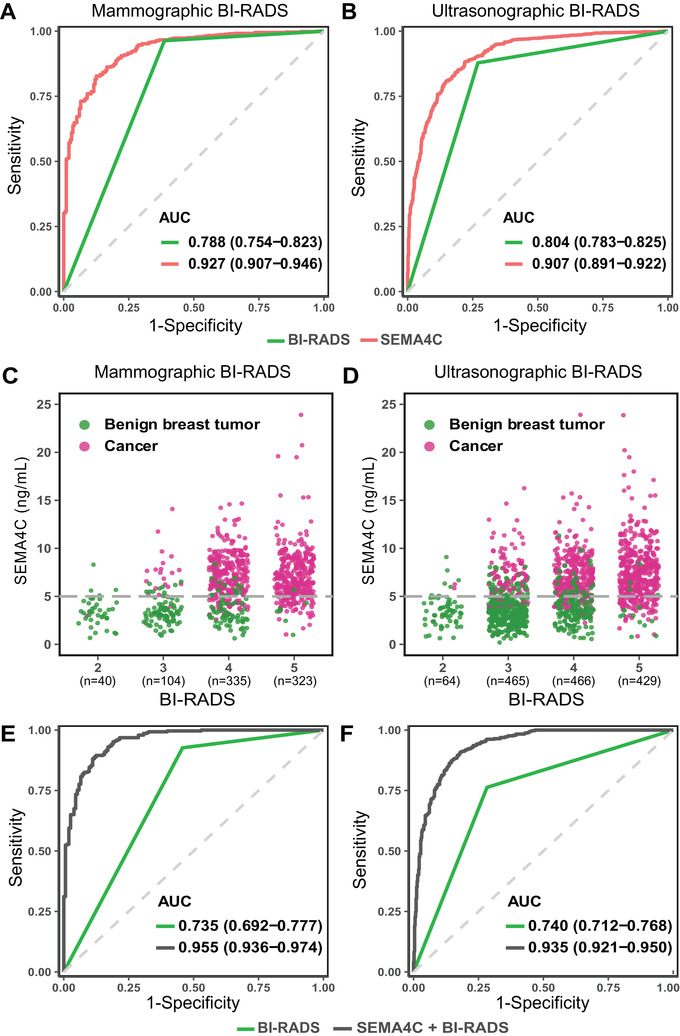
Serum SEMA4C versus imaging, serum SEMA4C in BI‐RADS 2–5 breast lesions, and combined diagnosis versus imaging in category 3 and 4 ones. (A) ROC curves for serum SEMA4C and mammography in inpatients with mammography (n = 802). (B) ROC curves for serum SEMA4C and ultrasound in inpatients with ultrasonography (n = 1424). For A and B, red curve is the ROC curve for serum SEMA4C, and green curve is the ROC curve for imaging. (C) The scatter plots of serum SEMA4C levels in mammographic BI‐RADS 2–5 breast lesions (Total, n = 802; category 2, n = 40; category 3, n = 104; category 4, n = 335; category 5, n = 323). (D) The scatter plots of serum SEMA4C levels in ultrasonographic BI‐RADS 2–5 breast lesions (Total, n = 1424; category 2, n = 64; category 3, n = 465; category 4, n = 466; category 5, n = 429). For C and D, the dotted grey horizontal line is the optimal threshold. Red dots represent breast cancer, and green dots represent benign breast tumors. (E) ROC curves for the combined diagnosis of serum SEMA4C and mammography in mammographic BI‐RADS 3/4 breast lesions (Total, n = 439; category 3, n = 104; category 4, n = 335). (F) ROC curves for combined diagnosis of serum SEMA4C and ultrasound in ultrasonographic BI‐RADS 3/4 breast lesions (Total, n = 931; category 3, n = 465; category 4, n = 466). For E and F, black curve is the ROC curve for combined diagnosis, and green curve is the ROC curve for imaging. Abbreviations: BI‐RADS, breast imaging reporting and data system; ROC, receiver operating characteristic; SEMA4C, semaphorin4C
TABLE 2.
Imaging versus SEMA4C and combined diagnosis versus imaging in BI‐RADS 3/4 breast lesions
| Benign tumor vs. cancer | AUC (95% CI) | SN (95% CI), % | SP (95% CI), % | PPV (95% CI), % | NPV (95% CI), % | |
|---|---|---|---|---|---|---|
| All patients with mammography | ||||||
| Mammography | 199 vs. 603 | 0.788 (0.754–0.823) | 96.4 (94.9–97.8) | 61.3 (54.5–68.1) | 88.3 (85.8–90.8) | 84.7 (78.8–90.6) |
| SEMA4C | 199 vs. 603 | 0.927 (0.907–0.946) | 83.9 (80.7–86.7) | 84.8 (78.8–89.3) | 94.4 (92.0–96.1) | 63.3 (57.1–69.0) |
| All patients with ultrasonography | ||||||
| Ultrasonography | 585 vs. 839 | 0.804 (0.783–0.825) | 87.8 (85.6–90.1) | 73.0 (69.4–76.6) | 82.3 (79.8–84.8) | 80.7 (77.4–84.1) |
| SEMA4C | 585 vs. 839 | 0.907 (0.891–0.922) | 81.8 (78.9–84.3) | 83.1 (79.7–86.0) | 87.4 (84.8–89.6) | 76.2 (72.5–79.3) |
| Patients with mammographic BI‐RADS 3/4 | ||||||
| Mammography | 153 vs. 286 | 0.735 (0.692–0.777) | 92.7 (89.6–95.7) | 54.2 (46.4–62.1) | 79.1 (74.8–83.5) | 79.8 (72.1–87.5) |
| SEMA4C | 153 vs. 286 | 0.937 (0.916–0.959) | 86.4 (82.4–90.3) | 83.7 (77.8–89.5) | 90.8 (87.4–94.2) | 76.6 (70.2–83.1) |
| Combined diagnosis | 153 vs. 286 | 0.955 (0.936–0.974) | 89.5 (86.0–93.1) | 87.6 (82.4–92.8) | 93.1 (90.1–96.1) | 81.7 (75.8–87.6) |
| Patients with ultrasonographic BI‐RADS 3/4 | ||||||
| Ultrasonography | 509 vs. 422 | 0.740 (0.712–0.768) | 76.3 (72.2–80.4) | 71.7 (67.8–75.6) | 69.1 (64.9–73.3) | 78.5 (74.8–82.2) |
| SEMA4C | 509 vs. 422 | 0.907 (0.889–0.926) | 82.2 (78.6–85.9) | 82.9 (79.6–86.2) | 80.0 (76.2–83.7) | 84.9 (81.8–88.1) |
| Combined diagnosis | 509 vs. 422 | 0.935 (0.921–0.950) | 90.8 (88.0–93.5) | 82.1 (78.8–85.5) | 80.8 (77.3–84.3) | 91.5 (88.9–94.0) |
Abbreviations: AUC, area under the receiver operating characteristic curve; BI‐RADS, breast imaging reporting and data system; CI, confidence interval; NPV, negative predictive value; PPV, positive predictive value; SEMA4C, semaphorin4C; SN, sensitivity; SP, specificity.
The complementary diagnostic efficacy of serum SEMA4C for imaging indicated its potential as an auxiliary biomarker for BC diagnosis. Imaging could sufficiently classify BI‐RADS 2 and 5 breast lesions, but left room for improvements in category 3 and 4 ones. 10 We thus investigated the diagnostic capabilities of serum SEMA4C in BI‐RADS 2–5 lesions (Figures 2C and 2D). For mammographic BI‐RADS 3 lesions (n = 104; cancer: n = 21), serum SEMA4C displayed an AUC of 0.967 (0.936–0.998) and a sensitivity of 95.24% (74.13%–99.75%) to diagnose BC, and resulted in only 10 false‐positives. For category 3 lesions in ultrasound (n = 465; cancer: n = 100), serum SEMA4C demonstrated an AUC of 0.940 (0.919–0.960) and a sensitivity of 88.00% (79.60%–93.37%), and the false‐positive rate was 15.34% (56/365) (Tables S1 and S2).
For mammographic category 4 lesions (n = 335; cancer: n = 265), serum SEMA4C showed an AUC of 0.922 (0.888–0.957) and a sensitivity of 85.66% (80.72%–89.53%) to detect BC, and enabled accurate classification of 78.57% (55/70) of noncancerous individuals misdiagnosed by mammography. For category 4 lesions in ultrasound (n = 466; cancer: n = 322), serum SEMA4C exhibited an AUC of 0.878 (0.842–0.914) accompanied by a sensitivity of 80.43% (75.59%–84.54%), and finely classified 78.47% (113/144) of misdiagnosed patients. Imaging could well classify BI‐RADS 2 and 5 lesions, and we did not observe the superiority of serum SEMA4C (Tables S1 and S2).
We further interrogated the united diagnosis of serum SEMA4C and imaging in category 3 and 4 lesions. The combinatorial diagnosis of serum SEMA4C and mammography displayed significantly increased AUC to diagnose BC than mammography (0.955 [0.936–0.974] versus 0.735 [0.692–0.777]; p < 0.05, Figure 2E). Moreover, the specificity augmented evidently from 54.2% (46.4%–62.1%) to 87.6% (82.4%–92.8%) with slightly impaired sensitivity (92.7% [89.6%–95.7%] versus 89.5% [86.0%–93.1%]; Table 2). Moreover, compared with ultrasound, the integrated diagnosis of ultrasound and serum SEMA4C resulted in improved AUC (0.935 [0.921–0.950] versus 0.740 [0.712–0.768]; p < 0.05, Figure 2F), sensitivity (90.8% [88.0%–93.5%] versus 76.3% [72.2%–80.4%]), and specificity (82.1% [78.8%–85.5%] versus 71.7% [67.8%–75.6%]; Table 2) to detect BC in BI‐RADS 3 or 4 lesions.
These results indicate that leveraging serum SEMA4C as an auxiliary biomarker to mammography or ultrasound in patients with BI‐RADS 3 and 4 breast lesions could potentially augment the accuracy of BC diagnosis. However, the diagnostic value of serum SEMA4C was not tested in patients with renal or hepatic diseases, in which the results should be interpreted with caution.
CONFLICT OF INTEREST
The authors have no conflict of interest to declare.
ETHICS APPROVAL AND CONSENT TO PARTICIPATE
The ethical committee of Tongji Hospital, Qilu Hospital, and Hubei Cancer Hospital approved all study procedures for human subjects (TJ‐C20140311). All participants provided written informed consent prior to inclusion in this study.
AUTHORS CONTRIBUTIONS
Wang Y and Gao Q designed the study. Wang Y, Liu J, and Li J did the experiments, analyzed and interpreted the data, and wrote the manuscript. Yang J, Qiao L, and Li X run the ELISA assay. Wang Y, Liu J, Li J, Li H, and Li X contributed equally to this work. Fang T, Li H, Chen S, Ma J, Wan J, Li X, Zhang L, Xia Y, Wu Y, Shao J, and Feng Y provided, analyzed, and interpreted patients’ samples, clinical data, or both. Ihab R. Kamel and Yang Q advised on the conception and design of the study. Gao Q and Li Z conceptualized and designed the study, supervised the project, analyzed and interpreted data, and wrote the paper. All authors vouch for the respective data and analysis, approved the final version, and agreed to submit this manuscript.
DATA AVAILABILITY STATEMENT
The data that support the findings of this study are available from the corresponding author (Gao Q) upon reasonable request.
Supporting information
SUPPORTING INFORMATION
ACKNOWLEDGMENTS
This work is supported by the National Science and Technology Major Sub‐Project (2018ZX10301402‐002), the National Natural Science Foundation of China (grant numbers: 81772787, 82072889, and 81902653), the Technical Innovation Special Project of Hubei Province (grant number: 2018ACA138), the Fundamental Research Funds for the Central Universities (grant number: 2019kfyXMBZ024), and the Wuhan Municipal Health Commission (grant number: WX18Q16).
Contributor Information
Zhen Li, Email: zhenli@hust.edu.cn.
Qinglei Gao, Email: qingleigao@hotmail.com.
REFERENCES
- 1. National Comprehensive Cancer Network . Breast cancer screening and diagnosis. 2021. https://www.nccn.org. Accessed January 7, 2021. [Google Scholar]
- 2. Wei J, Yang J, Liu D, et al. Tumor‐associated lymphatic endothelial cells promote lymphatic metastasis by highly expressing and secreting SEMA4C. Clin Cancer Res. 2017;23:214–224. [DOI] [PubMed] [Google Scholar]
- 3. Gurrapu S, Pupo E, Franzolin G, Lanzetti L, Tamagnone L. Sema4C/PlexinB2 signaling controls breast cancer cell growth, hormonal dependence and tumorigenic potential. Cell Death Differ. 2018;25:1259–1275. [DOI] [PMC free article] [PubMed] [Google Scholar]
- 4. DiBaise J, Donovan J. Markedly elevated CA125 in hepatic cirrhosis: two case illustrations and review of the literature. J Clin Gastroenterol. 1999;28:159–161. [DOI] [PubMed] [Google Scholar]
- 5. Fukasawa H, Kaneko M, Niwa H, Yasuda H, Kumagai H, Furuya R. Carbohydrate antigen 19‐9 is significantly elevated in autosomal dominant polycystic kidney disease. Nephrology (Carlton). 2018;23:210–216. [DOI] [PubMed] [Google Scholar]
- 6. Nguyen D, Oluyemi E, Myers K, Harvey S, Mullen L, Ambinder E. Impact of telephone communication on patient adherence with follow‐up recommendations after an abnormal screening mammogram. J Am Coll Radiol. 2020;17:1139–1148. [DOI] [PubMed] [Google Scholar]
- 7. Sickles EA, D'Orsi CJ, Bassett LW, et al. ACR BI‐RADS® Mammography. ACR BI‐RADS® Atlas, Breast Imaging Reporting and Data System. Reston, VA: American College of Radiology; 2013. [Google Scholar]
- 8. Hu Y, Mei J, Jiang X, et al. Does the radiologist need to rescan the breast lesion to validate the final BI‐RADS US assessment made on the static images in the diagnostic setting?. Cancer Manag Res. 2019;11:4607–4615. [DOI] [PMC free article] [PubMed] [Google Scholar]
- 9. Shen Q, Fan J, Yang XR, et al. Serum DKK1 as a protein biomarker for the diagnosis of hepatocellular carcinoma: a large‐scale, multicentre study. Lancet Oncol. 2012;13:817–826. [DOI] [PubMed] [Google Scholar]
- 10. Stavros A, Freitas A, deMello G, et al. Ultrasound positive predictive values by BI‐RADS categories 3–5 for solid masses: an independent reader study. Eur Radiol. 2017;27:4307–4315. [DOI] [PubMed] [Google Scholar]
Associated Data
This section collects any data citations, data availability statements, or supplementary materials included in this article.
Supplementary Materials
SUPPORTING INFORMATION
Data Availability Statement
The data that support the findings of this study are available from the corresponding author (Gao Q) upon reasonable request.