

Abstract
Pancreatic β-cells secrete insulin, which controls blood glucose levels, and defects in insulin secretion are responsible for diabetes mellitus. The actin cytoskeleton and some myosins support insulin granule trafficking and release, although a role for the class I myosin Myo1b, an actin- and membrane-associated load-sensitive motor, in insulin biology is unknown. We found by immunohistochemistry that Myo1b is expressed in islet cells of the rat pancreas. In cultured rat insulinoma 832/13 cells, Myo1b localized near actin patches, the trans-Golgi network (TGN) marker TGN38, and insulin granules in the perinuclear region. Myo1b depletion by small interfering RNA in 832/13 cells reduced intracellular proinsulin and insulin content and glucose-stimulated insulin secretion (GSIS) and led to the accumulation of (pro)insulin secretory granules (SGs) at the TGN. Using an in situ fluorescent pulse-chase strategy to track nascent proinsulin, Myo1b depletion in insulinoma cells reduced the number of (pro)insulin-containing SGs budding from the TGN. The studies indicate for the first time that in pancreatic β-cells Myo1b controls GSIS at least in part by mediating an early stage in insulin granule trafficking from the TGN.
INTRODUCTION
Hormone biogenesis in endocrine cells involves multiple processes from protein translation and modification in the rough endoplasmic reticulum (ER) to budding of vesicles from the trans-Golgi network (TGN) and maturation into dense-core vesicles (Kim et al., 2006). Insulin is translated in the cytosol as preproinsulin and translocated to the lumen of the ER where the N-terminal signal peptide is subsequently removed, producing proinsulin (Davidson, 2004). After moving through the Golgi, proinsulin is packaged into immature insulin granules that exit the TGN and is then cleaved during granule maturation to form insulin and C-peptide. Mature secretory granules (SGs) containing insulin and C-peptide are secreted through the regulated secretory pathway in response to glucose stimulation. Defects in the biogenesis of insulin granules in pancreatic β-cells lead to a reduction in insulin secretion into the blood, a major cause of type II diabetes mellitus (DeFronzo et al., 2015).
Insulin trafficking is mediated by the actin cytoskeleton, and some members of the large myosin superfamily of actin-associated molecular motors have been shown to be involved in insulin trafficking (Ivarsson et al., 2005; Kasai et al., 2005; Varadi et al., 2005; Desnos et al., 2007; Arous et al., 2013; Arous and Halban, 2015). Glucose stimulation induces reorganization of the subcortical actin network and mobilization of insulin granules to the plasma membrane (Wang and Thurmond, 2009). Disruption of the actin cytoskeleton in cultured β-cells and pancreatic islets by treatment with the actin toxins latrunculin or cytochalasin enhances glucose-stimulated insulin secretion (GSIS) (Thurmond et al., 2003; Tomas et al., 2006; Jewell et al., 2008; Kalwat and Thurmond, 2013). Myosin-IIA coordinates actin reorganization and insulin SG shuttling to the plasma membrane (Arous et al., 2013); myosin-Va supports SG transport through the cortical actin in response to glucose stimulation (Ivarsson et al., 2005; Varadi et al., 2005) and docking to the plasma membrane, which is mediated by SNAREs (Desnos et al., 2007); and myosin-VIIa complexes with exophilin-8 through RIM-BP2 and may be involved in both anchoring insulin granules to the actin cytoskeleton and assembling proteins necessary for exocytosis (Fan et al., 2017). Whether class I myosins, small, single-headed, nonfilamentous actin- and membrane-associated motor proteins (Coluccio, 2008, 2018) mediate insulin secretion is unknown.
Myo1b is one of eight different subclasses of myosins-I (Myo1a–Myo1h) that are expressed in humans (Coluccio, 2008, 2018). Myo1b, which is widely expressed (Ruppert et al., 1993, 1995), binds the phospholipids phosphatidylinositol 4,5-bisphosphate and phosphatidylinositol 3,4,5-trisphosphate specifically and with high affinity through a putative pleckstrin homology domain in the C-terminal tail domain (Komaba and Coluccio, 2010). Biophysical analyses revealed that the rate of detachment of Myo1b from actin filaments is significantly reduced under load, suggesting that Myo1b can control the tension between the actin cytoskeleton and the membrane (Laakso et al., 2008). Consistent with these results, cortical tension increases in cells overexpressing Myo1b (Nambiar et al., 2009). Recently, Myo1b was shown to enhance axon formation to control the actin cytoskeleton in actin waves and in growth cones in neuronal cells (Iuliano et al., 2018).
In HeLa cells, reduced Myo1b expression redistributes mannose 6-phosphate receptor (MPR) so that almost all of it localizes in the TGN region, suggesting a role for Myo1b in MPR trafficking in the lysosomal pathway (Almeida et al., 2011). The exit of MPR from the TGN depends on the formation of dynamic actin-associated tubular membrane structures that elongate and break into post-Golgi carriers (Waguri et al., 2003). Myo1b depletion reduces the number of F-actin foci at the TGN and inhibits MPR cycling between the TGN and endosomes (Almeida et al., 2011). Presumably, Myo1b tethers F-actin foci to TGN membranes. In addition, Myo1b can extract membrane tubules along F-actin bundles in vitro, additional evidence that Myo1b could mediate membrane tubule formation and elongation from the TGN (Yamada et al., 2014). Myo1b’s ability to extract membrane tubules may depend on its force-sensing property, which allows it to stay bound to actin under load (Coluccio and Geeves, 1999; Laakso et al., 2008).
Myo1b is also found on immature SGs of endocrine cells, and Myo1b depletion in PC12 cells and a model system consisting of COS7 cells expressing chromogranin A (COS7-CgA cells) leads to an increase in the number of granules that are positive for both CgA, which undergoes regulated secretion in response to barium, and collagen III, a marker of the constitutive pathway, and an increase in the basal secretion of CgA (Delestre-Delacour et al., 2017). F-actin is required for the biogenesis of SGs, and although the mechanism is not yet known, Myo1b evidently cooperates with the Arp2/3 complex to recruit actin filaments to the Golgi region, where Myo1b may participate in the membrane remodeling that accompanies the biogenesis of neurosecretory granules (Delestre-Delacour et al., 2017).
Whether Myo1b is a general modulator of regulated secretion is unknown. If so, then we predict that Myo1b participates in insulin secretion as 99% of proinsulin is sorted in pancreatic β-cells to the regulated pathway (Rhodes and Halban, 1987). The hypothesis that Myo1b modulates insulin secretion is addressed here.
RESULTS
Myo1b was expressed in pancreatic β-cells and cultured insulinoma 832/13 cells
In paraffin-embedded sections of rat pancreas stained and viewed by confocal microscopy, Myo1b was found in β-cells of islets identified with anti-insulin antibody (Figure 1, top panel). Myo1b was also found at a lower level at the cell periphery of the surrounding cells. Control sections treated with rabbit immunoglobulin G (IgG) and anti-rabbit IgG–Alexa Fluor 594 showed no specific signal (Figure 1, bottom panel). Furthermore, in cultured 832/13 cells, Myo1b localized with the actin cytoskeleton at the cell periphery and in membrane protrusions as well as in puncta throughout the cytoplasm (Figure 2).
FIGURE 1:

Myo1b expression in the pancreas. Paraffin sections of pancreases from three different rats were immunostained with anti-insulin antibody (green) and anti-Myo1b antibody (red), counterstained with DAPI (blue) to identify nuclei, and then examined by confocal microscopy. Representative image of rat pancreas showing that Myo1b is expressed in insulin-containing β-cells (top panel). Control images, which were treated with anti-insulin antibody, normal rabbit IgG, and DAPI (bottom panel), showed no Myo1b signal in the absence of Myo1b antibody. Scale bar, 50 µm.
FIGURE 2:

Myo1b expression in 832/13 cells. 832/13 cells were labeled with anti-Myo1b antibody (green), Alexa Fluor 594–phalloidin (red), and DAPI (blue). Myo1b localized at cell–cell contacts, in membrane projections, and in association with cytoplasmic puncta tentatively identified as organelles and vesicles. Actin filaments were observed at the cell cortex, in surface projections, and in puncta in the perinuclear region of 832/13 cells. In the merged confocal image (Merge), Myo1b and actin (yellow) were in close proximity at the plasma membrane. Scale bar, 10 µm.
Myo1b depletion by siRNA
To investigate Myo1b function in β-cells, we used small interfering RNA (siRNA) to reduce Myo1b expression in 832/13 cells. At 5 nM, siRNA1 and siRNA2 reduced Myo1b expression by 98% and 97%, respectively, as determined by immunoblotting with anti-Myo1b antibodies (Figure 3A) followed by densitometric analyses using ImageJ software (Figure 3B). The reduction in Myo1b expression was also confirmed by immunofluorescence microscopy where staining of Myo1b in cells treated with Myo1b-targeting siRNA (siRNA1, siRNA2) was significantly reduced versus cells treated with scrambled siRNA (Figure 3C).
FIGURE 3:

Myo1b-specific siRNA reduced Myo1b expression in 832/13 cells. (A) Representative immunoblot probed for Myo1b and tubulin as an internal control of lysates from 832/13 cells treated with scrambled siRNA or Myo1b-specific siRNA1 or siRNA2. (B) Semiquantitative analysis of the amounts of Myo1b expressed in 832/13 cells treated with scrambled siRNA or Myo1b-specific siRNA1 or siRNA2 from four independent experiments as determined by immunoblotting and densitometry. Myo1b intensity was normalized to tubulin content. A significant reduction in Myo1b expression was obtained following treatment with either siRNA1 (98%) or siRNA2 (97%). *P < 0.01. (C) 832/13 cells were transfected with scrambled siRNA or Myo1b-specific siRNA and then stained with anti-Myo1b antibody (green), rhodamine-phalloidin (red), and DAPI (blue). In agreement with the immunoblotting results, the Myo1b signal was significantly reduced in cells treated with Myo1b-specific siRNA1 or siRNA2 vs. cells treated with scrambled siRNA. Scale bar, 20 µm.
Myo1b regulated GSIS and insulin/proinsulin content in 832/13 cells
To investigate the effect of Myo1b loss on insulin secretion, we measured GSIS in control and Myo1b-depleted 832/13 cells. Depletion of Myo1b expression resulted in a significant reduction in GSIS (GSIS was reduced by 53% with siRNA1 and 48% by siRNA2; Figure 4A). Next, to determine whether Myo1b depletion affected the total amount of insulin in cells, which could account for the observed reduction in GSIS in Myo1b-depleted cells, the intracellular insulin content was measured in control and Myo1b-kd cells. The intracellular insulin content was determined by immunoblotting and densitometry for control and Myo1b-kd cells at time 0 and after 30 min in either 2 or 16.7 mM glucose for insight into whether the effect of knockdown (kd) was dependent on the amount of stimulation (Figure 4, B and C). Insulin content was significantly reduced in Myo1b-kd cells in all conditions. The reduced insulin content in Myo1b-kd cells could mean that Myo1b modulates insulin biosynthesis and/or the biogenesis of insulin granules. Using the same approach, we also found that the amount of proinsulin in 832/13 cells was statistically reduced with Myo1b kd (Figure 4D). Importantly, whereas at steady state insulin content was reduced by more than 50% in Myo1b-kd cells, proinsulin content was reduced by less than 25%. The data indicate that Myo1b kd could also affect proinsulin biosynthesis as well as insulin granule trafficking as proinsulin is converted to insulin as nascent granules mature. For initial insight into whether Myo1b affects (pro)insulin granule trafficking, we investigated their distribution in control and Myo1b-knockout cells.
FIGURE 4:

Myo1b depletion reduced glucose-stimulated insulin secretion and the intracellular insulin and proinsulin content. (A) Insulin secretion in control and Myo1b-depleted cells after 60 min in either 2 mM (white bars) or 16.7 mM (black bars) glucose. Insulin secretion induced by 16.7 mM glucose was reduced by 53% with siRNA1 and 48% with siRNA2. The results are the mean ± SE of four independent experiments. *P < 0.01. (B) The intracellular insulin content in 832/13 cells treated with 5 nM scrambled siRNA (negative control) or Myo1b-specfic siRNA1 or siRNA2 was determined in unstimulated cells (t = 0 min) and 30 min after treatment with 2 mM or 16.7 mM glucose by immunoblotting with anti-insulin antibody with tubulin as an internal control. Representative data. (C) Semiquantitative analysis of the insulin content in 832/13 cells treated with scrambled siRNA (white bars) or Myo1b-specific siRNA (sRNA1, gray bars; siRNA2, black bars) at time 0 and 30 min after stimulation in either 2 mM or 16.7 mM glucose. Insulin measurements were normalized to tubulin content, and the amount of insulin in cells treated with scrambled siRNA at time 0 was considered as 100%. Data from six independent experiments are normalized to control values. The relative insulin content at time 0 was 100%, scrambled siRNA, 46%, siRNA1, 55%, siRNA2; 2 G: scrambled siRNA, 106%, 41%, siRNA1, 58%, siRNA2; 16.7 G: scrambled siRNA, 103%, 46%, siRNA1, 58%, siRNA2. *P < 0.01; **P < 0.05. (D) Semiquantitative analysis of proinsulin content in 832/13 cells treated with scrambled siRNA (white bars) or Myo1b-specific siRNA1 at 2 mM and 16.7 mM (black bars). Proinsulin measurements as determined by immunoblotting and densitometry were normalized to tubulin content. The relative proinsulin content at time 0, 100% for scrambled siRNA and 73%, 85%, 64%, 85%, and 87% for siRNA1. At 2 G, 100% for scrambled siRNA and 44%, 101%, 57%, 36%, 101%, and 67% for siRNA1. At 16.7 G, 100% for scrambled siRNA and 93%, 15%, 32%, 30%, 87%, and 75% for siRNA1. *P < 0.05.
Myo1b depletion altered the distribution of insulin SGs
The distribution of (pro)insulin granules in glucose-stimulated 832/13 cells expressing reduced amounts of Myo1b differed from that of stimulated control cells expressing nontargeting siRNA. In merged images of cells stained with antibodies against TGN38, a marker for the TGN (red), and anti-insulin antibodies to localize (pro)insulin granules (green) following a 30-min incubation in high glucose, (pro)insulin granules appeared more dispersed throughout the cytoplasm in control versus Myo1b-depleted cells (Figure 5A). The distribution of (pro)insulin SGs in glucose-stimulated 832/13 control and Myo1b-depleted cells was quantitated (Figure 5B). The percentage of Myo1b-depleted cells with (pro)insulin SGs at the TGN was statistically higher in Myo1b-kd versus control cells, suggesting that Myo1b loss affects an early stage in the formation of nascent (pro)insulin granules.
FIGURE 5:

Myo1b knockdown increased insulin localization at the TGN in glucose-stimulated 832/13 cells. (A) Representative confocal images of 832/13 cells treated with scrambled siRNA or Myo1b-specific siRNA1 or siRNA2 following incubation in 16.7 mM glucose for 30 min and staining for insulin (green), TGN38 (red), actin (cyan), and nuclei (blue). Scale bar, 20 µm. For each condition, the rightmost panel (Magnified) is a 2.5× image of the box in the panel labeled Merge. Note that insulin (green) is more highly dispersed throughout the cells treated with scrambled siRNA but not Myo1b-targeting siRNA. (B) Percentage of insulin fluorescence at the TGN/total fluorescence in glucose-stimulated control (scrambled siRNA; 20.87% ± 0.57 SEM) and Myo1b-kd (siRNA1, 28.95 ± 0.66 SEM; siRNA2, 27.75 ± 0.77 SEM) cells as determined with ImageJ. Data were collected from five different cells in five different areas for each of three conditions in threeindependent experiments. *P<0.01 for both control vs. siRNA1 and control vs. siRNA2.
Myo1b was associated with the TGN region and insulin SGs
To investigate the localization of Myo1b relative to the TGN region, 832/13 cells were stained with anti-Myo1b antibodies, anti-TGN38 antibodies, and 4′,6-diamidino-2-phenylindole (DAPI) to identify nuclei. By superresolution structured illumination microscopy (SR-SIM), Myo1b was observed in close association with the TGN region (Figure 6A). In addition, in SR-SIM images of cells immunostained for Myo1b and (pro)insulin, Myo1b was associated with insulin SGs in the perinuclear region (Figure 6B), evidence that Myo1b is within 100–200 nm, the resolution of superresolution microscopy (Wegel et al., 2016), of both the TGN region and (pro)insulin granules.
FIGURE 6:
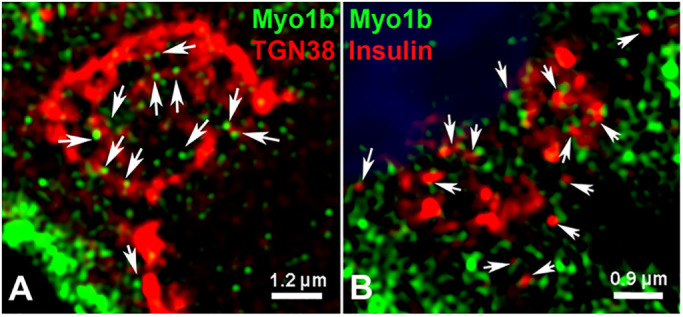
Myo1b was associated with the TGN and insulin granules at the perinuclear region in 832/13 cells. (A) 832/13 cells were stimulated with 16.7 mM glucose for 1 h and then fixed, stained for Myo1b (green), TGN (red), and nuclei (blue), and viewed with SR-SIM. Myo1b puncta were observed at the TGN (arrows). Scale bar, 1.2 µm. (B) 832/13 cells were stimulated for 1 h with 16.7 mM glucose and then fixed, stained for Myo1b (green), insulin (red), and nuclei (blue), and viewed by SR-SIM. Insulin staining was evident near Myo1b staining (arrows). Scale bar, 0.9 µm.
Myo1b depletion did not alter actin patches at the perinuclear region of 832/13 cells
In SR-SIM images, actin patches and Myo1b were found in close proximity in the perinuclear region (Figure 7A). To investigate the effect of reduced Myo1b expression on the actin cytoskeleton at the perinuclear region, cells were stained with fluorescent phalloidin and anti-TGN38 antibody. No obvious changes in the actin cytoskeleton at the TGN region were observed in localization studies of Myo1b-depleted (siRNA1, siRNA2) versus control cells (Figure 7B). Analysis showed that the percentage of cells with actin patches at the TGN did not change with Myo1b depletion (Figure 7C).
FIGURE 7:
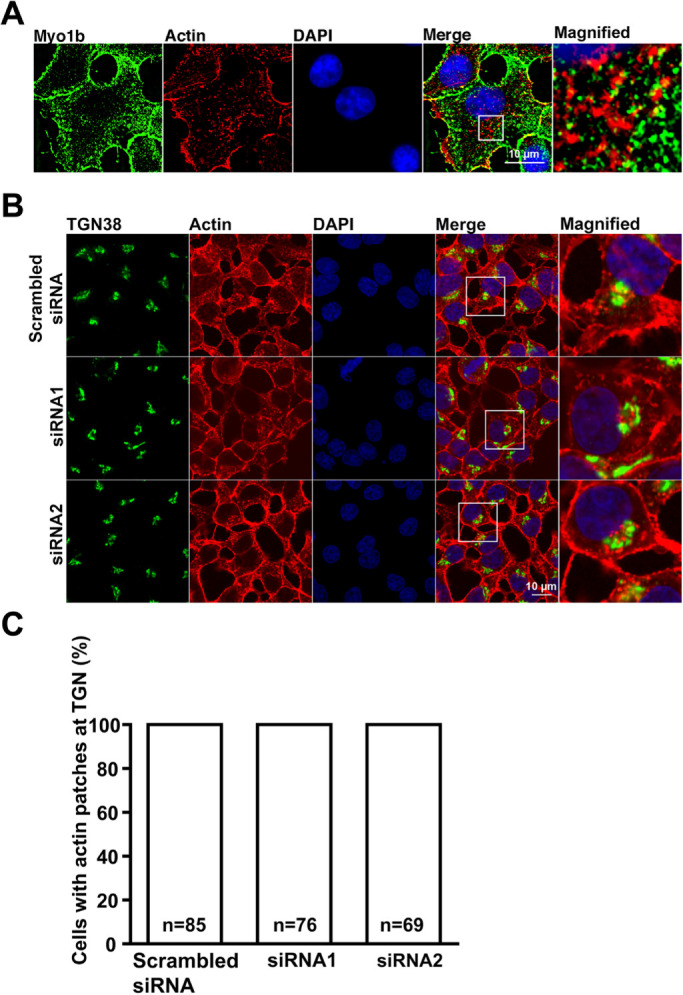
Actin patches at the perinuclear region in control and Myo1b-depleted 832/13 cells. (A) Myo1b was found in close association to actin patches in 832/13 cells stained with anti-Myo1b antibodies (green), Alexa Fluor 594–phalloidin to label actin (red), and DAPI (blue) and then imaged by SR-SIM. Scale bar, 10 µm. The panel labeled Magnified is an ∼5.6-fold-magnified view of the boxed region in Merge. (B) 832/13 cells were treated with control (Scrambled siRNA) or Myo1b-specific siRNA (siRNA1, siRNA2) and then incubated in KRB containing 16.7 mM glucose for 1 h followed by staining with anti-TGN38 antibodies (green), Alex Fluor 594–phalloidin (red), and DAPI (blue) and viewed by confocal microscopy. Scale bar, 10 µm. The rightmost panels are ∼3.23-fold magnified views of the boxed regions in Merge. No change in the number of cells with actin patches within 2 µm of the TGN was observed in control (Scrambled siRNA) or Myo1b-depleted cells (siRNA1, siRNA2). (C) Analyses of localization studies indicated that Myo1b depletion did not change the number of cells with actin patches at the TGN region following glucose stimulation. Data are from three independent experiments; n = the total number of cells counted for each condition in the three experiments.
Myo1b is necessary for efficient budding of nascent insulin granules from the TGN region
The increased (pro)insulin localization at the TGN in glucose-stimulated 832/13 cells (Figure 5) suggested a role for Myo1b in (pro)insulin granule trafficking at the TGN. For insight into Myo1b function at the TGN, an in situ pulse-chase fluorescence-labeling strategy developed by Bearrows et al. (2019) was used to examine the effect of Myo1b loss on nascent granule trafficking from the Golgi region. The assay utilizes a strategy in which the modified DNA repair enzyme SNAP-tag self-labels by transfer of a fluorescent probe from a benzylguanidine-conjugated substrate (Ivanova et al., 2013). SNAP-tag was inserted within the C-peptide region of human preproinsulin, which yields proCpepSNAP (proinsulin) and the mature processed fragments insulin and CpepSNAP (C-peptide); proCpepSNAP is processed, trafficked, and released in a manner consistent with the kinetics of native insulin and C-peptide. Importantly, SNAP-tag pulse-chase labeling allows the visualization of granule loading and the initial trafficking of (pro)insulin-rich granules from the TGN region. To this end, insulinoma 832/3 cells stably expressing proCpepSNAP were transfected with Myo1b-targeting siRNA or nontargeting control siRNA, prelabeled with a nonfluorescent SNAP-tag probe to mask the existing pool of (pro)CpepSNAP and then after a 2-h recovery period pulse labeled with SNAP-Cell TMR-STAR, a cell-permeable, red fluorescence–conjugated substrate for labeling SNAP-tag fusions, and chased for 2 h before fixation and immunofluorescence microscopy. Confocal images showed that initial tetramethylrhodamine (TMR) labeling of proCpepSNAP occurred in the perinuclear region near the TGN marker TGN38 both in control cells treated with nontargeting siRNA and cells treated with Myo1b-targeting siRNA. After a 2-h chase, TMR-labeled (pro)CpepSNAP was distributed throughout the cell body of cells treated with control siRNA, with a large fraction ≥6 µm away from the TGN, consistent with the trafficking of nascent insulin granules and their subsequent maturation on their way to the plasma membrane (Figure 8A). In contrast, more TMR-labeled (pro)CpepSNAP granules remained near the TGN region in Myo1b-kd cells with far fewer granules ≥6 µm away from the TGN region, suggesting that Myo1b loss delayed the early trafficking of nascent granules from the TGN region (Figure 8C). Image analysis of only TMR-labeled granules ≤1 µm from the TGN showed that after a 2-h chase, more TMR-labeled granules remained at the TGN region (0 µm) in Myo1b-kd versus control cells (Figure 8B). These data suggest that Myo1b depletion reduced the early trafficking of nascent insulin granules from the TGN. The reduced number of nascent granules in Myo1b-depleted 832/3 cells may indicate that the budding of immature insulin granules is impeded in the absence of Myo1b.
FIGURE 8:

Myo1b knockdown impaired early-stage trafficking of insulin granules from the TGN. 832/3 cells stably expressing proCpepSNAP were transfected with nontargeting siRNA (Scrambled) or Myo1b-targeting siRNA (siRNA1) and then pulse-labeled with SNAP-TMR for 20 min and chased for 2 h. The frequency distribution of TMR-labeled granules 0 to ≥6 µm (A) and 0 to 1 µm (B) from the TGN in control and Myo1b-kd cells at t = 2-h chase. Data represent the mean ± SEM of 27–31 cells per condition from n = 3 independent experiments. *P ≤ 0.05 by two-way ANOVA with Sidak posttest analysis. (C) Representative confocal images (three-dimensional projection from five z-stacks, DiAna) of 832/3 cells stably expressing proCpepSNAP treated with control or Myo1b-targeting siRNA and then pulse chased with SNAP-TMR (red) for 2 h before staining with anti-TGN38 antibody (cyan) and counterstaining with DAPI (blue). Scale bar, 10 µm.
Reexpression of Myo1b rescues Myo1b siRNA-mediated defects in proCpepSNAP Golgi exit
To determine whether the observed delay in early trafficking of nascent granules was a consequence of Myo1b depletion, we determined whether expression of RNAi-resistant Myo1b would rescue the kd phenotype. Insulinoma 832/3 cells stably expressing proCpepSNAP were transfected with control siRNA, Myo1b-targeting siRNA1, or Myo1b-targeting siRNA1 and RNA interference (RNAi)-resistant Myo1b (Figure 9). Myo1b overexpression and kd were confirmed by immunostaining. In the SNAP-tag pulse-chase assay, Myo1b depletion in proCpepSNAP-expressing 832/3 cells resulted at t = 2 h in an increase in the frequency of TMR-labeled granules ≤2 µm from the TGN region as compared with cells treated with control siRNA (Figure 9A); this is consistent with the results described above. Importantly, no difference in the distribution of TMR-labeled granules ≤2 µm from the TGN region was observed between cells treated with Myo1b-targeting siRNA followed by RNAi-resistant Myo1b and cells treated with control siRNA. Moreover, introduction of RNAi-resistant Myo1b into cells expressing Myo1b-targeting siRNA restored the frequency of TMR-labeled granules >2 µm from the TGN to that observed in cells treated with control siRNA. These data indicate that Myo1b depletion is responsible for the defects in intracellular trafficking of (pro)insulin granules observed in Myo1b-kd cells.
FIGURE 9:

Rescue of Myo1b siRNA–induced early-stage trafficking defects by reexpression of RNAi-resistant Myo1b in proCpepSNAP-expressing 832/3 cells. 832/3 cells stably expressing proCpepSNAP were transfected with control siRNA (Scrambled), Myo1b-targeting siRNA (siRNA1), or Myo1b-targeting siRNA plus RNAi-resistant pEGFP-Myo1b (siRNA1 + rescue) and then pulse-labeled with SNAP-TMR (red) for 20 min and chased for 2 h before confocal imaging. (A) Frequency distributions of TMR-labeled granule distances ≤2 and >2 µm from the TGN are shown. Data represent the mean ± SEM of 26–31 cells per condition from n = 3 independent experiments. *P < 0.05 by two-way ANOVA with Sidak posttest analysis. (B) Representative confocal images of 832/3 cells (maximum projection from five z-stacks) expressing proCpepSNAP transfected with control siRNA (Scrambled siRNA), Myo1b-targeting (siRNA1), or Myo1b siRNA and RNAi-resistant pEGFP-Myo1b (siRNA1 + rescue), pulse-labeled with SNAP-TMR for 20 min and chased for 2 h. Cells were then fixed, immunostained for TGN38 and imaged to visualize TMR-labeled vesicles (red), EGFP-Myo1b (green), TGN 38 (cyan), and nuclei (blue). The rightmost column contains merged images. Scale bars, 10 µm.
DISCUSSION
In regulated secretory cells, newly synthesized proteins are sorted at the TGN to one of three routes: the constitutive pathway, the endosomal/lysosomal pathway, and the regulated secretory pathway (Arvan and Castle, 1998). Secretory proteins like insulin aggregate in the lumen of the TGN due to Ca2+ and low pH and thus segregate from constitutively secreted proteins. The aggregated proteins directly or indirectly attach to lipid rafts at the TGN to induce the formation of immature SGs through budding (Kim et al., 2006). The actin cytoskeleton and its associated motors are implicated in post-Golgi trafficking, but whether the same or specific myosin motors mediate biogenesis of carriers destined for all or specific post-Golgi pathways is unknown.
In superresolution images, Myo1b puncta were observed in 832/13 cells at the TGN region near F-actin patches, short rhodamine-phalloidin–stained actin filaments. Previously, localization of Myo1b in the perinuclear region of HeLa cells, in close proximity to the TGN region, was reported (Almeida et al., 2011). Although not enriched at the TGN region in 832/13 cells, Myo1b need not be to perform an important function there; other proteins determined to affect Golgi structure/function have little or no enrichment at the Golgi (Ramabhadran et al., 2011; Zilberman et al., 2011).
The reduction in insulin secretion and accumulation of insulin SGs at the TGN region in response to glucose stimulation in Myo1b-depleted 832/13 cells are consistent with Myo1b loss causing a defect in insulin granule biogenesis. Using a pulse-chase assay designed to track nascent insulin granules (Bearrows et al., 2019), we found that Myo1b depletion increased the number of TMR-labeled granules at the TGN region after a 2-h chase, with far fewer TMR-labeled granules ≥6 µm from the TGN (Figure 8A). A more detailed analysis examining only TMR-labeled granules ≤1 µm from the TGN showed more TMR-labeled granules at the TGN after 2 h in Myo1b-kd versus control cells (Figure 8B). The data suggest that Myo1b depletion decreases the number of nascent granules budding from the TGN and delays their trafficking away from the TGN and toward the plasma membrane.
The restoration in the frequency of insulin granules >2 µm from the TGN in Myo1b-kd cells to control levels by expression of exogenous Myo1b (Figure 9) indicated that Myo1b depletion is responsible for the kd phenotype. The results are consistent with the idea that Myo1b loss inhibits insulin granule biogenesis. Insulin stalls at the TGN in β-cells expressing a dominant-negative form of the receptor SORCS1 (Kebede et al., 2014) and near the TGN network in β-cells deficient in the prohormone VGF (Stephens et al., 2017) and chromogranin B (Bearrows et al., 2019), factors determined to mediate SG biogenesis. The studies are also consistent with previous results showing that Myo1b localizes to the TGN in HeLa cells and that its depletion impairs exit of the lysosomal marker MPR from the Golgi region. Evidently, Myo1b promotes the formation of MPR-positive membrane tubules at the TGN (Almeida et al., 2011). Indeed, small numbers of Myo1b molecules are able to support membrane tubulation in vitro (Yamada et al., 2014). Thus, Myo1b likely participates in both the endosomal/lysosomal pathway and, based on our studies, regulated secretory pathways.
β-cells maintain an optimal intracellular store of insulin granules by balancing insulin production with insulin secretion and degradation (Boland et al., 2017). For example, to compensate for the reduced insulin secretion in transgenic mice lacking the GTPase Rab3, which is necessary for granule transport to the cell surface, β-granule degradation is increased (Marsh et al., 2007). Thus, the reduction in proinsulin and insulin content observed in Myo1b-kd cells may be a consequence of reduced formation of nascent insulin granules in the absence of Myo1b. Alternatively, the reduction in proinsulin in Myo1b-kd cells may indicate that Myo1b loss affects preproinsulin to proinsulin processing; however, given what is known about Myo1b function and the conversion of preproinsulin to proinsulin, it is hard to envision how.
Previous studies showed that Myo1b depletion affects regulated chromogranin A (CgA) secretion in PC12 cells and a model system consisting of COS7 cells expressing exogenous CgA (COS7-CgA cells) (Delestre-Delacour et al., 2017). Importantly, although our studies show that reduced Myo1b expression also affects regulated insulin secretion, there are significant differences between the two studies. In PC12 and COS7-CgA cells, no decrease in stimulated secretion of CgA in response to barium was observed; however, an increase in the basal secretion of CgA was found (Delestre-Delacour et al., 2017). In contrast, we observed reduced GSIS but no increase in the basal secretion of insulin in Myo1b-depleted 832/13 cells (Figure 4A). In fact, there was a small, but significant, decrease (P < 0.04) in basal secretion in 832/13 cells treated with Myo1b-targeting siRNA1, but not Myo1b-targeting siRNA2, for an unknown reason.
Myo1b depletion also reportedly leads to fewer CgA granules in COS7-CgA cells, suggesting that Myo1b controls the biogenesis of SGs, although the immunoblots show that the total amount of CgA did not change with Myo1b depletion, data inconsistent with this conclusion (Delestre-Delacour et al., 2017). Although we found it difficult to count the insulin granules in control and Myo1b-kd cells, our impression from the pulse-chase experiments is that Myo1b-kd cells contained fewer TMR-labeled granules than control cells (Figure 8C). Thus, although Myo1b may participate in the regulated secretion of both CgA and insulin, Myo1b may play different roles with different cargoes and in different cell types. The idea that Myo1b functions differently in different cell types is supported by examination of the actin cytoskeleton. The distribution of F-actin at the Golgi requires Myo1b expression and Arp2/3 complex activation in COS7-CgA cells, and Myo1b-depletion reduces the amount of actin at the Golgi region in these cells (Delestre-Delacour et al., 2017). In contrast, no obvious reduction in the actin cytoskeleton at the Golgi region was observed with Myo1b depletion in 832/13 cells (Figure 7, B and C), suggesting that Myo1b does not contribute to the recruitment and/or the retention of F-actin at the Golgi in 832/13 cells.
Another consideration is that there are multiple class I myosins, and different cell types express different myosins-I as well as other unconventional myosins. Therefore, another myosin expressed in a particular cell type could compensate for a loss of Myo1b. This situation was realized in Myo1a-knockout mice where Myo1d redistributes in Myo1a-knockout enterocytes to the apical microvilli where Myo1a usually resides (Benesh et al., 2010). Proteomic studies indicate that Myo1a, b, c, d, e, and f are expressed in the pancreas (Chelala et al., 2007; Gadaleta et al., 2011; Makawita et al., 2011; Dayem Ullah et al., 2014), and Myo1b, c, d, and e are expressed in islets (Schrimpe-Rutledge et al., 2012). Thus, these other myosins also play roles in β-cells. We found that treatment of 832/13 cells with pentachloropseudilin, a small molecule inhibitor of class I myosins (Chinthalapudi et al., 2011), reduced GSIS by 80% (S. Komaba, R. Martin, H.-J. Knölker, and L.M. Coluccio, unpublished results) versus the 50% reduction in Myo1b knockout cells determined here. These data suggest that other class I myosins may mediate aspects of insulin secretion.
Finally, our results indicating that Myo1b modulates an early event in the trafficking of (pro)insulin granules from the TGN do not rule out the possibility that Myo1b may also play other roles in β-cells. As in other cell types, in β-cells Myo1b is at the plasma membrane, which is critical for insulin granule docking, fusion, and secretion. Whether Myo1b plays a role in insulin secretion at the plasma membrane of β-cells awaits further investigation.
MATERIALS AND METHODS
Reagents
Rabbit monoclonal anti-Myo1b antibody (ab194356) was obtained from Abcam (Cambridge, MA). The specificity of the Myo1b antibody was confirmed by immunoblotting, where it recognized a 130-kDa polypeptide, the same molecular weight as Myo1b, and by both immunoblotting and immunocytochemistry of insulinoma 832/13 cells treated with Myo1b-specific siRNA, which resulted in reduced expression of the 130-kDa band and reduced staining of the cell membrane and cytoplasm versus control cells. Mouse monoclonal anti–β-tubulin antibody (T5168; clone B-5-1-2), which recognized a single band at 55 kDa, the size of tubulin, was obtained from Sigma-Aldrich (St. Louis, MO). Mouse monoclonal anti-insulin antibody (SAB42006791; clone K36AC10), which recognized intracellular organelles in insulinoma 832/13 cells, was also obtained from Sigma-Aldrich. Rabbit monoclonal anti-insulin antibody (3014S; clone C27C9) was obtained from Cell Signaling Technology (Danvers, MA). On immunoblots, this antibody recognized a band of 3.5 kDa, which is attributed to the B chain of insulin. Mouse anti-TGN38 antibody (610898; clone 2/TGN38) was obtained from BD Biosciences (Billerica, MA). Its specificity for the TGN was confirmed by immunocytochemistry, where it stained the perinuclear region of insulinoma 832/13 cells. A widely used guinea pig polyclonal anti-insulin antibody obtained from Abcam (ab7842) was used in staining insulinoma cells and sections of pancreas, where it served as a marker for islets. Cell Signaling Technologies anti-insulin (L6B10) antibody (813S) was used in immunoblotting to identify proinsulin, which migrated at ∼10 kDa, the predicted molecular weight of proinsulin. Alexa Fluor 488- (A-11034), 594- (A-11037), and 647- (A-32733)-conjugated goat anti-rabbit, Alexa Fluor 488- (A-11029), 594- (A-11032), and cy5- (A-10524)-conjugated goat anti-mouse, and Alexa Fluor 488–conjugated goat anti-guinea pig (A-11073) secondary antibodies were obtained from Molecular Probes (Eugene, OR). Control tissue samples stained with secondary antibody only were routinely used to rule out nonspecific staining. Rhodamine-phalloidin (R415) and Alexa Fluor 594–phalloidin (A12381) were also obtained from Molecular Probes. Paraffin sections of rat pancreas were purchased from Abcam and Zyagen (San Diego, CA). SNAP-Cell TMR-Star (S9105S) and SNAP-Cell Block (S9106S) were obtained from New England Biolabs (Ipswich, MA). Restriction enzymes PmeI (R0560S), PacI (R0547S), BglII (R0144S), and XhoI (R0146S) were also obtained from New England Biolabs. Lipofectamine and Lipofectamine MAX were obtained from Invitrogen (Thermo Fisher Scientific, Waltham, MA).
Cell culture
The study used 832/13 and 832/3 cell lines, which are clones derived from the stable transfection of the parental rat INS-1 insulinoma cell line with a plasmid containing the human proinsulin gene driven by the cytomegalovirus promoter (Hohmeier et al., 2000); 832/3 cells stably expressing proCpepSNAP (Bearrows et al., 2019) were the kind gift of Samuel B. Stephens (University of Iowa). 832/13 and 832/3 cells have features expected of pancreatic β-cells as they contain insulin granules as observed by immunostaining with anti-insulin antibody, which recognizes both rat and human insulin and proinsulin, and they secrete insulin in response to glucose stimulation as determined by insulin assays. Insulinoma cells were cultured in RPMI 1640 medium (+) l-glutamine, (–) d-glucose (Life Technologies 11879-020; Thermo Fisher Scientific, Waltham, MA) supplemented with 10% fetal bovine serum (FBS) 10 mM HEPES (pH 7.4), 1 mM sodium pyruvate, 50 µM β-mercaptoethanol, and 10 mM glucose.
RNAi experiments
siRNA targeting rat Myo1b (siRNA1: CCAAGAUAUUCAUCCGAAA and siRNA2: GUAAAUCGAAUCAACGAAA) and nontargeting siRNA as a negative control were designed by and obtained from Dharmacon (Lafayette, CO). After being cultured for 1 d, insulinoma cells were transfected with either 5 nM Myo1b-targeting siRNA or scrambled siRNA using Lipofectamine RNAiMax reagent according to the manufacturer’s suggestions (Invitrogen, Thermo Fisher Scientific, Waltham, MA). Transfected cells were cultured for 3 d and analyzed for Myo1b expression by immunoblotting and/or immunocytochemistry with anti-Myo1b antibody.
Immunoblotting
Proteins separated by SDS–PAGE were transferred to polyvinylidene difluoride membrane, blocked in 5% nonfat milk in phosphate-buffered saline (PBS) for 1 h and then incubated with a 1/100,000 dilution of anti-Myo1b antibody or 1/10,000 dilution of anti-insulin antibody and 1/200,000 dilution of anti-tubulin antibody in PBS with nonfat milk followed by washing in PBS and incubation in 1/20,000 horseradish-conjugated secondary antibody. To probe for insulin and proinsulin, polyacrylamide gels and transfers were performed according to a previously described method (Okita et al., 2017). Color development was achieved with Amersham ECL Prime Western Blotting Detection Reagent (GE Healthcare, Marlborough, MA). The blot was then exposed to x-ray film, and the film was developed in an X-omat film developer. Densitometry was performed using ImageJ software (Schindelin et al., 2012).
Immunocytochemistry
832/13 or 832/3 cells were fixed with 4% formaldehyde in PBS for 20 min and permeabilized with 0.1% Triton X-100 in PBS for 10 min. Cells were blocked in 5% goat serum and 2.5% bovine serum albumin (BSA) in PBS for 1 h and then incubated with the appropriate primary antibodies (1:500 anti-insulin; 1:10,000 anti-Myo1b; and 1:500 anti-TGN38), fluorescently labeled secondary antibodies (1:500), and/or rhodamine- or Alexa Fluor 594–conjugated phalloidin (1:500) to identify actin filaments. For staining of sections from rat pancreas, after deparaffinization and rehydration, the sections were subjected to antigen retrieval by being boiled in 10 mM sodium citrate, pH 6.0, for 5 min. Sections were stained as described above. Sections and cells grown on #1.0 coverslips to be viewed with a Leica TCS SP5 Broadband confocal microscope (Leica, Sohms, Germany) were fixed and mounted on glass slides in Vectashield Hardset antifade mounting medium with DAPI (H-1500; Vector Laboratories, Burlingame, CA). Alternatively, cells grown on #1.5 coverslips were fixed and mounted in ProLong Gold mounting reagent (P10144; Molecular Probes, ThermoFisher Scientific) and viewed with a Nikon N-SIM superresolution system (Minato, Tokyo, Japan) using a 40× or 100× objective.
Insulin secretion assays
832/13 cells were grown in 24-well plates for 3 d and then cultured overnight in RPMI medium supplemented with 2.5% FBS and 2 mM glucose. The culture medium was replaced with RPMI medium containing 2 mM glucose without FBS, and cells were incubated for 2 h. Cells were preincubated in modified Krebs-Ringer bicarbonate (KRB) buffer consisting of 119 mM NaCl, 4.6 mM KCl, 2 mM CaCl2, 1 mM MgSO4, 0.15 mM Na2HPO4, 0.4 mM KH2PO4, 20 mM HEPES, and 5 mM NaHCO3 with 0.2% BSA and 2 mM glucose, pH 7.4, for 30 min. Insulin secretion assays were performed in KRB buffer in the presence of 2 or 16.7 mM glucose for 60 min at 37°C. Secreted insulin was measured with an HTRF Insulin Assay kit obtained from Cis-Bio (Bedford, MA).
Analysis of insulin at the TGN region
Following glucose stimulation for 30 min, 832/13 control and Myo1b-kd cells were stained for actin, insulin, TGN38, and nuclei. Cell images were captured by immunofluorescence microscopy and analyzed with ImageJ software in the cases of Figures 4, 5, and 7. The Freehand function was used to outline cells based on actin staining in order to determine cell area. The area occupied by the TGN was determined similarly based on TGN38 staining. The Measure function was then used to determine the mean insulin fluorescence in the cellular region and in the TGN region. The insulin fluorescence in the TGN region (mean insulin fluorescence at the TGN X area of the TGN) was measured and reported as a percentage of total cellular fluorescence (mean cellular insulin fluorescence X cellular area). At least five cells in five different areas for each condition (control, siRNA1, and siRNA2) were examined. The results are drawn from three independent experiments.
Analysis of actin foci at the TGN region
The number of 832/13 cells with actin patches within 2 µm of the TGN region was determined with ImageJ of confocal images of multiple (n > 69 for each condition in three separate experiments) cells stained for actin with Alexa Fluor 594–phalloidin and TGN38 with anti-TGN38 antibodies.
Pulse-chase labeling of nascent proinsulin/insulin-rich SGs
An in situ pulse-chase fluorescence-labeling strategy (Bearrows et al., 2019) was used to examine the effect of Myo1b loss on nascent insulin granule trafficking from the Golgi region. This assay uses 832/3 cells expressing a construct in which the modified DNA repair enzyme SNAP-tag, which self-labels by transfer of a fluorescent probe from a benzylguanidine-conjugated substrate, is inserted within the C-peptide region of human preproinsulin; preproinsulin is processed to proCpepSNAP and the mature forms insulin and CpepSNAP (C-peptide) (Bearrows et al., 2019). 832/3 cells expressing proCpepSNAP were grown on HTB9-coated coverslips (Hayes et al., 2017; Stephens et al., 2017; Bearrows et al., 2019) and then transfected with either 5 µM control siRNA or Myo1b-targeting siRNA1 overnight. Two days later, the cells were pulse-labeled with 1 µM SNAP-Cell TMR-STAR substrate (S9195S; New England Biolabs) for 20 min and chased for 2 h before fixation, staining with anti-TGN38 antibody to identify the TGN region, counterstaining with DAPI, and evaluation by immunofluorescence microscopy. The ImageJ plug-in DiAna (Gilles et al., 2017) was used to analyze the shortest distance from the surface of TMR-labeled granules to the nearest surface of TGN, and the results are reported as frequency of TMR-labeled granules as a function of distance from the TGN.
Rescue experiments
To confer siRNA resistance to the exogenous Myo1b, the target sequence of siRNA1, CCAAGATATTCATCCGAAA, was mutated to CGAAAATCTTTATACGTAA in Myo1b–green fluorescent protein (GFP) plasmid (a kind gift of Martin Bähler, Westfälische Wilhelms-Universität, Münster, Germany). On day 1, 832/3 cells stably expressing proCpepSNAP were transfected with Myo1b-targeting siRNA1 or a nontargeting control siRNA. On day 2, these cells were subsequently transfected ± RNAi-resistant Myo1b in suspension by electroporation with a Neon transfection system (Invitrogen, Thermo Fisher Scientific) according to the manufacturer’s instructions and cultured on HTB9-coated coverslips. On day 4, cells were immunostained with anti-Myo1b antibody to confirm Myo1b kd and pulse-labeled with SNAP-Cell TMR-STAR (red) for 20 min and chased for 2 h. Rescued cells were confirmed as GFP-positive cells. The frequency distribution of granules as a function of distance from the TGN was determined using the ImageJ plug-in DiAna (Gilles et al., 2017).
Statistics
Data from multiple independent experiments are expressed as means ± SD and compared using analysis of variance (ANOVA) followed by Tukey’s post-hoc test. The data of TMR-proCpepSNAP granule frequency are presented as the mean ± SEM and analyzed by two-way ANOVA with Sidak posttest analysis (GraphPad Prism). The horizontal lines over the bar graphs indicate which two conditions were compared. The asterisks above the horizontal lines refer to the P values recorded in the legends.
Acknowledgments
We thank Samuel B. Stephens (University of Iowa) for the kind gifts of reagents including 832/3 cells stably expressing proCpepSNAP and instruction in SNAP-tag pulse-chase labeling; and Jude Deeney (Boston University School of Medicine) for instruction in measuring insulin secretion. The studies were supported in part by National Institutes of Health grant 1R01 GM111615 to L.M.C. The content is solely the responsibility of the authors and does not necessarily represent the official views of the National Institutes of Health.
Abbreviations used:
- ANOVA
analysis of variance
- BSA
bovine serum albumin
- CgA
chromogranin A
- DAPI
4’,6-diamidino-2-phenylindole
- ER
endoplasmic reticulum
- FBS
fetal bovine serum
- GFP
green fluorescent protein
- GSIS
glucose-stimulated insulin secretion
- IgG
immunoglobulin
- kd
knockdown
- MPR
mannose 6-phosphate receptor
- Myo1b
Myosin-1b
- PBS
phosphate-buffered saline
- PClP
pentachloropseudilin
- SDS–PAGE
sodium dodecyl sulfate–polyacrylamide gel electrophoresis
- SEM
standard error of the mean
- SG
secretory granule
- siRNA
small interfering RNA
- SR-SIM
superresolution structured illumination microscopy
- TGN
trans-Golgi marker
- TMR
tetramethylrhodamine.
Footnotes
This article was published online ahead of print in MBoC in Press (http://www.molbiolcell.org/cgi/doi/10.1091/mbc.E21-03-0094) on April 7, 2021.
REFERENCES
- Almeida CG, Yamada A, Tenza D, Louvard D, Raposo G, Coudrier E (2011). Myosin 1b promotes the formation of post-Golgi carriers by regulating actin assembly and membrane remodelling at the trans-Golgi network. Nat Cell Biol 13, 779–789. [DOI] [PubMed] [Google Scholar]
- Arous C, Halban PA (2015). The skeleton in the closet: actin cytoskeletal remodeling in beta-cell function. Am J Physiol Endocrinol Metab, ajpendo 00268 02015. [DOI] [PubMed] [Google Scholar]
- Arous C, Rondas D, Halban PA (2013). Non-muscle myosin Iia is involved in focal adhesion and actin remodelling controlling glucose-stimulated insulin secretion. Diabetologia 56, 792–802. [DOI] [PubMed] [Google Scholar]
- Arvan P, Castle D (1998). Sorting and storage during secretory granule biogenesis: looking backward and looking forward. Biochem J 332 (Pt 3), 593–610. [DOI] [PMC free article] [PubMed] [Google Scholar]
- Bearrows SC, Bauchle CJ, Becker M, Haldeman JM, Swaminathan S, Stephens SB (2019). Chromogranin B regulates early stage insulin granule trafficking from the Golgi in pancreatic islet beta-cells. J Cell Sci 132, jcs231373.. [DOI] [PMC free article] [PubMed] [Google Scholar]
- Benesh AE, Nambiar R, McConnell RE, Mao S, Tabb DL, Tyska MJ (2010). Differential localization and dynamics of class I myosins in the enterocyte microvillus. Mol Biol Cell 21, 970–978. [DOI] [PMC free article] [PubMed] [Google Scholar]
- Boland BB, Rhodes CJ, Grimsby JS (2017). The dynamic plasticity of insulin production in beta-cells. Mol Metab 6, 958–973. [DOI] [PMC free article] [PubMed] [Google Scholar]
- Chelala C, Hahn SA, Whiteman HJ, Barry S, Hariharan D, Radon TP, Lemoine NR, Crnogorac-Jurcevic T (2007). Pancreatic expression database: a generic model for the organization, integration and mining of complex cancer datasets. BMC Genomics 8, 439. [DOI] [PMC free article] [PubMed] [Google Scholar]
- Chinthalapudi K, Taft MH, Martin R, Heissler SM, Preller M, Hartmann FK, Brandstaetter H, Kendrick-Jones J, Tsiavaliaris G, Gutzeit HO, et al. (2011). Mechanism and specificity of pentachloropseudilin-mediated inhibition of myosin motor activity. J Biol Chem 286, 29700–29708. [DOI] [PMC free article] [PubMed] [Google Scholar]
- Coluccio LM (2008). Myosin I. In: Myosins: A Superfamily of Molecular Motors, vol. 7, ed Coluccio LM, Dordrecht, The Netherlands: Springer, 95–124. [Google Scholar]
- Coluccio LM (2018). Structure and function of mammalian class I myosins. In: Myosin. ed. Broadbent D, Hauppauge, NY: Science Publishers. [Google Scholar]
- Coluccio LM, Geeves MA (1999). Transient kinetic analysis of the 130-Kda myosin I (Myr 1 gene product) from rat liver: a myosin I designed for maintenance of tension? J Biol Chem 274, 21575–21580. [DOI] [PubMed] [Google Scholar]
- Davidson HW (2004). ( Pro)insulin processing: a historical perspective. Cell Biochem Biophys 40, 143–158. [DOI] [PubMed] [Google Scholar]
- Dayem Ullah AZ, Cutts RJ, Ghetia M, Gadaleta E, Hahn SA, Crnogorac-Jurcevic T, Lemoine NR, Chelala C (2014). The Pancreatic Expression Database: recent extensions and updates. Nucleic Acids Res 42, D944–D949. [DOI] [PMC free article] [PubMed] [Google Scholar]
- DeFronzo RA, Ferrannini E, Groop L, Henry RR, Herman WH, Holst JJ, Hu FB, Kahn CR, Raz I, Shulman GI, et al. (2015). Type 2 diabetes mellitus. Nat Rev Dis Primers 1, 1. [DOI] [PubMed] [Google Scholar]
- Delestre-Delacour C, Carmon O, Laguerre F, Estay-Ahumada C, Courel M, Elias S, Jeandel L, Rayo MV, Peinado JR, Sengmanivong L, et al. (2017). Myosin 1b and F-actin are involved in the control of secretory granule biogenesis. Sci Rep 7, 5172. [DOI] [PMC free article] [PubMed] [Google Scholar]
- Desnos C, Huet S, Fanget I, Chapuis C, Bottiger C, Racine V, Sibarita JB, Henry JP, Darchen F (2007). Myosin Va mediates docking of secretory granules at the plasma membrane. J Neurosci 27, 10636–10645. [DOI] [PMC free article] [PubMed] [Google Scholar]
- Fan F, Matsunaga K, Wang H, Ishizaki R, Kobayashi E, Kiyonari H, Mukumoto Y, Okunishi K, Izumi T (2017). Exophilin-8 assembles secretory granules for exocytosis in the actin cortex via interaction with Rim-Bp2 and myosin-Viia. eLife 6, e26174.. [DOI] [PMC free article] [PubMed] [Google Scholar]
- Gadaleta E, Cutts RJ, Kelly GP, Crnogorac-Jurcevic T, Kocher HM, Lemoine NR, Chelala C (2011). A global insight into a cancer transcriptional space using pancreatic data: importance, findings and flaws. Nucleic Acids Res 39, 7900–7907. [DOI] [PMC free article] [PubMed] [Google Scholar]
- Gilles JF, Dos Santos M, Boudier T, Bolte S, Heck N (2017). DiAna, an Imagej tool for object-based 3d co-localization and distance analysis. Methods 115, 55–64. [DOI] [PubMed] [Google Scholar]
- Hayes HL, Peterson BS, Haldeman JM, Newgard CB, Hohmeier HE, Stephens SB (2017). Delayed apoptosis allows islet beta-cells to implement an autophagic mechanism to promote cell survival. PLoS One 12, e0172567. [DOI] [PMC free article] [PubMed] [Google Scholar]
- Hohmeier HE, Mulder H, Chen G, Henkel-Rieger R, Prentki M, Newgard CB (2000). Isolation of Ins-1-derived cell lines with robust Atp-sensitive K+ channel-dependent and -independent glucose-stimulated insulin secretion. Diabetes 49, 424–430. [DOI] [PubMed] [Google Scholar]
- Iuliano O, Yoshimura A, Prosperi MT, Martin R, Knolker HJ, Coudrier E (2018). Myosin 1b promotes axon formation by regulating actin wave propagation and growth cone dynamics. J Cell Biol 217, 2033–2046. [DOI] [PMC free article] [PubMed] [Google Scholar]
- Ivanova A, Kalaidzidis Y, Dirkx R, Sarov M, Gerlach M, Schroth-Diez B, Muller A, Liu Y, Andree C, Mulligan B, et al. (2013). Age-dependent labeling and imaging of insulin secretory Granules. Diabetes 62, 3687–3696. [DOI] [PMC free article] [PubMed] [Google Scholar]
- Ivarsson R, Jing X, Waselle L, Regazzi R, Renstrom E (2005). Myosin 5a controls insulin granule recruitment during late-phase secretion. Traffic 6, 1027–1035. [DOI] [PubMed] [Google Scholar]
- Jewell JL, Luo W, Oh E, Wang Z, Thurmond DC (2008). Filamentous actin regulates insulin exocytosis through direct interaction with syntaxin 4. J Biol Chem 283, 10716–10726. [DOI] [PMC free article] [PubMed] [Google Scholar]
- Kalwat MA, Thurmond DC (2013). Signaling mechanisms of glucose-induced F-actin remodeling in pancreatic islet beta cells. Exp Mol Med 45, e37. [DOI] [PMC free article] [PubMed] [Google Scholar]
- Kasai K, Ohara-Imaizumi M, Takahashi N, Mizutani S, Zhao S, Kikuta T, Kasai H, Nagamatsu S, Gomi H, Izumi T (2005). Rab27a mediates the tight docking of insulin granules onto the plasma membrane during glucose stimulation. J Clin Invest 115, 388–396. [DOI] [PMC free article] [PubMed] [Google Scholar]
- Kebede MA, Oler AT, Gregg T, Balloon AJ, Johnson A, Mitok K, Rabaglia M, Schueler K, Stapleton D, Thorstenson C, et al. (2014). Sorcs1 is necessary for normal insulin secretory granule biogenesis in metabolically stressed beta cells. J Clin Invest 124, 4240–4256. [DOI] [PMC free article] [PubMed] [Google Scholar]
- Kim T, Gondre-Lewis MC, Arnaoutova I, Loh YP (2006). Dense-core secretory granule biogenesis. Physiology (Bethesda) 21, 124–133. [DOI] [PubMed] [Google Scholar]
- Komaba S, Coluccio LM (2010). Localization of myosin 1b to actin protrusions requires phosphoinositide binding. J Biol Chem 285, 27686–27693. [DOI] [PMC free article] [PubMed] [Google Scholar]
- Laakso JM, Lewis JH, Shuman H, Ostap EM (2008). Myosin I can act as a molecular force sensor. Science 321, 133–136. [DOI] [PMC free article] [PubMed] [Google Scholar]
- Makawita S, Smith C, Batruch I, Zheng Y, Ruckert F, Grutzmann R, Pilarsky C, Gallinger S, Diamandis EP (2011). Integrated proteomic profiling of cell line conditioned media and pancreatic juice for the identification of pancreatic cancer biomarkers. Mol Cell Proteomics 10, M111 008599. [DOI] [PMC free article] [PubMed] [Google Scholar]
- Marsh BJ, Soden C, Alarcon C, Wicksteed BL, Yaekura K, Costin AJ, Morgan GP, Rhodes CJ (2007). Regulated autophagy controls hormone content in secretory-deficient pancreatic endocrine beta-cells. Mol Endocrinol 21, 2255–2269. [DOI] [PubMed] [Google Scholar]
- Nambiar R, McConnell RE, Tyska MJ (2009). Control of cell membrane tension by myosin-I. Proc Natl Acad Sci USA 106, 11972–11977. [DOI] [PMC free article] [PubMed] [Google Scholar]
- Okita N, Higami Y, Fukai F, Kobayashi M, Mitarai M, Sekiya T, Sasaki T (2017). Modified western blotting for insulin and other diabetes-associated peptide hormones. Sci Rep 7, 6949. [DOI] [PMC free article] [PubMed] [Google Scholar]
- Ramabhadran V, Korobova F, Rahme GJ, Higgs HN (2011). Splice variant-specific cellular function of the formin Inf2 in maintenance of Golgi architecture. Mol Biol Cell 22, 4822–4833. [DOI] [PMC free article] [PubMed] [Google Scholar]
- Rhodes CJ, Halban PA (1987). Newly synthesized proinsulin/insulin and stored insulin are released from pancreatic B cells predominantly via a regulated, rather than a constitutive, pathway. J Cell Biol 105, 145–153. [DOI] [PMC free article] [PubMed] [Google Scholar]
- Ruppert C, Godel J, Müller RT, Kroschewski R, Reinhard J, Bähler M (1995). Localization of the rat myosin I molecules Myr 1 and Myr 2 and in vivo targeting of their tail domains. J Cell Sci 108, 3775–3786. [DOI] [PubMed] [Google Scholar]
- Ruppert C, Kroschewski R, Bähler M (1993). Identification, characterization and cloning of Myr 1, a mammalian myosin-I. J Cell Biol 120, 1393–1403. [DOI] [PMC free article] [PubMed] [Google Scholar]
- Schindelin J, Arganda-Carreras I, Frise E, Kaynig V, Longair M, Pietzsch T, Preibisch S, Rueden C, Saalfeld S, Schmid B, et al. (2012). Fiji: an open-source platform for biological-image analysis. Nat Methods 9, 676–682. [DOI] [PMC free article] [PubMed] [Google Scholar]
- Schrimpe-Rutledge AC, Fontes G, Gritsenko MA, Norbeck AD, Anderson DJ, Waters KM, Adkins JN, Smith RD, Poitout V, Metz TO (2012). Discovery of novel glucose-regulated proteins in isolated human pancreatic islets using Lc-Ms/Ms-based proteomics. J Proteome Res 11, 3520–3532. [DOI] [PMC free article] [PubMed] [Google Scholar]
- Stephens SB, Edwards RJ, Sadahiro M, Lin WJ, Jiang C, Salton SR, Newgard CB (2017). The prohormone Vgf regulates beta cell function via insulin secretory granule biogenesis. Cell Rep 20, 2480–2489. [DOI] [PMC free article] [PubMed] [Google Scholar]
- Thurmond DC, Gonelle-Gispert C, Furukawa M, Halban PA, Pessin JE (2003). Glucose-stimulated insulin secretion is coupled to the interaction of actin with the T-snare (target membrane soluble N-ethylmaleimide-sensitive factor attachment protein receptor protein) complex. Mol Endocrinol 17, 732–742. [DOI] [PubMed] [Google Scholar]
- Tomas A, Yermen B, Min L, Pessin JE, Halban PA (2006). Regulation of pancreatic beta-cell insulin secretion by actin cytoskeleton remodelling: role of gelsolin and cooperation with the Mapk signalling pathway. J Cell Sci 119, 2156–2167. [DOI] [PubMed] [Google Scholar]
- Varadi A, Tsuboi T, Rutter GA (2005). Myosin Va transports dense core secretory vesicles in pancreatic Min6 beta-cells. Mol Biol Cell 16, 2670–2680. [DOI] [PMC free article] [PubMed] [Google Scholar]
- Waguri S, Dewitte F, Le Borgne R, Rouille Y, Uchiyama Y, Dubremetz JF, Hoflack B (2003). Visualization of Tgn to endosome trafficking through fluorescently labeled Mpr and Ap-1 in living cells. Mol Biol Cell 14, 142–155. [DOI] [PMC free article] [PubMed] [Google Scholar]
- Wang Z, Thurmond DC (2009). Mechanisms of biphasic insulin-granule exocytosis—roles of the cytoskeleton, small GTPases and snare proteins. J Cell Sci 122, 893–903. [DOI] [PMC free article] [PubMed] [Google Scholar]
- Wegel E, Gohler A, Lagerholm BC, Wainman A, Uphoff S, Kaufmann R, Dobbie IM (2016). Imaging cellular structures in super-resolution with Sim, Sted and localisation microscopy: a practical comparison. Sci Rep 6, 27290. [DOI] [PMC free article] [PubMed] [Google Scholar]
- Yamada A, Mamane A, Lee-Tin-Wah J, Di Cicco A, Prevost C, Levy D, Joanny JF, Coudrier E, Bassereau P (2014). Catch-bond behaviour facilitates membrane tubulation by non-processive myosin 1b. Nat Commun 5, 3624. [DOI] [PubMed] [Google Scholar]
- Zilberman Y, Alieva NO, Miserey-Lenkei S, Lichtenstein A, Kam Z, Sabanay H, Bershadsky A (2011). Involvement of the Rho-Mdia1 pathway in the regulation of Golgi complex architecture and dynamics. Mol Biol Cell 22, 2900–2911. [DOI] [PMC free article] [PubMed] [Google Scholar]