

Abstract
The concentration of chloride in sweat remains the most robust biomarker for confirmatory diagnosis of cystic fibrosis (CF), a common life-shortening genetic disorder. Early diagnosis via quantitative assessment of sweat chloride allows prompt initiation of care and is critically important to extend life expectancy and improve quality of life. The collection and analysis of sweat using conventional wrist-strapped devices and iontophoresis can be cumbersome, particularly for infants with fragile skin, who often have insufficient sweat production. Here, we introduce a soft, epidermal microfluidic device (“sweat sticker”) designed for the simple and rapid collection and analysis of sweat. Intimate, conformal coupling with the skin supports nearly perfect efficiency in sweat collection without leakage. Real-time image analysis of chloride reagents allows for quantitative assessment of chloride concentrations using a smartphone camera, without requiring extraction of sweat or external analysis. Clinical validation studies involving patients with CF and healthy subjects, across a spectrum of age groups, support clinical equivalence compared to existing device platforms in terms of accuracy and demonstrate meaningful reductions in rates of leakage. The wearable microfluidic technologies and smartphone-based analytics reported here establish the foundation for diagnosis of CF outside of clinical settings.
One Sentence Summary:
A soft, wearable microfluidic platform collects and quantitatively analyzes sweat biomarkers to improve the diagnosis of cystic fibrosis.
Introduction
Cystic fibrosis (CF) is among the most common life-shortening genetic disorders, affecting 1 out of every 3,300 births in the United States and 70,000 people worldwide(1, 2). CF arises from mutations to the cystic fibrosis transmembrane conductance regulator (CFTR), an essential regulatory epithelial chloride channel in the sweat glands, lungs, intestines, pancreas, and kidneys(3). With over 2000 CFTR mutations identified to date(2), individuals with CF exhibit wide variability in the presentation and severity of clinical symptoms, such as chronic pulmonary infection, progressive loss of lung function, and pancreatic insufficiency(2, 4, 5). Clinical treatment involves complex, symptomatic therapy plans based in centers accredited by the Cystic Fibrosis Foundation (CFF) (6). Treatment efficacy depends primarily upon the age and mode of diagnosis as well as the overall quality of care(1, 4, 5). Although recently developed molecular therapeutics that target the basic CFTR defect have substantial potential(7), current pharmacological agents can only alter rather than reverse disease progression(8–12). As such, early diagnosis and management of CF progression continues to be critically important for patients with CF (5, 12).
Initial diagnosis in the United States and other developed countries is based on newborn screening using dried blood spots. This typically involves measurement of immunoreactive trypsinogen (IRT), a pancreatic protein that is elevated in newborns with CF, followed by CFTR mutation testing in infants with elevated IRT(2, 5, 6). This test captures almost all infants with CF, but it suffers from several limitations including a high false positive rate(2, 13); an inability to ascertain rare CFTR mutations, deletions, and duplications(6); and, in the case of DNA-based mutation testing, poor sensitivity in detecting mutations in infants from ethnic and racial minority groups(14). These limitations necessitate the use of quantitative sweat testing to confirm a CF diagnosis even in cases where only 1 CFTR mutation is found (often indicating a heterozygote carrier); in some regions, a very high IRT concentration is considered a positive screening test. Elevated sweat chloride is a robust indicator of the loss of CFTR function that is independent of the type of mutation (15) and remains the gold standard for diagnosis of CF. As a result, quantitative evaluation of chloride in sweat represents the only method for testing CFTR function that is widely available in accredited care centers, as approved by the US Food and Drug Administration (FDA) and other regulatory agencies(16) and confirmed by recent CFF guidelines(17).
Developed almost 60 years ago(5), testing involves stimulation of sweat glands by the cholinergic agonist pilocarpine, passed transdermally by iontophoresis. There are two accepted approaches for sweat collection: (i) the traditional Gibson-Cooke (GC) method, introduced in 1959, that uses gauze pads (18) and (ii) a more modern technique, introduced in 1986, that relies on coiled tubes in plastic housings (Macroduct; MSCS, ELITech Group) (19). Both schemes use pilocarpine iontophoresis to stimulate sweat production followed by a 30-minute collection period. A coulometric chloridometer enables quantitative analysis of the collected samples. In practice, the collection of sufficient volumes of sweat for analysis can be challenging—especially in infants(20–25). Clinical and Laboratory Standards Institute (CLSI) guidelines specify the collection of at least 15 μL of sweat within a 30-minute time period for accurate analysis using the MSCS(6). An insufficient sweat volume is reported as “quantity not sufficient” (QNS). A recent survey of certified CF centers indicates difficulty in achieving a QNS rate of <10% as stipulated by CFF guidelines for infants in the first three months of life. Some reported QNS rates reach values of 40%, with poor mechanical sealing of the MSCS to the skin and cumbersome extraction protocol being primary contributing factors (2, 5, 20, 22, 25, 26).
Despite systematic quality improvement efforts and modest center-specific decreases in QNS instances, insufficient sweat collection remains the most common issue in cystic fibrosis diagnostics(22). Promising diagnostics use alternative analysis approaches(27) and form factors(28) to reduce the required volume of sweat. Nevertheless, high failure rates(29) and poor performance in clinical trials(30) prevent widespread adoption. The additional requirement of laboratory-scale analytics tools and controlled environments for evaluation further limit their utility in remote settings or in the home(27, 31–33). A system for simple and rapid sweat collection and chloride analysis, preferably within the collection device itself, in a manner that bypasses these drawbacks represents a foundational unmet need for the CF community.
Emerging classes of bio-integrated sensors(34), a type of wearable technology characterized by the noninvasive, intimate integration with the curved surfaces of the body, offer the potential to surmount these limitations in sweat testing. A recent demonstration(35) of a wearable electrochemical sensor provided localized sweat stimulation and electrochemical analysis via a single battery-powered platform for real-time, in situ measurement of sweat chloride. Other examples rely on commercial iontophoresis systems with instrumented collection platforms that minimize analytical sweat volume requirements through alternative quantification methods such as those based on conductivity(36), potentiometry(37, 38) and/or fluorimetry(39, 40). Although successful in minimizing sweat collection requirements, these platforms rely on complex analytical techniques not accepted by established clinical guidelines(6). Challenges that arise from various calibration procedures, extended sensor stabilization times, individual sensor variability, and need for complex battery-powered electronic circuitry(33, 35, 38) represent fundamental constraints. Recent work offers a path to circumvent these limitations in devices that leverage networks of embedded microfluidic channels in soft, elastomeric substrates for the passive capture, storage, and quantitative analysis of sweat(41–46). Demonstrations of these epidermal microfluidic devices (“epifluidic” devices) utilize the natural pressure generated by the sweat glands(47) to guide the flow of sweat through sophisticated channel geometries(48–50), colorimetric reagents(49, 51), and wireless (e.g. battery-free) integrated sensors for real-time(48, 52) and time-sequenced analysis(51) of sweat biomarkers in a variety of environments without risk of evaporation(53, 54).
Here we introduce a soft, wearable device that collects and analyzes sweat via an intimate skin-compatible microfluidic construct that operates via pilocarpine iontophoresis. This epifluidic device (“sweat sticker”) uses a newborn-safe adhesive as a skin interface and an optimized multi-layer geometry to gently but tightly seal to the epidermis, supporting near-perfect efficiency in sweat collection without leakage. Real-time image analysis for colorimetric chloride-based chemical reagents allows for quantitative readout of chloride concentrations directly on the sticker, using digital image capture with a smartphone. Validation studies involved patients with CF and healthy control subjects of varying ages, with direct comparisons to sweat collection performed using the MSCS method and to chloride analysis using coulometric chloridometers. Our results support clinical equivalency in accuracy and demonstrate substantial reductions in rates of QNS. These technologies establish the foundations for a low-cost wearable platform for diagnosis of CF in patients.
Results
A representative device consists of a sealed network of microfluidic channels and reservoirs for sweat collection and chemical analysis in an overall circular geometry, designed to facilitate highly efficient capture of sweat over a region of the skin stimulated by pilocarpine iontophoresis (Fig. 1A). The soft mechanical properties, the thin (~1 mm), flexible layout and the small size of the device facilitate attachment onto various body locations (e.g. forearm, thigh) for both infants and adults. The construction involves three layers of low modulus (1–2 MPa) silicone elastomers (polydimethylsiloxane, PDMS) that define the microchannel structures. The physical properties enable a zero-pressure, fluid-tight interface to the skin via a medical-grade, irritation-free, FDA-cleared gentle skin adhesive. Laser-patterned openings define inlets in the skin-facing side of the device to allow sweat to enter the system, driven by the natural pressures created by the stimulated glands (~ 3 kPa). To optimize sweat collection, the device incorporates patterned adhesives that allow sweat capture in the collection area while maintaining robust adhesion. The collection surface area is identical to the stimulation area (28 mm diameter region, defined by the dimensions of the iontophoresis electrodes) and corresponds to ~640 sweat glands at 104 glands per cm2 (55). As it enters the device, the sweat passes into three independent chambers defined by serpentine channels (Fig. 1B). Each chamber has a capacity of 47 μL. An embedded chloride-free, food-safe dye (located near the inlet) aids in visualization of sweat ingress during collection. The “sweat sticker” nomenclature and inclusion of child-friendly thin-film graphical overlay (250-μm thickness, Fig. 1, A and B) represent design choices intended to minimize anxiety in pediatric patients. Motivated by the CARE principles (Choices, Agenda, Resilience, Emotional support) (56), this user-friendly strategy mitigates uncertainty and offers comfort during sweat testing by reframing a “sweat collection device” into a familiar and safe concept (i.e., a sticker). The MSCS serves as a comparative reference device for sweat collection (Fig. 1C), where application to the skin involves a band or disposable tourniquet to apply sufficient pressure to form an adequate seal between the skin and the rigid, plastic housing that encloses the coiled collection tube. Figure 1D illustrates the operation typically used with MSCS devices during study protocols. Examples of MSCS failure modes appear in fig. S1.
Fig. 1. Sweat sticker design and function.
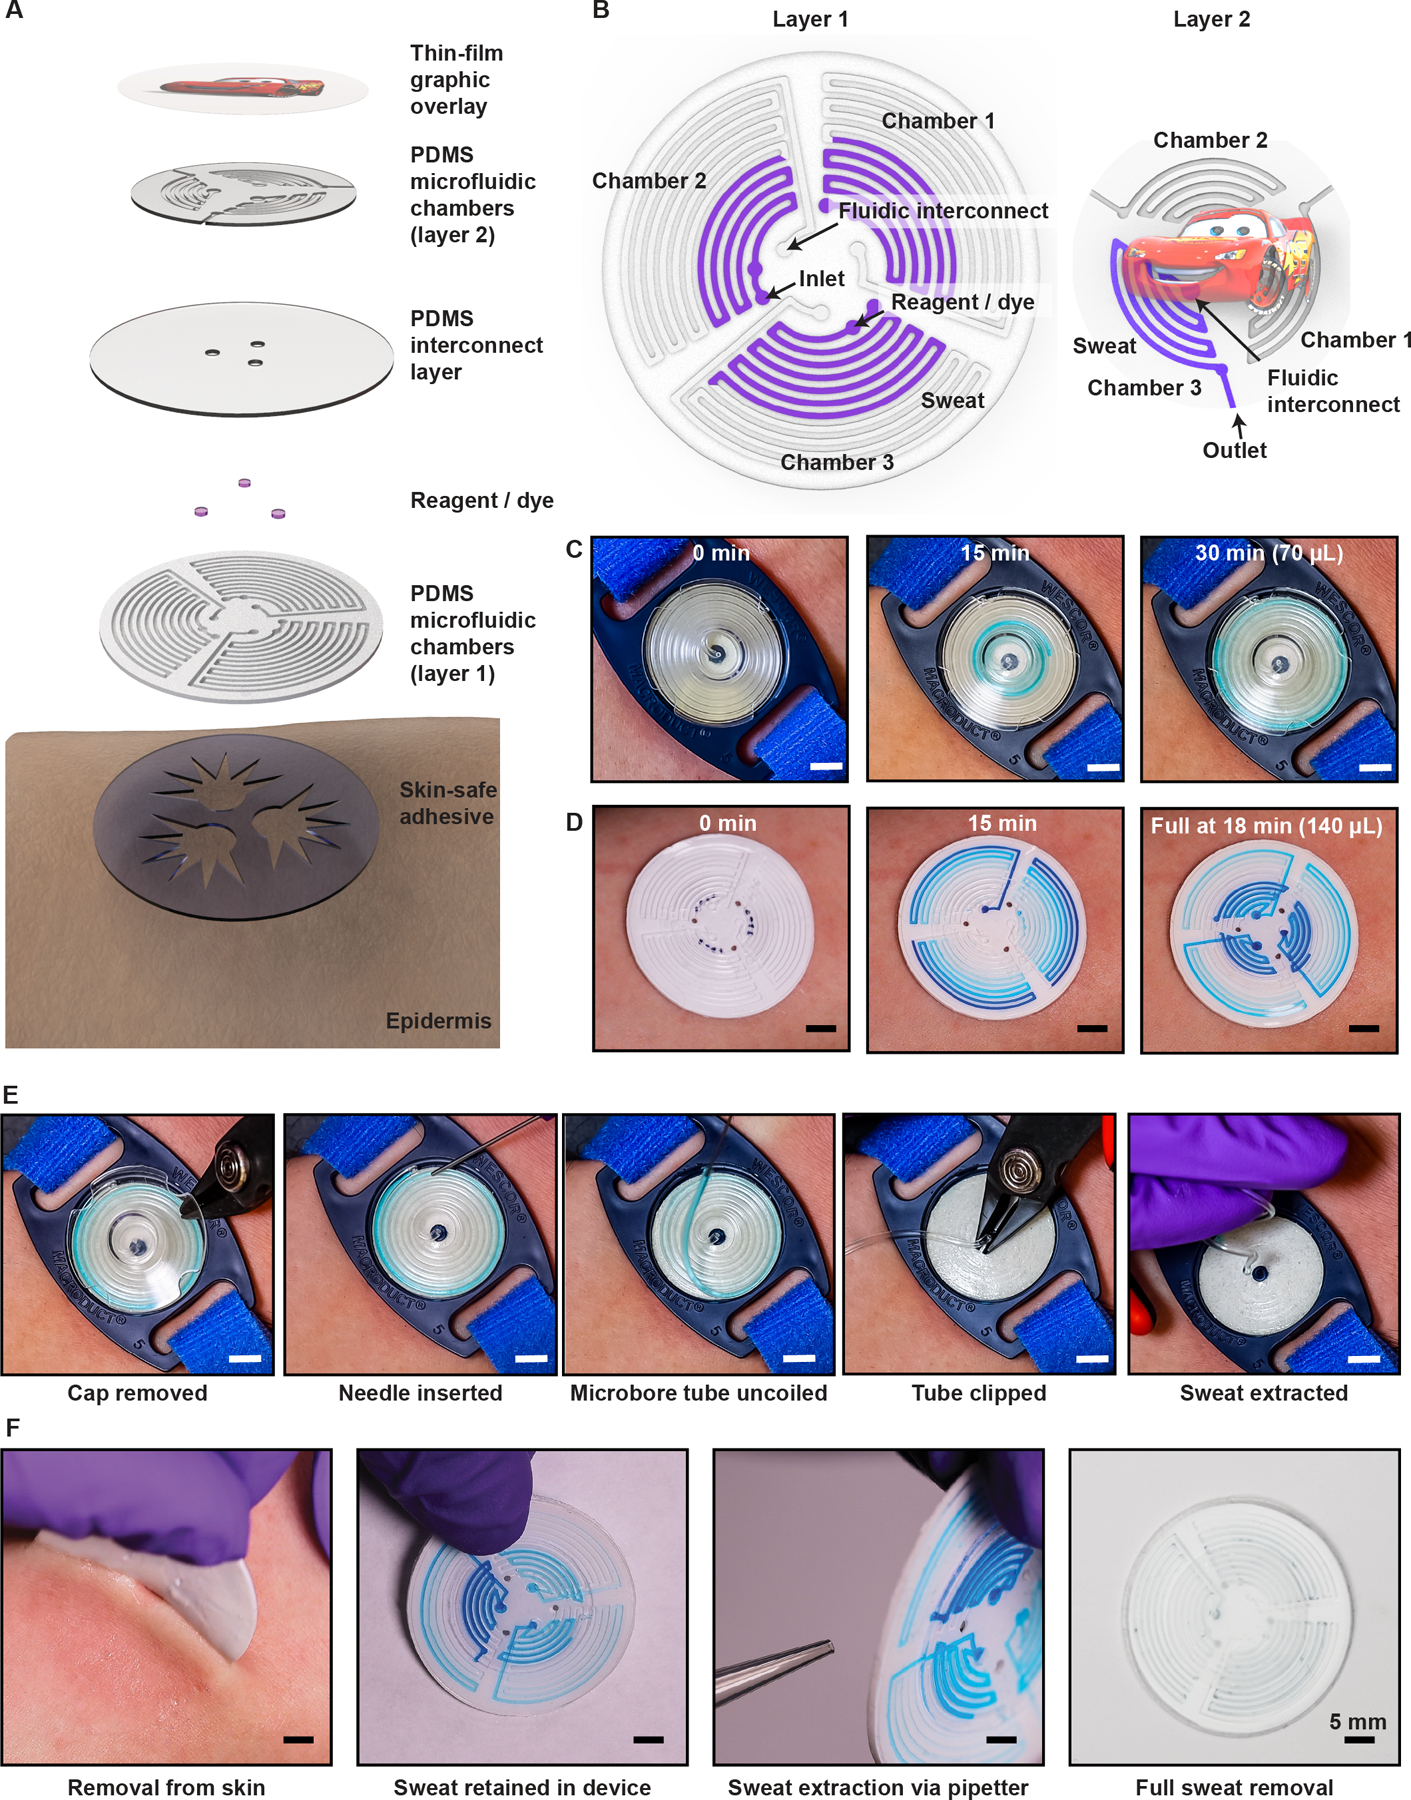
(A) Exploded view illustration of the device, highlighting key layers. (B) Microfluidic channel geometry. (C) Optical images of the clinical standard device for sweat collection (MSCS) on the arm after pilocarpine iontophoresis. The guideline-specified collection time for sweat (light blue) is 30 minutes. (D) Images of the epidermal microfluidic device (sweat sticker) on the contra-lateral arm after pilocarpine iontophoresis. (E) Optical images of removal of the protective cover of the MSCS, exposing the microbore tubing to permit insertion of a blunt-tip needle. Positive pressure from the needle (and syringe) ejects sweat from the tubing into a microcentrifuge tube (not shown). (F) Removal of sweat sticker from the skin after the collection period. Full extraction of sweat occurs via application of negative pressure using a 1-mL laboratory pipetter. Transfer of the sweat sample into a microcentrifuge tube (not shown) follows this extraction step. Scale bars, 5 mm.
A key design consideration for sweat-monitoring devices is the efficacy and ease of sweat extraction to facilitate measurement by the guideline-specified process. Sweat must be fully extracted from the device and the extraction mechanics should promote ease of operation while eliminating sources of contamination. At the conclusion of a traditional sweat test, the technician must perform a multistage, high dexterity procedure (Fig. 1E) to extract collected sweat from the MSCS while the device remains attached to the subject and transfer the sample to a container for chloride quantification. In contrast, the sweat sticker can be removed from the subject’s arm to facilitate extraction (Fig. 1F). The central location of the collection inlets (i.e. openings to skin) are easy to access upon sticker removal, to minimize sweat leakage. A standard pipette (1 mL) enables sweat extraction from the device. The device-layer inlet size (1.2-mm diameter) is smaller than the pipette opening (1.5±0.1 mm diameter), thereby allowing for a strong, temporary water-tight and air-tight seal for application of negative pressure sufficient to fully extract sweat from each chamber, independent of filled volume. The sweat extraction rate depends linearly on the magnitude of negative pressure applied (set volume) and rate of draw on the pipette. Extracted sweat from all three chambers yields a total sweat volume approaching 140 μL.
Initial sweat sticker design optimizations yielded a multi-layer construct (Fig. 1, A, B, and D) to: (i) increase sweat storage volume, (ii) minimize volume changes during mechanical deformation, and (iii) eliminate puncture risk during sweat extraction. A potential sweat test failure mode could occur in overfilling the collection device, resulting in sample contamination. Clinical guidelines specify the collection area, which restricts the overall size and collection volume of a single-layer device. An increase in device thickness accommodates greater collection of volume (proportional to channel depth). The addition of a tiered, multi-layer design preserves collection volume and the conformal skin interface (Fig. 2). This design reinforces the sticker, and thereby reduces risk of overfilling or ejecting collected sweat from the inlets during removal from skin (movie S1) and puncture of the device with a pipette tip during sweat extraction.
Fig. 2. Device characterization and benchtop testing.

(A) Images of a device (left) while bent (center) and twisted (right). (B) Characterization of bending effects on performance in sweat collection. Images of the sticker attached to a flat plate (top) and phantoms of an adult (middle) and infant (bottom) arm. (C) Graph of repeat filling tests (N = 3) at fixed physiological pressures (2 kPa) via a pressure displacement pump for a flat surface and phantoms of an adult and infant arm. The results show consistent, linear filling behavior. Volumes measured by image processing indicate a standard deviation of 0.1 μL. (D) Magnified region of the graph from Fig. 2C. Time error bars represent standard deviation of N = 3 measurements. Volume error bars omitted for clarity. Scale bar, 5 mm.
The soft, flexible mechanical properties of the device (Fig. 2A) provide gentle, conformal coupling to the skin of neonatal and pediatric patients. Phantom arm assemblies (Fig. 2B) similar in size to the arms of average adults and infants demonstrated the dynamics of sweat ingress as a function of bending radius of the device. Microbore tubes (1.2-mm internal diameter, ID) integrated within the phantoms connect to pumps that simulate sweat production. Measurements of sweat rate are important to ensure adherence to established testing protocols (minimum of 1 g/m2/min; equivalent to 0.5 μL/min for MSCS)(57). The geometries and layouts of the microchannels must not restrict fluid transport phenomena across physiological ranges of sweat release. Replicate data (N = 3) for fluid volume versus time (normalized by time to completion) for devices at three different radii of curvature are shown in Fig. 2C. Measurements of flow at a constant pressure (~2 kPa, comparable to that produced by eccrine glands)(47) maintained by a pressure displacement pump exhibited negligible variation associated with microchannel geometries explored here (Fig. 2D), consistent with constant flow rates and absence of fluidic resistance. This observation applies both for flows induced by pressure displacement (Fig. 2C) and syringe-based pumps (fig. S2).
Clinical sweat testing with the sweat sticker
A clinical pilot study in patients with CF and healthy controls conducted at the Cystic Fibrosis Center at the Ann & Robert H. Lurie’s Children’s Hospital (Chicago, IL) demonstrated the clinical utility of this platform as a sweat collection and analytics system. Table 1 summarizes the participant demographics and sample characteristics of the study cohort (N = 51). Bilateral sweat testing enabled comparison of collected sweat volume by the sweat sticker and the clinically established MSCS. In both cases, a pilocarpine iontophoresis process initiated the sweat response.
Table 1.
Study population demographics.
| This study | LeGrys Study 1(58) | LeGrys Study 2 (58) | ||
|---|---|---|---|---|
| N | 51 | 28 | 100 | |
| Age | ||||
| Mean | 23 | 29 | 24 | |
| Range | 2m – 51y | 18y – 44y | 8y – 54y | |
| 0 to 6m | 3 | – | – | |
| 7m – 18y | 11 | – | – | |
| +18y | 37 | – | – | |
| Gender | ||||
| Female | 25 | 18 | 48 | |
| Male | 26 | 10 | 52 | |
| Condition | ||||
| CF | 33 | 28 | 100 | |
| Non-CF | 18 | – | – | |
| Number of samples | ||||
| Total | 102 | 292 | 687 | |
| Left arm | 51 | 146 | 346 | |
| Right arm | 51 | 146 | 341 | |
| Collected volume (Mean ± SD) | ||||
| MSCS | 58.4 ± 24.1 μL | 57 mg | 53 mg | |
| Sweat sticker | 73.6 ± 35.2 μL | – | – | |
| Range | ||||
| MSCS | 7.2 – 94.5 μL | 17 – 105 mg | 15 – 110 mg | |
| Sweat sticker | 17 – 133 μL | – | – | |
| QNS occurrences | ||||
| MSCS | 3 (5.8%) | 14.3% (4/28) | 13.0% (100) | |
| Sweat sticker | 0 | – | – | |
Figure 3A shows the average sweat volume and QNS rate for the sweat sticker and the MSCS, with additional data from four recent large cohort studies. The mean sweat volume collected by the sweat sticker was 74 ± 35 μL, whereas the mean MSCS sweat volume was 58 ± 24 μL, consistent with previous reports(16, 20, 58, 59), with age-stratified individual volumes shown in fig. S3. The improvement in sweat volume collection with the sweat sticker as compared to the MSCS was statistically significant (Wilcoxon test, W = 1603.5, P = 0.02), with the matched-pair average approaching 33% for sweat volume (P = 0.05). Three instances of QNS occurred with the MSCS tests (5.8%); in contrast, no such instances appeared with the sweat sticker (0%) in this study. Furthermore, the MSCS QNS rate is below estimates reported in previous studies(16, 20, 58, 60) and comparable to the routine QNS rate of this clinical site (5%) (21). Figure S4 reports sweat volume from ten consecutive bilateral sweat tests (MSCS on both arms) performed by trained staff during routine clinical CF screening, as another point of comparison. Four collection events resulted in QNS.
Fig. 3. Clinical study inclusive of patients with CF.

(A) Results of collected sweat volume from a clinical pilot study using the microfluidics sticker (blue data, N = 51) relative to the MSCS in both this work (difference is statistically significant, Wilcoxon test, W = 1603.5, P = 0.02; matched-pair average difference ~33%, P = 0.05) and published studies. Reported QNS rates (%) appear as red bars (red bars). Reported volumes of collected sweat appear as boxes color-coded to this study (blue) or published studies (black). Specific studies referenced are: LeGrys 2017(58), LeGrys 2018(16), De Boeck 2017(59). (B) Equivalence plot for sweat chloride estimates from the sweat sticker versus the MSCS. (C) Bland-Altman plot of sweat data shown in (B). Blue line indicates the mean, red dashed lines indicate 1.96 SD. (D) Histograms of sweat volume from collection methods across three age groups (infants: 0 – 6m, N = 3; pediatrics: 7m – 18y, N = 11; and adults:+18y, N = 37). Difference in mean volume collected for adult age group is statistically significant (Wilcoxon test, W = 151, P = 0.03).
A calibrated chloridometer determined the chloride concentrations of the collected samples in both cases. The equivalence chart in Fig. 3B shows excellent correlation (Pearson’s r = 0.99; N=51) between the paired bilateral tests for both population groups. A Bland-Altman plot in Fig. 3C supports this result, indicating strong correlation for sweat chloride values < 80 mmol/L. The increase in variability above 80 mmol/L likely follows from the increase in the coefficient of variation of the commercial chloridometer at these elevated chloride concentrations (1.02% at 100 mM).
For age stratification analysis, the study cohort was classified into three groups: (i) infants (0 – 6m), (ii) pediatric (7 m – 18 y), and (iii) adult (+18 y). The sweat sticker showed enhanced performance in collected sweat volume across all age groups as compared to the MSCS (Fig. 3D). Wilcoxon analysis of the adult age group showed a significant increase in collected volume by the sweat sticker (W = 151, P = 0.03). QNS events occurred in both the pediatric and adult groups for the MSCS, but not the sweat sticker. Age-stratified Bland-Altman plots further support the superior performance of the sweat sticker (fig. S5).
Figure 4 offers representative examples of the sweat stickers and MSCS devices worn (observed at the conclusion of testing) by pediatric (Fig. 4A) and infant (Fig. 4D) participants. Fundamental design improvements evident in the sweat sticker as compared to the MSCS include method for device attachment (adhesive Fig. 4B; tourniquet, Fig. 4C), sweat visualization, patient comfort (fig. S6), and child-friendly aesthetics. Fig. 4D illustrates the conformal sweat sticker interface.
Fig. 4. Photographs of device operation.

(A) Pediatric subject at the conclusion of a sweat test with magnified insets that show volumes collected by the (B) sticker and (C) the MSCS prior to sweat extraction. (D) Sweat sticker on an infant subject at the conclusion of a sweat test. This evaluation involved a nearly complete filling of the device. Scale bars: (A) 10 mm, (B)-(D) 5 mm.
Multimodal sweat sticker with integrated chloride analysis
A configuration of the sweat sticker (similar in form to Fig. 1A) that includes an integrated colorimetric chloride assay (Fig. 5A) allows for in situ analysis, without need for sweat extraction or measurement with external instruments. In contrast to conventional electrochemical methods, use of a colorimetric approach enables in situ sweat chloride analysis with a completely passive, battery-free form factor. The reagent silver chloranilate, inserted into the microchannel structure of the device, reacts with the chloride in sweat to produce a color response that is proportional to chloride concentration (Fig. 5B). The device in this case includes a thin (100 μm) transparent film of a specified color to enhance the signal-to-noise ratio of colorimetric readout of chloride concentration. The film contains three 1-mm diameter regions, each with an opaque PANTONE color swatch pattern as a color balance reference. Assay imaging with a digital single-lens reflex camera (dSLR) camera enables facile conversion from standard Red Green Blue color space (sRGB) to CIE (International Commission on Illumination) LAB color space for color extraction and image processing, as shown in fig. S7. CIELAB color space expresses color in three components: lightness (L) from black (0) to white (100); the amount of green to red (a); and the amount of blue to yellow (b).
Fig. 5. Colorimetric chloride assay analysis.

(A) Exploded view illustration of the sweat sticker with an integrated colorimetric chloride assay. A single-layer device comprises three independent microfluidic collection chambers and an overlay (either colored or clear; shown in green in illustration). (B) An example set of optical images show the progressive color shift of the chloride assay in response to increasing chloride concentration (in water). Clinical ranges for CF diagnosis indicated for reference. (C) Color measurements of the assay images in (B) without a color overlay (clear) shown in CIELAB color space (A and B components). Color overlays (green, blue, red) shift the measured color response. (D) Calibration chart of chloride concentration vs. chroma (C*) for the color and clear overlays with corresponding power-law fits. (E) Comparison of colorimetric assay performance (with and without overlays) to chloridometer measurements for three clinical chloride standards. Assay measurements are from calibration fits using chroma (C*, solid) or a* values (checked).
Investigations of blue, red, and green colors helped to identify an effective color for use as an overlay. A clear overlay served as a reference. Fig. 5C displays the color shift that results from the addition of a color overlay as a function of CIELAB a* and b* color values. Each value corresponds to the average of the evolved color of a reaction of silver chloranilate with solutions of known sodium chloride concentrations (N = 3 independent solutions). Fig. S8 shows the color variation for one solution at the individual pixel level within the region of interest (ROI) that comprises one of the three measurements. Converting a* and b* color values to chroma, defined as C* = (a*2+b*2)1/2, yields color-overlay specific calibration curves by a power-law relation (Fig. 5D). Sampling colors in a device-independent color space, such as CIELAB color space, provides a facile method for color comparison. Fig. S9 further highlights this device independence as analysis of iPhone and dSLR images yielded equivalent measurement values.
Three commercial clinical sweat chloride standards (ELITech Group) corresponding to the prescribed CF diagnostic ranges served as analytical benchmarks (low standard: 23 mM; intermediate standard: 49 mM, high standard: 100 mM). Difference plots for each standard (Fig. 5E) show the analytical performance for each color overlay and the chloridometer with the externally defined valid measurement range (red dashed lines). Results also compare the performance of the color-analysis proposed here (calibration fit using C*) with a method used in previous work (calibration fit using a*). Many colorimetric assays (such as silver chloranilate) contain a “white point measurement” to indicate the absence of an analyte (i.e. 0 mM chloride). The utilization of white in a colorimetric assay is problematic when attempting to distinguish between subtle variations in color and thus analyte concentration as white is defined as L* = 100, a* = 0, b* = 0. This effect propagates uncertainty into colorimetric assay analysis at low concentrations. As Fig. 5E highlights, the results show that the green overlay minimizes the difference in measured chloride values with respect to the chloridometer. All methods lack agreement with the expected value for the low standard reference solution; however, the green overlay curves and a* clear overlay curve are within accepted values of the chloridometer. The C* fit offers the best agreement to the reported chloridometer values across the range of measured chloride concentrations.
A human subject pilot study comprising patients with CF (N = 2) and healthy subjects (N = 3) explored the clinical relevance of this approach to in situ sweat chloride measurements. Each chamber (clear overlay, green overlay, chloridometer control) of the sweat sticker captured an independent sweat sample for analysis upon completion of sweat collection (Fig. 6A). C*-based calibration curves converted color values to chloride concentrations. The values determined with the green overlay agreed closely (within 1 SD) with chloridometer measurements for all members of the study cohort (Fig. 6B). The values measured in the absence of a color overlay were similar for study member P5 but deviated from chloridometer values for subjects with elevated sweat chloride concentrations. These findings suggest that the color analysis approach introduced here can enhance the measurement accuracy of a colorimetric chloride assay to yield values comparable to established clinical approaches.
Fig. 6. Pilot study of integrated sweat sticker.

(A) Optical image of a body-worn sweat sticker after a 30 min collection period. Violet chambers contain the colorimetric assay and the blue chamber is a control sample for analysis using a commercial chloridometer. Scale bar, 5 mm. (B) Comparison of sticker performance in human subject pilot study (N = 5).
Discussion
The results presented here demonstrate that sweat sticker devices (N = 51) and associated approaches for colorimetric chloride analysis (N = 5) can address clinical requirements, with advantages over the current standard of care by potentially reducing the QNS rate, improving the comfort and experience for the patient, and enabling accurate measurements outside of hospital or clinical laboratory settings. These outcomes rely on optimized microfluidic designs, soft device mechanics, gentle adhesive interfaces, and advanced image processing methods. By establishing conformal, water-tight interfaces to the skin, the device offers: (i) an increase in collection volume compared to MSCS, for otherwise similar conditions; (ii) improved resistance to motion-induced collection failures; and (iii) facile processes for mounting the devices on the skin and extracting samples of sweat from them. Our clinical studies demonstrated that these engineering features led to improved outcomes, compared to those possible with the MSCS platform. For example, the sweat sticker successfully addresses insufficient sweat by enhancing collected sweat volume via the certified stimulation methods used in CF diagnostic testing centers. In all testing, both for patients with CF and healthy subjects, the sweat sticker adhered robustly and maintained conformal attachment without sweat leakage. Furthermore, the zero-pressure skin adhesive interface avoided transient deep epidermal indentations that occur with the high-pressure interface utilized by the MSCS. The additional ease of use and handling for the clinical staff further minimizes common pitfalls of contamination and insufficient volumetric extraction observed in post-test sample processing. This clinical demonstration of sufficient sweat collection establishes the foundation for an integrated collection and chloride analysis platform.
Integrated colorimetric analysis
The ability to measure chloride concentrations in situ during and immediately after collection represents a powerful feature of the technology that has the potential to allow diagnostic CF screening outside of approved CF centers. The consequences are wide ranging, especially in the context of the recent emergence of CFTR modulator therapeutics for which sweat chloride could serve as a biomarker for assessing and monitoring treatment efficacy(57, 61–63). This potential appears here as study members with CF and sweat chloride concentrations below 100 mM were on CFTR modulators at the time of the tests. Sweat stickers offer facile, passive methods for assessing sweat chloride values on a regular, routine basis, thereby advancing the utility of sweat chloride measurements from a clinical diagnostic to a mechanism for frequent monitoring of disease progression.
The capture and analysis of sweat chloride concentrations via a smartphone, with sufficiently high accuracy, represents a key advance over previous work(41, 43, 44, 46, 49, 51–53). When coupled with enhanced color analysis methods reported here, colorimetric chemical reagents offer performance comparable to that of commercial chloridometers.
While the analytical range of the chloride bioassay is suitable across the key diagnostic windows for CF (< 30 mM, CF unlikely; 30 – 60 mM, intermediate; 60 mM, CF likely), previous work(49) lacked the accuracy and precision at low concentrations necessary for clinical utility. The evolution of the dark violet color of the assay (with increasing chloride concentration) is stark at high sweat chloride concentrations; however, resolving slight variations, especially at lower concentrations, presents difficulties via optical imaging. In the context of CF, eliminating this deficiency is critically important to ensure accurate diagnosis and eliminate the profound consequences of a false positive or negative test. Our image processing strategy improves colorimetric assay accuracy by eliminating the white point by hue shift through a prescribed color overlay with a contrasting color. The absence of a color overlay introduces measurement error into the calibration chart yielding magnified inaccuracies in reported sweat chloride values, typically at either low or high concentrations, as observed for the three standard controls. Optimization of the overlay color elongates the relevant detection range of the assay to increase the range of distinguishable color measurements.
Although several methods exist to relate measured differences in color in CIELAB space to assay concentration(49), C* offers a single value based upon both measured a* and b* color values suitable for use in a calibration curve. In combination with a robust color correction process and a hue-shift analytical approach, this method achieves an enhanced degree of accuracy in quantifying chloride concentrations across the physiological range of interest, with performance comparable to established clinical methods (chloridometer).
Study limitations
Although this study demonstrates substantial improvements in volume of sweat collected by a statistically significant margin in adult populations, the sample sizes for younger age groups could be expanded in follow-up investigations. These studies could also increase the range of CF conditions, birth weights and environmental factors (e.g. hydration state). These latter effects may contribute to high inter-subject variability in the amount of sweat volume captured, as demonstrated by the large standard deviations (MSCS SD = 24.15 μL, sweat sticker SD = 35.19 μL) and consistent with expectation based previous studies (16, 58, 64–68). The variability in sweat volume likely contributes to the lack of differences in the age-stratified analysis for the childhood and adolescent groups, thereby further emphasizing the need for larger subsequent studies.
Pathway to clinical validity for colorimetric analysis with smartphone
The CLSI guidelines specify coulometric titration with a chloridometer as the only recommended chloride measurement method for CF diagnostics(69). Specific concerns regarding the absence of systematic validation of ion-selective performance and decreased sensitivity at lower chloride concentrations could compromise measurement accuracy and precision. An alternative sweat chloride and collection quantification method using the sweat sticker and digital image analysis thus requires rigorous verification and validation, and approval by a regulatory agency.
This feasibility study and the clinical equivalence of the colorimetric sweat sticker supports further investigation to establish full clinical validity. Although the accuracy of the sweat sticker matches the laboratory-grade diagnostic technique in this study, additional studies in uncontrolled environments will be needed for real-world deployment and data capture. Physical variations in device color overlay or non-uniform lighting (shadows) can adversely affect calculated fits, which in turn, could affect accuracy. Risk mitigation strategies include inclusion of color reference markers, utilization of a custom smartphone application for imaging and analysis, and employing rigorous manufacturing quality control protocols.
Although this sweat chloride assay has been validated in athletic performance applications through comparisons to high pressure liquid chromatography (34, 43, 49, 53), careful validation in a large clinical trial could provide statistical evidence in support of analytical equivalence for patients with CF. Specifically, further studies must demonstrate (i) assay accuracy, (ii) assay precision, (iii) measurement interval, and (iv) limit of quantitation per the CLSI evaluation protocol(30).
The emergence of CFTR modulator therapeutics represents an inflection point for sweat chloride measurements in CF patient care. Sweat chloride tracking has transitioned from a biomarker exclusive to initial screening and diagnostics to a long-term reference in a manner similar to blood glucose for diabetic patients. This raises the critical need for low-cost, quantitative sweat chloride wearable sensors suitable for real-time and daily assessment of CF biomarkers.
Utilization for diagnostics and disease management
The requirements imposed by calibrated analytical equipment, access to centralized laboratory facilities, and need for trained technicians restrict the use of conventional MSCS diagnostic testing to CFF accredited clinics. This can result in considerable hardship as many rural locations and some U.S. states lack access to such centers. In contrast, the results presented here favor rapid and decentralized modes of deployment that could increase clinical diagnostic access and expand the breadth of sweat testing utility. As fig. S10 illustrates, these modes can be classified according to three categories: (i) diagnostics, (ii) screening, and (iii) daily management of CF. The ease of use of the microfluidic platform supports deployment in both clinical and free-living (home) environments. For clinical applications, the device could support collection alone (equivalent function to MSCS) as well as integrated in situ chloride quantification (equivalent function to MSCS and chloridometer), using traditional techniques for sweat stimulation, pending clinical trials to validate the efficacy and utility compared to these predicate devices (30). Extending these applications to at-home sweat chloride monitoring without requiring pilocarpine iontophoresis could provide insights in CF drug efficacy and patient quality of life. As shown in recent work, thermal exposure in a warm bath or shower is sufficient to induce eccrine sweat for purposes of monitoring biomarkers for chronic kidney disease(51). A similar sweat induction mechanism has the potential to eliminate the need for pilocarpine iontophoresis. A key consideration is establishing sweat composition and rate equivalence between cholinergic and thermal stimulation. Initial work(51) suggests a warm shower supports sufficient sweat rates (10-min shower: 2 μL/min sweat rate) exceeding the ~0.5 μL/min minimum sweat rate specified for the clinical CF sweat test. If validated, such an approach could enable the broad use of the sweat sticker and smartphone application as a daily or weekly management tool for clinical trials for drugs and disease management strategies. Estimates suggest per device costs, when produced at scale, of less than $5 USD, thereby allowing for single-use strategies with potential for considerable savings relative to costs of clinical sweat tests [ranging from $200 to $250 USD at most CF centers(70)].
Implications for diagnosis and management of CF
High QNS rates in neonates with positive CF newborn screens motivates the work reported here. Minimizing the QNS rate while enabling remote tracking of sweat chloride will have strong positive effects on the management of CF, as a delay in CF diagnosis and management may have profound negative consequences on the pulmonary function and the quality of life of patients(23). The sweat sticker and image processing technologies introduced here have the potential to reduce QNS rates while enabling CF management at home, with implications across neonatal, pediatric, and adult patients.
Materials and Methods
Study design
The purpose of this study was to develop and demonstrate a soft, epidermal microfluidic device for use in collecting and analyze sweat for the diagnosis of cystic fibrosis. Patients were recruited from CF populations and from adult volunteers (control). The study was IRB-approved through the Ann & Robert H. Lurie’s Children’s Hospital (IRB #2018-1440). Briefly, patients with CF and healthy subjects were recruited (at random) from the Cystic Fibrosis Center at Lurie Children’s Hospital and through Northwestern University, respectively (time frame:1 year, number of subjects: 51, study power: 0.8078). Informed consent was obtained after the nature and possible consequences of the study was explained. The sweat tests were administered by trained personnel at Northwestern University and Lurie Children’s Hospital. Patient sweat tests followed established clinical protocols for sweat capture and analysis(71) using the Wescor Sweat Stimulator and Macroduct (MSCS, ELITech Group) as detailed in the materials and methods section of the Supplemental Materials. The pilot study (N=5) was conducted as part of the primary study whereby an additional cohort of adults were recruited (at random) from the same population to evaluate the performance of a sweat sticker with an integrated colorimetric chloride assay. Data collected in this pilot study is independently reported from the primary study (N = 51).
Sweat stimulation and analysis
A single measurement consisted of sweat stimulation via pilocarpine iontophoresis (~5 min, forearm) followed by sweat collection (~30 min), using either MSCS or the microfluidic sweat sticker. An alignment guide allowed for consistent placement of iontophoresis electrodes across different patients. A patient evaluation session involved two sweat measurements performed sequentially, one for each arm (left, then right), with the device and arm designation determined a priori. Patients were instructed to refrain from arm movement during MSCS sweat collection, as prescribed by clinic protocol, and instructed to move freely during the sweat sticker collection period. Sweat was extracted from the sweat sticker and MSCS at the conclusion of the collection period. Chloride measurements were then performed using a clinically certified ChloroCheck Chloridometer (ELITech Group, with a coefficient of variation of 1.02% at 100 mM). Details of the study population are provided in table S1 with individual patient data in table S2. Performance of the pilot study followed the same procedure. A photograph of the sweat sticker was recorded at the conclusion of the collection period prior to removal from the arm to enable quantitative analysis of the colorimetric chloride assay.
Microfabrication of microfluidic molds for layer-specific microchannel networks
Ultraviolet light exposure (420 mJ cm−2, Heidelberg MLA150) of a 10 μm-thick layer of negative resist (KMPR 1010, spin cast at 3000 RPM for 30 s, soft baked at 110 °C for 5 min, cooled to ambient at 15 °C min−1) on a silicon wafer (1.5 mm thickness, 100 mm diameter) followed by a soft bake (110 °C for 5 min, cooled to ambient at 15 °C min−1) and development (AZ 300MIF, 7 min) process formed the patterns for each mold. A deep reactive ion etching (DRIE) process (Plasma-Therm Versaline DSE, Plasma-Therm, Inc.) removed the exposed regions of the silicon wafer to a controlled depth (layer 1 mold: 400 μm, layer 2 mold: 300 μm). A spin cast thin film of polymethyl methacrylate (495 PMMA C6, MicroChem Corp., 4000 RPM, 5 min bake at 110 °C) served as a release layer to facilitate production of channel replicas in silicone via soft lithography.
Microfabrication of sweat stickers
The sweat sticker platform comprises three layers of micro-molded silicone (polydimethylsiloxane, PDMS, Dow, Inc.). Spin coating a layer of 20:1 PDMS (base to curing agent, Sylgard 184, Dow, Inc.), mixed in a planetary mixer (Thinky ARE-310; 30 s mix, 30 s defoam), on molds for layers 1 (200 RPM, 30 s) and 2 (350 RPM, 30 s) followed by flash curing for 5 min at 120 °C formed solid channel replicas. The addition of 3 wt% white silicone pigment (Silc Pig, Smooth-on) prior to mixing layer 1 PDMS yielded a uniform white background for sweat visualization and chloride concentration measurements. A similar process created interconnect layer blanks comprising a 20:1 PDMS layer (150 μm thick at 500 RPM, 30 s) on a laser-defined PMMA sheet (100 mm circle, 3 mil thickness). A CO2 laser cutting system (Universal Laser, VLS3.50) defined the outer diameter of the layer and the necessary openings to permit fluid transport between layers 1 and 2. A biopsy punch (1.2 mm diameter) formed the openings to the epidermis in layer 1 and a circular steel punch (20 mm diameter) defined the outer diameter of layer 2 and channel exits. Device assembly followed a logical progression. Adding 5 μL of chloride-free gel food dye (AmeriColor) at reservoirs near the ingress point of each chamber prior to assembly permitted visualization of sweat during device operation. Exposure of layer 1 and the interconnect layer to plasma from a corona wand (ElectroTechnic BD-20AC, 30 s) activated the surface to facilitate bonding upon lamination with applied pressure. Baking at 70 °C for 1 hr ensured complete interfacial bonding. Upon removal of the PMMA sheet, the same process enabled integration of layer 3 to the device with a circular steel punch (30 mm diameter) that defined the outer diameter of the completed assembly. Subsequent corona treatment exposure to the backside of the device ensured a permanent bond to a laser-patterned skin adhesive (3M 2475P, skin-facing; 3M 91022, device facing; 3M, Inc.).
Characterization of fill rate as a function of bend radius
Phantom arm assemblies for studies of flow used tubing [Tygon, ID = 1.5 mm, outer diameter (OD) = 3 mm] embedded in a 3D-printed model of an arm (Black Resin, Formlabs Form 2). A calibrated pressure displacement pump (Fluigent, France) controlled the pressure of water introduced into the system. Each measurement consisted of a “fill test” in which water at a fixed pressure (2 kPa) entered the device until full. Simultaneously, the progression of the fluid front was recorded using a camera (Canon 90D, Canon EF 100mm f/2.8 L USM lens) at 30 frames per second. Three separate phantoms reflective of different arms (infant, r = 15 mm; adult, r = 30 mm; flat/control) were used for the testing described above.
Colorimetric chloride measurements
Systematic reactions of silver chloranilate with solutions of artificial sweat (5, 10, 15, 20, 30, 50, 60, 80, 90, 100, 125, 135, 160 mM of NaCl) yielded reference solutions for establishing a colorimetric calibration curve. Imaging a sweat sticker filled with a reference solution with a DSLR camera (Canon 90D) under uniform illumination for each concentration formed a set of reference images. Four image sets were recorded corresponding to the color and clear overlays. A 24-color card (SpyderCHECKR Color Chart, Datacolor) enabled color correction of RAW images prior to image processing via a custom MATLAB script. Procedures for extracting and processing LAB color values appear in detail in the materials and methods section of the Supplemental Materials.
Preparation of sweat stickers for integrated chloride analysis required replacement of the sweat visualization dye with silver chloranilate and the addition of overlays (one clear, one green) to two chambers. The overlays comprised 1 mil PET (polyethylene terephthalate) transfer films with solid colors added by a laser printer (color calibrated, Canon ImageClass MX722). Human subject testing followed the previously described sweat testing procedure with replacement of the MSCS with a sweat sticker. Devices were removed upon the completion of the test prior to extraction of the sample and imaged as previously described. The concentration of the sweat chloride collected by the control chamber was measured using a ChloroChek Chloridometer (ELITech Group).
Statistical analysis
Data are presented with mean values and SD, unless noted in the figure caption. All statistical analysis of study data was performed using the R statistical language. Wilcoxon Rank Sum test (Mann-Whitney test) was used instead of Student’s t-test as it is valid for data from any distribution. Power-law curve fitting of measured colorimetric data was used to generate calibration curves for colorimetric sensing using MATLAB (v. 2020a, MathWorks, Inc.).
Supplementary Material
Acknowledgments:
This work utilized Northwestern University Micro/Nano Fabrication Facility (NUFAB) and the Pritzker Nanofabrication Facility, part of the Pritzker School of Molecular Engineering at the University of Chicago, which are both partially supported by Soft and Hybrid Nanotechnology Experimental (SHyNE) Resource (NSF ECCS-1542205), a node of the National Science Foundation’s National Nanotechnology Coordinated Infrastructure. A portion of this work was also performed in the University of California, Santa Barbara Nanofabrication Facility. The authors gratefully acknowledge the support of Larissa Rugg in assisting with study administration as well as Terri Laguna MD; Adrienne Savant, MD; Stacy Bichl, APRN-NP; Manu Jain, MD; Michelle Prickett, MD; Marc Sala, MD; and Joanne Cullina, APRN-CNS in facilitating patient access.
Funding:
We would like to acknowledge funding support provided by the Querrey Simpson Institute for Bioelectronics at Northwestern University. T.R.R. acknowledges additional support from startup funding from the University of Hawaiʻi, as a Junior Investigator from the National Institute of General Medical Sciences of the National Institutes of Health (P20GM113134), and the Hawaiʻi Community Foundation (Robert C. Perry Fund). This publication was supported by the National Institute on Aging of the National Institutes of Health under Award Number R43AG067835. We also acknowledge the in-kind study support from the Ann & Robert H. Lurie Children’s Hospital, Stanley Manne Research Institute, and Northwestern Memorial Hospital. We thank 3M, Inc. for providing access to the adhesive materials used in this work.
Competing interests:
T.R.R. and J.A.R. are inventors on patents and patent applications related to epidermal microfluidics, including applications in cystic fibrosis diagnostics (Patent “Thin, soft, skin-mounted microfluidic networks for detection and analysis of targets of interest in sweat,” # US 2020/0093416 A1 and Patent “Microfluidic systems for epidermal sampling and sensing,” # US 2020/0155047 A1). R.G., S.P.L., A.J.A., J.B.M., and J.A.R. are cofounders of Epicore Biosystems, a company that develops epidermal microfluidic devices. T.R.R. has a consulting and advisory relationship with Epicore Biosystems. The remaining authors are not aware of any affiliations, memberships, funding, or financial holdings that might be perceived as affecting the objectivity of this research.
Footnotes
Supplementary Materials
Materials and methods
Fig. S1. Examples of MSCS failure modes observed during clinical testing.
Fig. S2. Linear fill characterization.
Fig. S3. Sweat volume collected by sweat sticker and MSCS.
Fig. S4. MSCS volume comparison for left versus right arms.
Fig. S5. Bland-Altman analysis of sub populations.
Fig. S6. Dermatological impact of collection methods on infants.
Fig. S7. Colorimetric image analysis procedure.
Fig. S8. Example of individual pixel measurements within a region of interest (ROI).
Fig. S9. Comparison of image capture methodology on chloride measurement.
Fig. S10. Modes of device operation in clinical practice and disease management.
Table S1. Description of the population study cohort grouped by age.
Table S2. Individual data from participants in the study.
Movie S1. Demonstration of sweat sticker removal.
Data and materials availability:
All data associated with this study are present in the paper or the Supplementary Materials. All information and materials can be requested from one of the corresponding authors.
References:
- 1.MacKenzie T, Gifford AH, Sabadosa KA, Quinton HB, Knapp EA, Goss CH, Marshall BC, Longevity of Patients With Cystic Fibrosis in 2000 to 2010 and Beyond: Survival Analysis of the Cystic Fibrosis Foundation Patient Registry, Ann Intern Med 161, 233 (2014). [DOI] [PMC free article] [PubMed] [Google Scholar]
- 2.Paranjape SM, Mogayzel PJ, Cystic fibrosis in the era of precision medicine, Paediatric Respiratory Reviews 25, 64–72 (2018). [DOI] [PubMed] [Google Scholar]
- 3.Cutting GR, Cystic fibrosis genetics: from molecular understanding to clinical application, Nat Rev Genet 16, 45–56 (2015). [DOI] [PMC free article] [PubMed] [Google Scholar]
- 4.Sanders DB, Zhang Z, Farrell PM, Lai HJ, Wisconsin CFNSG, Early life growth patterns persist for 12years and impact pulmonary outcomes in cystic fibrosis, J Cyst Fibros (2018), doi: 10.1016/j.jcf.2018.01.006. [DOI] [PMC free article] [PubMed] [Google Scholar]
- 5.Davis PB, Cystic Fibrosis Since 1938, Am J Respir Crit Care Med 173, 475–482 (2006). [DOI] [PubMed] [Google Scholar]
- 6.Farrell PM, White TB, Ren CL, Hempstead SE, Accurso F, Derichs N, Howenstine M, McColley SA, Rock M, Rosenfeld M, Sermet-Gaudelus I, Southern KW, Marshall BC, Sosnay PR, Diagnosis of Cystic Fibrosis: Consensus Guidelines from the Cystic Fibrosis Foundation, J Pediatr 181S, S4–S15 e1 (2017). [DOI] [PubMed] [Google Scholar]
- 7.Rosenfeld M, Wainwright CE, Higgins M, Wang LT, McKee C, Campbell D, Tian S, Schneider J, Cunningham S, Davies JC, Ivacaftor treatment of cystic fibrosis in children aged 12 to <24 months and with a CFTR gating mutation (ARRIVAL): a phase 3 single-arm study, Lancet Respir Med 6, 545–553 (2018). [DOI] [PMC free article] [PubMed] [Google Scholar]
- 8.Taylor-Cousar JL, Mall MA, Ramsey BW, McKone EF, Tullis E, Marigowda G, McKee CM, Waltz D, Moskowitz SM, Savage J, Xuan F, Rowe SM, Clinical development of triple-combination CFTR modulators for cystic fibrosis patients with one or two F508del alleles, ERJ Open Res 5, 00082–02019 (2019). [DOI] [PMC free article] [PubMed] [Google Scholar]
- 9.Davies JC, Moskowitz SM, Brown C, Horsley A, Mall MA, McKone EF, Plant BJ, Prais D, Ramsey BW, Taylor-Cousar JL, Tullis E, Uluer A, McKee CM, Robertson S, Shilling RA, Simard C, Van Goor F, Waltz D, Xuan F, Young T, Rowe SM, VX-659–Tezacaftor–Ivacaftor in Patients with Cystic Fibrosis and One or Two Phe508del Alleles, N Engl J Med 379, 1599–1611 (2018). [DOI] [PMC free article] [PubMed] [Google Scholar]
- 10.Burgener EB, Moss RB, Cystic fibrosis transmembrane conductance regulator modulators: precision medicine in cystic fibrosis, Current Opinion in Pediatrics 30, 372–377 (2018). [DOI] [PMC free article] [PubMed] [Google Scholar]
- 11.Middleton PG, Mall MA, Dřevínek P, Lands LC, McKone EF, Polineni D, Ramsey BW, Taylor-Cousar JL, Tullis E, Vermeulen F, Marigowda G, McKee CM, Moskowitz SM, Nair N, Savage J, Simard C, Tian S, Waltz D, Xuan F, Rowe SM, Jain R, Elexacaftor–Tezacaftor–Ivacaftor for Cystic Fibrosis with a Single Phe508del Allele, N Engl J Med 381, 1809–1819 (2019). [DOI] [PMC free article] [PubMed] [Google Scholar]
- 12.Lopes-Pacheco M, CFTR Modulators: The Changing Face of Cystic Fibrosis in the Era of Precision Medicine, Front. Pharmacol 10, 1662 (2020). [DOI] [PMC free article] [PubMed] [Google Scholar]
- 13.Fox M, Mercier A, Savant A, Laguna TA, Cystic fibrosis diagnosed by state newborn screening: Or is it?, SAGE Open Medical Case Reports 8, 2050313X2093942 (2020). [DOI] [PMC free article] [PubMed] [Google Scholar]
- 14.Watts KD, Layne B, Harris A, McColley SA, Hispanic Infants with Cystic Fibrosis Show Low CFTR Mutation Detection Rates in the Illinois Newborn Screening Program, Journal of Genetic Counseling 21, 671–675 (2012). [DOI] [PubMed] [Google Scholar]
- 15.Brown A, Jenkins L, Reid A, Leavy A, McDowell G, McIlroy C, Thompson A, McNaughten B, How to perform and interpret the sweat test, Arch Dis Child Educ Pract Ed, edpract-2018–316615 (2019). [DOI] [PubMed] [Google Scholar]
- 16.LeGrys VA, Moon TC, Laux J, Accurso F, Martiniano SA, A multicenter evaluation of sweat chloride concentration and variation in infants with cystic fibrosis, J Cyst Fibros 18, 190–193 (2019). [DOI] [PubMed] [Google Scholar]
- 17.Farrell PM, White TB, Howenstine MS, Munck A, Parad RB, Rosenfeld M, Sommerburg O, Accurso FJ, Davies JC, Rock MJ, Sanders DB, Wilschanski M, Sermet-Gaudelus I, Blau H, Gartner S, McColley SA, Diagnosis of Cystic Fibrosis in Screened Populations, J Pediatr 181s, S33–S44.e2 (2017). [DOI] [PubMed] [Google Scholar]
- 18.Gibson LE, Cooke RE, A test for concentration of electrolytes in sweat in cystic fibrosis of the pancreas utilizing pilocarpine by iontophoresis, Pediatrics 23, 545–9 (1959). [PubMed] [Google Scholar]
- 19.Hammond KB, Turcios NL, Gibson LE, Clinical evaluation of the macroduct sweat collection system and conductivity analyzer in the diagnosis of cystic fibrosis, The Journal of Pediatrics 124, 255–260 (1994). [DOI] [PubMed] [Google Scholar]
- 20.Cirilli N, Southern KW, Buzzetti R, Barben J, Nährlich L, Munck A, Wilschanski M, De Boeck K, Derichs N, Real life practice of sweat testing in Europe, Journal of Cystic Fibrosis 17, 325–332 (2018). [DOI] [PubMed] [Google Scholar]
- 21.McColley SA, Ren CL, Sontag M, LeGrys VA, WS15.4 Quantity not sufficient sweat test rates in infants <14 days old: a survey of United States cystic fibrosis centers, Journal of Cystic Fibrosis 16, S27–S28 (2017). [Google Scholar]
- 22.Ozgenc A, The most common preanalytic problem of sweat testing: Insufficient sweat volume, Int J Med Biochem (2020), doi: 10.14744/ijmb.2020.16870. [DOI] [Google Scholar]
- 23.Collins MN, Brawley CB, McCracken CE, Shankar PRV, Schechter MS, Rogers BB, Risk Factors for Quantity Not Sufficient Sweat Collection in Infants 3 Months or Younger, American Journal of Clinical Pathology 142, 72–75 (2014). [DOI] [PubMed] [Google Scholar]
- 24.Abdulhamid I, Kleyn M, Langbo C, Gregoire-Bottex M, Schuen J, Shanmugasundaram K, Nasr SZ, Improving the Rate of Sufficient Sweat Collected in Infants Referred for Sweat Testing in Michigan, Global Pediatric Health 1, 2333794X1455362 (2014). [DOI] [PMC free article] [PubMed] [Google Scholar]
- 25.LeGrys VA, McColley SA, Li Z, Farrell PM, The Need for Quality Improvement in Sweat Testing Infants after Newborn Screening for Cystic Fibrosis, J Pediatr 157, 1035–1037 (2010). [DOI] [PMC free article] [PubMed] [Google Scholar]
- 26.Farrell PM, Sommerburg O, Toward quality improvement in cystic fibrosis newborn screening: Progress and continuing challenges, Journal of Cystic Fibrosis 15, 267–269 (2016). [DOI] [PubMed] [Google Scholar]
- 27.Rock MJ, Makholm L, Eickhoff J, A new method of sweat testing: the CF Quantum®sweat test, Journal of Cystic Fibrosis 13, 520–527 (2014). [DOI] [PMC free article] [PubMed] [Google Scholar]
- 28.Langen AV, Dompeling E, Yntema J-B, Arets B, Tiddens H, Loeber G, Dankert-Roelse J, Clinical evaluation of the Nanoduct sweat test system in the diagnosis of cystic fibrosis after newborn screening, Eur J Pediatr 174, 1025–1034 (2015). [DOI] [PubMed] [Google Scholar]
- 29.Rueegg CS, Kuehni CE, Gallati S, Jurca M, Jung A, Casaulta C, Barben J, for the Swiss Cystic Fibrosis Screening Group, Comparison of two sweat test systems for the diagnosis of cystic fibrosis in newborns, Pediatric Pulmonology 54, 264–272 (2019). [DOI] [PubMed] [Google Scholar]
- 30.Rock M, LeGrys V, The CF Quantum Sweat Test: Not Ready For Clinical Use, Clin Lab Sci, ascls.119.002105 (2020). [Google Scholar]
- 31.Dubot P, Liang J, Dubs J, Missiak Y, Sarazin C, Couderc F, Caussé E, Sweat chloride quantification using capillary electrophoresis, Practical Laboratory Medicine 13, e00114 (2019). [DOI] [PMC free article] [PubMed] [Google Scholar]
- 32.Ďurč P, Foret F, Homola L, Malá M, Pokojová E, Vinohradská H, Dastych M, Krausová D, Nagy D, Bede O, Dřevínek P, Skalická V, Kubáň P, Skin wipe test: A simple, inexpensive, and fast approach in the diagnosis of cystic fibrosis, Pediatr Pulmonol 55, 1653–1660 (2020). [DOI] [PubMed] [Google Scholar]
- 33.McCaul M, Porter A, Barrett R, White P, Stroiescu F, Wallace G, Diamond D, Wearable Platform for Real-time Monitoring of Sodium in Sweat, ChemPhysChem 19, 1531–1536 (2018). [DOI] [PubMed] [Google Scholar]
- 34.Ray TR, Choi J, Bandodkar AJ, Krishnan S, Gutruf P, Tian L, Ghaffari R, Rogers JA, Bio-Integrated Wearable Systems: A Comprehensive Review, Chem. Rev 119, 5461–5533 (2019). [DOI] [PubMed] [Google Scholar]
- 35.Emaminejad S, Gao W, Wu E, Davies ZA, Yin Yin Nyein H, Challa S, Ryan SP, Fahad HM, Chen K, Shahpar Z, Talebi S, Milla C, Javey A, Davis RW, Autonomous sweat extraction and analysis applied to cystic fibrosis and glucose monitoring using a fully integrated wearable platform, Proc Natl Acad Sci USA 114, 4625–4630 (2017). [DOI] [PMC free article] [PubMed] [Google Scholar]
- 36.Mattar ACV, Gomes EN, Adde FV, Rodrigues JC, Comparison between classic Gibson and Cooke technique and sweat conductivity test in patients with and without cystic fibrosis, Jornal de Pediatria 0 (2010), doi: 10.2223/JPED.1979. [DOI] [PubMed] [Google Scholar]
- 37.Choi D-H, Thaxton A, cheol Jeong I, Kim K, Sosnay PR, Cutting GR, Searson PC, Sweat test for cystic fibrosis: Wearable sweat sensor vs. standard laboratory test, Journal of Cystic Fibrosis 17, e35–e38 (2018). [DOI] [PubMed] [Google Scholar]
- 38.Choi D-H, Kim JS, Cutting GR, Searson PC, Wearable Potentiometric Chloride Sweat Sensor: The Critical Role of the Salt Bridge, Anal. Chem 88, 12241–12247 (2016). [DOI] [PubMed] [Google Scholar]
- 39.Kassal P, Steinberg MD, Horak E, Steinberg IM, Wireless fluorimeter for mobile and low cost chemical sensing: A paper based chloride assay, Sensors and Actuators B: Chemical 275, 230–236 (2018). [Google Scholar]
- 40.Creer M, Zhang C, Kim J, Yang J, Liu Z, in Ultrafast Nonlinear Imaging and Spectroscopy V, Liu Z, Ed. (SPIE, San Diego, United States, 2017), p. 17. [Google Scholar]
- 41.Koh A, Kang D, Xue Y, Lee S, Pielak RM, Kim J, Hwang T, Min S, Banks A, Bastien P, Manco MC, Wang L, Ammann KR, Jang K-I, Won P, Han S, Ghaffari R, Paik U, Slepian MJ, Balooch G, Huang Y, Rogers JA, A soft, wearable microfluidic device for the capture, storage, and colorimetric sensing of sweat, Science Translational Medicine 8, 366ra165–366ra165 (2016). [DOI] [PMC free article] [PubMed] [Google Scholar]
- 42.Choi J, Kang D, Han S, Kim SB, Rogers JA, Microfluidic Networks: Thin, Soft, Skin-Mounted Microfluidic Networks with Capillary Bursting Valves for Chrono-Sampling of Sweat (Adv. Healthcare Mater. 5/2017), Adv. Healthcare Mater 6 (2017), doi: 10.1002/adhm.201770023. [DOI] [PubMed] [Google Scholar]
- 43.Choi J, Ghaffari R, Baker LB, Rogers JA, Skin-interfaced systems for sweat collection and analytics, Sci. Adv 4, eaar3921 (2018). [DOI] [PMC free article] [PubMed] [Google Scholar]
- 44.Kim SB, Lee K, Raj MS, Lee B, Reeder JT, Koo J, Hourlier-Fargette A, Bandodkar AJ, Won SM, Sekine Y, Choi J, Zhang Y, Yoon J, Kim BH, Yun Y, Lee S, Shin J, Kim J, Ghaffari R, Rogers JA, Soft, Skin-Interfaced Microfluidic Systems with Wireless, Battery-Free Electronics for Digital, Real-Time Tracking of Sweat Loss and Electrolyte Composition, Small 14, 1802876 (2018). [DOI] [PubMed] [Google Scholar]
- 45.Kim SB, Zhang Y, Won SM, Bandodkar AJ, Sekine Y, Xue Y, Koo J, Harshman SW, Martin JA, Park JM, Ray TR, Crawford KE, Lee K-T, Choi J, Pitsch RL, Grigsby CC, Strang AJ, Chen Y-Y, Xu S, Kim J, Koh A, Ha JS, Huang Y, Kim SW, Rogers JA, Super-Absorbent Polymer Valves and Colorimetric Chemistries for Time-Sequenced Discrete Sampling and Chloride Analysis of Sweat via Skin-Mounted Soft Microfluidics, Small 14, 1703334 (2018). [DOI] [PubMed] [Google Scholar]
- 46.Sekine Y, Kim SB, Zhang Y, Bandodkar AJ, Xu S, Choi J, Irie M, Ray TR, Kohli P, Kozai N, Sugita T, Wu Y, Lee K, Lee K-T, Ghaffari R, Rogers JA, A fluorometric skin-interfaced microfluidic device and smartphone imaging module for in situ quantitative analysis of sweat chemistry, Lab Chip 18, 2178–2186 (2018). [DOI] [PubMed] [Google Scholar]
- 47.Choi J, Xue Y, Xia W, Ray TR, Reeder JT, Bandodkar AJ, Kang D, Xu S, Huang Y, Rogers JA, Soft, skin-mounted microfluidic systems for measuring secretory fluidic pressures generated at the surface of the skin by eccrine sweat glands, Lab Chip 17, 2572–2580 (2017). [DOI] [PMC free article] [PubMed] [Google Scholar]
- 48.Bandodkar AJ, Choi J, Lee SP, Jeang WJ, Agyare P, Gutruf P, Wang S, Sponenburg RA, Reeder JT, Schon S, Ray TR, Chen S, Mehta S, Ruiz S, Rogers JA, Soft, Skin-Interfaced Microfluidic Systems with Passive Galvanic Stopwatches for Precise Chronometric Sampling of Sweat, Adv. Mater 31, 1902109 (2019). [DOI] [PubMed] [Google Scholar]
- 49.Choi J, Bandodkar AJ, Reeder JT, Ray TR, Turnquist A, Kim SB, Nyberg N, Hourlier-Fargette A, Model JB, Aranyosi AJ, Xu S, Ghaffari R, Rogers JA, Soft, Skin-Integrated Multifunctional Microfluidic Systems for Accurate Colorimetric Analysis of Sweat Biomarkers and Temperature, ACS Sens. 4, 379–388 (2019). [DOI] [PubMed] [Google Scholar]
- 50.Reeder JT, Xue Y, Franklin D, Deng Y, Choi J, Prado O, Kim R, Liu C, Hanson J, Ciraldo J, Bandodkar AJ, Krishnan S, Johnson A, Patnaude E, Avila R, Huang Y, Rogers JA, Resettable skin interfaced microfluidic sweat collection devices with chemesthetic hydration feedback, Nat Commun 10, 5513 (2019). [DOI] [PMC free article] [PubMed] [Google Scholar]
- 51.Zhang Y, Guo H, Kim SB, Wu Y, Ostojich D, Park SH, Wang X, Weng Z, Li R, Bandodkar AJ, Sekine Y, Choi J, Xu S, Quaggin S, Ghaffari R, Rogers JA, Passive sweat collection and colorimetric analysis of biomarkers relevant to kidney disorders using a soft microfluidic system, Lab Chip 19, 1545–1555 (2019). [DOI] [PMC free article] [PubMed] [Google Scholar]
- 52.Bandodkar AJ, Gutruf P, Choi J, Lee K, Sekine Y, Reeder JT, Jeang WJ, Aranyosi AJ, Lee SP, Model JB, Ghaffari R, Su C-J, Leshock JP, Ray T, Verrillo A, Thomas K, Krishnamurthi V, Han S, Kim J, Krishnan S, Hang T, Rogers JA, Battery-free, skin-interfaced microfluidic/electronic systems for simultaneous electrochemical, colorimetric, and volumetric analysis of sweat, Sci. Adv 5, eaav3294 (2019). [DOI] [PMC free article] [PubMed] [Google Scholar]
- 53.Reeder JT, Choi J, Xue Y, Gutruf P, Hanson J, Liu M, Ray T, Bandodkar AJ, Avila R, Xia W, Krishnan S, Xu S, Barnes K, Pahnke M, Ghaffari R, Huang Y, Rogers JA, Waterproof, electronics-enabled, epidermal microfluidic devices for sweat collection, biomarker analysis, and thermography in aquatic settings, Sci. Adv 5, eaau6356 (2019). [DOI] [PMC free article] [PubMed] [Google Scholar]
- 54.Choi J, Chen S, Deng Y, Xue Y, Reeder JT, Franklin D, Oh YS, Model J, Aranyosi AJ, Lee SP, Ghaffari R, Huang Y, Rogers JA, Skin-interfaced microfluidic systems that combine hard and soft materials for demanding applications in sweat capture and analysis, Advanced Healthcare Materials (ASAP). [DOI] [PubMed] [Google Scholar]
- 55.Taylor NA, Machado-Moreira CA, Regional variations in transepidermal water loss, eccrine sweat gland density, sweat secretion rates and electrolyte composition in resting and exercising humans, Extrem Physiol Med 2, 4 (2013). [DOI] [PMC free article] [PubMed] [Google Scholar]
- 56.Lerwick JL, Minimizing pediatric healthcare-induced anxiety and trauma, WJCP 5, 143 (2016). [DOI] [PMC free article] [PubMed] [Google Scholar]
- 57.Kim J, Farahmand M, Dunn C, Milla CE, Horii RI, Thomas EAC, Moss RB, Wine JJ, Sweat rate analysis of ivacaftor potentiation of CFTR in non-CF adults, Scientific Reports 8 (2018), doi: 10.1038/s41598-018-34308-8. [DOI] [PMC free article] [PubMed] [Google Scholar]
- 58.LeGrys VA, Moon TC, Laux J, Rock MJ, Accurso F, Analytical and biological variation in repeated sweat chloride concentrations in clinical trials for CFTR modulator therapy, J Cyst Fibros 17, 43–49 (2018). [DOI] [PMC free article] [PubMed] [Google Scholar]
- 59.Vermeulen F, Le Camus C, Davies JC, Bilton D, Milenković D, De Boeck K, Variability of sweat chloride concentration in subjects with cystic fibrosis and G551D mutations, Journal of Cystic Fibrosis 16, 36–40 (2017). [DOI] [PubMed] [Google Scholar]
- 60.Vermeulen F, Lebecque P, De Boeck K, Leal T, Biological variability of the sweat chloride in diagnostic sweat tests: A retrospective analysis, Journal of Cystic Fibrosis 16, 30–35 (2017). [DOI] [PubMed] [Google Scholar]
- 61.Durmowicz AG, Witzmann KA, Rosebraugh CJ, Chowdhury BA, Change in sweat chloride as a clinical end point in cystic fibrosis clinical trials: the ivacaftor experience, Chest 143, 14–18 (2013). [DOI] [PubMed] [Google Scholar]
- 62.Muhlebach MS, Clancy J, Heltshe SL, Ziady A, Kelley T, Accurso F, Pilewski J, Mayer-Hamblett N, Joseloff E, Sagel SD, Biomarkers for cystic fibrosis drug development, Journal of Cystic Fibrosis 15, 714–723 (2016). [DOI] [PMC free article] [PubMed] [Google Scholar]
- 63.Espel JC, Palac HL, Bharat A, Cullina J, Prickett M, Sala M, McColley SA, Jain M, The relationship between sweat chloride levels and mortality in cystic fibrosis varies by individual genotype, J Cyst Fibros 17, 34–42 (2018). [DOI] [PubMed] [Google Scholar]
- 64.Collaco JM, Blackman SM, Raraigh KS, Corvol H, Rommens JM, Pace RG, Boelle P-Y, McGready J, Sosnay PR, Strug LJ, Knowles MR, Cutting GR, Sources of Variation in Sweat Chloride Measurements in Cystic Fibrosis, American Journal of Respiratory and Critical Care Medicine 194, 1375–1382 (2016). [DOI] [PMC free article] [PubMed] [Google Scholar]
- 65.Willems P, Weekx S, Meskal A, Schouwers S, Biological Variation of Chloride and Sodium in Sweat Obtained by Pilocarpine Iontophoresis in Adults: How Sure are You About Sweat Test Results?, Lung 195, 241–246 (2017). [DOI] [PubMed] [Google Scholar]
- 66.Agrawal K, Waller JD, Pedersen TL, Newman JW, Effects of stimulation technique, anatomical region, and time on human sweat lipid mediator profiles, Prostaglandins & Other Lipid Mediators 134, 84–92 (2018). [DOI] [PMC free article] [PubMed] [Google Scholar]
- 67.Cirilli N, Raia V, Rocco I, De Gregorio F, Tosco A, Salvadori L, Sepe AO, Buzzetti R, Minicuci N, Castaldo G, Intra-individual biological variation in sweat chloride concentrations in CF, CFTR dysfunction, and healthy pediatric subjects, Pediatric Pulmonology 53, 728–734 (2018). [DOI] [PubMed] [Google Scholar]
- 68.Lecca P, Bertini M, Vicentini R, Pintani E, D’Orazio C, Esposito V, Kleinfelder K, Sorio C, Melotti P, in Proceedings of the 23rd Conference of Open Innovations Association, (Bologna, Italy, 2018), p. 8. [Google Scholar]
- 69.CLSI. Sweat Testing: Sample Collection and Quantitative Chloride Analysis: Approved Guideline-Fourth Edition. CLSI document C34 Wayne, PA: Clinical and Laboratory Standards Institute; (2019). [Google Scholar]
- 70.Ratkiewicz M, Pastore M, McCoy KS, Thompson R, Hayes D, Sheikh SI, Role of CFTR mutation analysis in the diagnostic algorithm for cystic fibrosis, World J Pediatr 13, 129–135 (2017). [DOI] [PubMed] [Google Scholar]
- 71.Suh-Lailam B, Towster L, Glomb A, McColley S, Savant AP, Use of Quality Improvement to Improve Sweat Testing Leads to Reduction in Rate of Quantity Not Sufficient Results, Pediatric Pulmonology 53, S368–S369 (2018). [Google Scholar]
- 72.Greaves RF, Jolly L, Massie J, Scott S, Wiley VC, Metz MP, Mackay RJ, Laboratory performance of sweat conductivity for the screening of cystic fibrosis, Clinical Chemistry and Laboratory Medicine (CCLM) 56, 554–559 (2018). [DOI] [PubMed] [Google Scholar]
- 73.Rose JB, Ellis L, John B, Martin S, Gonska T, Solomon M, Tullis E, Corey M, Adeli K, Durie PR, Does the Macroduct® collection system reliably define sweat chloride concentration in subjects with intermediate results?, Clinical Biochemistry 42, 1260–1264 (2009). [DOI] [PubMed] [Google Scholar]
- 74.Kirk JM, Inconsistencies in sweat testing in UK laboratories, Archives of Disease in Childhood 82, 425–427 (2000). [DOI] [PMC free article] [PubMed] [Google Scholar]
Associated Data
This section collects any data citations, data availability statements, or supplementary materials included in this article.