ABSTRACT
Background:
The ideal installation technique or implant macrogeometry for obtaining an adequate osseointegration in low-density bone tissue follows a challenge in the implantology.
Aims and Objective:
The aim of the present study was to evaluate the behavior of three osteotomy techniques and two implant macrogeometries in two low-density polyurethane blocks. The insertion torque (IT), initial stability, pullout resistance, and weight of the residual bone material deposited on the implants were assessed.
Materials and Methods:
A total of 120 implants with two different macrogeometries were used. They were divided into six groups according to the implant macrogeometry and the drilling technique performed (n = 20 implants per group). The implants were installed in polyurethane blocks with pounds per cubic foot (PCF) 10 and PCF 20 densities. The IT, initial stability, pullout resistance, and weight residual bone were measured.
Results:
Differences were found in the values referring to the macrogeometry of the implants and the type of osteotomy performed. In all groups, the initial stability of the PCF 10 blocks was quite low. The undersized osteotomies significantly increased the values measured in all tests in the PCF 20 density blocks.
Conclusions:
In conclusion, even when a modified (undersized) osteotomy technique is used, implants inserted in low-quality bone (type IV) can present problems for osseointegration due their low initial stability and bone resistance. However, the modification in the implant macrogeometry (with healing chambers) presented more quantity of bone on the surface after the pullout test.
KEYWORDS: Implant macrogeometry, initial implant stability, insertion torque, low-density bone, pullout resistance, surgical technique
INTRODUCTION
Initial stability is considered an important factor for dental implants to allow the biological processes that are involved in the different stages of the osseointegration.[1,2,3,4] In this sense, several studies related to the surgical technique used to install implants have been conducted to obtain good initial stability, especially in cases where implants are placed in low-density bone. The initial stability mainly depends on factors such as the anatomy and bone quality, the macrogeometry of the implant, and the surgical technique used.[5] Regardless of the surgical technique, undersized site preparation and other bone condensation procedures were used in order to increase the initial stability of the implants in the bone sites with low density.[6,7,8,9] On the other hand, implants with different macrogeometries have been proposed to improve and/or accelerate the osseointegration process. In terms of the modified macrogeometry parameters, there is the shape of the implant (cylindrical or conical), the design of the turns, and, more recently, the development of healing chambers in the implant body.[10,11,12,13] These last implant design (with healing chambers) presented in these previous studies, a lower insertion torque (IT) values and initial stability values measured by resonance frequency analysis (RFA) similar with the conventional implant design (without healing chambers), using the same drilling sequence indicated by the manufacturer for both implant models. However, they presented higher osseointegration values in shorter periods of time, both in cortical bone and in medullary bone.[10,14] These superior results presented by implants with a new macrogeometry in medullary bone supposedly occurred due to the fact that the healing chambers carry larger amounts of bone particles during the insertion maneuver.
The low-density bone tissue needs adequate stimuli to properly support and dissipate the loads received after the installation of the rehabilitation on the implants inserted in these areas. The low bone density found in some regions of the maxilla and mandible is due to the lack of stimuli, that is, they are areas where tooth loss has occurred and, therefore, there is no longer the stimulus promoted by the tooth root inside the bone tissue. Thus, the bone in this area has wide medullary spaces and, consequently, a low density. Changes in the surgical technique for installing the implants have been used to compact this low-density bone in order to obtain better results.[6,7,8,9] However, the possible effects of altering the surgical technique associated with the modification of macrogeometry with the presence of healing chambers in the implant body have been poorly studied in low-density bone. Thus, the present in vitro study sought to verify possible biomechanical differences that may benefit the behavior of implants installed in areas of low bone density. For this, implants with two different macrogeometries were installed in two different low-density polyurethane blocks using three different osteotomy techniques. The IT, initial stability, pullout resistance, and weight of the residual bone material deposited on the implants were assessed.
MATERIALS AND METHODS
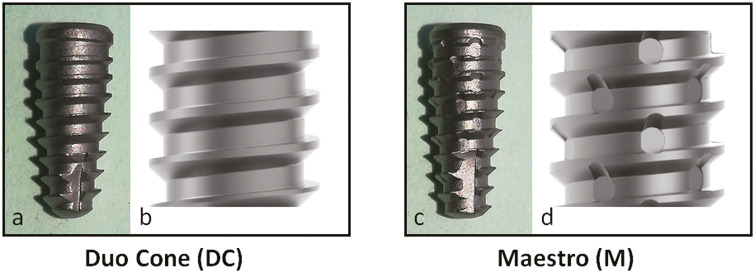
The present in vitro study was carried out in the research department of Biotecnos—Technology and Sciences (Montevideo, Uruguay). Two different implant macrogeometries manufactured by Implacil De Bortoli (São Paulo, Brazil) were tested: the Duo Cone (DC) implant with a conical shape with progressive threads at depths from the cervical to the apical portions (0.2–0.5 mm) with lengths of 1 mm between them and a short self-tapping (2 mm) in the apical portion; the Maestro implant with a conical shape with progressive threads at depths from the cervical to the apical portions (0.2–0.5 mm) with lengths of 1 mm between them, a larger self-tapping (3 mm) in the apical portion, and healing chambers between the threads (0.2 mm in depth and 0.5 mm in diameter). Both implant models had a Morse taper connection that was 4 mm in diameter, 10 mm in length, and surface treated by blasting with titanium oxide microparticles (~150 µm) as well as acid conditioning using maleic acid (Implacil De Bortoli, São Paulo, Brazil). Figure 1 shows representative images of the two implant designs used.
Figure 1.
Representative images of the implants used in the present study showed the differences in the macrogeometry, mainly the presence of healing chambers in the Maestro implant. Photographic images of the implants (A and C). Images obtained in the AutoCAD software (B and D). DC = Duo Cone, M = Maestro
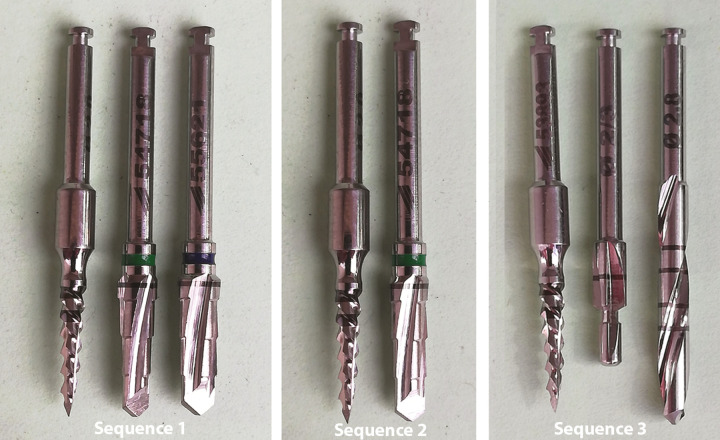
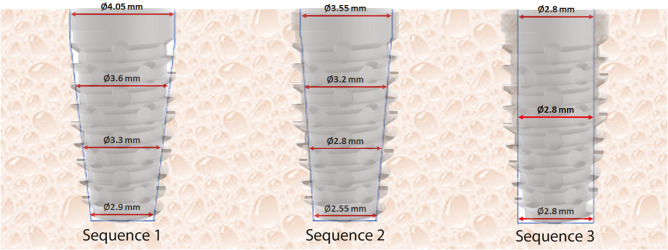
The second variable tested to determine the groups was the drilling technique used to perform the osteotomy, as follows: sequence 1 (s1)—osteotomy recommended by the manufacture, using a 2 mm initial drill at a speed of 1200rpm, a conical drill of 3.5 mm at a speed of 800rpm, and a conical drill of 4.0 mm at a speed of 800rpm; sequence 2 (s2)—undersized osteotomy using a 2-mm initial drill at a speed of 1200rpm and a conical drill of 3.5 mm at a speed of 800rpm; and sequence 3 (s3)—extra-undersized osteotomy using a 2-mm initial drill, a pilot drill (2–2.8 mm), and a cylindrical drill of 2.8 mm, all at a speed of 1200 rpm. Figure 2 shows the three drill sequences used to perform the osteotomies, and Figure 3 shows a schematic image of the osteotomy results obtained (dimensions) using each drill sequence. For all osteotomies, a BLM 600 surgical implant device and 20:1 contra-angle was used (Driller, São Paulo, Brazil).
Figure 2.
Image of the three drill sequences used to perform the osteotomies
Figure 3.
Schematic image of the final osteotomy dimensions using each drill sequence and the comparison with the implant dimension
One hundred and twenty dental implants were used. These were divided into six groups according to the implant macrogeometry and the drilling technique performed (n = 20 implants per group), as follows: Group DCs1 used a DC implant and drilling using the s1; Group DCs2 used a DC implant and drilling using the s2; Group DCs3 used a DC implant and drilling using the s3; Group Ms1 used a Maestro implant and drilling using the s1; Group Ms2 used a Maestro implant and drilling using the s2; and Group Ms3 used a Maestro implant and drilling using the s3.
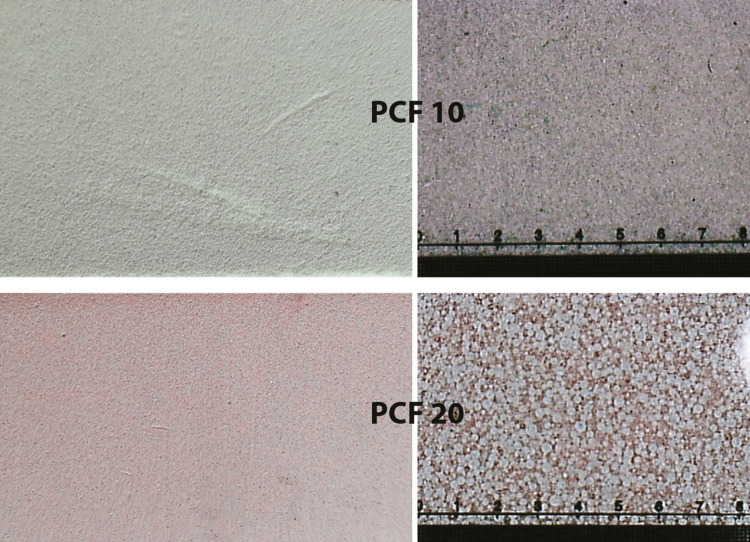
Finally, the third variable tested was the type of polyurethane foam. The polyurethane blocks are approved and recognized as a standard material for testing instruments and bone implants by the American Society for Testing and Materials.[15] Two different densities of polyurethane foam blocks at 10 pounds per cubic foot (PCF) and 20 PCF were used to simulate low bone density (bone types IV and III), respectively. The dimensions of foam blocks used were 95 mm × 45 mm × 35 mm (Nacional Ossos, Jaú, Brazil). Figure 4 shows images of the blocks used in the tests.
Figure 4.
Representative images of the polyurethane blocks with different densities used in the tests. PCF = pounds per cubic foot
IMPLANT INSERTION AND TORQUE MEASUREMENT
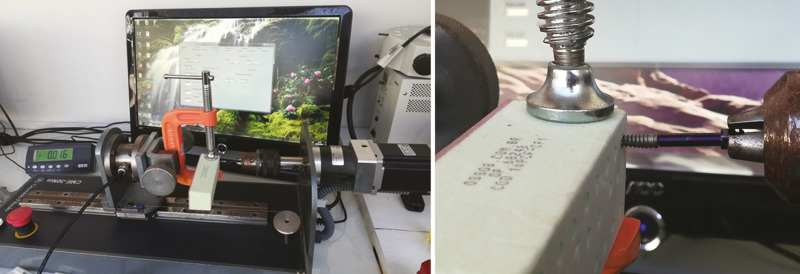
All implants were inserted using a computerized torque testing machine, the CME-30nm (Técnica Industrial Oswaldo Filizola, São Paulo, Brazil), at a speed of 30rpm at the crestal bone level. The maximum torque value during insertion was measured. Figure 5 shows the machine used for implant insertion and torque measurement.
Figure 5.
Image of the machine used for implant insertion and torque measurement
RESONANCE FREQUENCY ANALYSIS
After implant insertion, the primary stability was measured using RFA values expressed as the implant stability quotient (ISQ) using the Osstell Mentor Device (Integration Diagnostic AB, Savadelen, Sweden). For this, a Smart-Pegs device number 16 (for both implant models) was screwed into each implant. The ISQ ranged from 0 to 100 (measured between 3,500 and 85,000 Hz). For each sample, the stability measurement was repeated twice in two different directions, and the average value was calculated for each sample.
PULLOUT TEST
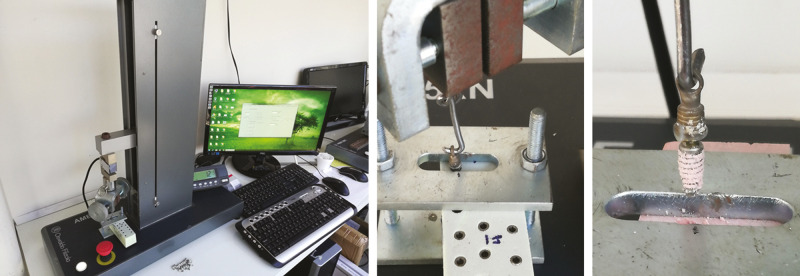
The pullout test was performed using the universal machine AME-5kN (Industrial Técnica Oswaldo Filizola Ltda, São Paulo, Brazil) at a speed of 5 mm/min with a built-in displacement measurement system with a resolution of 0.001 mm, and the Newton value of maximum pullout was measured for each sample. Figure 6 shows the machine and dispositive used for the pullout test.
Figure 6.
Image of the machine and dispositive used for the pullout test
WEIGHING OF THE REMAINING BONE AFTER THE PULLOUT TEST
After the pullout test, the samples were carefully removed from the equipment, placed inside an Eppendorf, and immediately weighed on a precision analytical balance to assess the amount of material retained on the surface of the implants by weight (total weight = Tw). Five implant samples (without previous use) from each model were placed inside the Eppendorf and were weighed (partial weight = Pw). The average weight of samples for DC implants was 270950 µg and for Maestro implants it was 258950 µg. These mean values (Tw and Pw) were used to obtain the weight of the residual material (RM) on each sample after the pullout test, as follows: (Tw − Pw = RM). For weighing, a laboratory analytical balance was used (Sartorius Secura 324-1S, Thermo Fisher Scientific Inc, Montevideo, Uruguay).
STATISTICAL EVALUATION
The measured values were compared statistically using the Bonferroni’s multiple-comparison test. Initially, the data of all proposed tests were compared in the same implant model with different osteotomy techniques for both density blocks. Then, the data values were compared between the implant models using the same osteotomy technique. Lastly, the Pearson’s correlation test was used to evaluate the correlation between the four tests applied. Data treatment and statistical analysis were performed using GraphPad Prism, version 5.01, for Windows (GraphPad Software, San Diego, California, USA). All statistical analysis was considered statistically significant using a P value <0.05.
RESULTS
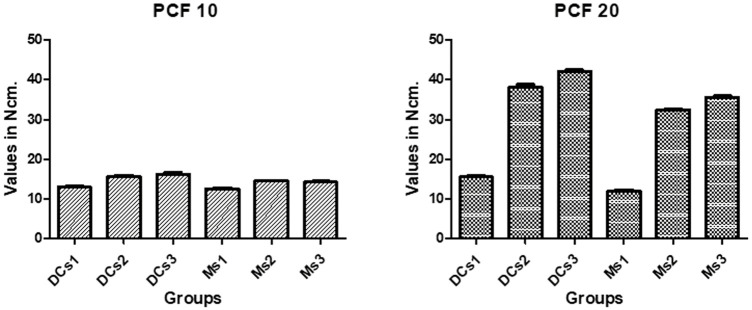
The maximum IT values measured during the implant insertion in the PCF 10 polyurethane blocks were low for the three drilling sequences tested in both implant models, and they showed a little variation between the groups proposed. However, in PCF 20 polyurethane blocks, there was a higher variation of IT for s2 and s3 in comparison with s1 in the same implant model. The mean values and standard deviations are shown graphically in Figure 7. The statistical data comparison between the groups with the same implant model and between the groups with the same drilling sequence is summarized in Table 1.
Figure 7.
Bar graphs of the insertion torque (mean values and standard deviations) measured for each group in blocks with different densities. DC = Duo Cone, M = Maestro, PCF = pounds per cubic foot, s1 = sequence 1, s2 = sequence 2, s3 = sequence 3
Table 1.
Bonferroni’s multiple-comparison test of the insertion torque values collected data for each group in the two block models used
| Group comparison | PCF 10 | PCF 20 | ||
|---|---|---|---|---|
| 95% CI of diff. | P value | 95% CI of diff. | P value | |
| DCs1 vs. DCs2 | −4.156 to −1.084 | 0.0011* | −24.55 to −20.61 | 0.0002* |
| DCs1 vs. DCs3 | −4.796 to −1.724 | 0.0010* | −28.67 to −24.73 | 0.0002* |
| DCs2 vs. DCs3 | −2.176 to 0.8957 | 0.3443 | −6.093 to −2.147 | 0.0003* |
| Ms1 vs. Ms2 | −2.966 to −0.8737 | 0.0013* | −21.87 to −19.35 | <0.0001* |
| Ms1 vs. Ms3 | −2.686 to −0.5937 | 0.0032* | −24.98 to −22.46 | <0.0001* |
| Ms2 vs. Ms3 | −0.7663 to 1.326 | 0.4027 | −4.366 to −1.854 | 0.0002* |
| DCs1 vs. Ms1 | −1.181 to 1.981 | 0.1974 | 1.630 to 5.610 | 0.0004* |
| DCs2 vs. Ms2 | −0.4811 to 2.681 | 0.0101* | 3.600 to 7.580 | 0.0003* |
| DCs3 vs. Ms3 | 0.4389 to 3.601 | 0.0170* | 4.610 to 8.590 | 0.0002* |
CI = confidence interval, DC = Duo Cone, diff. = difference, M = Maestro, PCF = pounds per cubic foot, s1 = sequence 1, s2 = sequence 2, s3 = sequence 3
*Statistically different
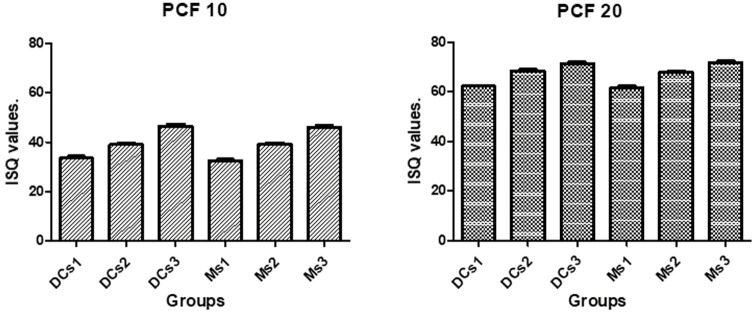
The ISQ values measured after the implant insertion into polyurethane PCF 10 blocks showed low values for the three drilling sequences tested (ISQ < 50), with little variation between the proposed groups. In the PCF 20 blocks, the ISQ values were higher than those obtained in the PCF 10 blocks for all drilling sequences and in both tested implant models. The means and standard deviations for each groups and block models are shown graphically in Figure 8. The statistical ISQ data comparison between the groups with the same implant model and between the groups with the same drilling sequence is summarized in Table 2.
Figure 8.
Bar graphs of the implant stability quotient values (mean values and standard deviations) measured for each group in both polyurethane blocks. DC = Duo Cone, ISQ = implant stability quotient, M = Maestro, PCF = pounds per cubic foot, s1 = sequence 1, s2 = sequence 2, s3 = sequence 3
Table 2.
Bonferroni’s multiple-comparison test of the implant stability quotient values collected data for each group in the two block models used
| Group comparison | PCF 10 | PCF 20 | ||
|---|---|---|---|---|
| 95% CI of diff. | P value | 95% CI of diff. | P value | |
| DCs1 vs. DCs2 | −8.971 to −1.829 | 0.0012* | −8.813 to −3.587 | 0.0002* |
| DCs1 vs. DCs3 | −16.47 to −9.329 | 0.0002* | −11.81 to −6.587 | 0.0002* |
| DCs2 vs. DCs3 | −11.07 to −3.929 | 0.0002* | −5.613 to −0.3872 | 0.0060* |
| Ms1 vs. Ms2 | −10.37 to −3.229 | 0.0002* | −9.013 to −3.787 | 0.0002* |
| Ms1 vs. Ms3 | −10.37 to −3.229 | 0.0002* | −12.91 to −7.687 | 0.0002* |
| Ms2 vs. Ms3 | −10.37 to −3.229 | 0.0003* | −6.513 to −1.287 | 0.0007* |
| DCs1 vs. Ms1 | −1.181 to 1.981 | 0.2884 | −1.913 to 3.313 | 0.7296 |
| DCs2 vs. Ms2 | −0.4811 to 2.681 | 0.9688 | −2.113 to 3.113 | 0.4137 |
| DCs3 vs. Ms3 | 0.4389 to 3.601 | 0.7886 | −3.013 to 2.213 | 0.9683 |
CI = confidence interval, DC = Duo Cone, diff. = difference, M = Maestro, PCF = pounds per cubic foot, s1 = sequence 1, s2 = sequence 2, s3 = sequence 3
*Statistically different
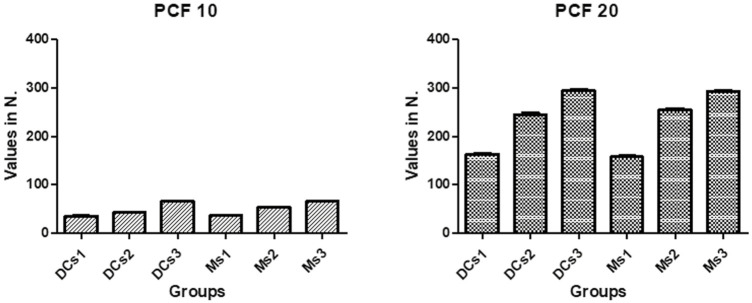
In the pullout test, the implant samples removed of both polyurethane blocks (PCF 10 and PCF 20) showed different values for the three drilling sequences tested for the same implant model. However, when they were compared between the implant models using the same drilling sequence, the values were similar. The means and standard deviations of the values measured in the pullout test are shown graphically in Figure 9. The statistical analysis of the pullout force values comparison between the groups with the same implant model and between the groups with the same drilling sequence is summarized in Table 3.
Figure 9.
Bar graphs of the pullout force values (mean values and standard deviations) measured for each group in both polyurethane blocks. DC = Duo Cone, M = Maestro, PCF = pounds per cubic foot, s1 = sequence 1, s2 = sequence 2, s3 = sequence 3
Table 3.
Bonferroni’s multiple-comparison test of the pullout force values for each group in the two block models used
| Group comparison | PCF 10 | PCF 20 | ||
|---|---|---|---|---|
| 95% CI of diff. | P value | 95% CI of diff. | P value | |
| DCs1 vs. DCs2 | −10.43 to −3.934 | 0.0001* | −92.83 to −71.73 | <0.0001* |
| DCs1 vs. DCs3 | −33.63 to −27.13 | <0.0001* | −142.5 to −121.5 | <0.0001* |
| DCs2 vs. DCs3 | −26.45 to −19.95 | <0.0001* | −60.27 to −39.17 | <0.0001* |
| Ms1 vs. Ms2 | −20.25 to −13.75 | 0.0002* | −108.1 to −86.99 | <0.0001* |
| Ms1 vs. Ms3 | −32.85 to −26.35 | 0.0002* | −146.5 to −125.4 | 0.0002* |
| Ms2 vs. Ms3 | −32.85 to −26.35 | <0.0001* | −48.97 to −27.87 | <0.0001* |
| DCs1 vs. Ms1 | −4.326 to 2.166 | 0.2890 | −4.947 to 16.15 | 0.2799 |
| DCs2 vs. Ms2 | −14.15 to −7.654 | <0.0001* | −20.21 to 0.8872 | 0.0820 |
| DCs3 vs. Ms3 | −3.546 to 2.946 | 0.7047 | −8.907 to 12.19 | 0.4488 |
CI = confidence interval, DC = Duo Cone, diff. = difference, M = Maestro, PCF = pounds per cubic foot, s1 = sequence 1, s2 = sequence 2, s3 = sequence 3
*Statistically different
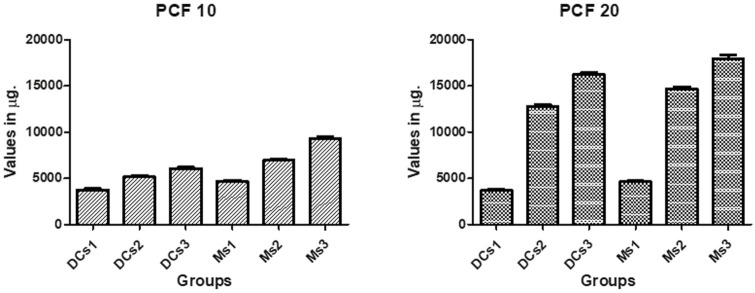
Regarding the calculated weight of the residual material (synthetic bone) deposited on the implants removed after the pullout test, the mean and standard deviation values are shown graphically in Figure 10. In both blocks for both implant models, the deposition of material depended on the drilling sequence used (s3 > s2 > s1). Regarding the implant model, the Maestro implants showed more residual material in all tested sequences and in both blocks (PCF 10 and PCF 20) in comparison with the DC implant model. The statistical analysis of the residual material values comparison between the groups with the same implant model and between the groups with the same drilling sequence is summarized in Table 4.
Figure 10.
Bar graphs of the weight of residual material (mean values and standard deviations) measured for each group in each block with different densities. DC = Duo Cone, M = Maestro, PCF = pounds per cubic foot, s1 = sequence 1, s2 = sequence 2, s3 = sequence 3
Table 4.
Bonferroni’s multiple-comparison test of the residual material values for each group in the two block models used
| Group comparison | PCF 10 | PCF 20 | ||
|---|---|---|---|---|
| 95% CI of diff. | P value | 95% CI of diff. | P value | |
| DCs1 vs. DCs2 | −2,018 to −861.7 | 0.0002* | −10,150 to −8,026 | <0.0001* |
| DCs1 vs. DCs3 | −2,898 to −1,742 | 0.0002* | −13,560 to −11,440 | <0.0001* |
| DCs2 vs. DCs3 | −1,458 to −301.7 | 0.0013* | −4,474 to −2,346 | 0.0002* |
| Ms1 vs. Ms2 | −2,858 to −1,702 | 0.0002* | −11,120 to −8,996 | 0.0002* |
| Ms1 vs. Ms3 | −5,238 to −4,082 | 0.0002* | −14,380 to −12,260 | 0.0002* |
| Ms2 vs. Ms3 | −2,958 to −1,802 | 0.0002* | −4,324 to −2,196 | 0.0002* |
| DCs1 vs. Ms1 | −1,498 to −341.7 | 0.0027* | −2,004 to 124.1 | 0.0009* |
| DCs2 vs. Ms2 | −2,338 to −1,182 | 0.0002* | −2,974 to −845.9 | 0.0002* |
| DCs3 vs. Ms3 | −3,838 to −2,682 | 0.0002* | −2,824 to −695.9 | 0.0028* |
CI = confidence interval, DC = Duo Cone, diff. = difference, M = Maestro, PCF = pounds per cubic foot, s1 = sequence 1, s2 = sequence 2, s3 = sequence 3
*Statistically different
Finally, in the PCF 10 blocks, no correlations were detected for the four proposed tests; however, in the blocks with a density of PCF 20, correlations between insertion and pullout torque (r = 0.5974), IT and material weight (r = 0.5987), and pullout and material weight (r = 0.6012) were detected. However, no correlations were detected between ISQ values and the other three tests.
DISCUSSION
In the present study, the initial stability was evaluated by measuring the IT and analyzing the resonance frequency as well as the resistance of bone to pullout and the amount of residual material deposited after removal of the implants in three different osteotomy models and two low-density bone substrate models. The results showed that in the PCF 10 block models, which simulate type IV bone, even when using undersized osteotomy, the initial implant stability (IT and ISQ values) was quite low, regardless of the implant macrogeometry. In contrast, in the models where the density was slightly higher (PCF 20, corresponding to a type III bone), the initial stability (IT and ISQ values), especially when undersized osteotomies were present, showed higher values for both implant models tested. The pullout test used to assess the insertion strength of both implant models using different osteotomy techniques showed results similar to the stability tests used (IT and ISQ values). However, in the evaluation of the residual material on the surface of the implants of both models tested in the different conditions (type of osteotomy and density of the blocks), the Maestro implant groups (with healing chambers) showed superior results to the DC implant groups.
Several authors have reported the importance of initial stability when installing dental implants.[1,2,3,16,17,18] The IT values of implants are considered clinically important in the evaluation of initial stability. For this reason, several studies have been carried out in an attempt to better evaluate the presence of micromovements of implants immediately after their insertion.[19,20] When the bone tissue has a sufficient density (bone types I and II), initial stability is easily achieved and high torque values are obtained, without modifying the recommended osteotomy for either implant model.[21] However, at low bone densities (bone types III and IV), obtaining a high IT is less likely and/or less frequent regardless of the implant model.[22] This is corroborated by the results obtained in our study. In general, in blocks with a density of PCF 10, an increase in the IT of approximately 19% occurred compared with that of the osteotomy using s2 and s3 with the drilling method recommended by the manufacturer (s1). In the blocks with a density of PCF 20, the increase in the implant IT values was much higher when using undersized osteotomies and compared with the osteotomy indicated by the manufacturer (on average 157.7% higher for s2 and 183.9% for s3). Statistically, the groups with undersized osteotomies showed significant differences compared with the groups using osteotomies indicated by the manufacturer under both tested densities. Similar results to those reported have been attained in other studies.[23,24] Regarding the implant models used in this study, Maestro implants, which have healing chambers as part of their macrogeometry, obtained lower IT values for all proposed osteotomies compared with the DC implant. This result is corroborated by previous studies that compared these same implant macrogeometries for other bone densities.[10]
Regarding the measurement of initial stability by the RFA method, the results showed different values depending on the density presented by the blocks, which corroborated the results presented by other similar studies.[22,23,24] In blocks with a density of PCF 10, all groups showed ISQ values below 50. This is considered a very low value that is subject to micromovements during the osseointegration phase. The ISQ values of less than 50 may indicate potential failure or an increased risk of failure for the implant.[25] Other authors indicated that implants with ISQ values of <65 should not be used, as they require an additional waiting time.[26] Implants installed in type IV density bone should undergo a longer waiting period to reach the recommended value for loading. Still, for this density (PCF 10), the highest ISQ values were obtained with undersized osteotomies. s2 presented values 18.5% higher and s3 presented values 40.2% higher than those of s1. In blocks with a density of PCF 20, the values were higher in all proposed osteotomy sequences compared with blocks with a density of PCF 10, a result that is similar to that of other studies.[22,23,24] In all groups proposed, the ISQ values were greater than 60, which, as reported in other studies, can reduce the possibility of the micromovement of the implants by more than 50%.[27] However, it is important to understand that RFA analysis indicates the absence of mobility in the installed implant and not the bone quantity at the implant–bone interface.[28] Still, when the two implant models tested were compared, no statistical difference was found between them for the RFA analysis for any of the density models.
In the present study, no correlation was found between the RFA values measured after the insertion of the implants and the torque at insertion, in accordance with another study.[5] These results show that we must use greater caution when conducting a frequency analysis of the resonance of dental implants, because the limits of height and width of the implants as well as bone density factors can influence the result. Undersized drilling was associated with an increase in the IT for both types of implants tested, with this value being a sign of an increase in the initial stability.[3]
The pullout test is a test that can be used to determine the primary stability according to the surgical technique, the shape of the implant, and the density of the bone.[29,30] In blocks with type IV density (PCF 10), the pullout values found were quite low, regardless of the surgical technique used and the shape of the implant used; however, undersized drilling provided better results compared with the technique indicated by the manufacturer. In this bone condition, where the density is extremely low, undersized osteotomy with 2.8 mm cylindrical drills (s3) can be used as an alternative method to improve stability. However, in type III density blocks (PCF 20), the measured values demonstrate that there is no need for the use of such an undersized osteotomy, because the use of s2 for the installation of the 4-mm implant presented adequate stability and resistance to pullout values.
Finally, the weighing of the material deposited on the bodies of the implants showed differences between the two implant models tested. The implant with healing chambers in its macrogeometry had larger amounts of material deposited in all dimensions of osteotomy and in both tested block models. The greater amount of material deposited on the surface may be one of the factors that helps to accelerate the osseointegration of this implant model, as reported in other recent studies.[10,31]
Among the limitations of the present study, we can mention the homogeneity of the blocks used, a fact that rarely occurs under clinical conditions. These used blocks were selected without the presence of a cortical lamina, as in similar clinical situations (bone types III and IV), this is usually quite thin and, in the case of foam blocks, can influence the results depending on the consistency and thickness. However, the initial idea was to assess the stability provided by the medullary portion, which corresponds to almost the entire implant support under these conditions. Still, all surgical maneuvers were automated and performed on high-precision devices, unlike the clinical situation.
CONCLUSIONS
Within the limitations of the present in vitro study and based on the results obtained, we conclude that the variation in osteotomy with undersized drilling increases the initial stability values (IT and ISQ), pullout resistance, and amount of material on the surface of implants in comparison to the preparation indicated by the manufacturer in both types of low-density bone blocks (types III and IV). Moreover, the macrogeometry modifications of the implants can improve some parameters, such as the amount of bone deposited on the surface of the implants, which can be beneficial for the osseointegration process.
FINANCIAL SUPPORT AND SPONSORSHIP
None.
CONFLICTS OF INTEREST
There are no conflicts of interest.
AUTHORS’ CONTRIBUTIONS
Conceptualization, M.A.B. and S.A.G.; data curation, M.A.B., J.H.C.L., and B.A.D.; formal analysis, A.S. and S.A.G.; investigation, J.H.C.L., B.A.D., and S.A.G.; methodology, A.S., P.N.A., and S.A.G.; supervision, B.A.D. and P.N.A.; visualization, A.S. and J.H.C.L.; writing—original draft preparation, M.A.B. and S.A.G.; writing—review and editing, S.A.G.
ETHICAL POLICY AND INSTITUTIONAL REVIEW BOARD STATEMENT
Not applicable.
PATIENT DECLARATION OF CONSENT
Not applicable.
DATA AVAILABILITY STATEMENT
Not applicable.
ACKNOWLEDGEMENT
Thanks for Implacil De Bortoli (São Paulo, Brazil) for the donation of the materials used for experiments; and, to Letícia Pérez-Díaz (Facultad de Ciencias, Udelar, Montevideo, Uruguay) for the support in the weighing the material in your laboratory.
REFERENCES
- 1.Calandriello R, Tomatis M, Rangert B. Immediate functional loading of brånemark system implants with enhanced initial stability: A prospective 1- to 2-year clinical and radiographic study. Clin Implant Dent Relat Res. 2003;5(Suppl 1):10–20. doi: 10.1111/j.1708-8208.2003.tb00011.x. [DOI] [PubMed] [Google Scholar]
- 2.Friberg B, Jisander S, Widmark G, Lundgren A, Ivanoff CJ, Sennerby L, et al. One-year prospective three-center study comparing the outcome of a “soft bone implant” (prototype mk IV) and the standard brånemark implant. Clin Implant Dent Relat Res. 2003;5:71–7. doi: 10.1111/j.1708-8208.2003.tb00186.x. [DOI] [PubMed] [Google Scholar]
- 3.O’Sullivan D, Sennerby L, Jagger D, Meredith N. A comparison of two methods of enhancing implant primary stability. Clin Implant Dent Relat Res. 2004;6:48–57. doi: 10.1111/j.1708-8208.2004.tb00027.x. [DOI] [PubMed] [Google Scholar]
- 4.Turkyilmaz I, Tözüm TF, Tumer C, Ozbek EN. Assessment of correlation between computerized tomography values of the bone, and maximum torque and resonance frequency values at dental implant placement. J Oral Rehabil. 2006;33:881–8. doi: 10.1111/j.1365-2842.2006.01692.x. [DOI] [PubMed] [Google Scholar]
- 5.Javed F, Romanos GE. The role of primary stability for successful immediate loading of dental implants. A literature review. J Dent. 2010;38:612–20. doi: 10.1016/j.jdent.2010.05.013. [DOI] [PubMed] [Google Scholar]
- 6.Beer A, Gahleitner A, Holm A, Birkfellner W, Homolka P. Adapted preparation technique for screw-type implants: Explorative in vitro pilot study in a porcine bone model. Clin Oral Implants Res. 2007;18:103–7. doi: 10.1111/j.1600-0501.2006.01280.x. [DOI] [PubMed] [Google Scholar]
- 7.Pai UY, Rodrigues SJ, Talreja KS, Mundathaje M. Osseodensification - A novel approach in implant dentistry. J Indian Prosthodont Soc. 2018;18:196–200. doi: 10.4103/jips.jips_292_17. [DOI] [PMC free article] [PubMed] [Google Scholar]
- 8.Elsayyad AA, Osman RB. Osseodensification in implant dentistry: A critical review of the literature. Implant Dent. 2019;28:306–12. doi: 10.1097/ID.0000000000000884. [DOI] [PubMed] [Google Scholar]
- 9.Marin C, Bonfante E, Granato R, Neiva R, Gil LF, Marão HF, et al. The effect of osteotomy dimension on implant insertion torque, healing mode, and osseointegration indicators: A study in dogs. Implant Dent. 2016;25:739–43. doi: 10.1097/ID.0000000000000476. [DOI] [PubMed] [Google Scholar]
- 10.Gehrke SA, Aramburú J, Jr, Pérez-Díaz L, do Prado TD, Dedavid BA, Mazon P, et al. Can changes in implant macrogeometry accelerate the osseointegration process?: An in vivo experimental biomechanical and histological evaluations. Plos One. 2020;15:e0233304. doi: 10.1371/journal.pone.0233304. [DOI] [PMC free article] [PubMed] [Google Scholar]
- 11.Açil Y, Sievers J, Gülses A, Ayna M, Wiltfang J, Terheyden H. Correlation between resonance frequency, insertion torque and bone-implant contact in self-cutting threaded implants. Odontology. 2017;105:347–53. doi: 10.1007/s10266-016-0265-2. [DOI] [PubMed] [Google Scholar]
- 12.Lages FS, Douglas-de Oliveira DW, Costa FO. Relationship between implant stability measurements obtained by insertion torque and resonance frequency analysis: A systematic review. Clin Implant Dent Relat Res. 2018;20:26–33. doi: 10.1111/cid.12565. [DOI] [PubMed] [Google Scholar]
- 13.Gehrke SA, Eliers Treichel TL, Pérez-Díaz L, Calvo-Guirado JL, Aramburú Júnior J, Mazón P, et al. Impact of different titanium implant thread designs on bone healing: A biomechanical and histometric study with an animal model. J Clin Med. 2019;8:777. doi: 10.3390/jcm8060777. [DOI] [PMC free article] [PubMed] [Google Scholar]
- 14.Gehrke SA, Tumedei M, Aramburú Júnior J, Treichel TLE, Kolerman R, Lepore S, et al. Histological and histomorphometrical evaluation of a new implant macrogeometry. A sheep study. Int J Environ Res Public Health. 2020;17:3477. doi: 10.3390/ijerph17103477. 10.3390/ijerph17103477. [DOI] [PMC free article] [PubMed] [Google Scholar]
- 15.ASTM F1839-08(2016) Standard Specification for Rigid Polyurethane Foam for Use as a Standard Material for Testing Orthopaedic Devices and Instruments. West Conshohocken, PA: ASTM International; 2016. www.astm.org . [Google Scholar]
- 16.O’Sullivan D, Sennerby L, Meredith N. Measurements comparing the initial stability of five designs of dental implants: A human cadaver study. Clin Implant Dent Relat Res. 2000;2:85–92. doi: 10.1111/j.1708-8208.2000.tb00110.x. [DOI] [PubMed] [Google Scholar]
- 17.Östman P, Hellman M, Sennerby L. Direct implant loading in the edentulous maxilla using a bone density-adapted surgical protocol and primary implant stability criteria for inclusion. Clin Implant Dent Relat. 2005;7(Supp 1):560–9. doi: 10.1111/j.1708-8208.2005.tb00076.x. [DOI] [PubMed] [Google Scholar]
- 18.Beer A, Gahleitner A, Holm A, Tschabitscher M, Homolka P. Correlation of insertion torques with bone mineral density from dental quantitative CT in the mandible. Clin Oral Implants Res. 2003;14:616–20. doi: 10.1034/j.1600-0501.2003.00932.x. [DOI] [PubMed] [Google Scholar]
- 19.Fanali S, Tumedei M, Pignatelli P, Inchingolo F, Pennacchietti P, Pace G, et al. Implant primary stability with an osteocondensation drilling protocol in different density polyurethane blocks. Comput Methods Biomech Biomed Engin. 2020;24:14–20. doi: 10.1080/10255842.2020.1806251. [DOI] [PubMed] [Google Scholar]
- 20.Comuzzi L, Iezzi G, Piattelli A, Tumedei M. An in vitro evaluation, on polyurethane foam sheets, of the insertion torque (IT) values, pull-out torque values, and resonance frequency analysis (RFA) of nanoshort dental implants. Polymers (Basel) 2019;11:1020. doi: 10.3390/polym11061020. [DOI] [PMC free article] [PubMed] [Google Scholar]
- 21.Comuzzi L, Tumedei M, Pontes AE, Piattelli A, Iezzi G. Primary stability of dental implants in low-density (10 and 20 PCF) polyurethane foam blocks: Conical vs cylindrical implants. Int J Environ Res Public Health. 2020;17:2617. doi: 10.3390/ijerph17082617. [DOI] [PMC free article] [PubMed] [Google Scholar]
- 22.Gupta RK, Padmanabhan TV. Resonance frequency analysis. Indian J Dent Res. 2011;22:567–73. doi: 10.4103/0970-9290.90300. [DOI] [PubMed] [Google Scholar]
- 23.Bornstein MM, Hart CN, Halbritter SA, Morton D, Buser D. Early loading of nonsubmerged titanium implants with a chemically modified sand-blasted and acid-etched surface: 6-month results of a prospective case series study in the posterior mandible focusing on peri-implant crestal bone changes and implant stability quotient (ISQ) values. Clin Implant Dent Relat Res. 2009;11:338–47. doi: 10.1111/j.1708-8208.2009.00148.x. [DOI] [PubMed] [Google Scholar]
- 24.Pagliani L, Sennerby L, Petersson A, Verrocchi D, Volpe S, Andersson P. The relationship between resonance frequency analysis (RFA) and lateral displacement of dental implants: An in vitro study. J Oral Rehabil. 2013;40:221–7. doi: 10.1111/joor.12024. [DOI] [PubMed] [Google Scholar]
- 25.Stocchero M, Toia M, Cecchinato D, Becktor JP, Coelho PG, Jimbo R. Biomechanical, biologic, and clinical outcomes of undersized implant surgical preparation: A systematic review. Int J Oral Maxillofac Implants. 2016;31:1247–63. doi: 10.11607/jomi.5340. [DOI] [PubMed] [Google Scholar]
- 26.Herrero-Climent M, Lemos BF, Herrero-Climent F, Falcao C, Oliveira H, Herrera M, et al. Influence of implant design and under-preparation of the implant site on implant primary stability. An in vitro study. Int J Environ Res Public Health. 2020;17:4436. doi: 10.3390/ijerph17124436. [DOI] [PMC free article] [PubMed] [Google Scholar]
- 27.Rabel A, Köhler SG, Schmidt-Westhausen AM. Clinical study on the primary stability of two dental implant systems with resonance frequency analysis. Clin Oral Investig. 2007;11:257–65. doi: 10.1007/s00784-007-0115-2. [DOI] [PubMed] [Google Scholar]
- 28.Meredith N, Book K, Friberg B, Jemt T, Sennerby L. Resonance frequency measurements of implant stability in vivo. A cross-sectional and longitudinal study of resonance frequency measurements on implants in the edentulous and partially dentate maxilla. Clin Oral Implants Res. 1997;8:226–33. doi: 10.1034/j.1600-0501.1997.080309.x. [DOI] [PubMed] [Google Scholar]
- 29.Salmória KK, Tanaka OM, Guariza-Filho O, Camargo ES, de Souza LT, Maruo H. Insertional torque and axial pull-out strength of mini-implants in mandibles of dogs. Am J Orthod Dentofacial Orthop. 2008;133:790.e15–22. doi: 10.1016/j.ajodo.2007.12.020. [DOI] [PubMed] [Google Scholar]
- 30.Zamarioli A, Simões PA, Shimano AC, Defino HLA. Insertion torque and pullout strength of vertebral screws with cylindrical and conic core. Rev Bras Ortop. 2008;43:452–9. [Google Scholar]
- 31.Gehrke SA, Aramburú Júnior J, Pérez-Díaz L, Treichel TLE, Dedavid BA, De Aza PN, et al. New implant macrogeometry to improve and accelerate the osseointegration: An in vivo experimental study. Appl Sci. 2019;9:3181. [Google Scholar]
Associated Data
This section collects any data citations, data availability statements, or supplementary materials included in this article.
Data Availability Statement
Not applicable.


