Abstract
Purpose:
The kidney is a radiosensitive late-responding normal tissue. Injury is characterized by radiation nephropathy and decline of glomerular filtration rate (GFR). The current study aimed to compare two rapid and cost-effective methodologies of assessing GFR against more conventional biomarker measurements.
Methods:
C57BL/6 mice were treated with bilateral focal X-irradiation (1x14Gy or 5x6Gy). Functional measurements of kidney injury were assessed 20 weeks post-treatment. GFR was estimated using a transcutaneous measurement of Fluorescein-isothiocyanate conjugated (FITC)-sinistrin renal excretion and also dynamic contrast-enhanced CT imaging with a contrast agent (ISOVUE-300 Iopamidol).
Results:
H&E and PAS staining identified comparable radiation-induced glomerular atrophy and mesangial matrix accumulation after both radiation schedules respectively, although the fractionated regimen resulted in less diffuse tubulointerstitial fibrosis. Albumin-to-creatinine ratios increased after irradiation (1x14Gy: 100.4±12.2μg/mg; 6x5Gy: 80.4±3.02 μg/mg) and were double that of non-treated controls (44.9±3.64 μg/mg). GFR defined by both techniques was negatively correlated with BUN, mesangial expansion score and serum creatinine. The FITC-sinistrin transcutaneous method was more rapid and can be used to assess GFR in conscious animals, dynamic contrast-enhanced CT imaging technique was equally safe and effective.
Conclusion:
This study demonstrated that GFR measured by dynamic contrast-enhanced CT imaging is safe and effective compared to transcutaneous methodology to estimate kidney function.
Keywords: Radiobiology, irradiation, renal damage, mouse
Introduction
The kidneys are radiation-sensitive and dose-limiting organs (Dawson et al. 2010). Although less common than chemotherapy-induced nephrotoxicity, radiation nephropathy is an irreversible late consequence of radiotherapy (RT)(Cohen and Robbins 2003). Radiation nephropathy is associated with high morbidity and mortality rates due to late complications after abdominal oncologic external-beam radiotherapy (Dewit et al. 1993; Cassady 1995) (e.g., 20% in seminoma (Cassady 1995)), total body irradiation for hematopoietic stem cell transplantation (Luxton 1953; Cohen et al. 1993; Cohen et al. 1998; Cheng et al. 2008; Cohen et al. 2010; Abboud et al. 2012), and peptide receptor radionuclide therapy for neuroendocrine and prostate tumors (Vegt et al. 2010) (e.g. 14% CTCAE grade 4-5 nephrotoxicity due to tracer retention by the proximal tubules (Imhof et al. 2011; Marincek et al. 2013; Arveschoug et al. 2015)). 50-60% of adult (Launay-Vacher et al. 2007) and 30% of pediatric (Knijnenburg et al. 2012) cancer patients experience chronic chemotherapy (CT)-associated renal sequelae, which can reach 84% in pediatric survivors after nephrotoxic CT plus RT (Knijnenburg et al. 2013). Concurrent nephrotoxic CT escalates radiation nephropathy (Cheng et al. 2008; Sahni et al. 2009; Skinner et al. 2013), and the risk of renal impairment is also elevated by patient age, pre-existing kidney disease, and comorbidities such as hypertension and diabetes (National Kidney 2002).
Radiobiologically, the kidney is considered a late-responding tissue (Cohen and Robbins 2003). The nephrons are architecturally arranged in parallel rendering the organ extremely sensitive to radiation dose and volume effects (Withers et al. 1986; Withers et al. 1988; Emami et al. 1991; Stewart et al. 1991; Dawson et al. 2002; Cohen and Robbins 2003; Dawson et al. 2010). The risk of radiation-induced injury depends on the total radiation dose and irradiated kidney volume (Emami et al. 1991; Cassady 1995; Dawson et al. 2002; Dawson et al. 2010). For whole-kidney bilateral irradiation, 5% and 50% risk of injury at five years are associated with 18-23 Gy and 28 Gy, in 0.5-1.25 Gy/fractions, respectively (Cassady 1995; Dawson et al. 2010). Higher doses can be safely delivered to partial kidney volumes (Emami et al. 1991).
Glomerular, tubular and endothelial cells are all considered critical radiosensitive targets, and radiation nephropathy develops after a long latency period (Cohen and Robbins 2003). During the latent period and the early stages of radiation nephropathy, injury remains subclinical and includes glomerular atrophy, along with reduced blood vessel perfusion and capillary dilation (Scharpfenecker et al. 2013). These pathological events also make the organ sensitive to re-treatment with a tolerance that decreases with time (Stewart et al. 1989) indicating continuous progression of occult damage. The tissue microenvironment is also altered as a consequence of irradiation and the increased expression of proinflammatory and profibrotic cytokines promote tissue fibrosis and epithelial to mesenchymal transition (Rodemann and Blaese 2007; Lee SB and Kalluri 2010), as suggested by increased α-smooth muscle actin (α-SMA) after radiation. However, the triggering molecular signaling pathways that underlie the expression of radiation-induced renal injury and re-treatment tolerance remain unknown.
To investigate the renal injury after focal renal X-irradiation, we first developed a non-invasive, rapid, and cost-effective methodology of assessing the glomerular filtration rate (GFR) in a murine model that avoided conventionally-used radio-isotopes (Sallstrom and Friden 2013; Lee JY et al. 2014). With this method, we could negate the need for repeated urine and blood sampling that require expensive laboratory-based read-outs (e.g., high-performance liquid chromatography or tandem mass spectrometry). In this manuscript, we describe the measurement of radiation-induced renal injury in C57BL/6 mice using a FITC-sinistrin transcutaneous methodology (Ellery et al. 2015) and dynamic contrast-enhanced CT imaging, and we compare their efficacy in detecting renal function decline to a panel of normal urine and blood-based analyses. An x-ray computed tomography (CT)-image-guided X-irradiator was used to deliver single and fractionated radiation dosing regimens. We show that both the transcutaneous methodology and dynamic contrast-enhanced CT imaging are effective techniques to assess radiation-mediated renal damage, and data generated by both approaches correlate with conventional blood and renal biomarkers of injury.
Materials and Methods
Animal experiments and X-ray irradiation
10-14-week-old female and male C57BL/6 mice were purchased from the Jackson Laboratory (Bar Harbor, ME, USA). Animals were housed in MicroVENT IVC standard ventilated cages (Allentown Inc., PA, USA) maintained at 68±4°F with 12h dark and 12h light cycle and provided water and normal rodent diet with no restrictions. The experimental protocol was approved by the University of Miami Institutional Animal Care and Use Committee. For irradiation, animals were lightly anesthetized with a mixture of ketamine (100 mg/kg) and xylazine (10 mg/kg) and treated with a single X-ray dose of 14 Gy using an CT-image-guided small animal arc radiation treatment system (iSMAART [iSMall Animal Arc Radiation Treatment], 225 kVp, 13 mA) (Sha et al. 2016; Ahmad et al. 2017; Shi et al. 2017a, 2017b). Onboard cone beam x-ray computed tomography guidance was used for delineation of kidneys prior to irradiation. Mice were vertically immobilized on the rotation stage for CT imaging, where 360 transmission x-ray projections were acquired using the flat panel detector with an exposure time of 124 ms per projection at every 1° rotational step over one complete rotation. We used Feldkamp-Davis-Kress (FDK) filtered back projection algorithm for tomography reconstruction with the image voxel size of 0.13x0.13x0.13 mm3. Then, based on the CT imaging guidance, the left and right kidneys were separately aligned to the radiation isocenter to receive radiation. A second cohort of mice (n =10) were immobilized in the prone position in acrylic plastic jigs (Braintree Scientific, Inc, MA) and covered with custom-designed lead shielding for irradiation schedule of five fractions of 6Gy using a RS 2000 Biological Research Cabinet Irradiator (225 kVp, 17 mA RadSource Technologies, Inc., Suwanee, GA). The animals were sacrificed at 20 weeks after irradiation by a mixture of Ketamine/xylazine followed by transcardial perfusion with cold PBS and confirmed by cervical dislocation. Five minutes before sacrifice, mice were injected intravenously with 200μl of 1mg of a FITC-labelled dextran/0.9% NaCl solution (2000 kDa, Sigma-Aldrich). Kidney were harvested, snap frozen in OCT mounting media and 5 μM frozen sections were cut. After fixation, images were captured using fluorescent microscopy.
Functional assessments of renal injury.
Two methods were used to measure GFR 20 weeks after irradiation and 24h before sacrifice: (1) FITC-sinistrin renal excretion (MediBeacon, St. Louis, MO) and (2) dynamic contrast-enhanced CT imaging on iSMAART. To perform the CT scan, the isovue-300 (Iopamidol: catalog no. NDC0270-1315-30) was diluted with ultra-pure normal saline in a 1:1 ratio and 150 μL of the diluted Iopamidol was intravenously administered by lateral tail injection. 150 μL of diluted isovue-300 was infused (30 sec.) at the speed of 1.38 mL/min using a Chemyx NanoJet syringe pump, then a 2D x-ray projection was obtained using a PerkinElmer flat-panel detector on the SMall Animal Arc Radiation Treatment (iSMAART) with temporal resolution of 0.5 s. Single exponential fitting was carried out during the 1000s~3000s period, to calculate the excretion half time (t1/2). For the FITC- transcutaneous technique, the fur from the back of the mouse over the kidneys was removed using an electric razor and depilation cream 24 hours prior to attachment of the transdermal monitor. FITC-sinistrin (0.15 mg/kg body weight) was tail vein injected under light anesthesia using 1-3% isoflurane. FITC-sinistrin clearance from interstitial fluid was measured transcutaneous ly by using a transdermal monitor for 1.5 hours. The data were downloaded from the detector and analyzed using manufacture provided software to determine renal FITC-sinistrin half-life (t1/2) along with an R2 value, determined by a 1-compartment model using a conversion factor as previously described (Schock-Kusch et al. 2009b; Schreiber et al. 2012b; Schock-Kusch et al. 2013b). After sacrifice, kidneys were harvested, and tissue samples snap frozen in isopentane/liquid nitrogen for preparation of frozen sections and protein isolation or fixed in neutral buffered formalin and processed for paraffin embedding.
Urine samples analysis.
Spot urines were collected prior to irradiation for baseline assessments and then at 10 weeks and 20 weeks post RT. Urinary albumin content was measured by ELISA and urinary creatinine by an assay based on the Jaffe method using albumin (Bethyl Laboratory. #E90-134; TX, USA) and Stanbio creatinine kit (Bethyl Stanbio Laboratory. #0420-500; TX, USA). Values are expressed as μg albumin per mg creatinine.
Histology and assessment of mesangial expansion.
The kidneys were removed for histological analysis. A standard protocol was used for Periodic acid-Schiff (PAS), Picrosirius Red, hematoxylin–eosin (H&E) and Masson’s trichrome staining of paraffin-embedded kidney sections (4 μm thick). Images were captured using a light microscope (VS120, Olympus, Tokyo, Japan) at 40x magnification and analyzed using Image J software (Montes 1996). Two blinded independent investigators used a semi-quantitative analysis (scale 0–4) to analyze mesangial expansion from twenty glomeruli per section from mice kidney cortex (Crowley et al. 2009; Wei et al. 2011).
Blood samples analysis.
Blood (100μL) was harvested in non-heparinized micro-hematocrit capillaries by retro-orbital collection and allowed to clot for 1 h. All blood samples were then centrifuged at 10,000 rpm for 5 min and serum collected. Serum samples from all the animals were stored at −80°C until further analysis. Hematocrit was determined in plasma using a Hawksley hematocrit reader. Blood Urea Nitrogen (BUN) levels were determined in serum at the University of Miami using the Urea Nitrogen (BUN) Reagent Set (Pointe Scientific, Canton, MI), according to the manufacturer’s instructions. Tandem mass spectrometry at the UAB-UCSD O’Brein Core Center (University of Alabama, Birmingham) was used to determine the serum creatinine level as described previously (Takahashi et al. 2007).
Statistics
All the data are expressed as a mean ± standard deviation (SD). Two different groups of were compared using a two-tailed t-test. Three or more than three groups of data were compared using the one-way analysis of variance (ANOVA), followed by Tukey’s post-test or two-ways ANOVA with multiple comparisons. P-values below 0.05 were considered as statistically significant. 0.01 = *, 0.001 = **. Statistical analysis was performed using GraphPad Prism, version 7.0 (GraphPad Software Inc.).
Results
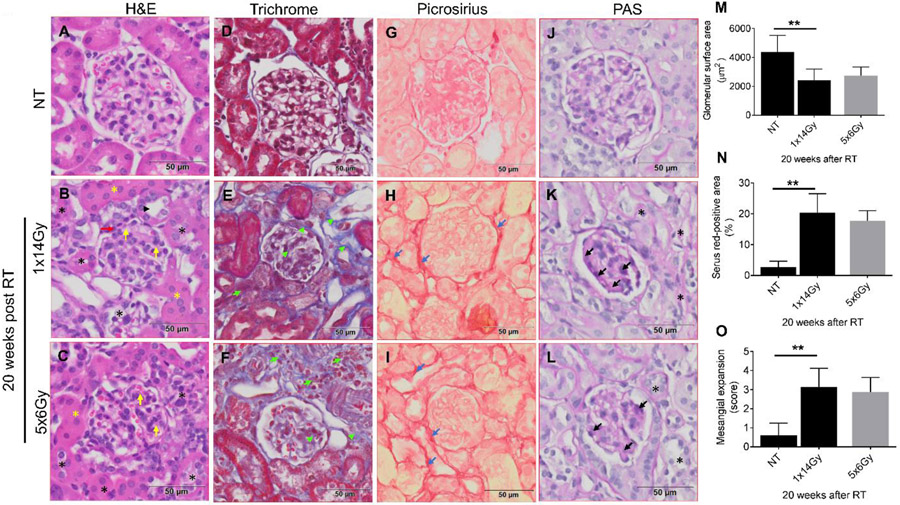
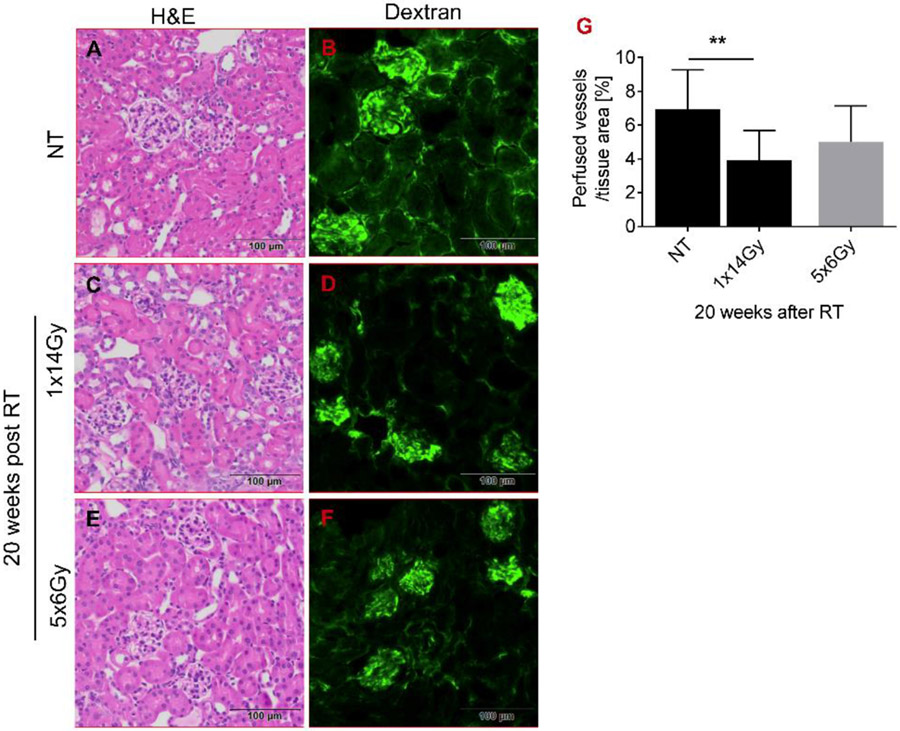
Figure 1 illustrates the image-guided targeting of a single kidney for a vertically-immobilized animal using an in-house developed iSMAART. Resultant renal histopathology is shown in figure 2 and illustrates changes within a single representative glomerulus for both radiation treatment regimens. Data is also quantified from measurements made from multiple glomeruli from 5 individual mice. Non-treated C57BL/6 animals (NT) exhibit glomeruli with visible and distinct Bowman’s space, thin glomerular capillary loops, non-occluded capillary lumen, no mesangial expansion and normal surrounding tubules (Fig. 2A). PAS (Periodic Acid-Schiff staining) staining (Fig. 2J) reveals normal basement membranes of glomerular capillary loops and tubular epithelium and no mesangial expansion. We did not find glomerular and tubular collagen (Fig. 2D) and fibrous tissue (Fig. 2G) in the nontreated animals' kidney cortex. In contrast, glomerular atrophy is evident 20 weeks after the 1x14Gy treatment as seen by H&E staining (Fig. 2B) that is less prominent after 6x5Gy (Fig. 2C). Irradiation leads to a decrease in glomerular surface area within 20 weeks (control [4366.67μm2], 1x14Gy [2420 μm2], 5x6Gy [2753.33 μm2] (Fig. 2M). Trichrome staining indicates increased collagen content in the interstitial space after irradiation (Fig. 2E and H) with collagen I and III depositions, as indicated by Picrosirius Red staining (Fig. 2H and I). PAS staining demonstrates that the single dose treatment induces more thickening of the glomerular basement membrane (Fig. 2K) than the fractionated radiation regimen (Fig. 2L). Figure 3 demonstrates that dextran (2000 kDa) is poorly excreted from the kidneys and remains within renal vasculature marking the honeycomb-like vascular network in non-treated (NT) animals (Fig. 3A-B). In contrast, irradiation leads to capillary loss, obstructions of vessel perfusion, and loss of vascular network (Fig. 3C-F). Renal irradiation reduces the number of perfused vessels, with a single fraction of 14Gy producing significantly more damage than fractionated treatment of 5x6Gy (Fig. 3G).
Figure 1. Representative three orthogonal x-ray CT views of an anesthetized mouse 5 minutes post intravenous ISOVUE-300 Iopamidol (150 μL) injection.
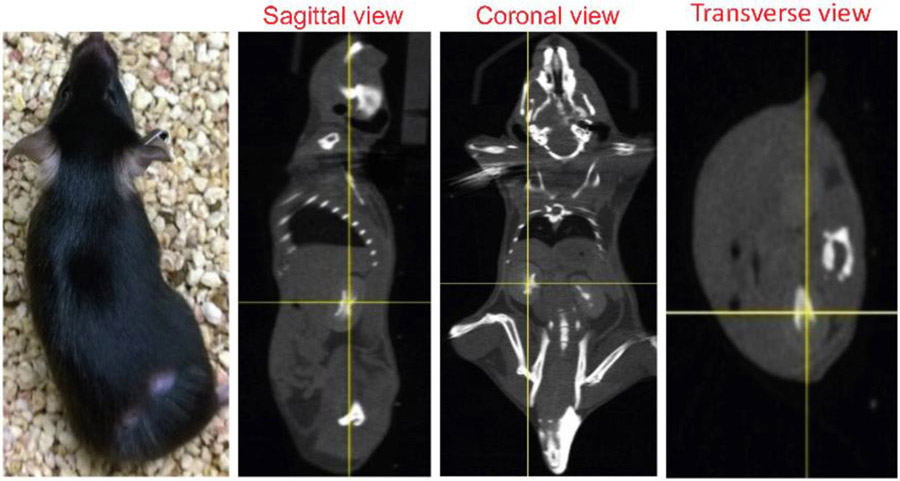
The yellow crosshair indicates the kidney center, which was subsequently aligned to the system isocenter for irradiation.
Figure 2. Representative photomicrographs of nontreated (NT) and irradiated 10-14 weeks old C57BL/6 mice at 20 weeks post-radiation (RT).
Paraffin-embedded sections, 5 μm thick, were stained with H&E, Masson trichrome, Picrosirius Red, Periodic Acid-Schiff (PAS). (A-C) Show degeneration of the renal tubules (black asterisks). Intact tubules are marked with (black arrowhead). H&E sections with diffuse tubular dilatation (yellow asterisks). (M) Quantification of the glomerular surface area. (D-F) Masson's trichrome staining section shows the blue-appearing collagen particularly evident in radiated specimens (green arrowhead). Interstitial fibrosis (green arrow). (G-I) Representative photomicrographs of picrosirius red-stained kidney sections show increased collagen deposits (dark red color shown by the blue arrow) in radiated mice. (N) Sirius-red positive area indicates the ratio of the mean picrosirius red-stained area to the whole mean area of the section. (J-L) shows the mesangial expansion in glomerulus after RT (black arrow). (O) shows the quantification of the mesangial expansion score from PAS staining. Values are mean ± SD. Scale bar = 50 μm. RT= radiation therapy, NT = No treatment.
Figure 3. Radiation changes the blood flow and vessel structure.
Five minutes before sacrifice, mice were injected intravenously with 200μl (1mg) of a FITC-labelled dextran/0.9% NaCl solution (2000 kDa). Frozen sections were fixed with 4% paraformaldehyde and images were captured using an Olympus VS120 fluorescence microscope. Analysis of renal perfusion showed that (A-B) non treated (NT) animals displayed a well-perfused honeycomb-like vascular network. This network was disturbed in radiated mice (C-F) and (G) the perfused vessel area was significantly reduced 20 weeks post-RT.
To investigate the effect of irradiation on overall animal health, we recorded the average body weight and kidney weight at sacrifice (Figure 4A-C). At 20 weeks, non-treated mice were significantly heavier than irradiated mice, and irradiation produced comparable levels of renal atrophy after the two treatment regimens. Blood urea nitrogen (BUN) levels were significantly increased after both radiation dose regimens (Fig. 4D). Elevated BUN levels indicate the kidneys are failing to clear urea from the bloodstream through radiation-induced disruption to normal renal function. A two-fold increase in serum creatinine after irradiation indicates a reduction in the filtration capacity of the glomeruli to remove creatinine from the blood (Fig. 4E). However, serum creatinine is not a good indicator of glomerular filtration rate and more sophisticated clearance methods may better provide accurate measurements of kidney function. Likewise, the urinary albumin-to-creatinine ratio, assessing the permeability of the glomerular filtration barrier to albumin, increased >2-fold after irradiation (Fig. 4F). The presence of albumin in the urine (Alb/Creat ratio) indicates increased permeability of the glomerular filtration barrier. ACR increased from 44.9μg/mg (±3.64) at baseline for non-treated animals to 100.4 μg/mg (±12.2) and 80.4 μg/mg (±3) for 1x14Gy and 5x6Gy groups respectively.
Figure 4. Assessment of kidney phenotypic parameters.
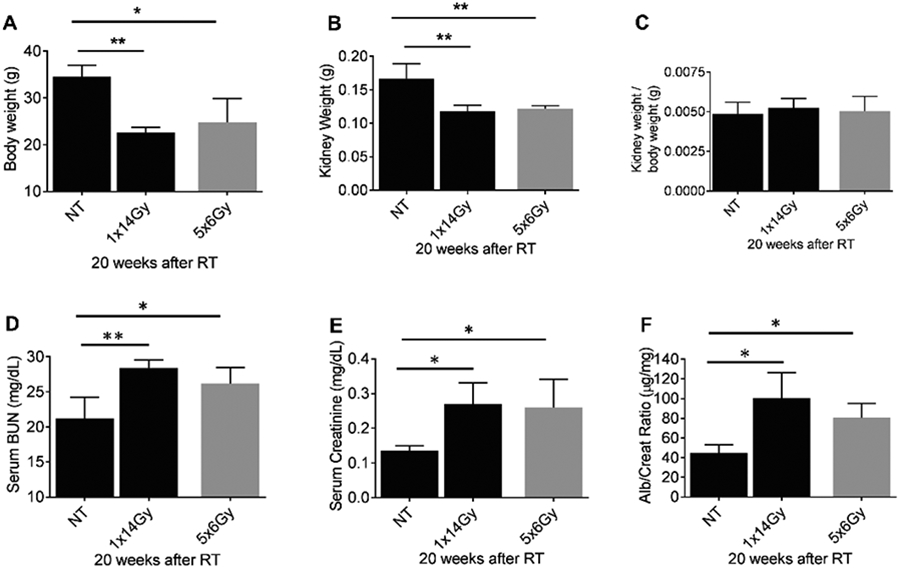
The kidneys of 10-14 weeks old C57BL/6 mice were radiated with 1x14 Gy using iSMAART/ or 5x6Gy by RAD Source RS 2000. (A) Bodyweight was measured before sacrifice. Then, mice were anesthetized using ketamine/xylazine and were perfused with cold PBS via left ventricle and kidneys harvested. (B) Both kidney weights were measured using the electronic weighing machine, and blood and (C) kidney weight and body weight ratio was calculated. Urine samples were collected 20 weeks after RT. Blood samples were analyzed for (D) serum BUN, and (E) serum creatinine (measured by tandem mass spectrometry). ELISA was used to determine (F) albumin-to-creatinine ratios (ACR) from urine samples 20 weeks post-RT.
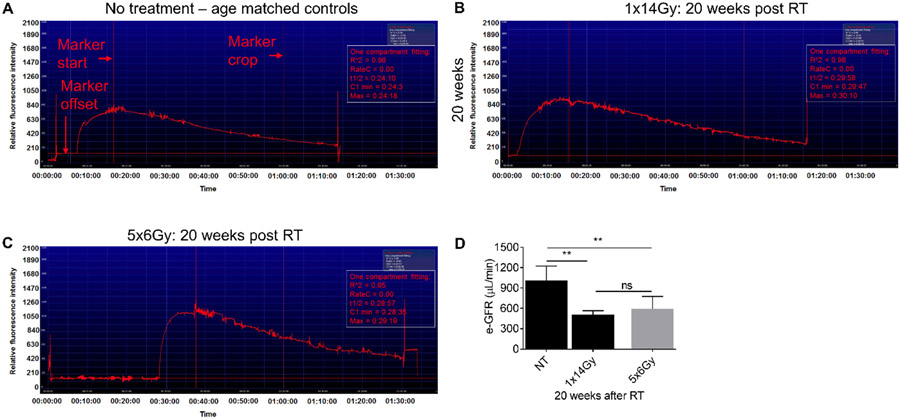
The FITC-sinistrin transcutaneous procedure has been previously described to measure GFR (Scarfe et al. 2018), and involves a fluorescence detection device placed on a depilated region of skin over the animal kidneys (Supplementary Figure 1). After FITC-sinistrin injection, continuous measurements are made for 90 minutes to determine the half-life (t1/2) of FITC-sinistrin clearance. Representative images of FITC-sinistrin excretion are shown over 90 minutes in Figure 5A-C and demonstrate a higher retention of FITC-sinistrin after 1x14Gy, with a calculated GFR (508.9±56) from an average of 5 mice per group (Fig. 5D). These data demonstrate this technique is consistent and reliable for assessing renal function after radiation treatment, although the values are composite values from both kidneys.
Figure 5. Representative image of an elimination curve of FITC-sinistrin from untreated (NT) and irradiated C57BL/6 mice 20 weeks post-irradiation.
FITC-sinistrin stock solution was prepared in PBS (40 mg/ ml) and 0.15mg/g body weight FITC-sinistrin was administered via the tail vein. The signal generated by FITC-sinistrin is detected transcutaneously and stored in the internal memory of the recording device located on the animals back. When the recorded data are downloaded onto a PC, the software generates a curve comparable to the one presented in the image (A-C). Y-axis shows the recorded fluorescence intensity [AU], emitted by the injected FITC-sinistrin marker, while the X-axis represents the duration of the measurement in time [min]. (D) estimated GFR values from t1/2values.
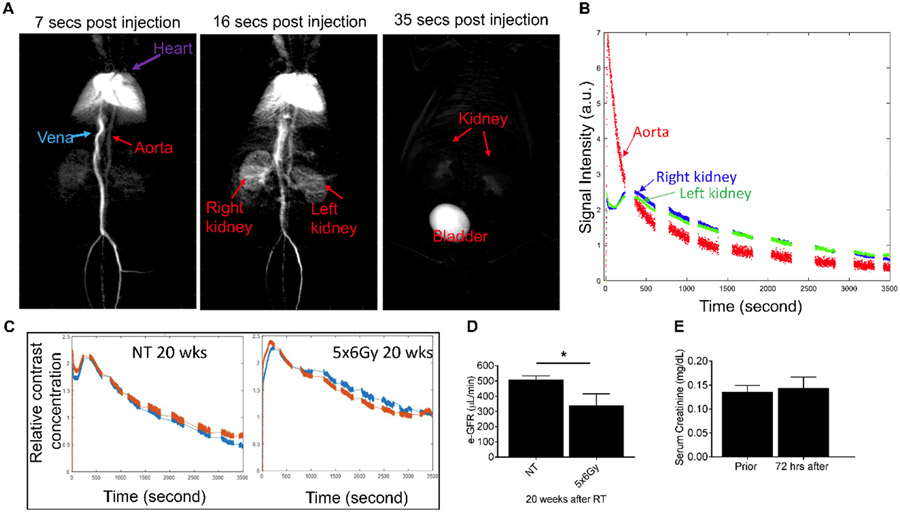
CT contrast is cleared out from both healthy kidneys to bladder with 35 seconds after injection (Fig. 6A). This data shows that maximum contrast signal intensity drops within 10 minutes post CT contrast injection (Fig 6B and C). We have compared the GFR values calculated at 10 minutes and 1 h post-CT contrast injection and we found no significant difference in GFR values (data not shown). We can estimate GFR ten minutes after injection instead of waiting for 1 hr. This technique is less time consuming and cost effective compared to FITC-sinistrin technique. Irradiation significantly reduced GFR. GFR values calculated from dynamic contrast-enhanced CT imaging showed comparable patterns of response for irradiated (5x6Gy) and non-treatment aged-match controls (Fig. 6C and D). After 5x6Gy, eGFR values decrease (340.9±74) compared with non-treated controls (509.8±56), indicating slower clearance of CT contrast agent in irradiated kidneys; with similar responses seen for both the left and right kidneys which shows the reproducibility of the radiation targeting (Fig. 6D). We observed no significant change in serum creatinine level 72 h post CT contrast injection (Fig. 6E).
Figure 6. Typical x-ray transmission projection kinetic curve of left and right kidneys after bolus injection of Iopamidol, for the untreated mouse or irradiated mouse 20 weeks after 5x6Gy irradiation.
The Iopamidol was infused at the speed of 1.38 mL/min with a Chemyx NanoJet syringe pump. The 2D x-ray projection was obtained using a PerkinElmer flat-panel detector with a temporal resolution of 0.5 s. Single exponential fitting was carried out during the 1000s~3000s period to calculate the excretion half time (t1/2). (A) shows clearance of CT contrast at different time points (B) Clearance curve of CT contrast from the aorta, left and right kidney from a non-treated (NT) mice (C) relative CT contrast clearance in NT and irradiated mice 20 weeks post-RT (D) graph showing estimated GFR values and (E) graph showing the change in serum creatinine levels 72hr post CT imaging.
The GFR of FITC-sinistrin and CT-measured contrast agents decreased similarly after irradiation and negatively correlated with elevated traditional measures of renal function (Figure 7). All function/damage parameters showed a strong positive correlation with e-GFR measured by CT based technique (Fig. 7 B, D, F and H). Whereas, all four function/damage parameters showed a positive but weaker correlation with e-GFR measured by FITC-sinistrin clearance technique (Fig. 7 A, C, E and G).
Figure 7. Correlation of measures of kidney function/damage parameters (albumin/creatinine ratio (ACR), blood urea nitrogen (BUN), serum creatinine and histological evaluation of mesangial expansion score) with e-GFR:
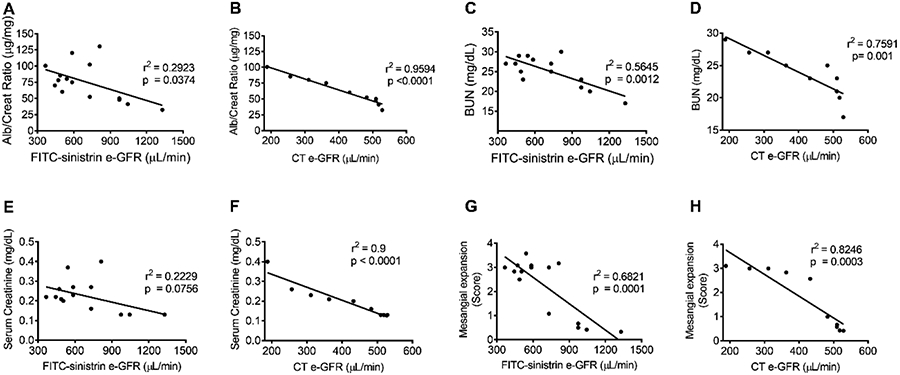
10-14 weeks old C57BL/6 mice were irradiated with either single dose of 14Gy or 5x6Gy and sacrificed 20 weeks post-RT. All function/damage parameters showed a strong positive correlation with e-GFR measured by CT imaging technique (B, D, F and H). Whereas, all four functional/damage parameters showed a positive but weaker correlation with e-GFR measured by FITC-sinistrin clearance technique (A, C, E and G).
To rule out the possibility of CT-contrast induced nephrotoxicity, GFR was measured using 30 week old C57BL/6 male and female mice (n = 5). 150 μL of diluted Isovue-300 contrast (1:1 diluted with ultra-pure normal saline) was given intravenously via lateral tail injection (n = 5). A second group of mice (n = 5) received 150 μL of ultra-pure saline solution only. Serum BUN, serum creatinine, and body weights were measured at baseline and one week after the CT-scan. No significant difference in urine creatine and protein levels 1-week post-treatment No significant changes in these parameters were seen between baseline and one week after the CT-scan between these two treatment groups (Figure 8).
Figure 8.
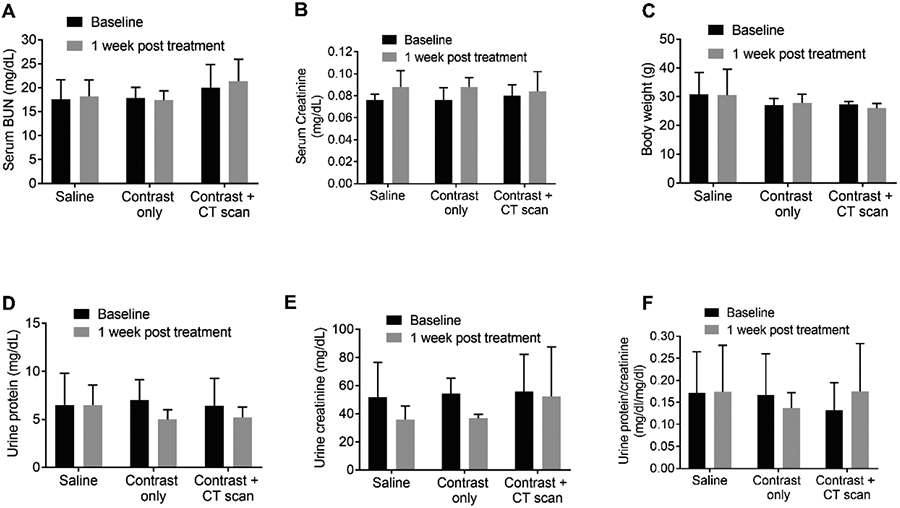
Evaluation of CT contrast-induced nephrotoxicity. 30 week old male and female C57BL/6 mice were injected either 150 μL of the diluted contrast agent Iopamidol (1:1 dilution with ultra-pure normal saline), or ultra-pure saline solution intravenously only, via lateral tail injection to perform the CT scan. Urine and blood were collected at baseline and 1 week after treatment to measure (A) serum BUN, (B) serum creatine, (C) body weight, (D) urine protein mg/dL, (E) urine creatinine (mg/dL) (F) urine protein to creatinine ration = 5 in each group; groups were compared by two-way ANOVA using graph prism pad software.
Discussion
Previously, we have reported that radiation induces the early cytoskeletal remodeling of podocytes and causes injury to glomerular endothelial cells (Ahmad et al. 2017; Abou Daher et al. 2020). Now, using two distinct methodologies, we demonstrate that the decline of kidney function in focally-irradiated C57BL/6 mice can be defined by measuring GFR. Radiation-induced kidney function loss has previously been measured using inulin clearance (Brochner-Mortensen 1985) and serial (99m)Tc-DMSA SPECT/CT imaging (Jackson et al. 2014). In this manuscript, we report for the first time the use of imaging and FITC-sinistrin based GFR measurements to assess radiation-induced nephropathy.
Hallmarks of renal injury and fibrosis manifest as structural glomerular alterations including the accumulation of extracellular matrix, tubular and glomerular atrophy and deposition of collagen (Farris and Alpers 2014). H&E-stained sections display tubular and glomerular changes. Our histopathology data showed that both RT regimens (1x14Gy and 5x6Gy) induced renal injury and fibrosis at 20 weeks. Changes in blood flow, vessel perfusion and integrity within the kidney was also seen after irradiation as defined using fluorescent dextran, and the reduced vascular perfusion that contribute to a decline in kidney function. This is supported by the dynamic contrast-enhanced CT imaging data that indicate a reduction in e-GFR after irradiation compared to non-treated aged-match controls and the FITC-sinistrin data showing higher retention of FITC-sinistrin (reduced e-GFR) after irradiation. Higher FITC-sinistrin retention was seen after single dose (1x14Gy) treatment compared to the fractionated radiation regimen (5x6Gy) 20 weeks after RT. The accuracy and reliability of measuring GFR using the transcutaneous measurement of FITC-sinistrin half-life has been previously reported (Schock-Kusch et al. 2009b; Schock-Kusch et al. 2011; Schreiber et al. 2012b; Schock-Kusch et al. 2013a; Zollner et al. 2013; Scarfe et al. 2018).
As has been previously reported (Schock-Kusch et al. 2011), to avoid artifacts associated with data acquisition during the recovery from anesthesia, a single compartment model (Schock-Kusch et al. 2009a) was found to be more appropriate than the two-compartment model for defining transcutaneous GFR measurements, along with the use of a rapid single intravenous bolus injection of FITC-sinistrin. The eGFR values measured by FITC-sinistrin in C57BL/6 mice in our study (1010±214 μL/min) were slightly lower than previously published values (1212±274 μL/min)(Schreiber et al. 2012a) which might reflect the younger age of the animals used in our study. However, the technique was found to be reproducible, values recorded in the same animals over a three day period had a coefficient of variance between 1-6%. Critically, the estimated GFR values obtained by this transcutaneous method correlated with functional biomarkers assessed from harvested blood or urine collections.
The blood-harvesting methods that evaluate plasma clearance are stressful and time-consuming because they require repeated restraining and vessel puncture for blood collection that can lead to fibrotic changes and vessel stenosis/obstruction (Nanni et al. 2007), whereas the transcutaneous measurement was well tolerated which allowed for sequential measurements within the same animal within 24 h; albeit the values represent only a change in relative fluorescence intensity as a surrogate measure of absolute tracer concentrations. Skin edema alters the detection of FITC-sinistrin renal excretion and therefore skin edema should be closely monitored to avoid false readings. Likewise, pigmented skin is a limitation because of the overlapping excitation and emission spectra of FITC-sinistrin and melanin.
In our experiments, the e-GFR determined by CT imaging was consistently lower than the GFR values determined using the FITC-sinistrin technique, and the reason for the discrepancy is unknown. However, there are a few possible explanations that are related to renal vascular resistance. The viscosity of the CT contrast agent may limit access to the smaller vessels in the kidney more so than the larger vessels although the 1:1 dilution may alleviate this concern, a characterization referred to as the Fahraeus effect (Pries et al. 1986), whereas, FITC-sinistrin is less restrained by vessel size and therefore high GFR values were recorded. Alternately, the anesthesia needed for animal immobilization that is required for CT imaging likely suppresses blood pressure and cardiac output, and this could lower mean arterial blood pressure and increase renal vascular resistance reducing the GFR measurements. Finally, CT agents are known to exhibit some nephrotoxic effects which could lead to a transient reduction in blood flow and reduction in GFR.
A major advantage of the FITC-sinistrin technique is that measurements of GFR are made on non-restrained and conscious animals over a prolonged time period in a single event, and repeated measurements can be made within a short-time period over a number of days without the necessity for blood sampling. In contrast, the toxicity associated with the use of some x-ray contrast agents and the prolonged anesthesia needed for x-ray imaging are less conducive to making daily measurements or multiple assessments with a single week. Also, the CT imaging is also prone to measurement artifacts from animal motion and respiration, although this can be minimized by calculating GFR values from captured images. However, the FITC-sinistrin technique is not without limitations. Skin edema and excessive pigmentation may reduce the efficacy of the detector, factors that do not impact GFR measurements by CT imaging. Also, the FITC-sinistrin methodology bilaterally assessed GFR, from both kidneys simultaneously, whereas both the left and right kidneys can be independently assessed using CT imaging. This latter distinct between the two approaches allows GFR measurements to be made after unilateral disease or damage, or combined injury modeling in which systemic nephrotoxic agents are given and then compared with concurrent irradiation on a single kidney such that chemotherapy can be compared with chemotherapy plus irradiation in separate kidneys within the same animal.
Conclusion:
GFR measurements do not require blood or urine samples and are reproducible. The FITC-sinistrin based technique allowed for the reproducible measurement of GFR in conscious, freely-moving mice. The dynamic contrast-enhanced CT imaging with nonionic contrast media can provide functional information and morphologic characteristics of the kidneys.
Supplementary Material
Acknowledgments
Funding was provided by NIH/NCI PQ12 1R01CA227493-01, Live Like Bella Grant from Florida Department of Health # 9LA08, Sylvester Comprehensive Cancer Center Award PG011608 and Radiation Oncology, University of Miami Miller School of Medicine, Sylvester Comprehensive Cancer Center.
Footnotes
Conflicts of Interest: Alessia Fornoni is consultant for Hoffman-La Roche, Alexion, and Mesoblast on subject matters that are unrelated to this publication. The authors declare no conflict of interest.
REFERENCES
- Abboud I, Peraldi MN, Hingorani S. 2012. Chronic kidney diseases in long-term survivors after allogeneic hematopoietic stem cell transplantation: monitoring and management guidelines. Semin Hematol. 49(1):73–82. [DOI] [PubMed] [Google Scholar]
- Abou Daher A, Francis M, Azzam P, Ahmad A, Eid AA, Fornoni A, Marples B, Zeidan YH. 2020. Modulation of radiation-induced damage of human glomerular endothelial cells by SMPDL3B. FASEB J. [DOI] [PubMed] [Google Scholar]
- Ahmad A, Mitrofanova A, Bielawski J, Yang Y, Marples B, Fornoni A, Zeidan YH. 2017. Sphingomyelinase-like phosphodiesterase 3b mediates radiation-induced damage of renal podocytes. FASEB J. 31(2):771–780. [DOI] [PMC free article] [PubMed] [Google Scholar]
- Arveschoug AK, Kramer SM, Iversen P, Frokiaer J, Gronbaek H. 2015. Monitoring Kidney Function in Neuroendocrine Tumor Patients Treated with (90)Y-DOTATOC: Associations with Risk Factors. Curr Radiopharm. 8(1):49–55. [DOI] [PubMed] [Google Scholar]
- Brochner-Mortensen J 1985. Current status on assessment and measurement of glomerular filtration rate. Clin Physiol. 5(1):1–17. [DOI] [PubMed] [Google Scholar]
- Cassady JR. 1995. Clinical radiation nephropathy. Int J Radiat Oncol Biol Phys. 31(5):1249–1256. [DOI] [PubMed] [Google Scholar]
- Cheng JC, Schultheiss TE, Wong JY. 2008. Impact of drug therapy, radiation dose, and dose rate on renal toxicity following bone marrow transplantation. Int J Radiat Oncol Biol Phys. 71(5):1436–1443. [DOI] [PubMed] [Google Scholar]
- Cohen EP, Lawton CA, Moulder JE, Becker CG, Ash RC. 1993. Clinical course of late-onset bone marrow transplant nephropathy. Nephron. 64(4):626–635. [DOI] [PubMed] [Google Scholar]
- Cohen EP, Pais P, Moulder JE. 2010. Chronic kidney disease after hematopoietic stem cell transplantation. Semin Nephrol. 30(6):627–634. [DOI] [PMC free article] [PubMed] [Google Scholar]
- Cohen EP, Piering WF, Kabler-Babbitt C, Moulder JE. 1998. End-stage renal disease (ESRD)after bone marrow transplantation: poor survival compar ed to other causes of ESRD. Nephron. 79(4):408–412. [DOI] [PubMed] [Google Scholar]
- Cohen EP, Robbins ME. 2003. Radiation nephropathy. Semin Nephrol. 23(5):486–499. [DOI] [PubMed] [Google Scholar]
- Crowley SD, Vasievich MP, Ruiz P, Gould SK, Parsons KK, Pazmino AK, Facemire C, Chen BJ, Kim HS, Tran TT et al. 2009. Glomerular type 1 angiotensin receptors augment kidney injury and inflammation in murine autoimmune nephritis. J Clin Invest. 119(4):943–953. English. [DOI] [PMC free article] [PubMed] [Google Scholar]
- Dawson LA, Kavanagh BD, Paulino AC, Das SK, Miften M, Li XA, Pan C, Ten Haken RK, Schultheiss TE. 2010. Radiation-associated kidney injury. Int J Radiat Oncol Biol Phys. 76(3 Suppl):S108–115. [DOI] [PubMed] [Google Scholar]
- Dawson LA, Normolle D, Balter JM, McGinn CJ, Lawrence TS, Ten Haken RK. 2002. Analysis of radiation-induced liver disease using the Lyman NTCP model. Int J Radiat Oncol Biol Phys. 53(4):810–821. [DOI] [PubMed] [Google Scholar]
- Dewit L, Verheij M, Valdes Olmos RA, Arisz L. 1993. Compensatory renal response after unilateral partial and whole volume high-dose irradiation of the human kidney. Eur J Cancer. 29A(16):2239–2243. [DOI] [PubMed] [Google Scholar]
- Ellery SJ, Cai X, Walker DD, Dickinson H, Kett MM. 2015. Transcutaneous measurement of glomerular filtration rate in small rodents: through the skin for the win? Nephrology (Carlton). 20(3):117–123. [DOI] [PubMed] [Google Scholar]
- Emami B, Lyman J, Brown A, Coia L, Goitein M, Munzenrider JE, Shank B, Solin LJ, Wesson M. 1991. Tolerance of normal tissue to therapeutic irradiation. Int J Radiat Oncol Biol Phys. 21(1):109–122. [DOI] [PubMed] [Google Scholar]
- Farris AB, Alpers CE. 2014. What is the best way to measure renal fibrosis?: A pathologist's perspective. Kidney Int Suppl (2011). 4(1):9–15. [DOI] [PMC free article] [PubMed] [Google Scholar]
- Imhof A, Brunner P, Marincek N, Briel M, Schindler C, Rasch H, Macke HR, Rochlitz C, Muller-Brand J, Walter MA. 2011. Response, survival, and long-term toxicity after therapy with the radiolabeled somatostatin analogue [90Y-DOTA]-TOC in metastasized neuroendocrine cancers. J Clin Oncol. 29(17):2416–2423. [DOI] [PubMed] [Google Scholar]
- Jackson P, Foroudi F, Pham D, Hofman MS, Hardcastle N, Callahan J, Kron T, Siva S. 2014. Short communication: timeline of radiation-induced kidney function loss after stereotactic ablative body radiotherapy of renal cell carcinoma as evaluated by serial (99m)Tc-DMSA SPECT/CT. Radiat Oncol. 9:253. [DOI] [PMC free article] [PubMed] [Google Scholar]
- Knijnenburg SL, Jaspers MW, van der Pal HJ, Schouten-van Meeteren AY, Bouts AH, Lieverst JA, Bokenkamp A, Koning CC, Oldenburger F, Wilde JC et al. 2012. Renal dysfunction and elevated blood pressure in long-term childhood cancer survivors. Clin J Am Soc Nephrol. 7(9):1416–1427. [DOI] [PMC free article] [PubMed] [Google Scholar]
- Knijnenburg SL, Mulder RL, Schouten-Van Meeteren AY, Bokenkamp A, Blufpand H, van Dulmen-den Broeder E, Veening MA, Kremer LC, Jaspers MW. 2013. Early and late renal adverse effects after potentially nephrotoxic treatment for childhood cancer. Cochrane Database Syst Rev.(10):CD008944. [DOI] [PubMed] [Google Scholar]
- Launay-Vacher V, Oudard S, Janus N, Gligorov J, Pourrat X, Rixe O, Morere JF, Beuzeboc P, Deray G, Renal I et al. 2007. Prevalence of Renal Insufficiency in cancer patients and implications for anticancer drug management: the renal insufficiency and anticancer medications (IRMA) study. Cancer. 110(6):1376–1384. [DOI] [PubMed] [Google Scholar]
- Lee JY, Jeong JM, Kim YJ, Jeong HJ, Lee YS, Lee DS, Chung JK. 2014. Preparation of Ga-68-NOTA as a renal PET agent and feasibility tests in mice. Nucl Med Biol. 41(2):210–215. [DOI] [PubMed] [Google Scholar]
- Lee SB, Kalluri R. 2010. Mechanistic connection between inflammation and fibrosis. Kidney Int Suppl.(119):S22–26. [DOI] [PMC free article] [PubMed] [Google Scholar]
- Luxton RW. 1953. Radiation nephritis. Q J Med. 22(86):215–242. [PubMed] [Google Scholar]
- Marincek N, Jorg AC, Brunner P, Schindler C, Koller MT, Rochlitz C, Muller-Brand J, Maecke HR, Briel M, Walter MA. 2013. Somatostatin-based radiotherapy with [90Y-DOTA]-TOC in neuroendocrine tumors: long-term outcome of a phase I dose escalation study. J Transl Med. 11:17. [DOI] [PMC free article] [PubMed] [Google Scholar]
- Montes GS. 1996. Structural biology of the fibres of the collagenous and elastic systems. Cell Biol Int. 20(1):15–27. English. [DOI] [PubMed] [Google Scholar]
- Nanni C, Pettinato C, Ambrosini V, Spinelli A, Trespidi S, Rubello D, Al-Nahhas A, Franchi R, Alavi A, Fanti S. 2007. Retro-orbital injection is an effective route for radiopharmaceutical administration in mice during small-animal PET studies. Nucl Med Commun. 28(7):547–553. [DOI] [PubMed] [Google Scholar]
- National Kidney F. 2002. K/DOQI clinical practice guidelines for chronic kidney disease: evaluation, classification, and stratification. Am J Kidney Dis. 39(2 Suppl 1):S1–266. [PubMed] [Google Scholar]
- Pries AR, Ley K, Gaehtgens P. 1986. Generalization of the Fahraeus principle for microvessel networks. Am J Physiol. 251(6 Pt 2):H1324–1332. [DOI] [PubMed] [Google Scholar]
- Rodemann HP, Blaese MA. 2007. Responses of normal cells to ionizing radiation. Semin Radiat Oncol. 17(2):81–88. [DOI] [PubMed] [Google Scholar]
- Sahni V, Choudhury D, Ahmed Z. 2009. Chemotherapy-associated renal dysfunction. Nat Rev Nephrol. 5(8):450–462. [DOI] [PubMed] [Google Scholar]
- Sallstrom J, Friden M. 2013. Simultaneous determination of renal plasma flow and glomerular filtration rate in conscious mice using dual bolus injection. J Pharmacol Toxicol Methods. 67(3):187–193. [DOI] [PubMed] [Google Scholar]
- Scarfe L, Schock-Kusch D, Ressel L, Friedemann J, Shulhevich Y, Murray P, Wilm B, de Caestecker M. 2018. Transdermal Measurement of Glomerular Filtration Rate in Mice. J Vis Exp.(140). [DOI] [PMC free article] [PubMed] [Google Scholar]
- Scharpfenecker M, Floot B, Russell NS, Coppes RP, Stewart FA. 2013. Endoglin haploinsufficiency attenuates radiation-induced deterioration of kidney function in mice. Radiother Oncol. 108(3):464–468. [DOI] [PubMed] [Google Scholar]
- Schock-Kusch D, Geraci S, Ermeling E, Shulhevich Y, Sticht C, Hesser J, Stsepankou D, Neudecker S, Pill J, Schmitt R et al. 2013a. Reliability of transcutaneous measurement of renal function in various strains of conscious mice. Plos One. 8(8):e71519. [DOI] [PMC free article] [PubMed] [Google Scholar]
- Schock-Kusch D, Geraci S, Ermeling E, Shulhevich Y, Sticht C, Hesser J, Stsepankou D, Neudecker S, Pill J, Schmitt R et al. 2013b. Reliability of Transcutaneous Measurement of Renal Function in Various Strains of Conscious Mice. Plos One. 8(8). English. [DOI] [PMC free article] [PubMed] [Google Scholar]
- Schock-Kusch D, Sadick M, Henninger N, Kraenzlin B, Claus G, Kloetzer HM, Weiss C, Pill J, Gretz N. 2009a. Transcutaneous measurement of glomerular filtration rate using FITC-sinistrin in rats. Nephrol Dial Transplant. 24(10):2997–3001. [DOI] [PubMed] [Google Scholar]
- Schock-Kusch D, Sadick M, Henninger N, Kraenzlin B, Claus G, Kloetzer HM, Weiss C, Pill J, Gretz N. 2009b. Transcutaneous measurement of glomerular filtration rate using FITC-sinistrin in rats. Nephrol Dial Transpl. 24(10):2997–3001. English. [DOI] [PubMed] [Google Scholar]
- Schock-Kusch D, Xie Q, Shulhevich Y, Hesser J, Stsepankou D, Sadick M, Koenig S, Hoecklin F, Pill J, Gretz N. 2011. Transcutaneous assessment of renal function in conscious rats with a device for measuring FITC-sinistrin disappearance curves. Kidney Int. 79(11):1254–1258. [DOI] [PubMed] [Google Scholar]
- Schreiber A, Shulhevich Y, Geraci S, Hesser J, Stsepankou D, Neudecker S, Koenig S, Heinrich R, Hoecklin F, Pill J et al. 2012a. Transcutaneous measurement of renal function in conscious mice. Am J Physiol Renal Physiol. 303(5):F783–788. [DOI] [PubMed] [Google Scholar]
- Schreiber A, Shulhevich Y, Geraci S, Hesser J, Stsepankou D, Neudecker S, Koenig S, Heinrich R, Hoecklin F, Pill J et al. 2012b. Transcutaneous measurement of renal function in conscious mice. Am J Physiol-Renal. 303(5):F783–F788. English. [DOI] [PubMed] [Google Scholar]
- Sha H, Udayakumar TS, Johnson PB, Dogan N, Pollack A, Yang Y. 2016. An image guided small animal stereotactic radiotherapy system. Oncotarget. 7(14):18825–18836. [DOI] [PMC free article] [PubMed] [Google Scholar]
- Shi J, Udayakumar TS, Wang Z, Dogan N, Pollack A, Yang Y. 2017a. Optical Molecular Imaging Guided Radiation Therapy Part 1: Integrated X-ray and Bioluminescence Tomography. Med Phys. [DOI] [PubMed] [Google Scholar]
- Shi J, Udayakumar TS, Wang Z, Dogan N, Pollack A, Yang Y. 2017b. Optical Molecular Imaging Guided Radiation Therapy Part 2: Integrated X-ray and Fluorescence Molecular Tomography. Med Phys. [DOI] [PubMed] [Google Scholar]
- Skinner R, Kaplan R, Nathan PC. 2013. Renal and pulmonary late effects of cancer therapy. Semin Oncol. 40(6):757–773. [DOI] [PubMed] [Google Scholar]
- Stewart FA, Bartelink H, van der Voet GB, de Wolff FA. 1991. Renal damage in mice after sequential cisplatin and irradiation: the influence of prior irradiation on platinum elimination. Radiother Oncol. 21(4):277–281. [DOI] [PubMed] [Google Scholar]
- Stewart FA, Luts A, Lebesque JV. 1989. The lack of long-term recovery and reirradiation tolerance in the mouse kidney. Int J Radiat Biol. 56(4):449–462. [DOI] [PubMed] [Google Scholar]
- Takahashi N, Boysen G, Li F, Li Y, Swenberg JA. 2007. Tandem mass spectrometry measurements of creatinine in mouse plasma and urine for determining glomerular filtration rate. Kidney Int. 71(3):266–271. English. [DOI] [PubMed] [Google Scholar]
- Vegt E, de Jong M, Wetzels JF, Masereeuw R, Melis M, Oyen WJ, Gotthardt M, Boerman OC. 2010. Renal toxicity of radiolabeled peptides and antibody fragments: mechanisms, impact on radionuclide therapy, and strategies for prevention. J Nucl Med. 51(7):1049–1058. [DOI] [PubMed] [Google Scholar]
- Wei CL, El Hindi S, Li J, Fornoni A, Goes N, Sageshima J, Maiguel D, Karumanchi SA, Yap HK, Saleem M et al. 2011. Circulating urokinase receptor as a cause of focal segmental glomerulosclerosis. Nat Med. 17(8):952–U970. English. [DOI] [PMC free article] [PubMed] [Google Scholar]
- Withers HR, Mason KA, Thames HD Jr. 1986. Late radiation response of kidney assayed by tubule-cell survival. Br J Radiol. 59(702):587–595. [DOI] [PubMed] [Google Scholar]
- Withers HR, Taylor JM, Maciejewski B. 1988. Treatment volume and tissue tolerance. Int J Radiat Oncol Biol Phys. 14(4):751–759. [DOI] [PubMed] [Google Scholar]
- Zollner FG, Schock-Kusch D, Backer S, Neudecker S, Gretz N, Schad LR. 2013. Simultaneous measurement of kidney function by dynamic contrast enhanced MRI and FITC-sinistrin clearance in rats at 3 tesla: initial results. Plos One. 8(11):e79992. [DOI] [PMC free article] [PubMed] [Google Scholar]
Associated Data
This section collects any data citations, data availability statements, or supplementary materials included in this article.


