

Abstract
The environmental metals cadmium, lead, and mercury, and chemicals such as pesticides, phthalates, and bisphenols, disrupt bone metabolism in many ways. Body levels of these toxins directly correlate, in a dose-dependent manner, with risk of fracture and osteoporosis. This editorial provides a brief summary of key research showing mechanisms of damage, sources, and key strategies to decrease body load.
Introduction
Longtime readers know I’ve written many editorials on how environmental metals, metalloids, and chemicals cause far more disease than commonly recognized. My editorial 4 years ago on the role of toxins in the diabetes epidemic clearly lays out the problem.1 I am currently helping my wife, Lara, write her newest book, Your Beautiful Bones. Upon completing review of the causes of bone loss, I was struck by the large number of studies she found on the many ways environmental toxins cause bone loss. The research is so strong that a focused editorial seemed important in order to bring these preventable and treatable causes to the attention of our clinician readers. Here, I only have enough room to cover the environmental metals and chemicals. Clinicians, however, need to be aware of the other causes that must be addressed, including fluoride; prescribed and OTC drugs; and molecules generally considered nontoxic, such as salt and phosphate additives. While these later compounds are required for health, they are consumed at levels in American diets so high that they are another significant cause of bone loss that must be considered.
Obviously, the critical nutrients needed for bones must be provided. But in our toxic world, merely providing nutrients will have limited benefit if the ubiquitous toxic load is not addressed. The good news is that the clinical impact of these longtime exposures is being better recognized and researched. Particularly important is that we are finally seeing research on multiple exposures, rather than the simplistic single-exposure research that has missed so much of what is happening in the real world.
As I have looked at the research on nutrient deficiencies and toxic load, I have been consistently struck by how the damage to bone function reflects the damage to metabolism throughout the body. While this editorial focuses on bone health, the reader will easily see how the discussed mechanisms apply widely.
Metals
One of the big challenges in understanding the role of metals in disease, such as osteoporosis, is that until relatively recently, virtually all of the research was on industrial exposure or accidental poisoning. I still remember my frustration when teaching, in 1978, the first class on environmental medicine at what was then named John Bastyr College of Naturopathic Medicine. I spent many hours reviewing every textbook I could find on toxicology, and every one of them adamantly stated in their introduction that the toxins they covered were at low levels in the general population and had no clinical significance. I knew this wasn’t true as I was clearly seeing metal and chemical toxicity in my patients who had no obvious industrial exposure. The good news is that humans have been mining and using metals for centuries, so there is a lot of research on their damaging effects at high levels of exposure. Researchers are now documenting that this damage occurs at much lower levels when the exposure is lifelong.
Cadmium
The damaging effects of cadmium on bone were first recognized in 1968 in Toyama Prefecture, Japan. Metal mining contaminated the water supply with cadmium, which was then absorbed by the rice grown in the water. Those eating the rice developed a condition called itai-itai (it hurts, it hurts) disease, and they suffered high incidences of kidney stones, kidney failure, hypercalciuria, bone pain, and osteoporosis.
Determining body load of cadmium can be very challenging. The level in the urine is a good measure of current exposure, but it correlates weakly with body load. Cadmium has a very long biological half-life, in the range of 10–30 years, and it accumulates in kidneys and bone. In patients with itai-itai disease, urinary excretion of cadmium was nearly 30 μg/g creatinine.2
The urinary cadmium level considered “safe” by the US Occupational Safety and Health Administration (OSHA) is 3 μg/g creatinine.3
Unfortunately, the latest research shows this OSHA standard is far too high. Like lead and mercury, there is no apparent safe level of cadmium. Many studies now show that people with urinary levels as low as 0.5 μg/g creatinine suffer increased risk of osteoporosis, fracture, kidney disease, and many cancers, including lung, pancreas, breast, endometrium, prostate, and bladder.4
A large 2011 study of 2688 women in Sweden looked at urinary cadmium levels and bone mineral density, measured by DEXA (dual-energy x-ray absorptiometry). Comparing women with a urinary cadmium level <0.50 μg/g creatinine with those >0.75 μg/g creatinine found a 245% increased risk of osteoporosis at the femoral neck and 197% increased risk in lumbar spine. A surprising finding was that women with higher cadmium levels—but who were non-smokers—had an even higher risk: 347% risk for osteoporosis at the femoral neck and 326% at the lumbar spine.5 This does not mean that smokers’ bones are not at increased risk of cadmium-induced osteoporosis! Rather, it implies that the cadmium exposure in nonsmokers is primarily dietary and associated with some other damaging factor as well.
In another study, women with urinary cadmium levels between 0.50 and 1.00 μg/g creatinine had a 43% greater risk for hip-BMD-defined osteoporosis, compared to those with urinary cadmium levels <0.50 μg/g.6 As can be seen in Figure 1, there is an inverse dose relationship between urinary cadmium and bone density.
Figure 1.
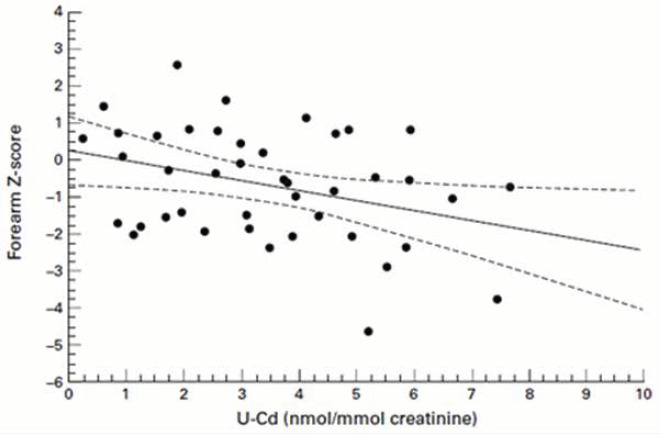
Urinary Cadmium Inversely Correlates with Bone Density7
Research is growing that shows dietary cadmium, rather than tobacco, is the primary source of cadmium-related osteoporosis risk in the US female population aged 50 years or older. Comparable research has not yet been done on men.8
Mechanism of Bone Damage
Cadmium disrupts bone metabolism in many ways, with the worst appearing to be from impairing key kidney functions and directly damaging the osteoblasts.
Vitamin D, whether from diet or production in the skin, must be first hydroxylated in the liver and then receive a second hydroxylation in the kidneys in order to produce its most active form, calcitriol (1,25[OH]2D3). Cadmium poisons the kidney enzyme that converts 25(OH)D to 1,25(OH)2D3.
Cadmium also damages the kidney’s ability to excrete toxins and to reabsorb important molecules and minerals. This results in increased loss of calcium in the urine. In fact, hypercalciuria is an indirect marker of low-level cadmium exposure.
Cadmium inhibits the activity of alkaline phosphatase, which is produced by osteoblasts and is needed to deposit calcium into newly formed bone. Cadmium also decreases bone’s collagen content by stimulating the formation and activity of osteoclasts, which break down the collagen matrix in bone as part of normal remodeling. Finally, cadmium activates gene expression of “toxic response” pathways in bone cells, which further stimulates osteoclast bone resorption.
Cadmium Body Load in the United States
The US government does a good job of tracking body load of metals and chemicals. The CDC (Centers for Disease Control and Prevention) publishes and regularly updates the National Report on Human Exposure to Environmental Chemicals. As can be seen in the following Table, about 15% of Americans are above the 0.5 μg/g creatinine threshold. The good news is that the average level is decreasing—probably due to decreasing prevalence of smoking.
Table.
US Urinary Cadmium Levels9
| Categories (Survey Years) |
Geometric Mean (95% conf. interval) |
50th Percentile (95% conf. interval) |
75th Percentile (95% conf. interval) |
90th Percentile (95% conf. interval) |
95th Percentile (95% conf. interval) |
Sample Size |
|---|---|---|---|---|---|---|
| Total population (1999-2000a) | .181 (.157-.209) | .219 (.199-.238) | .423 (.391-.446) | .712 (.645-.757) | .941 (.826-1.07) | 2257 |
| Total population (2001-2002a) | .199 (.181-.218) | .212 (.194-.232) | .404 (.377-.440) | .690 (.630-.754) | .919 (.813-.998) | 2689 |
| Total population (2003-2004) | .210 (.201-.219) | .208 (.189-.226) | .412 (.381-.438) | .678 (.650-.716) | .940 (.833-1.04) | 2543 |
| Total population (2005-2006) | .189 (.169-.210) | .180 (.160-.200) | .370 (.310-.430) | .650 (.590-.720) | .910 (.770-1.08) | 2576 |
| Total population (2007-2008) | .193 (.177-.210) | .190 (.180-.210) | .370 (.330-.410) | .660 (.580-.740) | .960 (.840-1.06) | 2627 |
| Total population (2009-2010) | .191 (.184-.199) | .180 (.170-.190) | .370 (.340-.400) | .680 (.630-.730) | .910 (.840-1.00) | 2848 |
| Total population (2011-2012) | .176 (.165-.187) | .172 (.159-.182) | .346 (.313-.378) | .582 (.551-.639) | .907 (.772-.997) | 2502 |
| Total population (2013-2014) | .144 (.136-.152) | .138 (.125-.151) | .288 (.263-.311) | .563 (.487-.621) | .800 (.712-.859) | 2663 |
| Total population (2015-2016) | .144 (.135-.154) | .139 (.128-.152) | .293 (.264-.320) | .523 (.459-.589) | .781 (.675-.906) | 3058 |
Note: < LOD means less than the limit of detection for the urine levels not corrected for creatinine.
aAll results are corrected for molybdenum oxide interference in the ICP-MS method.
Strategies to Decrease Patient Cadmium Load
Cadmium is naturally present at low levels in the earth’s crust, so small levels of cadmium may be found in all foods, especially if the soil is deficient in zinc. However, crops grown with high-phosphate fertilizers typically have much more cadmium because these types of fertilizers can contain cadmium in amounts up to 300 mg/kg.10
Of course, being near a smelter or mining operation increases exposure. When coal is burned, cadmium (and mercury) is released into the atmosphere depositing everywhere—agricultural land, water supply, backyards, windowsills, etc. Smokers’ (and second-hand smokers) exposure to cadmium is greatly increased because cadmium inhaled into the lungs in cigarette smoke is more effectively absorbed than dietary cadmium.
The first strategy, of course, is to decrease exposure. This entails:
Stopping both direct and indirect exposure to cigarette smoke.
Avoiding consumption of oysters, scallops, and shellfish from coastal waters contaminated with cadmium, such as found along the coasts of the New England and Great Lakes states.
Avoiding all foods grown with high-phosphate fertilizers—especially soybeans—which means eating organically.
Not allowing outdoor shoes to be worn inside the house.
Dusting regularly and using air filters, such as MERV-12 (preferred) or above in whole house forced-air systems, or HEPA filters in rooms most used.
Avoiding children’s jewelry imported from China. In 2010, an analysis of 103 such items by the US Consumer Product Safety Commission found that 12% contained at least 10% cadmium, and one item had a stunning 91% cadmium. A further Associated Press investigation in 2012 revealed federal regulators have not succeeded in preventing toxic levels of cadmium from being present in children’s jewelry.11
The second strategy is to ensure adequate consumption of foods rich in the trace minerals that compete with cadmium. Of particular importance are copper, iron, zinc, and selenium.
The third strategy is to increase excretion. This is quite tricky as great care must be taken to avoid increasing tissue release of cadmium faster than excretion, which can result in redistribution and more toxic effects. At this point, saunas appear to be the safest and most effective method—albeit slow. Stephen Genuis has done great work in the area of bioaccumulated toxic elements and their methods of excretion from the human body.12
Lead
Approximately 90% of the body burden of lead is in the bones where it causes osteoporosis. The US began phasing out sources of lead in the 1970s, starting with gasoline and other common uses. It was fully banned in 1996 with the US Clean Air Act. This is a good example of an effective public health measure as blood lead levels have dropped significantly. Unfortunately, since lead accumulates in the bone, those whose bones were developed before the environmental levels significantly decreased have bones that are full of lead, ie, basically everyone over the age of 50. When bone is lost—such as during menopause and andropause—the lead comes out. It is not a coincidence that this is when most disease shows up as well.
Although lead has been removed from gasoline, paint, solder for copper pipes, etc, lead is an element and so can’t be broken down; it persists in the environment and biological systems. Adding to this, houses built before lead was banned have lead in paint and plumbing; many city water supplies have lead pipes—and there are still loopholes.13 If the water is acidic or corrosive, lead is leached into the water, such as happened in Flint, MI. According to the National Health and Nutrition Examination Survey, around a half million US young children have unsafe blood lead levels (at or above 5 μg/dL). A recent analysis indicated the United States loses $50.9 billion in economic activity each year because of IQ points lost to lead exposure.14
Clear associations have now been found between increased bone levels of lead and osteoporosis, kidney disease, cataracts, high blood pressure and death rate, and to a lesser extent in many other diseases.15 In fact, a recent study found that lead causes a stunning 18% of all-cause mortality and one-third of cardiovascular deaths.16
Mechanism of Bone Damage
Lead levels inversely correlate with bone density.17 Lead causes bone loss primarily through 3 mechanisms: decreasing the formation of bone-building osteoblasts, facilitating bone-removing osteoclasts, and inhibiting kidney conversion of vitamin D to its to its active hormonal form, thus impairing calcium absorption and deposition.18,19
Lead decreases production of a major DNA transcription factor in bone marrow cells—Cbfa-1/Runx-2 (core binding factor-1/runt-related transcription factor-2). This signaling factor stimulates mesenchymal stem cells to become osteoblasts instead of fat cells. So less bone and more fat.
Lead increases the production of sclerostin and peroxisome proliferator-activated receptor-γ (PPAR-γ), both of which prevent the formation of new bone. Sclerostin is an important bone-building protein antagonist which keeps calcium from being deposited in soft tissues as well as limiting how much bone is formed. Sclerostin is produced by osteocytes, which are what osteoblasts turn into after they begin laying down the matrix for new bone. Sclerostin shuts down proteins involved in bone formation in areas where new bone formation has already been completed or where new bone formation is not wanted. This is a good example of the checks and balances found throughout metabolism. Without sclerostin, bone formation would continue out of control, which can lead to many problems. For example, a rare genetic defect (SOST gene on chromosome 17q12-q21) impairs its production resulting in sclerostenosis and van Buchem disease. This can lead to closure of normally open skull foramens through which the acoustic and optic nerves pass, leading to deafness and blindness.20
These factors–Cbfa-1/Runx-2, sclerostin and PPARγ–are involved in the Wnt/β-catenin pathway. When Cbfa-1/Runx-2 is not inhibited, and sclerostin and PPAR-γ are, this pathway builds bone. Lead disrupts the harmony of this pathway, distorting the normal balance among the bone-remodeling actions of the Wnt/β-catenin pathway.
Lead, like other heavy metals (eg, mercury, cadmium), has a number of toxic effects on the kidneys that result in kidney tissue becoming fibrotic, scarred, and atrophied. Interestingly, but not surprising considering its role in gout, one of lead’s damaging effects on the kidneys is that it causes the retention of uric acid. Lead levels correlate directly with serum uric acid and inversely with creatinine clearance and 1,25(OH)2D3 levels.
Lead Body Load in the US
As mentioned above, lead exposure in the general community has significantly decreased since banning of lead began in the 1970s. From 1976 to 1991 the percentage of blood lead levels >10 μg/dL dropped from 85% to 5.5% in white children and from 97% to 2.6% in black children. This big drop in lead in children is especially important since not only are kids more sensitive to lead toxicity—especially neurologically—but the reduction of blood levels means less lead is being stored during the period of maximum bone formation.
Lead in bone has a long half-life. The metabolism of lead stored in bone parallels that of calcium. Calcium is removed during bone remodeling, and lead is also liberated and passes along with calcium from bone into blood. As can be seen in Figure 2, we’ve continued to make good progress in decreasing lead levels in children. Since children absorb 40% of a dose of lead compared to 10% in adults and retain 30% of lead absorbed compared to 1% in adults, limiting exposure at an early age is critical.
Figure 2.
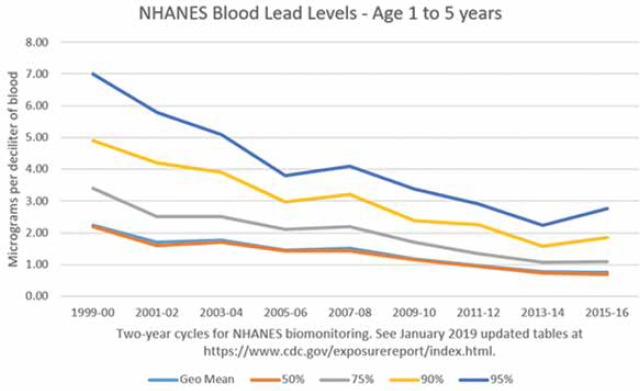
Public Health Measures Have Been Effective at Lowering Lead Levels
The half-life of lead is about 1 month in blood, 1-1.5 months in soft tissue, and 25-30 years in bone.21 This clearly shows lead in bone is well sequestered. However, the rate of release of lead from bone can increase due to anything that causes hypocalcemia, as well as chronic metabolic acidosis, eating an acid-forming diet, bone loss during menopause/andropause, prolonged dietary deficiency of nutrients required for bone formation, drugs which induce bone loss, etc.22,23
Hypocalcemia can be due to a variety of factors, including insufficient consumption of calcium-rich foods or supplements, hypochlorhydria, the use of stomach acid suppressing drugs, insufficient vitamin D levels, hyperthyroidism, or the use of antiresorptive drugs for bones.
In menopausal and post-menopausal women who do not use estrogen replacement therapy, estrogen deficiency-induced osteoporosis is associated with elevated blood lead levels resulting from increased release into the blood of stored lead in bone along with calcium.
Blood levels of lead correlate poorly with bone levels and primarily indicate recent environmental exposure, eg, from old piping; demolition of an older house; wine, olives, or flour processed in lead-contaminated vessels; heavy use of firearms in indoor settings; or accidental contamination from toxic waste in rivers.
Strategies to Decrease Patient Lead Load
As usual, avoidance is the first priority, especially with toxins that have such a long half-life. The CDC has great guidance on sources of lead, which can be found here: Sources of Lead | Lead | CDC (https://www.cdc.gov/nceh/lead/prevention/sources.htm).
The current primary sources are:
Paint in houses older than about 1978
Water in houses older than about 1978 if their water supply is acidic or corrosive
Consumer foods or drinks high in lead, such as tea from China
Jewelry and pottery from countries with poor metal control
Loss of bone
Because lead is so hard to naturally excrete, intervention is needed. While aggressive IV chelation treatments have considerable research showing efficacy, these approaches also have significant, and potentially serious adverse drug reactions (ADRs). I recommend a much slower oral chelation approach which has rare ADRs and virtually no risk of redistribution. I’ve used this protocol on hundreds of patients with good results. But be clear, it is slow and benefits typically do not become clinically apparent for months. Below is my current protocol—which I use for both mercury and lead toxicity:
500 mg NAC bid. Significantly increases production of glutathione which plays a tremendous role in protecting the body from the oxidative stress caused by heavy metals. In addition, NAC increases excretion of the methylmercury found in fish.
5 g fiber bid. Most metal excretion is through the gut. Without adequate fiber, much is reabsorbed through enterohepatic recirculation. If the patient can tolerate it, the more fiber the better.
250 mg meso-2,3-dimercaptosuccinic acid (DMSA) every third day. Mainly binds to metals in the gut. About 10% is absorbed, so also increases excretion in urine.
Watch for sulfur-sensitive patients. While not common—I estimate 3%—patients will have sulfur metabolism problems and can develop allergies, GERD, and/or IBS with this protocol. Most will benefit from molybdenum (300 μg, oral), but will take several months during which NAC and DMSA must be decreased.
Pesticides
The Standard American Diet (SAD) exposes everyone daily to a mixture of multiple pesticides. These pesticide contaminants, though at low dosages, are now recognized to contribute to virtually every chronic disease. (See my many editorials on chemical pollutants.)
Animal studies are now looking at the effects of pesticides both singly and, more importantly, when combined at body load levels corresponding to what the U.S. Environmental Protection Agency defines as “Acceptable Daily Intakes” (ADIs) for humans. Another standard for these “safe” levels is NOAEL, an acronym for “no-observed-adverse-effect level.” Burgeoning research is showing not only are these supposed safe levels too high, but when combined, their toxic effects are synergistic and multiplicative.
Another key aspect that helps explain the widespread damage from pesticides is the oxidative stress they cause. This elevates the baseline inflammation set point which then sets the body up for increased damage from other causes as well. For example, endosulfan, a once widely used organochloride pesticide that is now being phased out, is well known to be a powerful stimulation of oxidative stress. Endosulfan activates inflammatory signaling molecules such as NF-kappa B that trigger the production of other pro-inflammatory mediators such as TNFα and IL-6.24 This subclinical chronic inflammation is now well recognized to be a significant contributor to such problems as metabolic syndrome, which increases risk of type 2 diabetes, cardiovascular disease, and osteoporosis, as well as other diseases. Those who read my joint editorial on COVID-19 will recognize how elevation of these inflammatory molecules increases the risk for the deadly cytokine storm.25
Organophosphate Pesticides
An illustrative study gave rats drinking water with dosages of 4 organophosphate pesticides at their NOAELs. Dichlorvos, dimethoate, acephate, and phorate are insecticides widely used on many food crops. 26 When combined, they caused chronic low-grade inflammation and liver, thyroid, and renal dysfunction. The latter is especially significant as (discussed more fully below) most anything that causes kidney dysfunction increases risk of bone loss. This is due not only to the problem of impaired conversion of vitamin D to its active dihydroxylated form, 1,25(OH)2D3,but also decreases the kidney’s ability to excrete acid compounds. This results in increased scavenging of calcium from bone to help neutralize the excess acid and its loss in the urine. Obviously, anything that impairs kidney function will cause bone loss.
Organochlorine Pesticides (OCPs)
Organochlorine pesticides are a significant cause of chronic kidney disease (CKD), which increases risk for osteoporosis. Those with an eGFR <60 mL/min have double the risk of osteoporosis.27
These new-to-nature chlorinated hydrocarbons have been manufactured using diverse organic backbones with varying numbers of attached chlorines. Their mechanism of insecticidal action is typically neurotoxicity and their rate of detoxification decreases in proportion to the number of chlorines added. This results in detoxification half-lives ranging from weeks to years. The now banned DDT is a classic example and has a half-life in humans of several years. At supposedly “safe” levels, OCPs promote bone loss by impairing lipid (cholesterol) and protein metabolism causing liver, kidney, and thyroid dysfunction, and increasing chronic low-grade inflammation.
Researchers evaluated blood levels of organochlorine pesticides in 270 patients with chronic kidney disease and 270 age- and sex-matched healthy controls. OCP levels were much higher in CKD patients, especially those with SNPs that impaired glutathione metabolism which is critical for detoxification of this class of toxins. Those with the GSTM1(-)/GSTT1(-) genotype had a 1.8 fold increased risk of CKD compared to healthy controls. Also of importance was a significant inverse correlation between OCP levels and eGFR.28 Having at least one slow enzyme for the production or recycling of glutathione is surprisingly common, affecting 20%-50% of the general population.29
As would be expected, people working in conventional agriculture have substantial chemical exposure from spraying pesticides and herbicides on crops. A study of 81 pesticide sprayers found that their levels of key protective antioxidant enzymes (eg, superoxide dismutase) were greatly lowered, impairing their ability to combat the inflammation caused by the pesticides.30 Increased inflammation is strongly correlated with bone loss.
Plastics and Plasticizers
Plastics have become ubiquitous in the modern world and humans are exposed to plastics and plasticizers in many ways, especially in food and drinking water. In the US, 94% of tap water samples were found to be contaminated with plasticizers in 2019.
Plasticizers—the chemicals that keep plastics soft and pliable—migrate out of their host plastics, and when absorbed promote inflammation that promotes bone loss.
In a recent study, “microplastics” were detected in 83% of tap water samples from around the world–with the highest concentrations seen in the US. Humans are being exposed to tiny shards of plastic from decomposing plastic bottles, containers, plastic wrap, and plastic grocery bags. According to researchers, the real concern is not the shards of plastic in the body, but the chemicals they contain.
Plasticizers cause inflammation and bone loss because they disrupt the functioning of the endocrine system. Plasticizers disrupt the normal production and signaling of thyroid, parathyroid, adrenal, and sex hormones.
We’ve only room here to briefly cover the effects on bone of 2 very commonly used plasticizers–phthalates and BPA. Phthalates make plastic soft; BPA makes plastic hard. BPA-based plastic is clear and tough and is made into a variety of common consumer goods, such as plastic bottles. Epoxy resins containing BPA are used to line water pipes, to coat the inside of many food and beverage cans, and to make the thermal paper used in sales receipts.
Both phthalates and BPA decrease circulating levels of vitamin D in adults, increasing risk of deficiency by approximately 20%.31
Phthalates
Women with higher urine levels of phthalates have lower hip and femur BMD and are at higher risk of osteoporosis.32 Phthalates are incorporated into plastic to increase its flexibility, transparency, and durability. They’re found in plastic bottles, all kinds of containers, plastic tubing used in medical devices, water fountains, soda dispensers, and the equipment used to add liquids in the production of processed foods. They’re present in food additives, food wraps and other packaging, controlled release medicines, and children’s toys. Cosmetics and perfumes also contain phthalates. They’re in about a third of nail polishes, glosses, enamels, and hardeners, as well as many shampoos, sunscreens, skin lotions, and insect repellents.
Bisphenols
While all the public attention is on the toxicity of bisphenol A (BPA), the animal research shows the substitutes BPF, BPS and BPZ are just as toxic. While the research discussed here is on BPA, the other bisphenols likely create the same problems. BPA directly suppresses osteoblast and osteoclast development, shutting down bone renewal.
In cell studies, BPA directly suppresses both osteoclast and osteoblast cell development and shuts down bone alkaline phosphatase, an enzyme used by osteoblasts in new bone formation.33
BPA harms bone by inhibiting calcitonin secretion. Calcitonin is a hormone secreted by the thyroid gland that lowers blood levels of calcium – in other words, it opposes the effects of parathyroid hormone, which causes calcium to be released from bones to increase calcium levels in the bloodstream when needed. When parathyroid hormone has done its job, and blood levels of calcium have been restored to normal, calcitonin is supposed to be secreted to stop further calcium removal from our bones, but BPA prevents that from happening.
BPA also inhibits Wnt signaling, which is a key part of the process through which new osteoblasts develop, and then causes any osteoblasts that have managed to grow up to commit apoptosis.34,35
Decreasing Body Load of Plasticizers
In general, food packaging is the primary source of exposure to phthalates and BPA.36 As these are non-persistent toxins with half-lives measured in hour to day, the best way to decrease body load is to simply stop exposure. Research has shown that just 3 days of eating a diet composed primarily of fresh, not plastic packaged foods, significantly decreases body load—phthalates dropped by more than 50%, and levels of BPA dropped by more than 60%.37,38
Many apps are now available to help decrease exposure to plasticizers, such as DetoxMe and ThinkDirty.
Conclusion
The research continues to grow that environmental metals, metalloids, and chemicals have become a primary driver of chronic disease. Not only are the supposedly safe levels far too high, but virtually all research only looks at single toxins, so the synergistic damaging effects are missed.
The good news is that there are many effective strategies for decreasing exposure and increasing detoxification and excretion.
Biography

References
- 1.Pizzorno J. Is the Diabetes Epidemic Primarily Due to Toxins? Integr Med (Encinitas). 2016August;15(4):8-17. PMID: 27574488. [PMC free article] [PubMed] [Google Scholar]
- 2.Jin T, Nordberg G, Ye T, et al. Osteoporosis and renal dysfunction in a general population exposed to cadmium in China. Environ Res. 2004November;96(3):353-359. doi.org/10.1016/j.envres.2004.02.012 PMID: 15364604 [DOI] [PubMed] [Google Scholar]
- 3. https://www.osha.gov/pls/oshaweb/owadisp.show_document?p_table=STANDARDS&p_id=10036.
- 4.Satarug S, Garrett SH, Sens MA, Sens DA. Cadmium, environmental exposure, and health outcomes. Cien Saude Colet. 2011May;16(5):2587-2602. doi.org/10.1590/S1413-81232011000500029 PMID: 21655733 [DOI] [PMC free article] [PubMed] [Google Scholar]
- 5.Engström A, Michaëlsson K, Suwazono Y, Wolk A, Vahter M, Akesson A. Long-term cadmium exposure and the association with bone mineral density and fractures in a population-based study among women. J Bone Miner Res. 2011March;26(3):486-495. PMID: 20734452. [DOI] [PubMed] [Google Scholar]
- 6.Engström A, Michaëlsson K, Vahter M, Julin B, Wolk A, Åkesson A. Associations between dietary cadmium exposure and bone mineral density and risk of osteoporosis and fractures among women. Bone. 2012June;50(6):1372-1378. PMID: 22465267 [DOI] [PubMed] [Google Scholar]
- 7.Järup L, Alfvén T, Persson B, Toss G, Elinder CG. Cadmium may be a risk factor for osteoporosis. Occup Environ Med. 1998July;55(7):435-439. doi. org/10.1136/oem.55.7.435 PMID: 9816375 [DOI] [PMC free article] [PubMed] [Google Scholar]
- 8.Gallagher CM, Kovach JS, Meliker JR. Urinary cadmium and osteoporosis in U.S. Women >or= 50 years of age: NHANES 1988-1994 and 1999-2004. Environ Health Perspect. 2008October;116(10):1338-1343. doi.org/10.1289/ehp.11452 PMID: 18941575 [DOI] [PMC free article] [PubMed] [Google Scholar]
- 9.Fourth National Report on Human Exposure to Environmental Chemicals. Updated Tables, January. 2019, Volume One [Google Scholar]
- 10.Roberts TL. Cadmium and Phosphorous Fertilizers: The Issues and the Science. Procedia Engineering 83 (2014) 52 – 59. doi.org/10.1016/j.proeng.2014.09.012 [Google Scholar]
- 11.Cadmium In Jewelry: Federal Regulators Failed To Protect Children From Cancer-Causing Metals. http://www.huffingtonpost.com/2012/10/14/cadmium-in-jewelry_n_1965192.html, accessed 4-12-14.
- 12.Genuis SJ, Birkholz D, Rodushkin I, Beesoon S. Blood, urine, and sweat (BUS) study: monitoring and elimination of bioaccumulated toxic elements. Arch Environ Contam Toxicol. 2011;61(2):344-357. doi.org/10.1007/s00244-010-9611-5 PMID:21057782 [DOI] [PubMed] [Google Scholar]
- 13.Kessler R. Lead-Based Decorative Paints: Where Are They Still Sold—and Why? Environ Health Perspect; DOI:10.1289/ehp.122-A96, https://www.ncbi.nlm.nih.gov/pubmed/?term=10.1289%2Fehp.122-A96 accessed 10-28-20 [DOI] [PMC free article] [PubMed]
- 14.Trasande L, Liu Y. Reducing the staggering costs of environmental disease in children, estimated at $76.6 billion in 2008. Health Aff (Millwood). 2011;30(5):863-870. PMID:21543421 [DOI] [PubMed] [Google Scholar]
- 15.Khalil N, Cauley JA, Wilson JW, et al. Relationship of blood lead levels to incident nonspine fractures and falls in older women: the study of osteoporotic fractures. J Bone Miner Res. 2008September;23(9):1417-25. PMID: 18410230 [DOI] [PMC free article] [PubMed] [Google Scholar]
- 16.Lanphear BP, Rauch S, Auinger P, Allen RW, Hornung RW. Low-level lead exposure and mortality in US adults: a population-based cohort study. Lancet Public Health. 2018;3(4):e177-e184. PMID:29544878 [DOI] [PubMed] [Google Scholar]
- 17.Wong AK, Beattie KA, Bhargava A, et al. Canadian Multicentre Osteoporosis Study (CaMos) Research Group . Bone lead (Pb) content at the tibia is associated with thinner distal tibia cortices and lower volumetric bone density in postmenopausal women. Bone. 2015October;79:58-64. PMID: 25986335 [DOI] [PMC free article] [PubMed] [Google Scholar]
- 18.Beier EE, Maher JR, Sheu TJ, et al. Heavy metal lead exposure, osteoporotic-like phenotype in an animal model, and depression of Wnt signaling. Environ Health Perspect. 2013January;121(1):97-104PMID: 23086611 [DOI] [PMC free article] [PubMed] [Google Scholar]
- 19.Rosin A. The long-term consequences of exposure to lead. Isr Med Assoc J. 2009November;11(11):689-694. PMID: 20108558 [PubMed] [Google Scholar]
- 20.van Lierop AH, Appelman-Dijkstra NM, Papapoulos SE. Sclerostin deficiency in humans. Bone. 2017March;96:51-62. PMID: 27742500 [DOI] [PubMed] [Google Scholar]
- 21. Intro to health effects.doc ( oregon.gov) (Accessed 2020-11-24) [Google Scholar]
- 22.Pizzorno J, Frassetto LA, Katzinger J. Diet-induced acidosis: is it real and clinically relevant? Br J Nutr. 2010April;103(8):1185-1194. PMID: 20003625 [DOI] [PubMed] [Google Scholar]
- 23.Cure E, Yuce S, Cure MC. Severe hypocalcemia associated with zoledronic acid treatment in a patient with a risk of fracture due to drug-induced osteopenia. Minerva Endocrinol. 2013June;38(2):217-218. PMID: 23732377 [PubMed] [Google Scholar]
- 24.Demur C, Métais B, Canlet C, et al. Dietary exposure to a low dose of pesticides alone or as a mixture: the biological metabolic fingerprint and impact on hematopoiesis. Toxicology. 2013June7;308:74-87. doi: 10.1016/j.tox.2013.03.004. Epub 2013 Mar 22. PMID: 23528616 [DOI] [PubMed] [Google Scholar]
- 25.Yanuck SF, Pizzorno J, Messier H, Fitzgerald KN. Evidence Supporting a Phased Immuno-physiological Approach to COVID-19 From Prevention Through Recovery. Integr Med (Encinitas). 2020;19(suppl 1):8-35. PMID: 32425712 [PMC free article] [PubMed] [Google Scholar]
- 26.Du L, Li S, Qi L, et al. Metabonomic analysis of the joint toxic action of long-term low-level exposure to a mixture of four organophosphate pesticides in rat plasma. Mol Biosyst. 2014;10(5):1153-1161; Epub ahead of print. PMID: 24626741 [DOI] [PubMed] [Google Scholar]
- 27.Nickolas TL, McMahon DJ, Shane E. Relationship between moderate to severe kidney disease and hip fracture in the United States. J Am Soc Nephrol. 2006November;17(11):3223-3232. PMID: 17005938. [DOI] [PubMed] [Google Scholar]
- 28.Siddarth M, Datta SK, Mustafa M, et al. Increased level of organochlorine pesticides in chronic kidney disease patients of unknown etiology: role of GSTM1/GSTT1 polymorphism. Chemosphere. 2014February;96:174-179PMID: 24216264 [DOI] [PubMed] [Google Scholar]
- 29.Josephy PD. Genetic variations in human glutathione transferase enzymes: significance for pharmacology and toxicology. Hum Genomics Proteomics. 2010June13;2010:876940. PMID: 20981235 [DOI] [PMC free article] [PubMed] [Google Scholar]
- 30.López O, Hernández AF, Rodrigo L, et al. Changes in antioxidant enzymes in humans with long-term exposure to pesticides. Toxicol Lett. 2007July10;171(3):146-153. PMID: 17590542 [DOI] [PubMed] [Google Scholar]
- 31.Johns LE, Ferguson KK, Cantonwine DE, McElrath TF, Mukherjee B, Meeker JD. Urinary BPA and Phthalate Metabolite Concentrations and Plasma Vitamin D Levels in Pregnant Women: A Repeated Measures Analysis. Environ Health Perspect. 2017;125(8):087026. PMID:28934718 [DOI] [PMC free article] [PubMed] [Google Scholar]
- 32.Min KB, Min JY. Urinary phthalate metabolites and the risk of low bone mineral density and osteoporosis in older women. J Clin Endocrinol Metab. 2014;99(10):E1997-E2003. PMID:25050905 [DOI] [PubMed] [Google Scholar]
- 33.Hwang JK, Min KH, Choi KH, et al. Bisphenol A reduces differentiation and stimulates apoptosis of osteoclasts and osteoblasts. Life Sci. 2013September17;93(9-11):367-372. PMID: 2390002 [DOI] [PubMed] [Google Scholar]
- 34.Chin K, Pang K, Mark-Lee W. A Review on the Effects of Bisphenol A and Its Derivatives on Skeletal Health. Int J Med Sci. 2018June22;15(10):1043-1050. doi: 10.7150/ijms.25634. PMID: 30013446 [DOI] [PMC free article] [PubMed] [Google Scholar]
- 35.Thent ZC, Froemming GR, Muid S. Bisphenol A exposure disturbs the bone metabolism: an evolving interest towards an old culprit. Life Sci. 2018April1;198:1-7. PMID: 29432759 [DOI] [PubMed] [Google Scholar]
- 36.Rudel RA, Gray JM, Engel CL, et al. Food packaging and bisphenol A and bis(2-ethyhexyl) phthalate exposure: findings from a dietary intervention. Environ Health Perspect. 2011;119(7):914-920. [DOI] [PMC free article] [PubMed] [Google Scholar]
- 37. https://silentspring.org/news/fresh-food-diet-reduces-levels-hormone-disruptors-bpa-and-dehp accessed 10-29-20.
- 38.Rudel R, Ackerman J, Dodson R. 2011. Dietary Intervention and DEHP Reduction: Rudel et al. Respond. Environ Health Perspect. 2011;119(9):a380-a381. [DOI] [PMC free article] [PubMed] [Google Scholar]