. 2021 May 27;10:e68082. doi: 10.7554/eLife.68082

Figure 1. DdMyo7 has a distinct cortical localization from its tail domain.

(A) (left) Schematic of DdMyo7 illustrating its motor domain (gray), 4 IQ domains (yellow) and tandem MyTH4-FERM domains (blue-MyTH4, red-FERM) in the tail, the tail fragment, and a motor forced dimer (motor-FD); (right) Dictyostelium control, or myo7 null cells visualized with DIC and the membrane dye FM4-64 showing DdMyo7 is critical for filopodia formation. (B) Confocal images showing two examples of wild-type cells co-expressing DdMyo7-mCherry and GFP-DdMyo7-tail. The localization of DdMyo7-mCherry is at the cortex and in filopodia tips, and GFP-tail fragment localized around cortex. (C) Line intensity profile along the line shown in panel B. (D) Cytofluorograms of a representative field of cells comparing the colocalization between DdMyo7-mCherry intensity (x-axis) and GFP-DdMyo7 or GFP-DdMyo7 tail intensity (y-axis). (E) Analysis strategy for measuring entire cell peripheral intensity. (F) Micrographs of cells expressing RFP-Lifeact, GFP-DdMyo7, GFP-Tail, or GFP-Motor-Forced Dimer (FD) asterisks (*) on GFP-tail indicates the cell analyzed in G. (A,B,E,F) Scale bars are 10 µm. (G) Peripheral line scan intensity of cells from F. (H). Sample cortical band intensity showing the mean and variation of intensities around the periphery (asymmetry measurement), shaded region of the intensity distribution represents the standard deviation. (I). Cortical band standard deviation (SD; n > 93 cells from three experiments for each group) (see also Figure 1—source data 1). A higher SD indicates asymmetric localization. One-way ANOVA with multiple comparison correction compared to actin, ****p<0.001, ns not significant (see also Figure 1—source data 2).

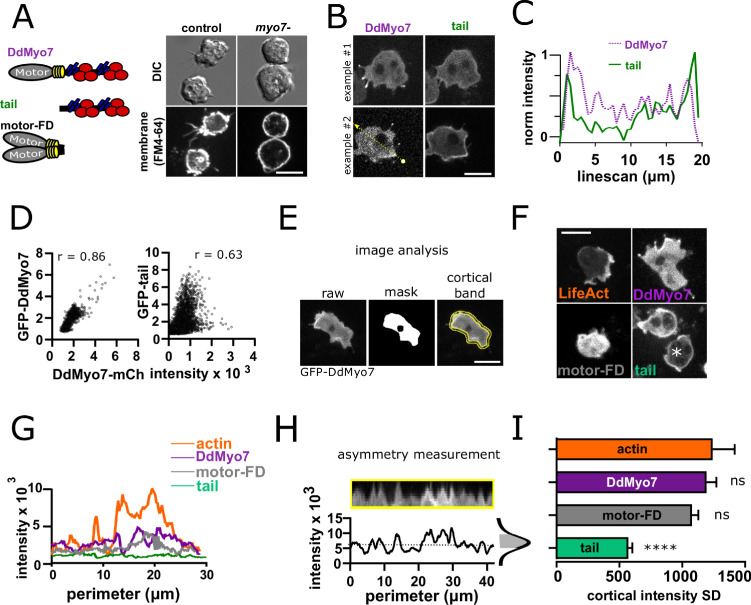
Figure 1—source data 1. Values of the cortical standard deviation measurements (cortical asymmetry) for each cell for Figure 1I.
Figure 1—source data 2. Statistical test results for Figure 1I.

Figure 1.

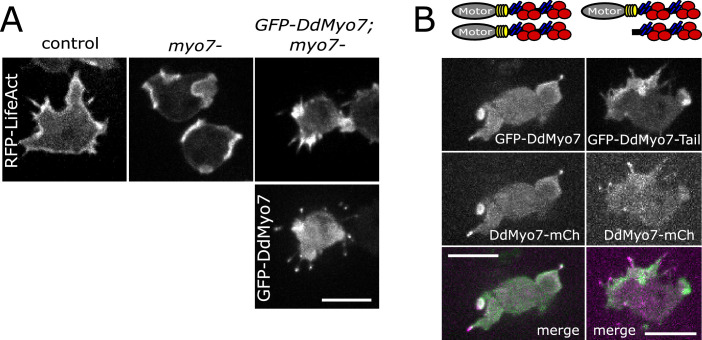
Figure 1—figure supplement 1. DdMyo7 is localized to filopodia and required for their formation.

Figure 1—figure supplement 1.

(A) Micrographs of control (AX2), myo7 null or myo7 null with GFP-DdMyo7 rescue construct expressing RFP-Lifeact (actin, top) and GFP-DdMyo7 (bottom). (B) Micrographs of myo7 null cells co-expressing either GFP-DdMyo7 and DdMyo7-mCherry (left) or GFP-DdMyo7-tail and DdMyo7-mCherry (right). A-B. Scale bars: 10 µm.
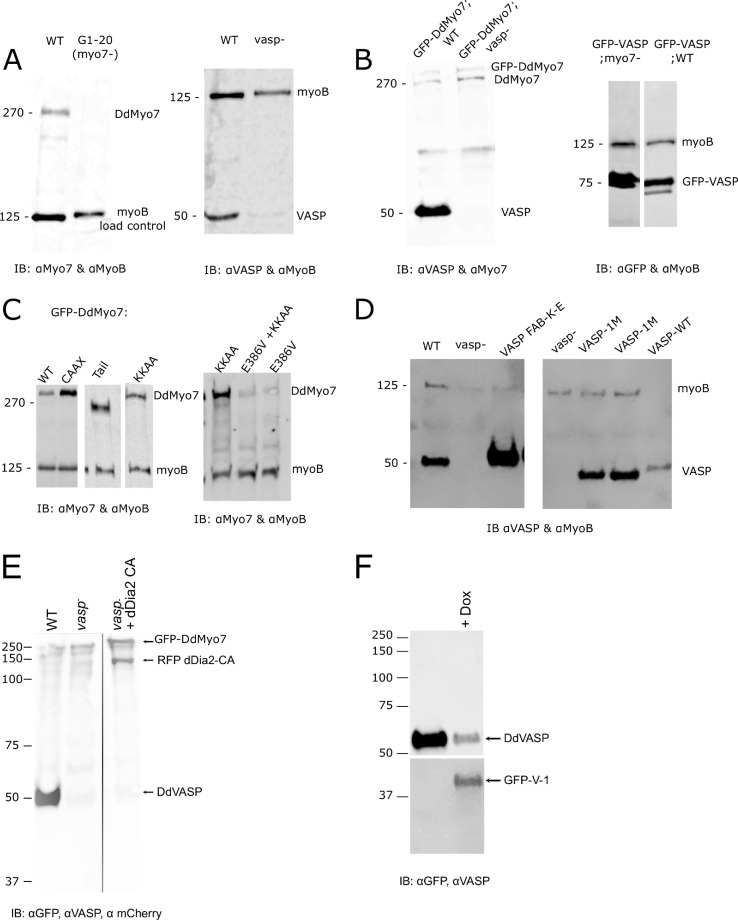
Figure 1—figure supplement 2. Analysis of protein expression.

Figure 1—figure supplement 2.

Whole cell lysates from each line used in this study were analyzed for expression of endogenous proteins or expressed fusion proteins. Approximately 3 × 10⁵ cells were loaded per lane. The blot was also probed for the 125 kD MyoB heavy chain serving as the loading control. Antibodies used to probe each set of blots are indicated below and the molecular weights in kD marked on the side. (A) Control wild type (WT, Ax2), myo7 null or vasp null cell lines. Note that DdVASP runs at ~50 kD, higher than its calculated molecular weight of ~40 kD. (B) GFP-DdMyo7 expression in control (WT, Ax3) and vasp null cells, and GFP-VASP in control wild type (Ax2) and myo7 null cells. (C) Expression of wild type or mutant GFP-DdMyo7 in myo7 null cells. Note that GFP-DdVASP runs at ~75 kD, higher than its calculated molecular weight of ~65 kD (D) Expression of wild type VASP and VASP mutants (not fused to a fluorescent protein) in vasp null cells. (E) Numbers are molecular weight standard. Wild type, vasp null and vasp null cell line overexpressing GFP-dDia2 CA. (F) Western blot of GFP-V1 induced (+Dox) in control (Ax3) cells.