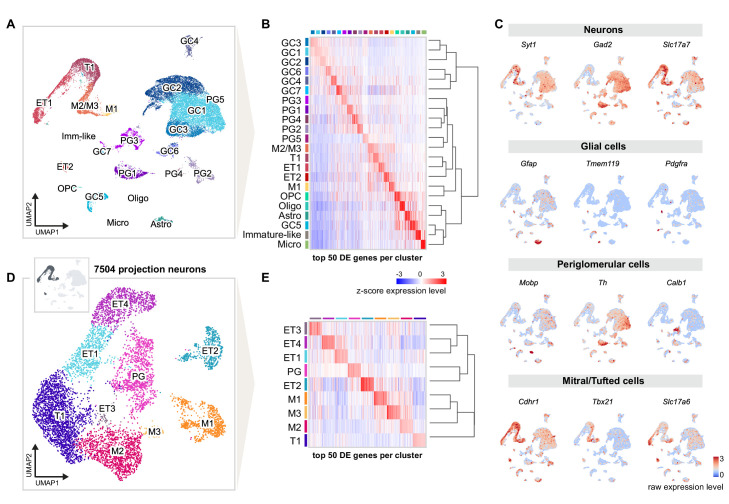
Figure 2. Single-nucleus RNA sequencing distinguishes distinct cell types and molecular signatures of OB projection neurons.
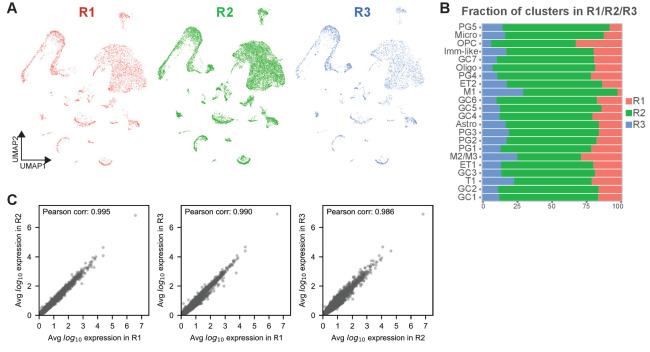
(A) UMAP representation of gene expression profiles of 31,703 single nuclei combined from all replicates (R1, R2, R3) of mice injected into both AON and PCx, grouped into 22 clusters color-coded by cell type membership (GC: granule cell, PG: periglomerular cell, OPC: oligodendrocyte precursor cell, Micro: microglia, Astro: astrocyte, Oligo: oligodendrocyte, ET: external tufted cell, M: mitral cell, T: tufted cell, Imm-like: Immature-like cell). See Figure 2—figure supplement 1 for detailed quality check of each replicate. (B) Matrix plot showing the z-scored expression levels of the top 50 differentially expressed (DE) genes for each cell population ordered by hierarchical relationships between distinct clusters. Each column represents the average expression level of a gene in a given cluster, color-coded by the UMAP cluster membership (from A). The dendrogram depicts the hierarchical relationships and is computed from the PCA representation of the data using Pearson correlation as distance measure and link by complete linkage. (C) UMAP representations of known marker genes for main cell populations (Syt1: neurons; Gad2: GABAergic neurons; Slc17a7: glutamatergic neurons; Gfap, Tmem119, Pdgfra, Mobp: glial cells; Th, Calb1: periglomerular neurons; Cdhr1, Tbx21, Slc17a6: mitral/tufted cells). Nuclei are color-coded by the raw expression level of each transcript. (D) UMAP representation of subclustering from the initial clusters M1, M2/M3, T1, ET1, and ET2 (cluster names from A), selected for the expression of known excitatory and mitral/tufted cell markers (shown in C), resulting in 7504 putative projection neurons grouped into nine distinct types. (E) Same matrix plot as described in (B) showing the z-scored expression levels of the top 50 DE genes for each projection neuron type ordered by hierarchical relationships and color-coded by the UMAP subcluster membership (from D).


