

Abstract
The functions of mRNAs are closely correlated with their locations in cells. Knowledge about the subcellular locations of mRNA is helpful to understand their biological functions. In recent years, it has become a hot topic to develop effective computational models to predict eukaryotic mRNA subcellular localizations. However, existing state-of-the-art models still have certain deficiencies in terms of prediction accuracy and generalization ability. Therefore, it is urgent to develop novel methods to accurately predict mRNA subcellular localizations. In this study, a novel method called mRNALocater was proposed to detect the subcellular localization of eukaryotic mRNA by adopting the model fusion strategy. To fully extract information from mRNA sequences, the electron-ion interaction pseudopotential and pseudo k-tuple nucleotide composition were used to encode the sequences. Moreover, the correlation coefficient filtering algorithm and feature forward search technology were used to mine hidden feature information, which guarantees that mRNALocater can be more effectively applied to new sequences. The results based on the independent dataset tests demonstrate that mRNALocater yields promising performances for predicting eukaryotic mRNA subcellular localizations and is a powerful tool in practical applications. A freely available online web server for mRNALocater has been established at http://bio-bigdata.cn/mRNALocater.
Keywords: mRNA subcellular localization, model fusion, correlation coefficient, feature selection, mRNALocater
Graphical abstract
A novel method called mRNALocater was proposed to detect the subcellular localization of eukaryotic mRNA by adopting the model fusion strategy. A freely available online web server for mRNALocater was established at http://bio-bigdata.cn/mRNALocater.
Introduction
Subcellular localization of mRNAs plays a prominent role in gene expression and exerts both quantitative and spatial control over protein products. Subcellular localization of mRNAs is crucial for many processes, such as patterning of embryonic axes, asymmetric cell division, cell migration, and synaptic plasticity.1, 2, 3 The most obvious advantage of regulating gene expression by mRNA localization is that it allows gene expression to be spatially restricted within the cytoplasm.1,4,5 Apart from this, localized mRNAs can be translated multiple times to generate many copies of a protein, which is much more efficient than translating mRNAs elsewhere in the cell.1 With the benefit of development and application of experimental approaches, such as fluorescent in situ hybridization, the importance and prevalence of mRNA subcellular localization have been extensively studied.6,7 However, the precise mechanisms of mRNA subcellular localization and their dependence on specific sequence elements remain elusive. The accurate identification of mRNA localization will facilitate our fundamental understanding of its biological functions and has profound molecular biology implications.
To date, a few popular databases about RNA subcellular localization, such as RNALocate, lncSLdb, and lncATLAS, have been successively established.8, 9, 10 Compared with the other two databases, which mainly focus on the localization data of long non-coding RNA (lncRNA), RNALocate is more comprehensive and collects the subcellular localization entries for nearly all kinds of RNA.8 These databases could be used by bioinformatics developers to establish novel RNA subcellular localization prediction tools. Based on these datasets, a series of computational methods have been proposed as an effective and efficient approach for identifying RNA subcellular localization, such as DeepLncRNA, RNATracker, and iLoc-mRNA.11, 12, 13 More recently, Manish Kumar et al.14 developed an advanced prediction tool, mRNALoc, to predict the five sub-cellular locations of eukaryotic mRNAs. Results from independent datasets demonstrate that mRNALoc achieved accuracies of 58.10%, 69.23%, 64.55%, 96.88%, and 69.35% for extracellular region, endoplasmic reticulum, cytoplasm, mitochondria, and nucleus, respectively. Although mRNALoc yielded satisfactory results for some subcellular localization, further improvement is still needed. Moreover, experimentally determining mRNA subcellular localization is still expensive for most laboratories. Therefore, it is necessary to develop novel methods to accurately predict mRNA subcellular localization.
In the present work, a novel method called mRNALocater is proposed to further improve the prediction performance for eukaryotic mRNA subcellular localization. To fully extract useful and related information from mRNA sequences, the electron-ion interaction pseudopotential (PseEIIP) values of trinucleotides and pseudo k-tuple nucleotide composition (PseKNC) were used to transform sequences of various length into fixed-length numerical vectors. Subsequently, a two-step feature selection scheme was employed to find out the optimal feature subset. Finally, the optimal features were used as the input of Light Gradient Boost Machine (LightGBM), XGBoost, and CatBoost to build mRNALocater by using the ensemble learning algorithm, which has been widely used in the realm of bioinformatics.15, 16, 17, 18 To demonstrate the superiority of mRNALocater for predicting mRNA subcellular localization, we compared its performance with that of the state-of-art predictors. The results based on the independent testing datasets demonstrate that mRNALocater is superior to existing methods for predicting mRNA subcellular localization. In addition, a user-friendly web server for mRNALocater has been built, which is available at http://bio-bigdata.cn/mRNALocater. We expect that mRNALocater can facilitate the prediction of eukaryotic mRNA subcellular localization.
Results
Determination of optimal features
As mentioned above, a two-step feature optimization strategy was used to filter out noise features. High correlation between two features indicates that they have similar trends and are likely to carry similar information, which can bring down the generalization performance of the model. Therefore, we calculated the correlation of features and removed the features with a correlation coefficient >0.85. It was found that the features between PseEIIP and PseKNC have a correlation < 0.85. Therefore, we removed the highly correlated features in PseKNC and PseEIIP, respectively. Figure 1 shows the PseKNC- and PseEIIP-derived features with a threshold >0.85 through a network connection graph. By doing so, a total of 196 features were removed, including 60 of PseEIIP, 5 of PseDNC, 19 of PseTNC, 48 of PseTetraNC, 49 of PsePentaNC, and 15 of PseHexNC.
Figure 1.

The network connection graph shows the PseKNC- and PseEIIP-derived features with a correlation coefficient >0.85
The size of the points represents the degree of involvement in the network. The larger the point, the more features correlated with it. The colors indicate different densely connected subgraphs or communities, which figure out via random walks. There is a strong correlation between features in the same community.
Subsequently, the sequential forward search (SFS) strategy was used to find optimal feature subsets based on the above results. We first calculated the feature importance by using the LightGBM model. In order to reduce variance, the feature importance was averaged over 10 training runs and sorted in a descending order. These features were then added one by one from lower to higher rank. For each case, a model based on the training datasets was built and validated through the five-fold cross-validation test. The accuracy (Acc) curves thus obtained by gradually adding features are plotted in Figure 2.
Figure 2.

The accuracy curve based on five-fold cross-validation by gradually adding features according to their importance
It was found that the Acc value initially increased quickly with the addition of the optimal features. When the number of features was 1,566, the model yielded the maximum Acc of 69.74%. After that, the curve settled into a plateau and even had a slight downward trend. Therefore, the computational model was built based on the optimal 1,566 features.
Iterative integration of models to improve the prediction performance
Based on the optimal features, we used grid search technique to optimize the hyperparameters of the three models. The performance of the three models was evaluated on the independent testing dataset. It was found that the performance of the three models is stable in different subcellular locations. These models have excellent Acc for distinguishing endoplasmic reticulum and mitochondria, where the Acc is >90%. Additionally, although low recall was obtained for predicting the location of endoplasmic reticulum and nucleus for the three models, the related precision is excellent.
In order to objectively evaluate the performance, we further tested the models based on the independent testing dataset. The results of the three models for identifying mRNA subcellular location are shown in Figure 3, and the detailed values are listed in Table S3.
Figure 3.

Heatmap showing the performance of the three models in terms of Acc, F1-score, precision, and recall based on the independent testing datasets
It was found that the XGBoost model obtained the best performance for identifying the location in cytoplasm and nucleus with Acc of 63.23% and 69.83%, respectively; the LightGBM model was good at predicting the location in endoplasmic reticulum and mitochondria and obtained Acc of 91.32% and 97.12%, respectively; the CatBoost model had an excellent performance for predicting the location in extracellular region, with Acc of 86.16%. These results indicate that each model has its own advantages and that the models are complementary to each other for predicting the location of mRNA from different organelles.
Therefore, according to our previous experiences,18, 19, 20 we iteratively integrated the three models based on the weighted summing of their prediction scores. For each round of iteration, the sum of the weights of the three models was restricted to 1, taking 0.05 as the step size. For example, for the first round of iteration, we set the weight of the XGBoost, LightGBM, and CatBoost models to 0.01, 0.01, and 0.98, respectively. In the next round, their weights were renewed to 0.01, 0.02, and 0.97, respectively. The performances for each round of iteration are shown in Figure 4. By doing so, the best accuracy of 52.98% was obtained for predicting the mRNA subcellular localizations when the weights of XGBoost, LightGBM, and CatBoost were 0.53, 0.1, and 0.37, respectively.
Figure 4.

The accuracy of iterative integration of the three models with different weights
The best accuracy is highlighted in orange.
Comparison with other predictors
In order to better demonstrate the predictive accuracy and generalization ability of mRNALocater, we compared it with the best mRNA subcellular localization predictor, mRNALoc. The comparison was performed based on the same independent test datasets. The detailed comparative results are illustrated in Figure 5 and Table 1. It was found that mRNALocater obtained Acc of 63.75%, 91.24%, 84.23%, 96.56%, and 70.19% for identifying the mRNA from cytoplasm, endoplasmic reticulum, extracellular region, mitochondria, and nucleus, respectively. The obtained Acc of mRNALocater for predicting location in cytoplasm and endoplasmic reticulum dramatically outperforms that of mRNALoc (Table 2). In addition, our proposed method achieves an F1-score of 65.21% and 41.37% for predicting the subcellular locations of cytoplasm and extracellular region, respectively, which is also superior to that of mRNALoc. It should be noted that in terms of precision and recall, mRNALocater was 7.40% and 60.00% higher, respectively, than mRNALoc for distinguishing extracellular region. Besides, the precisions of mRNALocater are 77.55% and 23.36% higher than those of mRNALoc for forecasting endoplasmic reticulum and nucleus, respectively. In terms of recall, mRNALocater also yields better performance than mRNALoc in detecting subcellular location in mitochondria, extracellular region, and cytoplasm. These results demonstrate the promising performance and stability of mRNALocater.
Figure 5.

Comparison of mRNALocater and mRNALoc based on independent testing datasets
The advantages of performance of mRNALocater over mRNALoc are marked in the figure.
Table 1.
Comparison of mRNALocater and mRNALoc based on independent testing datasets
| Location | Method | Precision (%) | Recall (%) | Acc (%) | F-score (%) |
|---|---|---|---|---|---|
| Cytoplasm | mRNALocater | 55.20 | 79.64 | 63.75 | 65.21 |
| mRNALoc | 55.61 | 51.59 | 61.78 | 53.53 | |
| Endoplasmic reticulum | mRNALocater | 100 | 9.13 | 91.24 | 16.73 |
| mRNALoc | 22.45 | 41.08 | 80.63 | 29.03 | |
| Extracellular region | mRNALocater | 26.38 | 95.86 | 84.23 | 41.37 |
| mRNALoc | 18.98 | 35.86 | 87.39 | 24.82 | |
| Mitochondria | mRNALocater | 44.36 | 83.10 | 96.56 | 57.84 |
| mRNALoc | 56.32 | 69.01 | 97.60 | 62.03 | |
| Nucleus | mRNALocater | 91.40 | 26.13 | 70.19 | 40.64 |
| mRNALoc | 68.04 | 49.08 | 71.11 | 57.02 |
Table 2.
Detailed information of the benchmark datasets
| Location | Training | Testing | Total |
|---|---|---|---|
| Cytoplasm | 5,310 | 1,066 | 6,376 |
| Endoplasmic reticulum | 1,185 | 241 | 1,426 |
| Extracellular region | 710 | 145 | 855 |
| Mitochondria | 350 | 71 | 421 |
| Nucleus | 4,855 | 976 | 5,831 |
Compared with mRNALoc, the proposed mRNALocater is based on an ensemble technique that incorporates more sequence-specific features reflecting the properties of mRNA from different organelles. In addition, the correlation coefficient filtering method and the feature forward search technology were further employed to select the optimal features. By doing this, the samples were encoded by informative features that ensure the performance improvement of mRNALocater.
Web server implementation
In order to make the use of mRNALocater by researchers as convenient as possible, a web server called mRNALocater was established to implement our predictor. The webserver is freely available at http://bio-bigdata.cn/mRNALocater. Users are allowed to directly submit sequences with FASTA format or upload file containing FASTA format sequences. In the result page, we provide the predictive scores of the five subcellular locations for each sample, which is a good reference for users.
Discussion
The mRNA subcellular distribution is a key player for post-transcriptional gene expression regulation.3,21 In order to improve performance in identifying mRNA subcellular localizations, we propose a new mRNA subcellular localization prediction model called mRNALocater by integrating XGBoost, LightGBM, and CatBoost algorithms. An optimal feature subset constructed through a two-step feature selection strategy was used to encode the samples. Comparative experiments based on the independent dataset test demonstrate that mRNALocater outperforms the state-of-the-art predictors for identifying mRNA subcellular localizations. We expect that the mRNALocater will become a high-throughput tool for in-depth research on mRNA subcellular localization.
Materials and methods
Benchmark datasets
In this study, in order to ensure a fair comparison with existing methods, we employed the same datasets constructed by Garg et al.14 to train the model for predicting mRNA subcellular localization. At first, the authors collected the mRNA sequences with experimentally confirmed subcellular location information from the RNALocate database (version 2.0).8 Second, in order to avoid homology bias, the BLASTClust program within the standalone BLAST package was applied to obtain sequences showing homology < 40% over 70% or more of their full length.14 Finally, a benchmark dataset containing 16,881 sequences was obtained, of which 6,376 mRNAs were located in cytoplasm, 1,426 in endoplasmic reticulum, 885 in extracellular region, 421 in mitochondria, and 5,831 in nucleus. According to Garg et al.’s14 work, five-sixths of the sequences from each location were used for training the model, and the remaining data were used as the independent samples to evaluate the model. Detailed information about the benchmark datasets is presented in Table 2.
Feature representation algorithms
In this study, PseEIIP and PseKNC were used to encode the mRNA sequences in the datasets.
Electron-ion interaction pseudopotentials of trinucleotides
The EIIP was first proposed by Nair and Sreenadhan to express the distribution of electron-ion energies along a DNA sequence.22 Subsequently, the average PseEIIP in each sequence was used to construct the feature vector, which has been widely used to identify methylation sites, enhancers, and promoters.18,23,24 The EIIP values of each nucleotide are given in Table S1. Based on EIIP, the composition of each mRNA sequence can be formulated as a 64-dimensional feature vector as follows:
| (Equation 1) |
where the subscript represents one of the 64 different trinucleotide combinations. The EIIP value of trinucleotide xyz (EIIPxyz) is equal to the sum of the EIIP values of nucleotides x, y, and z, where and fxyz is the normalized frequency of trinucleotide xyz.
PseKNC
The strategy of PseKNC can convert a genomic sequence into a fixed-size feature vector.25,26 By calculation of k-tuple nucleotide composition and the correlation of physicochemical properties of oligonucleotides in a given sequence, the PseKNC incorporates both the short-range sequence order and long-range sequence order information. In this study, six dinucleotide physicochemical properties, namely twist, tilt, roll shift, slide, and rise, were employed to calculate the PseKNC. Detailed values of the six dinucleotide physicochemical properties are listed in Table S2. Based on PseKNC, a given sequence can be denoted as a dimension vector formulated as follows:
| (Equation 2) |
where
| (Equation 3) |
is the normalized frequency of the u-th k-tuple nucleotide composition, ω is the weight factor range from 0.1 to 1 with a step 0.1, and λ is the number of the total counted ranks or tiers of the correlations along a sequence. As indicated in Equation 2, the dimension of DPseKNC increased rapidly with the increase of k and λ. However, the large values of k and λ will cause a high-dimension disaster, such as increasing the computational time and overfitting problems. Hence, we set the k range from 2 to 6 with λ = 1. This means that we considered the first-tier correlation by using PseDNC (pseudo dinucleotide composition), PseTNC (pseudo triucleotide composition), PseTetraNC (pseudo tetraucleotide composition), PsePentaNC (pseudo pentanucleotide composition), and PseHexNC (pseudo hexanucleotide composition), respectively.
Accordingly, by combining the features derived based on PseEIIP and PseKNC, an mRNA sequence will be represented by a 5,525 (= 64 + 17 + 65 + 257 + 1,025 + 4,097)-dimensional vector.
Feature optimization strategy
In order to avoid the overfitting problem, a two-step feature selection strategy was used to select the optimal features by eliminating redundant and irrelevant features. First, we removed the high collinear features that are highly related to each other and might reduce the generalization performance of the model on the new test datasets. In the second step, we calculated the importance of the remaining features by using the LightGBM algorithm and obtained a feature ranking list in terms of their classification importance. Subsequently, the SFS strategy was used to select out the optimal sub-features.27 For each round of SFS, the LightGBM model was built based on the five-fold cross-validation test. Finally, the sub-features with the highest accuracy were recognized as the optimal sub-features.
mRNALocater construction
Gradient boosting decision tree (GBDT) is a class of powerful ensemble machine learning algorithms that can be used for classification or regression problems.28 The principles of GBDT algorithm have been illustrated in Drucker et al.’s29 work. There are many algorithms, such as XGBoost, LightGBM, and CatBoost, that are efficient and important implementations of the GBDT.30, 31, 32
XGBoost, short for Extreme Gradient Boosting, is a library that was designed to be highly efficient, flexible, and portable. It implements under a set of weaker machine learning algorithms to get a stronger overall class discrimination. While constructing the next model, higher weights are given to the wrongly predicted samples in the current weaker leaner to improve the classification of positive and negative training examples.33
LightGBM is a novel high-performance algorithm that utilizes two novel techniques, namely gradient-based one-side sampling (GOSS) and exclusive feature bundling (EFB), to deal with the huge number of data along with the massive number of features, respectively. GOSS suggests a sampling method based on the gradient to avoid searching for the whole search space. The EFB algorithm aims at reducing the number of features by bundling many exclusive characteristics together, which can dramatically avoid unnecessary calculation for zero feature values.
Compared with the other two algorithms, the primary benefit of CatBoost is that it supports for categorical input variables. Another advantage of CatBoost is that it can reduce overfitting by utilizing a new schema to calculate leaf values when selecting the tree structure.
Accordingly, these three algorithms were employed to build computational models. In order to avoid overestimation of the parameters and reduce information leakage, these algorithms were validated by using the five-fold cross-validation test based on the training dataset. In the model building process, one of the toughest tasks is to find the best hyperparameters for the algorithm that control the behaviors of the algorithms and are directly related with the performance of the model. The grid search technique was used to optimize the hyperparameters of the three models. Their performances were measured by using the five-fold cross validation test.
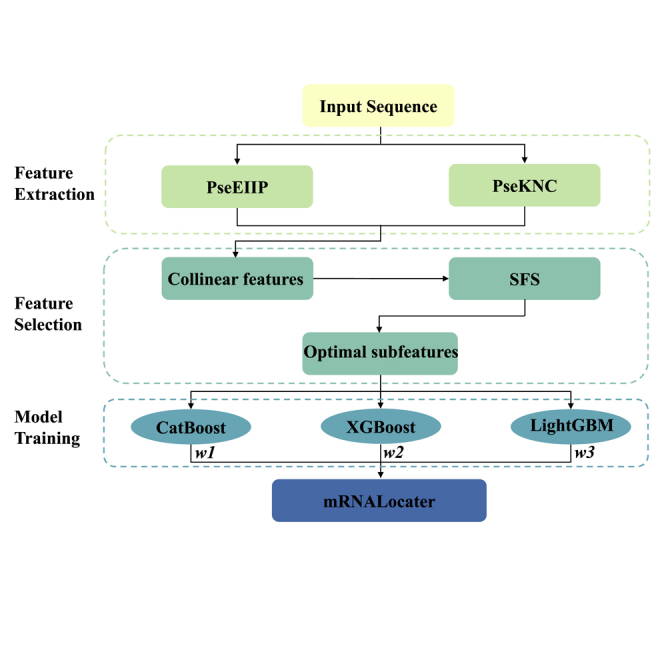
Since the model fusion method can always yield better performance than a single model,19,20 in the present work an ensemble model, called mRNALocater, is proposed, integrating LightGBM, XGBoost, and CatBoost. The flow chart of building the model according to model fusion strategy is shown in Figure 6.
Figure 6.

The flow chart of developing mRNALocater
The construction of mRNALocater involves three steps, namely feature extraction, feature selection, and model training.
Performance evaluation strategies
The classification performance of the proposed method was evaluated by using four commonly used metrics, namely precision, recall, Acc, and F1-score. Precision is defined as the ratio of true positives to the sum of true positives and false positives. Instead of looking at the number of false positives, recall depicts the number of false negatives that were predicted by the model. Acc represents the accuracy of the model. The F1-score is the harmonic mean of the precision and recall. The four metrics are calculated as follows:
| (Equation 4) |
To be specific, in Equation 4, i represents one of the locations, namely cytoplasm, endoplasmic reticulum, extracellular region, mitochondria, and nucleus; TPi is the number of the samples in the i-th location that are correctly predicted; FNi is the number of the samples in the i-th location that are incorrectly predicted to be of other locations; TNi is the number of the samples in any location but not the i-th location that are correctly predicted; FPi is the number of the samples in any location but not the i-th location that are incorrectly predicted to be of the i-th location.
Acknowledgments
This work was supported by the National Natural Science Foundation of China (no. 31771471), the Natural Science Foundation for Distinguished Young Scholar of Hebei Province (no. C2017209244), and the Youth Teacher Innovation Foundation of Xinglin Scholar of Chengdu University of TCM (no. ZRQN2019015).
Author contributions
W.C. and Q.T. conceived and designed the study. Q.T., F.N., and J.K. conducted the experiments. Q.T. implemented the algorithms. W.C., Q.T., F.N., and J.K. performed the analysis and wrote the paper. All authors read and approved the final manuscript.
Declaration of interests
The authors declare no competing interests.
Footnotes
Supplemental information can be found online at https://doi.org/10.1016/j.ymthe.2021.04.004.
Supplemental information
References
- 1.Martin K.C., Ephrussi A. mRNA localization: gene expression in the spatial dimension. Cell. 2009;136:719–730. doi: 10.1016/j.cell.2009.01.044. [DOI] [PMC free article] [PubMed] [Google Scholar]
- 2.Holt C.E., Bullock S.L. Subcellular mRNA localization in animal cells and why it matters. Science. 2009;326:1212–1216. doi: 10.1126/science.1176488. [DOI] [PMC free article] [PubMed] [Google Scholar]
- 3.Kejiou N.S., Palazzo A.F. mRNA localization as a rheostat to regulate subcellular gene expression. Wiley Interdiscip. Rev. RNA. 2017;8:e1416. doi: 10.1002/wrna.1416. [DOI] [PubMed] [Google Scholar]
- 4.Mofatteh M., Bullock S.L. SnapShot: Subcellular mRNA Localization. Cell. 2017;169:178–178.e1. doi: 10.1016/j.cell.2017.03.004. [DOI] [PubMed] [Google Scholar]
- 5.Czaplinski K. Understanding mRNA trafficking: are we there yet? Semin. Cell Dev. Biol. 2014;32:63–70. doi: 10.1016/j.semcdb.2014.04.025. [DOI] [PubMed] [Google Scholar]
- 6.Lécuyer E., Yoshida H., Parthasarathy N., Alm C., Babak T., Cerovina T., Hughes T.R., Tomancak P., Krause H.M. Global analysis of mRNA localization reveals a prominent role in organizing cellular architecture and function. Cell. 2007;131:174–187. doi: 10.1016/j.cell.2007.08.003. [DOI] [PubMed] [Google Scholar]
- 7.Bayani J., Squire J.A. Fluorescence in situ Hybridization (FISH) Curr. Protoc. Cell Biol. 2004;23 doi: 10.1002/0471143030.cb2204s23. 22.4.1–22.4.52. [DOI] [PubMed] [Google Scholar]
- 8.Zhang T., Tan P., Wang L., Jin N., Li Y., Zhang L., Yang H., Hu Z., Zhang L., Hu C. RNALocate: a resource for RNA subcellular localizations. Nucleic Acids Res. 2017;45(D1):D135–D138. doi: 10.1093/nar/gkw728. [DOI] [PMC free article] [PubMed] [Google Scholar]
- 9.Wen X., Gao L., Guo X., Li X., Huang X., Wang Y., Xu H., He R., Jia C., Liang F. lncSLdb: a resource for long non-coding RNA subcellular localization. Database (Oxford) 2018;2018:1–6. doi: 10.1093/database/bay085. [DOI] [PMC free article] [PubMed] [Google Scholar]
- 10.Mas-Ponte D., Carlevaro-Fita J., Palumbo E., Hermoso Pulido T., Guigo R., Johnson R. LncATLAS database for subcellular localization of long noncoding RNAs. RNA. 2017;23:1080–1087. doi: 10.1261/rna.060814.117. [DOI] [PMC free article] [PubMed] [Google Scholar]
- 11.Gudenas B.L., Wang L. Prediction of LncRNA Subcellular Localization with Deep Learning from Sequence Features. Sci. Rep. 2018;8:16385. doi: 10.1038/s41598-018-34708-w. [DOI] [PMC free article] [PubMed] [Google Scholar]
- 12.Yan Z., Lécuyer E., Blanchette M. Prediction of mRNA subcellular localization using deep recurrent neural networks. Bioinformatics. 2019;35:i333–i342. doi: 10.1093/bioinformatics/btz337. [DOI] [PMC free article] [PubMed] [Google Scholar]
- 13.Zhang Z.Y., Yang Y.H., Ding H., Wang D., Chen W., Lin H. Design powerful predictor for mRNA subcellular location prediction in Homo sapiens. Brief. Bioinform. 2021;22:526–535. doi: 10.1093/bib/bbz177. [DOI] [PubMed] [Google Scholar]
- 14.Garg A., Singhal N., Kumar R., Kumar M. mRNALoc: a novel machine-learning based in-silico tool to predict mRNA subcellular localization. Nucleic Acids Res. 2020;48(W1):W239–W243. doi: 10.1093/nar/gkaa385. [DOI] [PMC free article] [PubMed] [Google Scholar]
- 15.Zhao C., Qiu Y., Zhou S., Liu S., Zhang W., Niu Y. Graph embedding ensemble methods based on the heterogeneous network for lncRNA-miRNA interaction prediction. BMC Genomics. 2020;21(Suppl 13):867. doi: 10.1186/s12864-020-07238-x. [DOI] [PMC free article] [PubMed] [Google Scholar]
- 16.Deng Y., Xu X., Qiu Y., Xia J., Zhang W., Liu S. A multimodal deep learning framework for predicting drug-drug interaction events. Bioinformatics. 2020;36:4316–4322. doi: 10.1093/bioinformatics/btaa501. [DOI] [PubMed] [Google Scholar]
- 17.Zhang W., Chen Y., Liu F., Luo F., Tian G., Li X. Predicting potential drug-drug interactions by integrating chemical, biological, phenotypic and network data. BMC Bioinformatics. 2017;18:18. doi: 10.1186/s12859-016-1415-9. [DOI] [PMC free article] [PubMed] [Google Scholar]
- 18.Tang Q., Nie F., Kang J., Chen W. ncPro-ML: An integrated computational tool for identifying non-coding RNA promoters in multiple species. Comput. Struct. Biotechnol. J. 2020;18:2445–2452. doi: 10.1016/j.csbj.2020.09.001. [DOI] [PMC free article] [PubMed] [Google Scholar]
- 19.Tang Q., Kang J., Yuan J., Tang H., Li X., Lin H., Huang J., Chen W. DNA4mC-LIP: a linear integration method to identify N4-methylcytosine site in multiple species. Bioinformatics. 2020;36:3327–3335. doi: 10.1093/bioinformatics/btaa143. [DOI] [PubMed] [Google Scholar]
- 20.Tang Q., Nie F., Kang J., Ding H., Zhou P., Huang J. NIEluter: Predicting peptides eluted from HLA class I molecules. J. Immunol. Methods. 2015;422:22–27. doi: 10.1016/j.jim.2015.03.021. [DOI] [PubMed] [Google Scholar]
- 21.Corral-Debrinski M. mRNA specific subcellular localization represents a crucial step for fine-tuning of gene expression in mammalian cells. Biochim. Biophys. Acta. 2007;1773:473–475. doi: 10.1016/j.bbamcr.2006.06.008. [DOI] [PubMed] [Google Scholar]
- 22.Nair A.S., Sreenadhan S.P. A coding measure scheme employing electron-ion interaction pseudopotential (EIIP) Bioinformation. 2006;1:197–202. [PMC free article] [PubMed] [Google Scholar]
- 23.He W., Jia C., Zou Q. 4mCPred: machine learning methods for DNA N4-methylcytosine sites prediction. Bioinformatics. 2019;35:593–601. doi: 10.1093/bioinformatics/bty668. [DOI] [PubMed] [Google Scholar]
- 24.He W., Jia C. EnhancerPred2.0: predicting enhancers and their strength based on position-specific trinucleotide propensity and electron-ion interaction potential feature selection. Mol. Biosyst. 2017;13:767–774. doi: 10.1039/c7mb00054e. [DOI] [PubMed] [Google Scholar]
- 25.Chen W., Lei T.Y., Jin D.C., Lin H., Chou K.C. PseKNC: a flexible web server for generating pseudo K-tuple nucleotide composition. Anal. Biochem. 2014;456:53–60. doi: 10.1016/j.ab.2014.04.001. [DOI] [PubMed] [Google Scholar]
- 26.Zhang W.Y., Xu J., Wang J., Zhou Y.K., Chen W., Du P.F. KNIndex: a comprehensive database of physicochemical properties for k-tuple nucleotides. Brief. Bioinform. 2020 doi: 10.1093/bib/bbaa284. Published online November 5, 2020. [DOI] [PubMed] [Google Scholar]
- 27.Liu K., Chen W. iMRM: a platform for simultaneously identifying multiple kinds of RNA modifications. Bioinformatics. 2020;36:3336–3342. doi: 10.1093/bioinformatics/btaa155. [DOI] [PubMed] [Google Scholar]
- 28.Bühlmann P., Hothorn T.J. Boosting algorithms: Regularization, prediction and model fitting. Stat. Sci. 2007;22:477–505. [Google Scholar]
- 29.Drucker H., Cortes C. Boosting decision trees. In: Touretzky D.S., Mozer M.C., Hasselmo M.E., editors. NIPS’95: Proceedings of the 8th International Conference on Neural Information Processing Systems. MIT Press; 1996. pp. 479–485. [Google Scholar]
- 30.Chen T., Guestrin C. Proceedings of the 22nd ACM SIGKDD International Conference on Knowledge Discovery and Data Mining. ACM; 2016. Xgboost: A scalable tree boosting system; pp. 785–794. [Google Scholar]
- 31.Prokhorenkova L., Gusev G., Vorobev A., Dorogush A.V., Gulin A. CatBoost: unbiased boosting with categorical features. In: Bengio S., Wallach H., editors. NIPS’18: Proceedings of the 32nd International Conference on Neural Information Processing Systems. ACM; 2018. pp. 6639–6649. [Google Scholar]
- 32.Ke G., Meng Q., Finley T., Wang T., Chen W., Ma W., Ye Q., Liu T.Y. Lightgbm: A highly efficient gradient boosting decision tree. In: Luxberg U.V., Bengio S., Wallach H., Fergus R., Vishwanathan S., Garnett R., editors. NIPS’17: Proceedings of the 31st International Conference on Neural Information Processing Systems, I. Guyon. ACM; 2017. pp. 3149–3157. [Google Scholar]
- 33.Chen X., Wang Z., Pan X. HIV-1 tropism prediction by the XGboost and HMM methods. Scientific Reports. 2019;9:999. doi: 10.1038/s41598-019-46420-4. [DOI] [PMC free article] [PubMed] [Google Scholar]
Associated Data
This section collects any data citations, data availability statements, or supplementary materials included in this article.