

Abstract
In metastatic cancer, the degree of heterogeneity of the tumor-immune microenvironment and its molecular underpinnings remain largely unstudied. To characterize the tumor-immune interface at baseline and during neoadjuvant chemotherapy in high-grade serous ovarian cancer (HGSOC), we performed immunogenomics analysis of treatment-naive and paired pre/post-chemotherapy treated samples. In treatment-naive HGSOC, we find that immune cell-excluded and inflammatory microenvironments co-exist within the same individuals and within the same tumor sites, indicating ubiquitous variability in immune cell infiltration. Analysis of tumor microenvironment cell composition, DNA copy number, mutations and gene expression showed that immune cell exclusion was associated with amplification of Myc target genes and increased expression of canonical Wnt signaling in treatment-naive HGSOC. Following neoadjuvant chemotherapy, increased natural killer cell infiltration and oligoclonal expansion of T cells were detected. We demonstrate that the tumor-immune microenvironment of advanced HGSOC is intrinsically heterogeneous and that chemotherapy induces local immune activation, suggesting that chemotherapy can potentiate the immunogenicity of immune-excluded HGSOC tumors.
The complex interplay between tumor cells and the tumor microenvironment (TME) affects treatment outcome in cancer1–3; however, it is unclear how this occurs in ovarian cancer4,5. Studying the interplay between tumor progression, the TME and treatment response in an advanced stage multisite disease is challenging due to the difficulty of obtaining tumor samples from multiple sites from the same individual, which frequently harbor distinct immune microenvironments5–8. Moreover, interactions between different cell populations of the TME are plastic and change depending on extrinsic perturbations such as therapy9.
High-grade serous ovarian cancer (HGSOC) typically presents with multisite peritoneal tumors, and is uniformly treated with either upfront surgical debulking or delayed primary surgery after neoadjuvant chemotherapy (NACT)4. Thus, HGSOC exemplifies the ideal disease to study the characteristics of the TME at multiple sites in the same patient and quantify changes following perturbation with therapy. In HGSOC, the relatively low somatic point mutation load, high aneuploidy levels and high copy-number alterations have been associated with low immunogenicity4,5. It has been shown that T cell infiltration (CD3+/CD8+) plays a major role in predicting survival in HGSOC in a primary disease setting10,11. Recent studies have started to define the interplay between mutational intra-tumor heterogeneity (ITH) and T cell interactions5, as well as the potential effect of chemotherapy on T cell infiltration in HGSOC12. However, the extent of TME heterogeneity, its underlying mechanisms, and its impact on therapeutic response remain unknown. To address these questions, we here performed systematic immunogenomic analyses of HGSOC samples from two different patient cohorts: (i) a treatment-naive cohort consisting of 49 samples from 10 patients, and (ii) a paired pre/post neoadjuvant chemotherapy cohort consisting of 40 patients with 80 paired samples.
RESULTS
Intrapatient transcriptomic heterogeneity is largely explained by immune-related gene signatures.
To investigate the TME of HGSOC in a treatment-naive setting, we analyzed the transcriptome of 38 primary and metastatic tumor samples from 8 out of 10 patients collected prospectively (Fig. 1a,b and Supplementary Table 1 a,b). To provide accurate sampling, ovarian tumor masses and peritoneal metastases were resected and placed on lesion-specific 3D molds designed from tumor segmentation data from high resolution T2-weighted magnetic resonance (MR) images. Tumor sampling was performed according to imaging-based phenotypically distinct “habitats”, as previously defined13 (see Methods and Supplementary Note). We first performed clustering analysis of the whole transcriptome and independently the protein-coding transcriptome. The overall gene expression of tumor samples was highly patient specific, irrespective of anatomical site or tumor cellularity (the fraction of tumor cells in the admixture of cells in a sample) using t-distributed stochastic neighbor embedding (t-SNE) or hierarchical clustering (Fig. 1c and Supplementary Fig. 1a). To focus on well-defined biological processes and signaling pathways, we performed single sample gene-set enrichment analysis (ssGSEA)14 using the 50 hallmark gene sets15 as well as stromal and immune gene signatures, and tumor cellularity based on bulk tumor mRNA using the ESTIMATE method16. Tumor cellularity derived from mRNA correlated with the whole-exome sequencing (WES) derived tumor cell fraction (Supplementary Fig. 1b, Pearson’s rho correlation coefficient = 0.78, P = 1.49 x 10⁻⁶), estimated from copy number alteration (CNA) with TITAN17. We categorized the MSigDB hallmark gene sets into five classes: oncogenic, cellular stress, immune, stromal, and other. Principal component analysis (PCA) showed that most of the gene set enrichment variation between samples (62% of variation from the two first PCs) could be explained by oncogenic, immune, and stroma-associated gene sets (Fig. 1d and Supplementary Fig. 1c). In contrast to the full transcriptome analysis, patient-specific clustering was less evident, indicating that tumors from different patients share common patterns of pathway activation and non-cancer cell related gene sets. To investigate which gene sets explained the observed variance, we computed the principal component feature loadings and displayed them in a variable factor map (Fig. 1e). This analysis showed that PC1 (47% of variation) is explained by tumor cellularity, since immune and stromal gene set vectors had an opposite direction to oncogenic vectors (Fig. 1e inset and Supplementary Fig. 1d). Unsupervised hierarchical cluster analysis corroborated sample clustering as a function of tumor cellularity, and separated clustering of oncogenic and immune gene sets despite low overlapping of genes within hallmark classes (Supplementary Fig. 1e,f).
Fig. 1 |. Immune-related gene signatures contribute to the majority of the transcriptional variance observed across multiple tumor samples from treatment-naive HGSOC patients.

a, Presence, absence and replicate indication of samples and data types for treatment-naive samples (Cohort I). Metastases other than omentum were defined as “Other”. Samples from the same tumor are indicated with a connecting horizontal line (Supplementary Fig. 2a). Pseudoreplicates are samples from the same tumor and habitat, but from a different region within the habitat (see Methods). Age, age at diagnosis; BRCA, BRCA1/2 mutation status (Neg, negative; NA, data not available); WES, whole exome sequencing; IF, immunofluorescent staining. Extended clinical data can be found in Supplementary Table 1a,b. b, Flowchart of sample acquisition and analysis, c, t-SNE analysis of overall transcription profiles of multiple HGSOC tumor samples per patient, d, PCA of ssGSEA-based analysis of cancer hallmark gene sets, e, Principal component feature loadings (magnitude and direction) of c are shown in the variables factor map. Vectors are colored according to a major biological classification of cancer hallmark gene sets. Variation across classes in the PCs is shown in Supplementary Fig. 1c. Directionality of ESTIMATE’S tumor cellularity is represented with the map compass (n = 38 samples from n = 8 independent patients). Inset shows 95% non-parametric bootstrap confidence intervals for the means of loadings per hallmark gene set for PC1 (n = 36 samples from n = 8 independent patients). Approximated bootstrap P-values were calculated (see Methods) *P < 0.05, **P < 0.01 (immune vs. oncogenic P ≈ 0.01, stroma vs. oncogenic P ≈ 0.008). f, ESTIMATE immune score across patients and samples. The Case Study samples were taken from ref. 7. Box plots show median, interquartile range (25th and 75th percentiles) and 1.5x interquartile range. All samples are plotted. Abdomen image by Wenjing Wu/© 2018 Memorial Sloan Kettering Cancer Center.
Since differential expression of immune-related gene signatures explained much of the variation between the samples, we further investigated the extent of intrapatient immune heterogeneity by computing the ESTIMATE immune score for each sample16. We compared the immune scores of the samples collected with the HGSOC case study that we previously published7, and immune scores of 307 treatment naive ovarian cancer samples from The Cancer Genome Atlas (TCGA)18. Overall, the immune scores of our cohort fell within the expected range (Fig. 1f), suggesting that the immune characterization is representative at the population level. Some patients (01, 04, 10, and the case study) showed an intrapatient variation comparable to the inter-patient variation observed at the population level by the TCGA ovarian cancer samples, which indicates that, within a single individual, distinct immune microenvironments can co-exist at diagnosis of HGSOC. Consistent with our prior report7, we recapitulate the observation that tumors with high immune infiltration (ESTIMATE immune score) and immunosuppressive Wnt signaling tend to be mutually exclusive (Supplementary Fig. 1g, Kendall’s tau correlation coefficient = −0.34, P = 0.003) with case 04 showing a negative correlation (Supplementary Fig. 1g, Pearson’s rho correlation coefficient = −0.95, P = 0.015). When samples were divided into low and high WES-derived tumor cellularity using the median value as a cut-off, we corroborated that samples with high tumor cellularity have a higher ssGSEA normalized enrichment scores (NES) of Wnt signaling (Supplementary Fig. 1h, two-sided Mann-Whitney rank test, P = 0.01).
Co-existence of distinct tumor-immune microenvironments and spatial T cell infiltration heterogeneity in HGSOC.
To further characterize the tumor microenvironment of HGSOC, we performed multicolor immunofluorescence (IF) staining and quantification of CD4+, CD8+, and regulatory T cells (CD4+ FOXP3+) in at least 10 tumor sections excluding stromal areas in each sample leading to a compendium of 440 imaged and quantified tumor sections (Fig. 2a,b, Supplementary Fig. 2a,b, and Supplementary Table 2a). This multi-region and multi-site IF analysis shows that treatment-naive HGSOC patients have variation in T cell infiltration in tumor sites, ranging from less than 1% (e.g. patient 06) to more than 10% of total cells in some sites (e.g. patient 10). Furthermore, some patients’ tumor sites demonstrated marked variation in T cell infiltration within the same tumor site across different imaging habitats (e.g. patient 01). Using hierarchical random-effect models (see Methods and Supplementary Table 2b), we found higher variability of T cell infiltration between and within habitats (i.e. within the same tumors site) than across tumor sites and across patients in CD8+, CD4+ and Tregs (Fig. 2a and Supplementary Fig. 2a–c, bootstrap P-values < 0.01), suggesting that the spatial intra-lesion variation of T cell infiltration is greater than the variation across sites and individuals.
Fig. 2 |. T cell infiltrate variation across patients, within patients, and within tumors.
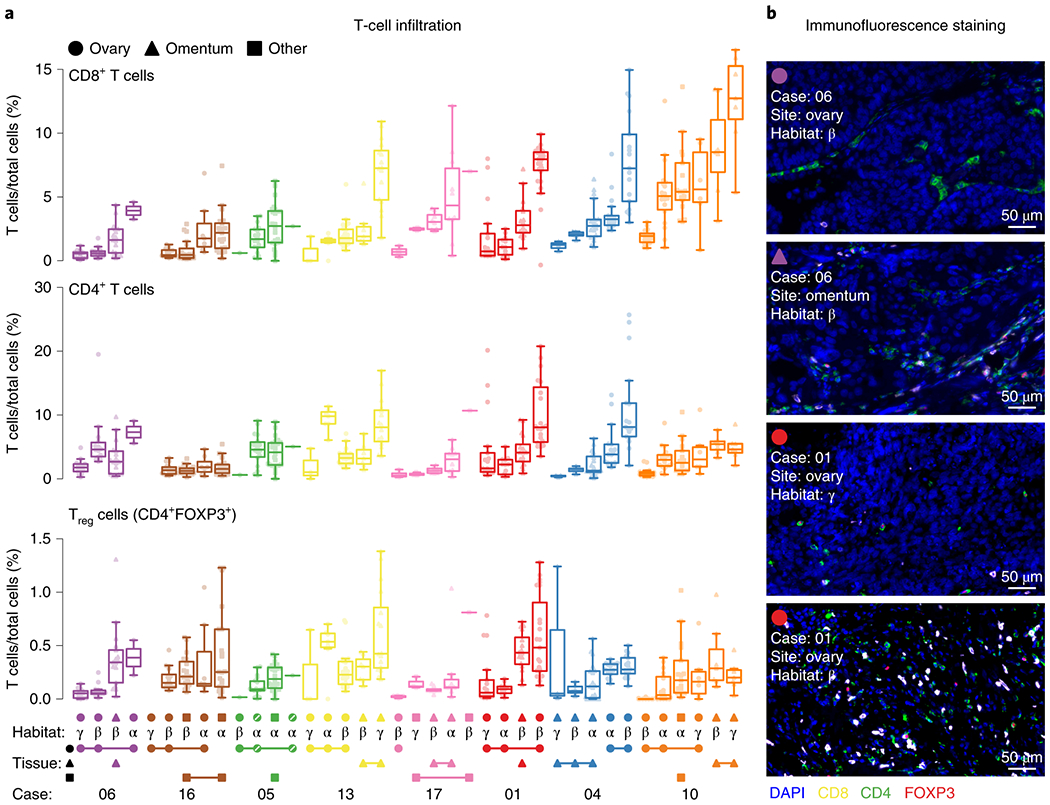
a, Multi-tumor sampling from 8 HGSOC patients are shown with each dot representing the percentage of T cell subsets in a quantified area within a given tumor section stained with multicolor IF for CD8, CD4 and FOXP3. Stromal areas were excluded based on H&E stains. Patient cases are indicated by different colors. Imaged-based phenotypic habitats are defined by the Greek letters α, β and γ. Habitats from the same tumor sample are indicated by connecting lines at the bottom (see Supplementary Fig. 2a for detailed examples). Box plots are sorted according to the median of CD8 T cell infiltration across patients, sites and habitats. Box plots show median, interquartile range (25th and 75th percentiles) and 1.5x interquartile range. All samples’ regions are plotted. The two pseudoreplicates in case 5 are indicated with a diagonal line in the tumor site symbol (n = 440 observations of n = 8 independent patients with 38 total samples, see Supplementary Table 2). b, Representative images of a.
Transcriptional analysis points to Wnt and Myc pathways enriched in high tumor cellularity samples.
To evaluate the infiltration levels of immune and stromal cell types other than T cells, we compared different TME cell deconvolution methods and cell-type specific signatures (Supplementary Note). We benchmarked seven different methods and ConsensusTME (Supplementary Fig. 3a,b)19 using WES-derived tumor cellularity (TITAN) and T cell counts from our HGSOC cohort as well as WES-derived tumor cellularity (ABSOLUTE) and leukocyte methylation scores from TCGA HGSOC samples. ConsensusTME consistently performs as one of the top three methods in the different benchmarks tested (Fig. 3a,b, Supplementary Fig. 3c, and Supplementary Table 3). We applied ConsensusTME to the treatment-naive HGSOC transcript data to explore if cell types besides CD8+, CD4+ and Tregs had noticeable patterns of infiltration across the samples. We first visualized the variation across samples using the NES of estimated ConsensusTME gene sets of cells and corroborated the intra-patient TME heterogeneity with highly and lowly infiltrated tumors of different cell-types (Fig. 3c and Supplementary Fig. 3d). As expected, PC1 separated samples by tumor cellularity explaining 74% of variance (Supplementary Fig. 3e,f). Analyzing the next principal components (PC2 and PC3), the cell-types explaining most of the variation were cytotoxic, NK cells and T cells (opposite to tumor cellularity), and fibroblasts and endothelial cells (toward tumor cellularity) (Fig. 3c,d and Supplementary Fig. 3d).
Fig. 3 |. Unbiased analysis of tumor microenvironment heterogeneity in treatment-naive HGSOC tumors.
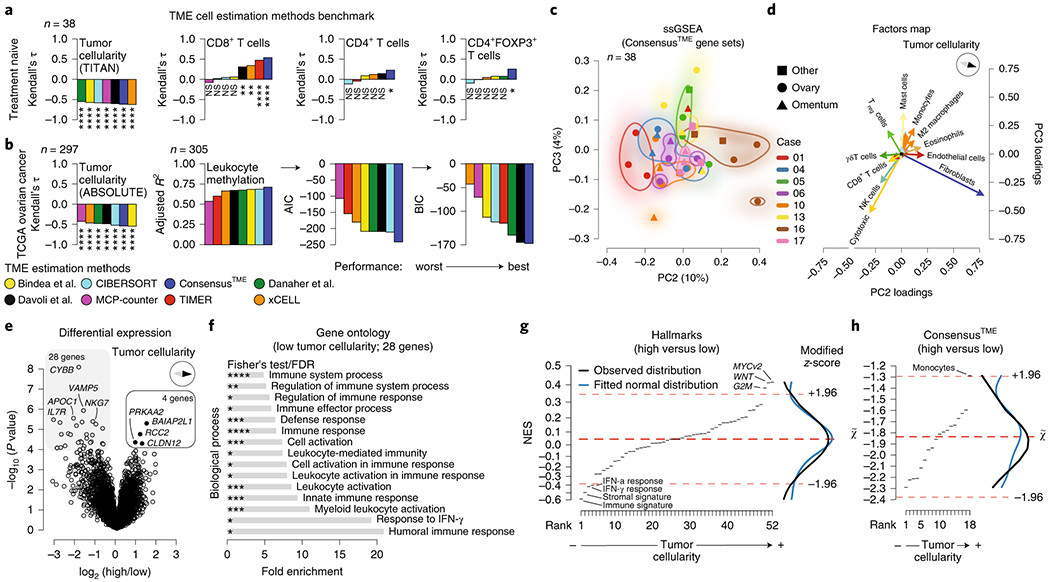
a, Treatment-naive cohort correlation between (i) total TME cell estimation scores and WES-derived tumor cellularity (TITAN), and (ii) percentage of CD8+, CD4+, and Tregs determined by immunofluorescent staining, b, TCGA ovarian cancer cohort correlation between total TME cell estimation scores for each method and WES-derived tumor cellularity (ABSOLUTE), and fitted multiple linear regression analysis using TCGA leukocyte methylation score as response variable and estimated immune cell types as explanatory variables (see Supplementary Note and Supplementary Table 3a). Adjusted R2, Akaike information criterion (AIC), and Bayesian information criterion (BIC) values were calculated to compare both goodness of fit and model simplicity. Kendall’s tau correlation coefficients and P-values were calculated for a and b with exact Kendall’s tau-b two-sided test. See below for significance levels. Normality and homoscedasticity assumptions were tested for all statistical comparisons, c, PCA of ssGSEA-based analysis using ConsensusTME estimations (n = 38 samples from n = 8 independent patients), d, Principal component feature loadings (magnitude and direction) of c. Vectors are colored according to cell-types as shown in Supplementary Fig. 3a, for example monocytes and macrophages M0, M1, M2 (orange), B cells and plasma cells (light blue), and CD8 and cytotoxic cells (yellow), e, Differential expression analysis of high and low tumor cellularity classified tumors using the WES-derived tumor cellularity (TITAN) score median of the cohort as a cutoff. Patient dependence was used as a covariate (n = 36 samples which have both WES and mRNA data, n = 8 independent patients). Limma moderated two-sided t-statistics by empirical Bayes moderation. Benjamini-Hochberg (BH) FDR corrected. FDR < 0.05 was considered differentially expressed, f, Gene ontology enrichment analysis of 28 significantly highly expressed genes in low tumor cellularity samples. Two-sided Fisher’s exact test, BH FDR corrected (Supplementary Table 3d). g,h, ssGSEA analysis of differentially expressed genes using hallmarks and ConsensusTME normalized enrichment scores (NES). Gene sets on the x-axes were ranked according to their NES (Supplementary Table 3b,c). High NES reflects high tumor cellularity. Dashed red lines indicate median and ±1.96 median absolute deviations (modified z-score). Kernel density plots of observed and fitted normal distribution are shown in the right margin. No significant difference between observed and fitted distribution was detected (Shapiro-Wilk test, D’Agostino’s K2 test, and Anderson-Darling test for normality distribution). ns P > 0.05, *P < 0.05, **P < 0.01, ***P < 0.001, ****P < 0.0001.
We next assessed whether specific genes or transcriptional programs were associated with variability in immune infiltration. We used the median WES-derived tumor cellularity (TITAN) of the cohort to classify high and low tumor cellularity samples as an orthogonal tumor cellularity quantification (see Methods). We performed a differential expression analysis leveraging sample-patient dependency (i.e. considering that multiple tumor samples come from the same individual) to increase statistical power20. As expected, genes related to immune activation were highly expressed in low tumor cellularity samples, but only four genes (BAIAP2L1, RCC2, CLDN12, PRKAA2) were highly expressed in high tumor cellularity samples (Fig. 3e). Gene ontology (GO) enrichment analysis showed that genes with higher expression in low tumor cellularity samples are enriched in inflammation-related processes such as humoral response, response to IFNγ, and leukocyte activation (false discovery rate (FDR) < 0.05) (Fig. 3f). No significant GO enrichment was found with the genes significantly highly expressed in high tumor cellularity.
To investigate which molecular signaling pathways or TME cell-types were more highly enriched in high tumor cellularity samples, we performed ssGSEA using the t-statistic of the differential expression analysis. As expected, immune and stromal signatures were highly enriched in low tumor cellularity samples, as well as IFNγ and IFNα response. In contrast, Myc and Wnt signaling appeared to be highly enriched in high tumor cellularity (Fig. 3g and Supplementary Table 3b). We corroborated the mutual exclusivity between immune and Wnt signaling scores in TCGA ovarian cancer samples (Supplementary Fig. 3g, Kendall’s tau = −0.17, P = 9.2 x 10⁻⁶) and found the same trend for Myc signaling (Supplementary Fig. 3g, Kendall’s tau = −0.17, P = 5.2 x 10⁻⁶). In our treatment-naive cohort, Myc signaling showed a consistent negative trend with the immune signature across all patients (Supplementary Fig. 3h, Kendall’s tau = −0.38, P = 0.001) and was enriched in high cellularity tumors (Supplementary Fig. 3i, independent t-test P = 0.006). Considering the TME, only monocytes appeared more prevalent in high tumor cellularity samples (Fig. 3h and Supplementary Table 3c). These observations suggest that high Myc and Wnt signaling could be considered at least partially independent of tumor proliferation and may contribute to immune cell exclusion as suggested by previous studies21–25.
Integrated transcription and mutation analysis support Myc and Wnt signaling associated with immune cell exclusion.
We next performed whole-exome sequencing (WES) to characterize the mutational landscape of immune exclusion in these tumors. In total, 47 tumor samples from 10 patients with treatment-naive multi-site HGSOC were sequenced (Fig. 1a) along with 10 normal samples and analyzed for single-nucleotide variations (SNVs) and small insertions and deletions (see Methods). Furthermore, we used TITAN to infer DNA copy-number alterations (CNAs), tumor ploidy, cellularity, and subclonality (Supplementary Fig. 4a)17. As expected, we found a negative correlation between WES copy-number derived cellularity estimates (TITAN) and the ESTIMATE immune cell score used in the prior analyses (Supplementary Fig. 4b, Pearson’s rho = −0.82, P = 9.96 x 10⁻¹⁰). We found that WES-derived tumor cellularity calculated by TITAN was positively correlated with ASCAT26 (Supplementary Fig. 4c, Kendall’s tau = 0.69, P = 1.01 x 10⁻¹²) and negatively correlated with IF-based estimates of T cell infiltration (Supplementary Fig. 4d, CD8+ T cells Kendall’s tau = −0.25, P = 0.028).
As expected18,27, TP53 mutations were detected in almost all patients (9 of 10, Supplementary Table 4) as well as frequent amplification (≥ 6 copies) of KRAS and MYC (Fig. 4a). In agreement with KRAS driving cell proliferation via MAP kinase signaling28, KRAS-amplified samples were more highly enriched in cell cycle-related G2M checkpoint (Supplementary Fig. 4e, Welch’s test, P = 0.03), which was further supported by Ki67 staining (Supplementary Fig. 4f, Kendall’s tau = 0.34, P = 0.006). This suggests that the G2M checkpoint program in high cellularity tumors is a by-product of KRAS amplification rather than a driver of immune exclusion. No associations were observed between tumor cellularity and mutations in HGSOC tumor suppressor genes or oncogenes18 (Fig. 4a), nor were mutations in HLA genes detected (Polysolver), in line with a previous analysis in primary HGSOC samples29.
Fig. 4 |. Mutation patterns in immune-excluded tumors associate with Wnt pathway genes and Myc target genes.

a, Coding mutations and copy-number alterations (CNAs) in selected driver oncogenes and tumor suppressors based on known drivers in HGSOC. Tumor-normal DNA pairs from n = 10 independent patients, 47 independent tumor site samples (and 3 pseudoreplicates), were sequenced (whole-exome sequencing, WES) and analyzed for copy-number alterations using TITAN, resulting in estimates of tumor ploidy, cellularity, and subclonality. The top and side bars represent the summed column-wise and row-wise number of alterations, respectively. *, †, and ‡ indicate pairs of pseudoreplicates (see Fig. 1a). b, DNA copy-number signatures analysis showing tumor-specific exposure to all seven signatures ordered by tumor cellularity (TITAN) selecting samples with high confident purity and ploidy estimates (n = 42 samples, n = 10 independent patients), c, Copy-number signature 4 association with immune score. Using samples with both mRNA and WES data (n = 30 samples), ESTIMATE immune score was compared (Welch’s two-sided t-test) between samples with signature 4 exposure below (low s4) and higher than the median exposure (high s4). Boxplot with median midline, boxes representing the 1 to 3 quartiles and whiskers extending to extreme values at most 1.5 times the interquartile range. d, Functional mutation enrichment and tumor cellularity associations per hallmark gene set were tested through the Chi-squared likelihood ratio test using the tumor mutation load and the patient dependency as covariates. The difference in mean pathway mutation ratio between samples with high cellularity versus samples with low cellularity (WES-derived by TITAN, n = 50 samples) is plotted against BH FDR corrected P-values (Benjamini, Hochberg, and Yekutieli) from multiple linear regression (tumor cellularity~mutation ratio, n = 50 samples), e, Gene set enrichment analysis (GSEA) of gene-level correlation between absolute copy-numbers and gene expression (CNA~mRNA, per-gene median n = 36 samples), compared to enrichment in correlations between gene expression and tumor cellularity (mRNA~tumor cellularity, n = 36 samples), both estimated by means of Spearman’s rank correlation method (see Methods). BH FDR correction was performed, adjusting for the number of hallmark terms. Normality and homoscedasticity assumptions were tested for all statistical comparisons.
In ovarian cancer, copy-number aberration and chromosomal instability can be driven by distinct mutational processes such as BRCA1-BRCA2-related homologous recombination deficiency (HRD), gene breakage events and amplification-associated foldback inversions30–32. To assess such processes, we quantified previously defined copy number signatures constructed from features including breakpoint counts, change in copy number, and segment size. This enabled us to quantify exposure to mutagenic cellular processes contributing to genomic instability in ovarian carcinoma (Supplementary Fig. 4g and Supplementary Note)32. We then applied this same WES-based copy-number signature analysis on the treatment-naive cohort with high confidence purity and ploidy fits based on TITAN (n = 42, Supplementary Table 1c). In agreement with our previous study32, we found that signatures 1 and 4 had high mean exposure (both 30% in our cohort, Fig. 4b). Signature 1 reflects oncogenic Ras-MAPK signaling, telomere shortening, and amplification-associated fold-back inversions, while signature 4 associates with oncogenic PI3K and Myc signaling, and whole-genome duplication. In addition, we found evidence of mutagenesis due to homologous recombination deficiencies BRCA1-BRCA2-related HRD signature 3 (mean exposure of 6%) and non-BRCA1-BRCA2-related HRD signature 7 (mean exposure of 19%). As expected, the germline mutant BRCA2 patient 04 had relatively high mean exposure of signature 3 (14% compared to 6% of the full cohort).
We next asked whether specific copy-number signatures associated with immune cell infiltration. Samples with high exposure of signature 4 associated with low ESTIMATE immune score (Fig. 4c, P = 0.043 Welch’s test). In general, signature 4 and signature 1 showed opposite trends, with signature 4 correlating negatively and signature 1 positively with immune score, also after accounting for the compositional nature of the data using isometric log ratio (ILR) transformation33 (Supplementary Fig. 4h–j). These data suggest that specific mutational processes in HGSOC may be related to distinct tumor-immune microenvironments.
To investigate whether specific pathway related SNVs associate with tumor cellularity, we performed mutation enrichment analysis controlling for sample mutation load and patient dependency (see Methods). We detected functionally relevant mutations in apoptosis (FDR = 0.0004), reactive oxygen species (FDR = 0.0004), stromal (FDR = 0.0031) and Wnt signaling (FDR = 0.0097) gene sets, which were enriched in tumors with high tumor cellularity (Fig. 4d, Supplementary Fig. 4k, and Supplementary Table 4bₓe; likelihood ratio test and Benjamini, Hochberg and Yekutieli false discovery rate). We then evaluated whether the functional mutation enrichment (non-silent SNVs divided by the total number of genes in that gene set) affects the expression of pathway genes and found that the stromal gene set showed a negative correlation (Kendall’s tau = −0.35, P = 0.008) and Wnt signaling a positive correlation (Kendall’s tau = 0.32, P = 0.01) with their respective NES (Supplementary Fig. 4I). The mutations in the Wnt signaling pathway found to be highly damaging as predicted by PolyPhen-234 were DKK1K211N (PolyPhen-2 = 1), PTCH1F826L (PolyPhen-2 = 0.972), and a truncating mutation in NKD1Q241*, all of which encode for negative regulators of Wnt signaling35–37. These mutations were enriched in multiple tumor samples with high tumor cellularity (Supplementary Table 4) and high NES of Wnt signaling pathway (Supplementary Fig. 4I). Together, these results suggest that higher levels of Wnt signaling can be a consequence of functional mutations in regulators of the Wnt pathway, although these are rare mutations in primary tumors.
To assess gene expression regulation from tumor cells with CNAs, we integrated transcriptomic, genomic and tumor cellularity data. In brief, for a given gene, a positive correlation of gene expression with CNA and tumor cellularity indicates that the gene is expressed predominantly in cancer cells as opposed to non-cancerous cells (e.g. immune, stromal, etc.). We computed these correlations genome-wide and performed GSEA on the ranked correlation coefficients of genes belonging to hallmark gene sets (Fig. 4e and Supplementary Fig. 4m). As expected, immune- and stroma-related gene sets show a negative correlation of gene expression with CNAs and tumor cellularity (e.g. EMT, inflammatory pathway, TNF-α). In contrast, Myc targets have a positive correlation between gene expression CNAs and tumor cellularity, indicating overexpression of Myc targets is cancer-derived and induced by CNAs. However, MYC transcription factor amplification was not significantly (P > 0.05) associated with mRNA expression, nor did MYC mRNA expression correlate with tumor cellularity (Supplementary Fig. 4n, similarly for MYCN). Our integrated transcriptomic, CNA and IF analysis provides clues to the interpretation of tumor gene expression as Myc target genes may be selectively amplified and overexpressed during tumor development.
Chemotherapy induces immune activation in HGSOC.
To investigate the effect of chemotherapy on the TME and evaluate whether the intra-patient TME heterogeneity described above could be a potential confounding factor, we studied the transcriptome of 18 site-matched and 38 site-unmatched tumors before and after treatment with neoadjuvant platinum and taxane chemotherapy (9/17 site-matched cases, 19/23 site-unmatched cases with transcriptome data, Fig. 5a,b and Supplementary Table 5a–c). Using t-SNE dimensionality reduction on the whole transcriptomes, we found that treated and untreated samples clustered separately (Fig. 5c and Supplementary Fig. 5a), in contrast to the samples of the treatment-naive cohort that cluster in a patient-specific manner (Fig. 1c and Supplementary Fig. 1a). Using the ssGSEA NES of the hallmark gene sets, we observed that pre- and post-treatment sample groups were separated by the two first principal components (Fig. 5d and Supplementary Fig. 5b,c). Only site-matched samples showed that PC1 values (52% variation) were higher in pre-treatment samples relative to post-treatment ones (Fig. 5d, paired t-test test, P = 0.038), with higher PC1 values positively associated with oncogenic pathways, while immune/stromal hallmarks were negatively associated (Supplementary Fig. 5c). In addition, immune signature NES showed a negative association with Myc signaling (Kendall’s tau correlation coefficient = −0.39, P = 0.025) and a similar trend with Wnt signaling (Kendall’s tau correlation coefficient = −0.31, P = 0.075) in site-matched samples (Supplementary Fig. 5d). Using ConsensusTME, pre- and post-treatment samples clustered separately for site-matched but not site-unmatched samples (Fig. 5e and Supplementary Fig. 5e,f).
Fig. 5 |. Unbiased signaling pathway and TME cell decomposition analysis of chemotherapy treated HGSOC site-matched and unmatched tumor samples.

a, Presence, absence and replicate indication of samples and data types for the pre and post-chemotherapy matched and unmatched samples (Cohort II). Extended clinical data can be found in Supplementary Table 5. b, Flowchart of sample acquisition, clinical study design, and analysis, c, t-SNE analysis of overall transcription profiles of multiple HGSOC tumor samples per patient. d,e, PCA and principal component feature projections (magnitude and direction) of ssGSEA-based analysis of hallmark gene sets and ConsensusTME cells. Insets show paired comparison of pre- and post-treatment samples PC1s. Inset violin plots represent the full probability density of the data. Paired samples are connected with a line. Two-sided paired t-tests were conducted for hallmark, while Wilcoxon signed rank tests were conducted for ConsensusTME gene sets PC1 comparison. *P < 0.05. Normality and homoscedasticity assumptions were tested for all statistical comparisons. P-values were not corrected for multiple testing since the maximum number of tests within analysis was two (c). Pelvis image by Wenjing Wu/© 2018 Memorial Sloan Kettering Cancer Center.
Intra-patient TME heterogeneity masks chemotherapy-induced immune activation.
To evaluate differences between pre- and post-treatment samples, we performed an exploratory analysis leveraging paired comparisons using the Hallmark and ConsensusTME gene set NES’s independently for site-matched and site-unmatched samples (Fig. 6a). Site-matched samples showed an increase of immune related hallmark gene sets and ConsensusTME estimated immune cells in post-treatment samples, while site-unmatched samples showed an increase of cellular stress pathways reflecting cellular and metabolic stress after cytotoxic drug exposure, but no difference of ConsensusTME gene sets. We performed multivariate analysis on innate, adaptive, and cytotoxic cells (CD8+ and NK cells) comparing pre- and post-NACT samples (Supplementary Fig. 6a). Only an increase of NK cells and the cytotoxic gene set following NACT in the site-matched samples was detected, while no difference was observed in the site-unmatched samples (Fig. 6b and Supplementary Fig. 6b). There was no significant difference in CD8+ and cytotoxic cells, suggesting that NK cells infiltrate and become active after NACT.
Fig. 6 |. Chemotherapy-induced enrichment of NK cells evident in site-matched samples and is supported by preclinical data.

a, Pre/post NACT paired comparisons of hallmark gene sets and ConsensusTME inferred cells. Paired t-test, Welch’s t-test or Wilcoxon’s signed-rank test (all two-sided) were calculated according to the samples’ distribution and variance (see Methods). BH FDR P-value corrections were computed, b, Left histograms, multivariate analysis of cell type combinations associated with NACT (two-sided Hotelling’s T2 permutation test) and, right, notched box plots comparing pre- and post-NACT for sums (+) of cell scores: cytotoxic cells (i.e. signature of cytolytic activity from ConsensusTME), CD8+ T cells or NK cells (multiple linear regression without interaction, see Supplementary Fig. 6a). n = 8 independent patients; top row corresponds to n = 18 matched samples, bottom row to n = 38 unmatched samples. Notched box plots show median and interquartile range (25th and 75th percentiles), with paired data points indicated by a connecting line. Violin plots are shown in the background representing the probability density of the data. c, Flow cytometry analysis of homogenized tumors after UKP10 intraperitoneal inoculation of 8 weeks old C57/BL6 mice and treatment with 2 mg of cisplatin dissolved in 1 ml of PBS or 1 mL PBS as control as indicated. Analyzed immune cell types were CD8+ T-effector cells, NK1.1+ NK cells, CD4+ T-helper cells, FOXP3+ T-regulatory cells, CD19+ B cells, CD11b+ myeloid cells. Granzyme B (GrB) expression was used as a proxy for activity state of cytotoxic cells. Two-sided two-sample independent t-tests were conducted for CD8 T cells and two-sided Welch’s tests were conducted for NK cells. d, Similar to c, except peritoneal fluids of intraperitoneally inoculated ID8 cells were analyzed. CD4+ T-helper cells, FOXP3+ T-regulatory cells, CD19+ B cells, CD11b+ myeloid cells are shown in Supplementary Fig. 6f,g. Two-sided two-sample independent t-tests were conducted for CD8 T cells and NKGrB+ out of NK cells, while two-sided Welch’s tests were conducted for the rest of NK cell comparisons. Violin plots are shown in the background representing the full probability density of the data. All samples are plotted. Normality and homoscedasticity assumptions were tested for all statistical comparisons.
NK cells are enriched after cisplatin treatment in preclinical ovarian cancer models.
The ConsensusTME analysis of the site-matched samples suggested that cytotoxic NK cells infiltrated after chemotherapy. To experimentally validate this finding, we employed two syngeneic ovarian cancer models: UPK1038 and ID839. Phenotypically, implantation of UPK10 into the peritoneal cavity leads to large tumors with minimal ascites, while intraperitoneal ID8 cell implantation results in carcinomatosis and ascites. We generated an aggressive ID8 cell line clone by sequential passaging through immune competent mice. The resulting cell line leads to rapid development of carcinomatosis and ascites, allowing for early assessment of therapy efficacy (Supplementary Fig. 6c–e). To assess the impact of cisplatin in these complementary models, tumor-bearing C57BL/6 mice were treated with cisplatin or PBS as control, and tumors (UPK10) or peritoneal washings (ID8) were collected and processed for multi-parameter flow cytometry (Fig. 6c,d). NK cells were significantly enriched after cisplatin treatment in the peritoneal fluid of the ascites ID8 model (P = 0.004) with similar trend observed in the UPK10 tumors, although not meeting statistical significance (P = 0.083). No significant increases in other immune populations were observed in both models (Supplementary Fig. 6f,g). These observations are in line with ConsensusTME predicted changes in the site-matched samples as only the combination of NK and cytotoxic gene set scores in the multivariate analysis (Fig. 6b and Supplementary Fig. 6a,b) was significantly enriched after NACT (multivariate T2 test: P = 0.0437; logistic regression: P = 0.012).
Chemotherapy induces oligoclonal expansion of T cell subsets across patients.
To evaluate T cell infiltration and oligo-clonal expansion between pre- and post-NACT samples, we performed TCR sequencing. Since T cell activation leads to clonal expansion of particular T cell clonotypes, TCR clonality measures can be used as a surrogate for T cell activation upon (neo)antigen recognition7,40,41. TCR oligoclonal expansion was significantly higher in post-NACT site-matched samples (Fig. 7a, paired test P = 0.001), but no significant difference was observed in site-unmatched samples (paired test P = 0.19). T cell fraction was also significantly higher in post-NACT site-matched samples (paired test P = 0.03), while a slightly lower T cell fraction was observed in site-unmatched post-NACT tumors, potentially as a result of the variability of immune infiltration between omentum metastases (pre-NACT biopsies) and primary tumors (post-NACT debulking surgery). We explored whether features of unique vs. shared TCR sequences across patients could provide further nuance in the observed effects of chemotherapy on T cell expansion. In the site-matched patient group, there was a higher number of shared TCRs between pre- and post-treatment samples compared to the site-unmatched group (11,032 vs. 6,524, chi-squared test of independence of variables P < 2.22 x 10−308, Fig. 7b). Moreover, the number of samples sharing the same TCRs was higher in post-NACT compared to pre-NACT samples (Fig. 7c, one-way chi-squared test P = 2.8 x 10−75). We compared the number of shared TCRs before and after NACT, as well as the number of unique pre- and post-NACT TCRs per patient. The number of unique TCRs post-NACT was higher than the number of unique pre-NACT TCRs in site-matched samples (Fig. 7d top, Nemenyi post-hoc test q = 0.07), while in unmatched samples no difference was observed between pre- and post-treatment unique TCRs (Nemenyi post-hoc test q = 0.464). The majority of the new TCRs do not present a clonal expansion shown by their productive frequency (Fig. 7d bottom). We did not identify statistically significant associations between pre-treatment gene signatures and NACT-induced increase of TCR clonality in site-matched samples although some trends were observed (Supplementary Fig. 7d,e). Together, these results provide evidence that NACT induces an immune activation in the local TME of HGSOC, and that intra-patient inter-site TME heterogeneity can obscure this clinically relevant observation among tumor sites within patients.
Fig. 7 |. Oligoclonal expansion of T cells and enrichment of shared TCRs after chemotherapy.

a, Comparisons of percentage of productive T cells (top), TCR productive clonality (middle), and maximum productive TCR frequencies (bottom) between pre- and post-NACT site-matched and site-unmatched samples. Paired (matched samples) parametric (TCR clonality and TCR freq.) and non-parametric Wilcoxon (% T cells) two-sided t-tests were computed. Unpaired (unmatched samples) non-parametric Wilcoxon (% T cells, TCR clonality and TCR freq.) two-sided t-tests were computed. TCR clonality is expressed as 1-entropy with values near 1 representing samples with one or a few predominant TCR rearrangements, while values near 0 represent more polyclonal samples. Notched box plots show median and interquartile range (25th and 75th percentiles), with paired data points indicated by a connecting line. Violin plots are shown in the background representing the full probability density of the data. b, Shared and unique TCR amino acid sequences between pre- and post-NACT site-matched and site-unmatched samples. Chi-squared test of independence of variables was conducted. c, Distributions of shared TCR amino acid sequences between patients pre- and post-NACT samples. One-way chi square test was conducted. d, Number of shared and unique TCRs pre- and post-NACT in site-matched and site-unmatched samples (top) and their productive frequencies (bottom). Notched box plots show median and interquartile range (25th and 75th percentiles), 1.5x interquartile range (top) and outliers. Violin plots are shown in the background representing the full probability density of the data. Widths of box and violin plots are proportional to the number of samples (top) and TCRs (bottom). Friedman ranking tests followed by Nemenyi post-hoc tests with associated adjusted p-values (q) were conducted. P-values were not corrected for multiple testing since the maximum number of tests within analysis was six (a). Normality and homoscedasticity assumptions were tested for all statistical comparisons.
DISCUSSION
Despite advances in treatment, the prognosis for patients with HGSOC remains poor, with frequent development of resistance to therapy. Genetic and molecular analyses of asynchronous and disseminated tumors within patients have recently started to shed light on tumor clonal dynamics and evolutionary properties of different tumor types42–44; however, the extent of TME heterogeneity in advanced HGSOC has only begun to be revealed5,7,45. We explored the main sources of variation in the transcriptomic space among treatment-naive samples and detected that transcriptomic pathway heterogeneity is mainly explained by the presence or absence of immune and stromal cells. The degree of immune signature variation within patients was similar to the extent we observed in a case study of metastatic HGSOC, where different tumor immune microenvironments were associated with clinical outcome7. In the present study, all patients presented at least one tumor with low immune infiltration, suggesting that HGSOC is characterized by distinct microenvironmental niches, which could underpin primary and acquired resistance to therapies9,46,47. Integration of transcription, copy-number and tumor cellularity analysis revealed that Myc target genes are amplified and overexpressed in immune cell-excluded samples with high tumor cellularity, while functional mutation enrichment analysis found mutations in negative regulators of Wnt signaling, both providing plausible mechanistic explanations for immune cell exclusion given the known immunosuppressive functions of Myc and Wnt signaling21,22,25,48. Taken together, TME heterogeneity is an intrinsic feature of HGSOC, which spans across patients, tumors within patients and within tumors in treatment-naive, metastatic disease. Furthermore, we found that intra-patient TME heterogeneity can mask the immune activation generated by treatment with cytotoxic chemotherapy. These analyses provide evidence of an immunogenic effect of chemotherapy in HGSOC, and the finding of chemotherapy-induced NK cell expansion provides a translational path for new treatment strategies combining chemo- and immunotherapy.
The availability of multiple tumor samples from the same patients enabled differential expression analysis between high and low tumor cellularity tumors. Pathway analysis of the differentially expressed genes showed that Wnt signaling and Myc target gene signatures were more enriched in samples with high tumor cellularity (Supplementary Table 6), consistent with emerging data in HGSOC and other tumors and models6,23,25,49,50. Analysis of orthogonal WES data further suggested a link between Myc target gene activation and lower immune cell infiltration as (1) MYC was amplified (≥ 6 copies) in approximately one third of the analyzed tumors, (2) copy-number signature 4, which is characterized by MYC alterations and whole-genome duplications events, was negatively correlated with immune score, and (3) expression level of Myc target genes is significantly correlated with both their copy number amplification and tumor cellularity. We did not find associations between inflamed or immune-excluded TME phenotypes and MYC expression, and it remains an open question whether activity of MYC itself beyond its targets genes contributes to the observed differences in TMEs.
There are clinical implications from understanding the effect of chemotherapy on the TME and the molecular drivers of TME heterogeneity51. Previous studies found a decrease of Tregs and a trend towards higher cytolytic activity in tumors after NACT12 as well as increased MHC class I expression, antigen presentation, T cell infiltration and PD-L1 expression in preclinical models52. Using ConsensusTME, we observed an increase of cytotoxic immunogenic activity after NACT in matched tumor samples but not in site-unmatched samples from the same patient. These data were supported by our preclinical findings that NK cells become more abundant after cisplatin treatment in ovarian cancer models. Employing TCRseq, we found a significant increase in T cells and TCR clonality in matched samples, but no significant difference was detected in unmatched pairs. Comparing post-NACT site-matched and site-unmatched samples indicated that the observed change in TCR clonal expansions was driven by chemotherapy independent of potential effects of biopsy itself (Supplementary Note). Finally, we found an increased number of shared TCRs between patients after chemotherapy compared to pre-treatment, which suggests chemotherapy may induce or unmask preexisting common (neo)antigens in the patients.
Disentangling the actual mechanisms using human tumor samples represents a challenge since tissue samples are limited, inter-patient variability is prominent and mechanistic experimental validation is prohibitive. Given these constraints, this study is descriptive in nature and relies heavily on observations derived by independent studies using mouse tumor models.
The present study shows that the TME of HGSOC is intrinsically heterogeneous within patients and within tumors, posing an important barrier for the successful application of therapies that target the TME, like checkpoint blockade immunotherapy. The induced immunogenicity following NACT was only unmasked after taking into account the TME heterogeneity, which acts as a confounding variable. Despite high rates of response to initial treatment, HGSOC has a high recurrence rate and has yet to show significant response to available immunotherapeutic agents. Exploring new combination therapies and novel therapeutic targets based on a greater understanding of the TME has the potential to change the current paradigm of treatment and improve clinical outcomes in this disease.
METHODS
Patients.
All study participants were patients at Memorial Sloan Kettering Cancer Center (MSKCC) and had stage IIIC or IV high grade serous ovarian cancer as assessed by a pathologist specialized in gynecologic malignancies. Patients signed written consent to Institutional Review Board (IRB)-approved protocols at MSKCC, which was compliant with the Health Insurance Portability and Accountability Act (HIPAA).
Treatment-naïve cohort.
For the treatment-naive cohort, 25 patients were consented to the study between August 2014 and March 2016. Out of these patients, 17 were excluded as they either (i) withdrew from the study (n = 3); (ii) the final pathology was not HGSOC (n = 5); (iii) patients had disease progression upon review of study imaging and underwent neoadjuvant chemotherapy instead of primary cytoreductive surgery (n = 5); (iv) inadequate image-guided tissue sampling due to friable tissue (n = 2); (v) research imaging studies not performed due to patient cancellation (n = 2). The final study population consisted of 10 patients with histopathologically-confirmed diagnosis of HGSOC (Supplementary Table 1a,b). Each patient underwent multi-parametric MRI (mpMRI) of the abdomen and pelvis and whole-body 18F-FDG PET/CT within 7 days immediately preceding the primary cytoreductive surgery, as previously described. All tissue samples were obtained based on imaging habitats. Germline BRCA1/2 mutation status was obtained from clinical data.
Neoadjuvant chemotherapy cohort.
A previously established institutional database identified 152 patients with HGSOC who underwent neoadjuvant chemotherapy between 2008 and 2013. Of these, 149 went on to interval debulking surgery, 48 had adequate pre- and post-treatment formalin-fixed paraffin-embedded tissue samples available. All pre-treatment specimens were obtained either through core biopsy or laparoscopic biopsy, and all post-treatment specimens were obtained at the time of laparotomy for interval debulking surgery. Choice of chemotherapy was at the clinician’s discretion; all patients in the cohort received a platinum and taxane based regimen (Supplementary Table 5a–c). Forty paired samples yielded data for analysis, 17 were site-matched while 23 were site-unmatched. Gene expression and TCRseq data were generated for 28 and 37 pairs, respectively (Supplementary Table 5b). Samples with very low TCR sequences (n = 5 samples, 10 pairs) were not included in the downstream analyses as the confidence of TCR clonality is low.
Image acquisition, custom 3D molds and habitat-guided sampling.
Imaging habitats were defined based on mpMRI and 18F-FDG PET/CT derived quantitative parameters (Supplementary Note). To establish coherence across patients (i.e. to label each cluster with the α, β, and γ Greek letters, such that across patients clusters would have similar imaging features), the intra-cluster distance was calculated for each cluster. For each patient, custom made 3 dimensional (3D) molds13 and habitat-guided specimen samples were performed (Supplementary Note).
Immunofluorescence and immunohistochemistry.
The immunofluorescence was performed at the Molecular Cytology Core Facility of Memorial Sloan Kettering Cancer Center using Discovery XT processor (Ventana Medical Systems). The tissue sections were deparaffinized with EZPrep buffer (Ventana Medical Systems), antigen retrieval was performed with CC1 buffer (Ventana Medical Systems). Sections were blocked for 30 min with Background Buster solution (Innovex), followed by avidin-biotin blocking for 8 min (Ventana Medical Systems). Multiplex immunofluorescence stainings were performed as previously described53 (see Supplementary Note). Stained slides were digitized using Pannoramic Flash 250 (3DHistech, Hungary) using 20x/0.8NA objective. Regions of interest were drawn on the scanned images using Pannoramic Viewer (3DHistech, Hungary) and exported into tiff images. ImageJ/FIJI was used to segment DAPI-stained nuclei and count the cells with positive signal. Ki67 was quantified according to the recommendations for breast cancer54, where the percentage of positively stained nuclei is quantified among the total number of malignant cells as previously described13.
Nucleic acid isolation and quantification.
Frozen sections from the tumor and normal tissues were stained with nuclear fast red and microdissected using a sterile needle under a stereomicroscope (Olympus SZ61), to enrich for tumor cells and that the normal tissue was devoid of any neoplastic cells, and subjected to DNA extraction using the DNeasy Tissue and Blood kit (Qiagen), as previously described55. Following review of the H&E slides by a gynecologic pathologist, RNA was extracted from tumor tissues/ sections, and microdissection performed if required, using the RNeasy (Qiagen) assay. DNA of microdissected tumor and normal samples was subjected to whole-exome sequencing at MSKCC’s Integrated Genomics Operation (IGO) on a HiSeq 4000 exome capture Agilent SureSelect V4, as previously described13,56, and RNA to the human Affymetrix Clariom D Pico assay (Thermo Fisher Scientific). For WES data, we obtained a median sequence coverage of 230.57 (range 169.42-307.68) of 47 samples from 10 patients with treatment-naive multi-site HGSOC along with 10 normal samples with a median sequence coverage 121.67 (range 81.69-154.48).
T-cell receptor sequencing.
High-throughput in situ sequencing of the T cell receptors present in the samples and blood of the patient was performed using the immunoSEQ assay platform (Adaptive Biotechnologies).
Cell lines, mouse experiments, and flow cytometry.
Cell lines (ID8 and UPK10), mouse experiments and flow cytometry were performed as described in the Supplementary Note.
Treatment-naive gene expression.
RNA expression was assessed using the human Affymetrix Clariom D Pico assay. Arrays were analyzed using the SST-RMA algorithm in the Affymetrix Expression Console Software. Expression was determined by using the Affymetrix Transcriptome Analysis Console. Locally weighted scatterplot smoothing (LOESS) normalization across samples was implemented using the affy R package version. 1.58.057. Tumor cellularity and total immune component in the tumor samples were analyzed using the ESTIMATE algorithm method version 1.0.1316 on the gene expression data, in R version 3.5.0. The t-distributed Stochastic Neighbor Embedding (t-SNE) and principal component analysis dimensionality reduction methods were implemented in python version 3.6.5using the sklearn version 0.19.1 package58.
Single-sample gene set enrichment.
Single-sample gene set enrichment analysis59, a modification of standard GSEA60, was performed on RNA measurements for each sample using the GSVA package version 1.28.014 in R version 3.5.0. Normalized enrichment scores were generated for the hallmark gene sets15, immune and stromal signatures16, TME cell gene sets obtained from previous publications61,62, as well as the ConsensusTME gene sets (Supplementary Fig. 3a). Hallmark gene sets were obtained from MSigDB database version 6.163.
Hallmarks PCA-Factors map two-stage cluster bootstrap inference.
We used a two-stage non-parametric cluster bootstrap with 10,000 replicates to evaluate the significance of differences between the means of the loadings of defined Hallmark classes (Oncogenic, Immune, Stromal, Stress, Other) on the PCA dimensions of interest (Supplementary Note).
Tumor cellularity differential expression.
Tumor samples from the treatment-naive cohort were divided into high and low tumor cellularity classes taking as a cutoff the median of tumor cellularity calculated for the tumor samples using TITAN17. Then a differential expression analysis, taking patient dependency into account, was performed using the R packages limma_3.36.164 and Biobase_2.40.065. Gene ontology analysis of significantly up- or downregulated genes was performed using the Gene Ontology Consortium66,67 web server selecting only biological processes (http://www.geneontology.org/). Fisher’s exact test FDR P-value corrections as calculated by the Benjamini Hochberg procedure were calculated for this analysis.
ssGSEA of differential expression.
Further, the t-statistic for each gene was retrieved and the list of genes with their associated t-statistic was used to calculate Hallmark and ConsensusTME normalized enrichment scores (NES) through ssGSEA. Hallmark gene sets’ NES were normalized by taking the exponential function. ConsensusTME gene sets’ NES approached normality by taking the natural logarithm. Modified z-score was employed to detect outliers in the hallmarks and ConsensusTME NES independently, as the modified z-score uses the median and the median absolute deviation (MAD) to robustly measure central tendency and dispersion in small data sets68.
T cell infiltration across cases, sites, and habitats.
A hierarchical-random mixed effects model analysis was performed to evaluate if there were significant differences in the variation (i.e. heterogeneity) of T cell infiltration subsets between patients, sites within patients, and habitats within tumors (Supplementary Note).
TME cell estimation.
Cell estimation methods were used to estimate levels of non-cancerous cells in the TME. The methods employed were CIBERSORT69, MCP-counter70, TIMER71, xCellL72, as well as gene sets collected from two previous publications61,62. CIBERSORT analysis was performed using the CIBERSORT R implementation version 1.04.MCP-counter analysis was performed using the R implementation version 1.1.0. The TIMER web server (https://cistrome.shinyapps.io/timer/) was used for deconvolution of TME cells73. The xCell web server version 1.1 (http://xcell.ucsf.edu/) was used for deconvolution of TME cells. For the Bindea et al. and Davoli et al. gene sets, standard ssGSEA analysis was performed as previously described.
T cell subsets immunofluorescent staining benchmark.
We correlated the CD8, CD4, Tregs infiltration counts with the estimation scores generated by CIBERSORT, MCP-counter, Bindea et al., Danaher et al., Davoli et al., TIMER, xCell, and the ConsensusTME scores. For the immune score comparison, all the genes used for the estimation for each method were aggregated together into one single gene set per method except for CIBERSORT. CIBERSORT deconvolution −log10(P-values) were used as a metric for immune score comparison. CD8, CD4, and Treg counts from IF data were summed and used for the comparison. Because the methods have different scoring systems and ranges, we standardized (z-score) the scores to be able to compare the results across methods together. For each tumor, multiple IF-stained sections were quantified for tumor infiltrating lymphocytes (TILs), and we correlated all the regions quantified with the estimation scores of each tumor, explaining the vertical patterns observed in Figure 3a. Kendall’s rank correlation was performed for each comparison and FDR P-value correction was applied.
DNA sequencing alignment and copy-number inference.
We initially aligned raw sequence reads from the whole exome sequencing (WES) to the reference genome GRCh37 (hg19) using the Burrows-Wheeler Aligner (BWA 0.7.15)74. Next, we performed local realignment, duplicate read removal and base quality score recalibration using the Genome Analysis Toolkit (GATK 3.7)75. To quantify copy-number alterations (CNA), we first assessed read depth of the aligned WES data captured at targeted exome regions of the genome (SureSelect v4 S03723314). We then fitted a mixture model using TITAN v1.19.117 to pairs of tumor and normal read depth, taking into account estimates of tumor ploidy, cellularity, and clonality. We used the TITAN Snakemake pipeline with a depth-correction method from ichorCNA76, binSize = 10,000, alphaK = 2,500, alphaR = 2,500, normalInit = 0.5, and all other arguments at default values. We fitted multiple models with fixed numbers of subclones ranging 1-5 and initial average ploidy 2-3, selecting the best fit according to maximum likelihood. In addition to CNA, TITAN estimates loss of heterozygosity (LOH); we used HapMap 3.3 as a reference for common human genetic variants. The resulting copy-number events were mapped to genome annotations from TxDb.Hsapiens.UCSC.hg19.knownGene using the GenomicRanges Bioconductor package. Absolute copy-numbers were assessed at the gene level with a Euclidean distance metric to hierarchically cluster tumor samples. In parallel, we compared tumor cellularity and ploidy estimates with results from ASCAT26 run on the same tumor-normal pairs. Further supporting the agreement between TITAN and other methods for CNA analysis, a prior report found significant correlation between TITAN and ABSOLUTE for estimating ploidy and tumor cellularity using both WES and whole-genome sequencing data (WGS)76.
DNA copy-number signatures.
To assess CNA signatures, we evaluated seven genomic signatures constructed from features such as breakpoint counts, change in copy number, segment size, and chains of oscillating copy numbers, which had previously been detected in ovarian cancer using non-negative matrix factorization32. CopywriteR was used to adjust read counts in exome capture regions to match the depths seen in off target regions. These data were then processed as previously described32 to obtain segmented relative copy number. This was transformed to absolute copy number using TITAN purity and ploidy estimates. FACETS was also used to estimate purity and ploidy77. Only samples that agreed between FACETS and TITAN ploidy/purity estimates were retained for further analysis (difference in ploidy < 1.5 and difference in purity < 0.1). In addition, the TITAN fits for these discrepant samples were manually investigated and some included nonetheless, based on reasons of parsimony with regards to genome duplication and copy-number profiles observed in other sites from the same patient. Copy number signature exposures were computed using the signature definitions provided by Macintyre et al. 2018 and the YAPSA package.
To account for the compositional nature of the copy-number signatures (they sum to one), we performed the isometric log ratio (ILR) transform in a sample-wise manner; the signature exposure fraction was compared to the geometric mean of all other parts of the composition by a log-ratio transformation33, followed by linear regression with tumor cellularity as the target variable for visualization. For determining statistical significance, we used a partial correlation using Kendall’s tau, to take into consideration any between-patient correlations.
Copy-number and tumor cellularity associations.
To validate CNA-based (TITAN) tumor cellularity estimates, we compared it with the mRNA-based tumor cellularity estimates and to tumor infiltrating leukocyte (TIL) counts from immunofluorescence measurements of CD8, CD4, and Foxp3, averaged over multiple independent slides from the same tumor site. At the gene level, we used Spearman’s correlation to detect association between absolute copy numbers and gene expression (CNA-mRNA) and between tumor cellularity and gene expression. To be robust against deviation to bivariate normality and linear relationship, in this analysis (related to Fig. 4e and Supplementary Fig. 4m) Spearman rank correlation method was chosen. Based on the ranking of correlation coefficients, we carried out gene set enrichment analysis (GSEA 3.0)60,78 of hallmark gene sets with 10,000 random permutations as background.
Mutation calling.
Somatic mutation calls were performed as previously described13,56,79. Briefly, somatic single nucleotide variants (SNVs) were called using MuTect (1.1.7)80 and small insertions and deletions (indels) were identified using Strelka (1.0.15)81, VarScan2 (2.3.7)82, Lancet (1.0.0)83,84 and Scalpel (0.5.3)84, and further curated by manual inspection. SNVs and indels outside of target regions were filtered out, as were SNVs and indels for which the variant allele fraction (VAF) in the tumor sample was <5 times that of the paired normal VAF as previously described84. Finally, SNVs and indels found at >5% global minor allele frequency in dbSNP (build 137) and >5% global allele frequency in ExAC (0.3.1) were discarded. We separately also performed manual inspection of genome alignment at the TP53 loci, which, for a single patient, contained a frameshift deletion filtered by the mutation caller. Mutations and copy-numbers from selected oncogenes and tumor suppressors were visualized using oncoprint from the ComplexHeatmap R package.
SNV and tumor cellularity association.
Using the called SNVs, we considered mutations other than silent mutations as functionally relevant. A functional mutation enrichment score per gene set was derived by dividing the number of functional SNVs by the number of genes in the gene set (same results are obtained when raw functional SNV counts are used, but the normalized version is used for visualization purposes). Using a multiple linear regression model approach, we tested for association between tumor cellularity and functional mutations in pathways. Since sample tumor cellularity can affect the frequency of mutations called, we accounted for this using sample mutation load as a covariate in the linear model. Similarly, samples from the same patient are likely to share many mutations, therefore patient dependency was also incorporated as a covariate in the linear model. We evaluated whether functional SNV enrichment and WES-derived tumor cellularity (TITAN) were associated for each of the 52 gene sets analyzed in this study. Benjamini, Hochberg, and Yekutieli multiple test correction was calculated for all the 52 tests. Further, Polymorphism Phenotyping v2 (PolyPhen-2)34 was used to evaluate potential damaging missense mutations detected in the Wnt signaling pathway (Supplementary Table 4b).
HLA mutation calling.
To detect mutations in the polymorphic regions of HLA loci we utilized the polymorphic loci resolver (POLYSOLVER v4) algorithm29. This required us to initially perform patient specific HLA typing for the three major MHC class I regions (HLA-A, −B and −C) using the previously aligned WES of the normal samples for each patient. Once inferred, we carried out POLYSOLVER-based mutation detection incorporating Mutect80 and Strelka81 for calling point mutations and indels, respectively, using the default read filtering criteria for the pipeline29.
Paired volcano plots.
For each of the 52 hallmark and 18 ConsensusTME gene sets, paired comparisons before and after NACT were performed. Equality of variance (Bartlett’s test or Levene’s test) and normality (Shapiro test, Kolmogorov-Smirnov test, and D-Agostino-Pearson’s test) assumptions were checked to select the corresponding paired test (Paired t-test, Welch’s t-test, or Wilcoxon signed-rank test).
Unpaired volcano plots.
For each of the 18 ConsensusTME gene sets, unpaired comparisons between matched and unmatched NACT samples were conducted. Equality of variance (Bartlett’s test or Levene’s test) and normality (Shapiro test, Kolmogorov-Smirnov test, and D-Agostino-Pearson’s test) assumptions were checked to select the corresponding test (Independent t-test, Welch’s t-test, or Mann-Whitney rank test). The analysis was performed under python 3.6.5 and scipy 1.1.0 (http://www.scipy.org/) ecosystem85.
Multivariate analyses.
Multiple linear regression analysis was performed to evaluate the difference of normalized enrichment scores before and after NACT of biologically related cell types (stromal, myeloid, lymphoid, and cytotoxic) using R version 3.5.0.
Logistic regression and Hotelling’s T2 test (multivariate t test) were performed as a sensitivity analysis on cytotoxic cells (NK and CD8 T cells) since the model comprising NK cells + Cytotoxic genes sets was found as significantly different between pre- and post-NACT in the multiple linear regression analysis. Logistic regression was performed using the glm function with the binomial distribution (Supplementary Fig. 6b). Chi-squared test was employed to test significance against the null hypothesis. Multivariate two-sample Hotelling’s T2 test was performed to compare differences of CD8, NK, and cytotoxic ConsensusTME gene sets NES between pre- and post-NACT tumors.
TCR sequencing analysis.
Analysis of the sequences was performed on the immunoSEQ ANALYZER 3.0 (Adaptive biotechnologies). T cell counts and TCR clonality were retrieved for statistical comparisons. T cell counts are derived from quantitative immunoSequencing of the TCRB loci, in which the internal controls allow precise quantitation of sequence counts based on reads. Nucleated cell counts are determined by sequencing housekeeping genes. The fraction of T cells is determined by dividing the T cell count by the nucleated cell counts. Values for TCR productive clonality range from 0 to 1. Values near 1 represent samples with one or a few predominant rearrangements (monoclonal or oligoclonal samples) dominating the observed repertoire. TCR productive clonality values near 0 represent more polyclonal samples. TCR productive clonality is calculated by normalizing productive entropy using the total number of unique productive rearrangements and subtracting the result from 1.
Analyses shown in Figure 7b–d were performed using the TCR amino acid sequences; however, the same conclusions were obtained with the DNA sequences. One-way chi-square test was conducted with expected frequencies set as the pre-NACT distribution and the observed frequencies set as the post-NACT distribution. For comparison between shared, pre- and post-NACT unique TCRs the Friedman ranking test—where the hypothesis that in a set of k dependent samples groups (where k ≥ 2), at least two of the groups represent populations with different median values—was calculated86,87. To detect which groups were different, the Nemenyi post-hoc test using the pivot quantities obtained by the Friedman ranking test was calculated. The Nemenyi post-hoc test evaluates the hypothesis that the ranking of each pair of groups are different88.
LASSO regression.
Least absolute shrinkage and selection operator (LASSO) regression analysis was performed using the glmnet R package89. Post-selection inference was conducted with the selectiveInference R package90,91. Hallmark and ConsensusTME cell type NES of pre-NACT samples were used together and independently as explanatory variables, and the log2 of the ratio post/pre NACT TCR clonality as response variable.
Normality and homoscedasticity tests.
All statistical tests presented were selected according to whether normality and homoscedasticity assumptions were met. To test normality the Shapiro test and Kolmogorov-Smirnov test were conducted. To test equality of variance Bartlett’s test or Levene’s test were conducted according to normality of the data. Shapiro test with P-value < 0.01 as a threshold and the Breusch-Pagan test to test equality of variance were used in Figure 4c and Supplementary Figure 4b,c.
Supplementary Material
ACKNOWLEDGMENTS
We thank Dana Pe’er for her support to A.J.-S. in finalizing this project. We thank Jose Conejo-Garcia for providing the UPK10 cell line. We acknowledge Tony Wu for his insightful comments on the manuscript. A.S. was supported by grants from the Marsha Rivkin Organization, Society of Memorial Sloan Kettering, Translational and Integrative Medicine Research Fund (MSKCC), Kaleidoscope of Hope. This work has been supported in part by a Kaleidoscope of Hope grant (H.A.V. and B.W.) and a MSK Cancer Center Support Grant of the National Institutes of Health/National Cancer Institute (P30 CA008748). D.Z. received funding from the Ovarian Cancer Research Alliance Liz Tilberis Award. L.M.G was supported by a Wellcome Trust grant through the Mathematical Genomics and Medicine programme. M.L.M. was supported by Cancer Research UK core grant (C14303/A17197), Brown Performance Innovation in Cancer Informatics Discovery Award (BD523775), and the Target Ovarian Cancer Translational Project Grant (Cambridge-MM18). J.D.B. was supported by Cancer Research UK core grant number A22905. J.D.B. and E.S were supported by the Mark Foundation. A.J.-S. was supported by a doctoral fellowship from the Cancer Research UK Cambridge Institute and the Mexican National Council of Science and Technology (CONACyT). A.J.-S. research was funded in part through the NIH/NCI Cancer Center Support Grant P30 CA008748. J.S.R.-F. is funded in part by a Breast Cancer Research Foundation grant and by the Department of Defense Congressionally Directed Medical Research Programs. D.M. was supported by joint EMBL-EBI & NIHR Cambridge Biomedical Research Centre Postdoctoral (EBPOD) program. F.M. was supported by Cancer Research UK core grant (A19274). R.M.D is supported by a doctoral fellowship from the Cancer Research UK, Cambridge Institute. O.C. was supported by a doctoral fellowship from the University of Cambridge Harding Distinguished Postgraduate Scholars Programme. D.-L.C was supported by Cancer Research UK core grant (C14303/A17197). B.W. is funded in part by Breast Cancer Research Foundation and Cycle for Survival grants. G.M. would like to acknowledge the support of the University of Cambridge, Cancer Research UK and Hutchison Whampoa Limited. G.M. was funded by CRUK grants C14303/A17197, A19274 and A15973 and by the Instituto de Salud Carlos III (ISCIII), Spanish Ministry of Science and Innovation.
Footnotes
Publisher's Disclaimer: This Author Accepted Manuscript is a PDF file of an unedited peer-reviewed manuscript that has been accepted for publication but has not been copyedited or corrected. The official version of record that is published in the journal is kept up to date and so may therefore differ from this version.
Reporting Summary. Further information on research design is available in the Nature Research Reporting Summary linked to this article.
Ethical approval. All ethics and compliances required for this study have been obtained by the appropriate ethics and compliance regulations.
COMPETING INTERESTS
A.S. is a current employee of, and owns stock in, Merck. D.S.C. is on two medical advisory boards and invested in two surgical companies but none of those are related to this research. J.S.R.-F. is a paid consultant of Goldman Sachs Merchant Banking, Paige.AI and REPARE Therapeutics, and member of the scientific advisory board with paid honoraria of Paige.AI and Volition Rxand an ad-hoc member of the scientific advisory boards of Roche Tissue Diagnostics, Ventana, InVicro, Genentech, Novartis, GRAIL and Roche, outside the submitted work. D.Z. reports personal/consultancy fees from Merck, Synlogic Therapeutics, Biomed Valley Discoveries, Trieza Therapeutics, Tesaro and Agenus out of the scope of the submitted work. M.L.M. has received honoraria from GSK, but not related to this research. E.S. is a co-founder and shareholder of Cambridge AI Heath, consultant for Amazon and received honoraria from GSK, but none of these are related to this research. G.M. is founder and CTO of Pinpoint Oncology Ltd. A.J.-S. has owned and sold stocks while this work was in progress, none of which relates directly with this publication.
Data and code availability.
Data and software used for this work can be accessed at GitHub (https://github.com/cansysbio/HGSOC_TME_Heterogeneity). Requests for additional data and custom code should be directed to the corresponding author. The immunofluorescence images discussed in this study will be provided upon request to the corresponding author. Microarray data are available through the GEO database accession number GSE146965. Mutation data are available in Supplementary Table 4a. TITAN Copy Number segment data are available in Supplementary Table 4f. The TCR sequencing data discussed in this study will be provided upon request from the corresponding author.
REFERENCES
- 1.Kitamura T, Qian B-Z & Pollard JW Immune cell promotion of metastasis. Nat. Rev. Immunol 15, 73–86 (2015). [DOI] [PMC free article] [PubMed] [Google Scholar]
- 2.Janssen LME, Ramsay EE, Logsdon CD & Overwijk WW The immune system in cancer metastasis: friend or foe? Journal for ImmunoTherapy of Cancer 5, (2017). [DOI] [PMC free article] [PubMed] [Google Scholar]
- 3.Robinson DR et al. Integrative clinical genomics of metastatic cancer. Nature 548, 297–303 (2017). [DOI] [PMC free article] [PubMed] [Google Scholar]
- 4.Bowtell DD et al. Rethinking ovarian cancer II: reducing mortality from high-grade serous ovarian cancer. Nat. Rev. Cancer 15, 668–679 (2015). [DOI] [PMC free article] [PubMed] [Google Scholar]
- 5.Zhang AW et al. Interfaces of malignant and immunologic clonal dynamics in ovarian cancer. Cell 173, 1755–1769.e22 (2018). [DOI] [PubMed] [Google Scholar]
- 6.Sridharan V et al. Immune profiling of adenoid cystic carcinoma: PD-L2 expression and associations with tumor-infiltrating lymphocytes. Cancer Immunol. Res 4, 679–687 (2016). [DOI] [PubMed] [Google Scholar]
- 7.Jiménez-Sánchez A et al. Heterogeneous tumor-immune microenvironments among differentially growing metastases in an ovarian cancer patient. Cell 170, 927–938.e20 (2017). [DOI] [PMC free article] [PubMed] [Google Scholar]
- 8.Reuben A et al. Genomic and immune heterogeneity are associated with differential responses to therapy in melanoma. NPJ Genom. Med 2, 10 (2017). [DOI] [PMC free article] [PubMed] [Google Scholar]
- 9.Wang W et al. Effector T cells abrogate stroma-mediated chemoresistance in ovarian cancer. Cell 165, 1092–1105 (2016). [DOI] [PMC free article] [PubMed] [Google Scholar]
- 10.Zhang L et al. Intratumoral T cells, recurrence, and survival in epithelial ovarian cancer. N. Engl. J. Med 348, 203–213 (2003). [DOI] [PubMed] [Google Scholar]
- 11.Ovarian Tumor Tissue Analysis (OTTA) Consortium et al. Dose-response association of CD8+ tumor-infiltrating lymphocytes and survival time in high-grade serous ovarian cancer. JAMA Oncol 3, e173290 (2017). [DOI] [PMC free article] [PubMed] [Google Scholar]
- 12.Böhm S et al. Neoadjuvant chemotherapy modulates the immune microenvironment in metastases of tubo-ovarian high-grade serous carcinoma. Clin. Cancer Res 22, 3025–3036 (2016). [DOI] [PubMed] [Google Scholar]
- 13.Weigelt B et al. Radiogenomics analysis of intratumor heterogeneity in a patient with high-grade serous ovarian cancer. JCO Precision Oncology 1–9 (2019). [DOI] [PMC free article] [PubMed] [Google Scholar]
- 14.Hänzelmann S, Castelo R & Guinney J GSVA: gene set variation analysis for microarray and RNA-seq data. BMC Bioinformatics 14, 7 (2013). [DOI] [PMC free article] [PubMed] [Google Scholar]
- 15.Liberzon A et al. The Molecular Signatures Database (MsigDB) hallmark gene set collection. Cell Systems 1,417–425 (2015). [DOI] [PMC free article] [PubMed] [Google Scholar]
- 16.Yoshihara K et al. Inferring tumour purity and stromal and immune cell admixture from expression data. Nat. Commun 4, 2612 (2013). [DOI] [PMC free article] [PubMed] [Google Scholar]
- 17.Ha G et al. TITAN: inference of copy number architectures in clonal cell populations from tumor whole-genome sequence data. Genome Res. 24, 1881–1893 (2014). [DOI] [PMC free article] [PubMed] [Google Scholar]
- 18.Cancer Genome Atlas Research Network. Integrated genomic analyses of ovarian carcinoma. Nature 474, 609–615 (2011). [DOI] [PMC free article] [PubMed] [Google Scholar]
- 19.Jiménez-Sánchez A, Cast O & Miller ML Comprehensive benchmarking and integration of tumour microenvironment cell estimation methods. Cancer Res. 79, 6238–6246 (2019). [DOI] [PubMed] [Google Scholar]
- 20.Stevens JR, Herrick JS, Wolff RK & Slattery ML Power in pairs: assessing the statistical value of paired samples in tests for differential expression. BMC Genomics 19, 953 (2018). [DOI] [PMC free article] [PubMed] [Google Scholar]
- 21.Kortlever RM et al. Myc cooperates with Ras by programming inflammation and immune suppression. Cell 171, 1301–1315.e14 (2017). [DOI] [PMC free article] [PubMed] [Google Scholar]
- 22.Topper MJ et al. Epigenetic therapy ties MYC depletion to reversing immune evasion and treating lung cancer. Cell 171, 1284–1300.e21 (2017). [DOI] [PMC free article] [PubMed] [Google Scholar]
- 23.Spranger S, Bao R & Gajewski TF Melanoma-intrinsic β-catenin signalling prevents anti-tumour immunity. Nature 523, 231–235 (2015). [DOI] [PubMed] [Google Scholar]
- 24.Spranger S, Bao R & Gajewski T Melanoma-intrinsic β-catenin signaling prevents T cell infiltration and anti-tumor immunity. Journal for ImmunoTherapy of Cancer 2, O15 (2014). [Google Scholar]
- 25.Luke JJ, Bao R, Sweis RF, Spranger S & Gajewski TF WNT/β-catenin pathway activation correlates with immune exclusion across human cancers. Clin. Cancer Res 25, 3074–3083 (2019). [DOI] [PMC free article] [PubMed] [Google Scholar]
- 26.Van Loo P et al. Allele-specific copy number analysis of tumors. Proc. Natl. Acad. Sci. USA 107, 16910–16915 (2010). [DOI] [PMC free article] [PubMed] [Google Scholar]
- 27.Ahmed AA et al. Driver mutations in TP53 are ubiquitous in high grade serous carcinoma of the ovary. J. Pathol 221,49–56 (2010). [DOI] [PMC free article] [PubMed] [Google Scholar]
- 28.Downward J Targeting RAS signalling pathways in cancer therapy. Nat. Rev. Cancer 3, 11–22 (2003). [DOI] [PubMed] [Google Scholar]
- 29.Shukla SA et al. Comprehensive analysis of cancer-associated somatic mutations in class I HLA genes. Nat. Biotechnol 33, 1152–1158 (2015). [DOI] [PMC free article] [PubMed] [Google Scholar]
- 30.Wang YK et al. Genomic consequences of aberrant DNA repair mechanisms stratify ovarian cancer histotypes. Nat. Genet 49, 856–865 (2017). [DOI] [PubMed] [Google Scholar]
- 31.Patch A-M et al. Whole-genome characterization of chemoresistant ovarian cancer. Nature 521, 489–494 (2015). [DOI] [PubMed] [Google Scholar]
- 32.Macintyre G et al. Copy number signatures and mutational processes in ovarian carcinoma. Nat. Genet 50, 1262–1270 (2018). [DOI] [PMC free article] [PubMed] [Google Scholar]
- 33.Egozcue JJ, Pawlowsky-Glahn V, Mateu-Figueras G & Barcelo-Vidal C Isometric Logratio Transformations for Compositional Data Analysis. Math. Geol 35, 279–300 (2003). [Google Scholar]
- 34.Adzhubei IA et al. A method and server for predicting damaging missense mutations. Nat. Methods 7, 248 (2010). [DOI] [PMC free article] [PubMed] [Google Scholar]
- 35.Niida A et al. DKK1, a negative regulator of Wnt signaling, is a target of the beta-catenin/TCF pathway. Oncogene 23, 8520–8526 (2004). [DOI] [PubMed] [Google Scholar]
- 36.Saito T et al. PTCH1 mutation is a frequent event in oesophageal basaloid squamous cell carcinoma. Mutagenesis 30, 297–301 (2015). [DOI] [PubMed] [Google Scholar]
- 37.Larraguibel J et al. Wnt ligand-dependent activation of the negative feedback regulator Nkd1. Mol. Biol. Cell 26, 2375–2384 (2015). [DOI] [PMC free article] [PubMed] [Google Scholar]
- 38.Scarlett UK et al. Ovarian cancer progression is controlled by phenotypic changes in dendritic cells. J. Exp. Med 209, 495–506 (2012). [DOI] [PMC free article] [PubMed] [Google Scholar]
- 39.Roby KF et al. Development of a syngeneic mouse model for events related to ovarian cancer. Carcinogenesis 21, 585–591 (2000). [DOI] [PubMed] [Google Scholar]
- 40.Pielou EC Species-diversity and pattern-diversity in the study of ecological succession. J. Theor. Biol 10, 370–383 (1966). [DOI] [PubMed] [Google Scholar]
- 41.Kirsch I, Vignali M & Robins H T-cell receptor profiling in cancer. Mol. Oncol 9, 2063–2070 (2015). [DOI] [PMC free article] [PubMed] [Google Scholar]
- 42.Johnson BE et al. Mutational analysis reveals the origin and therapy-driven evolution of recurrent glioma. Science 343, 189–193 (2014). [DOI] [PMC free article] [PubMed] [Google Scholar]
- 43.Yates LR et al. Subclonal diversification of primary breast cancer revealed by multiregion sequencing. Nat. Med 21, 751–759 (2015). [DOI] [PMC free article] [PubMed] [Google Scholar]
- 44.McPherson A et al. Divergent modes of clonal spread and intraperitoneal mixing in high-grade serous ovarian cancer. Nat. Genet 48, 758–767 (2016). [DOI] [PubMed] [Google Scholar]
- 45.Stanske M et al. Dynamics of the intratumoral immune response during progression of high-grade serous ovarian cancer. Neoplasia 20, 280–288 (2018). [DOI] [PMC free article] [PubMed] [Google Scholar]
- 46.Sharma P, Hu-Lieskovan S, Wargo JA & Ribas A Primary, adaptive, and acquired resistance to cancer immunotherapy. Cell 168, 707–723 (2017). [DOI] [PMC free article] [PubMed] [Google Scholar]
- 47.Hirata E et al. Intravital imaging reveals how BRAF inhibition generates drug-tolerant microenvironments with high Integrin β1/FAK signaling. Cancer Cell 27, 574–588 (2015). [DOI] [PMC free article] [PubMed] [Google Scholar]
- 48.Casey SC et al. MYC regulates the antitumor immune response through CD47 and PD-L1. Science 352, 227–231 (2016). [DOI] [PMC free article] [PubMed] [Google Scholar]
- 49.Spranger S et al. Density of immunogenic antigens does not explain the presence or absence of the T-cell–inflamed tumor microenvironment in melanoma. Proc.Natl. Acad. Sci. USA 113, E7759–E7768 (2016). [DOI] [PMC free article] [PubMed] [Google Scholar]
- 50.Spranger S, Dai D, Horton B & Gajewski TF Tumor-residing Batf3 dendritic cells are required for effector T cell trafficking and adoptive T cell therapy. Cancer Cell 31, 711–723.e4 (2017). [DOI] [PMC free article] [PubMed] [Google Scholar]
- 51.Patel SA & Minn AJ Combination cancer therapy with immune checkpoint blockade: mechanisms and strategies. Immunity 48, 417–433 (2018). [DOI] [PMC free article] [PubMed] [Google Scholar]
- 52.Grabosch S et al. Cisplatin-induced immune modulation in ovarian cancer mouse models with distinct inflammation profiles. Oncogene 38, 2380–2393 (2019). [DOI] [PMC free article] [PubMed] [Google Scholar]
- 53.Yarilin D et al. Machine-based method for multiplex in situ molecular characterization of tissues by immunofluorescence detection. Sci. Rep 5, 9534 (2015). [DOI] [PMC free article] [PubMed] [Google Scholar]
- 54.Dowsett M et al. Assessment of Ki67 in breast cancer: recommendations from the International Ki67 in Breast Cancer working group. J. Natl. Cancer Inst 103, 1656–1664 (2011). [DOI] [PMC free article] [PubMed] [Google Scholar]
- 55.Martelotto LG et al. Genomic landscape of adenoid cystic carcinoma of the breast. J. Pathol 237, 179–189 (2015). [DOI] [PMC free article] [PubMed] [Google Scholar]
- 56.Pareja F et al. The genomic landscape of mucinous breast cancer. J. Natl. Cancer Inst (2019) doi: 10.1093/jnci/djy216. [DOI] [PMC free article] [PubMed] [Google Scholar]
- 57.Gautier L, Cope L, Bolstad BM & Irizarry RA affy—analysis of Affymetrix GeneChip data at the probe level. Bioinformatics 20, 307–315 (2004). [DOI] [PubMed] [Google Scholar]
- 58.Pedregosa F Scikit-learn: machine learning in Python. J. Mach. Learn. Res 12, 2825–2830 (2011). [Google Scholar]
- 59.Barbie DA et al. Systematic RNA interference reveals that oncogenic KRAS-driven cancers require TBK1. Nature 462, 108–112 (2009). [DOI] [PMC free article] [PubMed] [Google Scholar]
- 60.Subramanian A et al. Gene set enrichment analysis: a knowledge-based approach for interpreting genome-wide expression profiles. Proc. Natl. Acad. Sci. USA 102, 15545–15550 (2005). [DOI] [PMC free article] [PubMed] [Google Scholar]
- 61.Bindea G et al. Spatiotemporal dynamics of intratumoral immune cells reveal the immune landscape in human cancer. Immunity 39, 782–795 (2013). [DOI] [PubMed] [Google Scholar]
- 62.Davoli T, Uno H, Wooten EC & Elledge SJ Tumor aneuploidy correlates with markers of immune evasion and with reduced response to immunotherapy. Science 355, eaaf8399 (2017). [DOI] [PMC free article] [PubMed] [Google Scholar]
- 63.Liberzon A et al. Molecular signatures database (MSigDB) 3.0. Bioinformatics 27, 1739–1740 (2011). [DOI] [PMC free article] [PubMed] [Google Scholar]
- 64.Ritchie ME et al. limma powers differential expression analyses for RNA-sequencing and microarray studies. Nucleic Acids Res. 43, e47 (2015). [DOI] [PMC free article] [PubMed] [Google Scholar]
- 65.Huber W et al. Orchestrating high-throughput genomic analysis with Bioconductor. Nat. Methods 12, 115–121 (2015). [DOI] [PMC free article] [PubMed] [Google Scholar]
- 66.Ashburner M et al. Gene ontology: tool for the unification of biology. Nat. Genet 25, 25–29 (2000). [DOI] [PMC free article] [PubMed] [Google Scholar]
- 67.The Gene Ontology Consortium. Expansion of the Gene Ontology knowledgebase and resources. Nucleic Acids Res. 45, D331–D338 (2017). [DOI] [PMC free article] [PubMed] [Google Scholar]
- 68.Iglewicz B & Hoaglin DC How to Detect and Handle Outliers. (Asq Press, 1993). [Google Scholar]
- 69.Newman AM et al. Robust enumeration of cell subsets from tissue expression profiles. Nat. Methods 12, 453–457 (2015). [DOI] [PMC free article] [PubMed] [Google Scholar]
- 70.Becht E et al. Estimating the population abundance of tissue-infiltrating immune and stromal cell populations using gene expression. Genome Biol. 17, 218 (2016). [DOI] [PMC free article] [PubMed] [Google Scholar]
- 71.Li B et al. Comprehensive analyses of tumor immunity: implications for cancer immunotherapy. Genome Biol. 17, 174 (2016). [DOI] [PMC free article] [PubMed] [Google Scholar]
- 72.Aran D, Hu Z & Butte AJ xCell: digitally portraying the tissue cellular heterogeneity landscape. Genome Biol. 18, 220 (2017). [DOI] [PMC free article] [PubMed] [Google Scholar]
- 73.Li T et al. TIMER: a web server for comprehensive analysis of tumor-infiltrating immune cells. Cancer Res. 77, e108–e110 (2017). [DOI] [PMC free article] [PubMed] [Google Scholar]
- 74.Li H & Durbin R Fast and accurate short read alignment with Burrows-Wheeler transform. Bioinformatics vol. 25 1754–1760 (2009). [DOI] [PMC free article] [PubMed] [Google Scholar]
- 75.McKenna A et al. The Genome Analysis Toolkit: a MapReduce framework for analyzing next-generation DNA sequencing data. Genome Res. 20, 1297–1303 (2010). [DOI] [PMC free article] [PubMed] [Google Scholar]
- 76.Adalsteinsson VA et al. Scalable whole-exome sequencing of cell-free DNA reveals high concordance with metastatic tumors. Nat. Commun 8, 1324 (2017). [DOI] [PMC free article] [PubMed] [Google Scholar]
- 77.Shen R & Seshan VE FACETS: allele-specific copy number and clonal heterogeneity analysis tool for high-throughput DNA sequencing. Nucleic Acids Res. 44, e131 (2016). [DOI] [PMC free article] [PubMed] [Google Scholar]
- 78.Mootha VK et al. PGC-1α-responsive genes involved in oxidative phosphorylation are coordinately downregulated in human diabetes. Nat. Genet 34, 267 (2003). [DOI] [PubMed] [Google Scholar]
- 79.Selenica P et al. Solid pseudopapillary neoplasms of the pancreas are dependent on the Wnt pathway. Mol. Oncol 13, 1684–1692 (2019). [DOI] [PMC free article] [PubMed] [Google Scholar]
- 80.Cibulskis K et al. Sensitive detection of somatic point mutations in impure and heterogeneous cancer samples. Nat. Biotechnol 31,213–219 (2013). [DOI] [PMC free article] [PubMed] [Google Scholar]
- 81.Saunders CT et al. Strelka: accurate somatic small-variant calling from sequenced tumor-normal sample pairs. Bioinformatics 28, 1811–1817 (2012). [DOI] [PubMed] [Google Scholar]
- 82.Koboldt DC et al. VarScan 2: somatic mutation and copy number alteration discovery in cancer by exome sequencing. Genome Res. 22, 568–576 (2012). [DOI] [PMC free article] [PubMed] [Google Scholar]
- 83.Narzisi G et al. Genome-wide somatic variant calling using localized colored de Bruijn graphs. Commun. Biol 1,20 (2018). [DOI] [PMC free article] [PubMed] [Google Scholar]
- 84.Narzisi G et al. Accurate de novo and transmitted indel detection in exome-capture data using microassembly. Nat. Methods 11, 1033–1036 (2014). [DOI] [PMC free article] [PubMed] [Google Scholar]
- 85.Oliphant TE Python for scientific computing. Comput. Sci. Eng 9, 10–20 (2007). [Google Scholar]
- 86.Friedman M The use of ranks to avoid the assumption of normality implicit in the analysis of variance. J. Am. Stat. Assoc 32, 675–701 (1937). [Google Scholar]
- 87.Sheskin DJ Handbook of Parametric and Nonparametric Statistical Procedures: Third Edition. (CRC Press, 2003). [Google Scholar]
- 88.Dunn OJ Multiple comparisons among means. J. Am. Stat. Assoc 56, 52–64 (1961). [Google Scholar]
- 89.Friedman J, Hastie T & Tibshirani R Regularization paths for generalized linear models via coordinate descent. J. Stat. Softw 33, 1–22 (2010). [PMC free article] [PubMed] [Google Scholar]
- 90.Lee JD, Sun DL, Sun Y & Taylor JE Exact post-selection inference, with application to the lasso. Ann. Stat 44, 907–927 (2016). [Google Scholar]
- 91.Taylor J & Tibshirani R Post-selection inference for L1-penalized likelihood models. arXiv [stat.ME] (2016). [DOI] [PMC free article] [PubMed] [Google Scholar]
Associated Data
This section collects any data citations, data availability statements, or supplementary materials included in this article.
Supplementary Materials
Data Availability Statement
Data and software used for this work can be accessed at GitHub (https://github.com/cansysbio/HGSOC_TME_Heterogeneity). Requests for additional data and custom code should be directed to the corresponding author. The immunofluorescence images discussed in this study will be provided upon request to the corresponding author. Microarray data are available through the GEO database accession number GSE146965. Mutation data are available in Supplementary Table 4a. TITAN Copy Number segment data are available in Supplementary Table 4f. The TCR sequencing data discussed in this study will be provided upon request from the corresponding author.