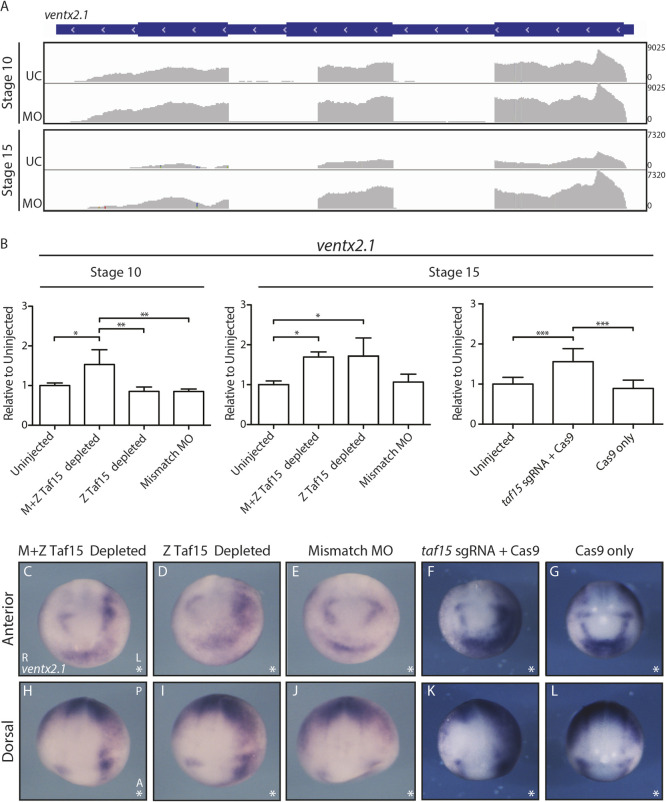
Fig. 7.
Taf15 depletion leads to increased and expanded ventx2.1 expression. (A) Visualization of ventx2.1 RNA-seq reads with IGV aligned with the gene model in blue. (B) qRT-PCR for ventx2.1 expression in stage-10 and -15 embryos treated as indicated on the x-axes; y-axes show expression relative to eef1a1 and normalized to uninjected embryos; n=9 individual embryos; Data are mean±s.d; *P<0.05; **P<0.005; ***P<0.001. All means were compared by one-way ANOVA followed by Tukey post-hoc analyses. All injections were into both cells of two-cell-stage embryos. (C-L) Representative whole-mount ISH of ventx2.1; asterisks indicate the injected sides. Images are representative of more than 12 embryos. All injections for downstream RNA ISH were into one cell of two-cell-stage embryos; the uninjected cell served as an internal control. A, anterior; L, left; MO, M+Z Taf15-depleting MO; P, posterior; R, right; UC, uninjected control.

