

Summary
Cerebral blood vessels supply oxygen and nutrients, remove metabolic waste, and play a critical role in maintaining brain homeostasis. Cerebrovasculature is composed of heterogeneous populations of brain vascular cells (BVCs). A major challenge in effective cerebrovascular transcriptional profiling is high-quality BVC procurement, permitting high sequencing depth. Here, we establish cell isolation procedures for glio-vascular cell-enriched single-cell RNA sequencing enabling unbiased characterization of BVC transcriptional heterogeneity. Our approach can be used to address vascular-specific contribution to brain diseases.
For complete details on the use and execution of this protocol, please refer to Yamazaki et al. (2021).
Subject areas: Cell isolation, Neuroscience, RNAseq, Single Cell
Graphical abstract
Highlights
-
•
Isolation of brain vascular enriched cells suitable for single-cell RNA sequencing
-
•
Validation of brain vascular cell enrichment in cell isolates
-
•
Confirmation of highly viable single cells after isolation
-
•
Protocol is adapted for adult mouse brain tissues
Cerebral blood vessels supply oxygen and nutrients, remove metabolic waste, and play a critical role in maintaining brain homeostasis. Cerebrovasculature is composed of heterogeneous populations of brain vascular cells (BVCs). A major challenge in effective cerebrovascular transcriptional profiling is high-quality BVC procurement, permitting high sequencing depth. Here, we establish cell isolation procedures for glio-vascular cell-enriched single-cell RNA sequencing enabling unbiased characterization of BVC transcriptional heterogeneity. Our approach can be used to address vascular-specific contribution to brain diseases.
Before you begin
This vascular enriched single cell suspension protocol is adapted from a previous protocol with modifications (Vanlandewijck et al., 2018). This procedure has been established and optimized for isolation of glio-vascular cells (i.e., endothelial cells, smooth muscle cells, pericytes, and astrocytes) from cortical tissues of adult mice (6–12 months old). The enzymatic tissue digestion followed by the depletion of CD11b-positive cells, and myelin and dead cell removals allow greater representation of vascular cell populations in single-cell RNA sequencing (scRNA-Seq) with reduced number of other brain cell types including microglia, neurons, and oligodendrocytes. Adaptation of this protocol for aged-animals (more than 12 months old) has not been fully tested, and thus critical steps such as beads-mediated myelin removal may need to be modified.
Preparation on the day before the experiment
Timing: 30 min
-
1.Reagent preparation
-
a.MACS buffer: Add BSA to (calcium/magnesium free) DPBS to the final concentration of 0.5%.
MACS buffer
Reagent/Volume For 100 mL For 250 mL For 500 mL For 1000 mL 30% BSA (mL) 1.67 4.17 8.33 16.67 DPBS (mL) 98.33 245.83 491.67 983.33 Enough for (X Samples) 2.5 6.25 12.5 25 -
b.Cell suspension solution: Dilute MACS buffer (0.5% BSA) with (calcium/magnesium free) DPBS to the final concentration of 0.04% of BSA.
Cell suspension solution
Reagent/Volume For 100 mL For 250 mL For 500 mL For 1000 mL MACS (mL) 8 20 40 80 DPBS (mL) 92 230 460 920 Note: We recommend preparing MACS buffer and cell suspension solution at least one day before use. You can store premade MACS buffer and cell suspension solution at 4°C for short term. Buffers must be vacuum filtered through 0.22 μm filters in a biosafety cabinet to remove potential contamination. Work under sterile conditions. We recommend using buffers within 1 week to minimize the risk of contamination.
-
a.
-
2.
Aliquot of reagents (see table below)
Note: Prepare and aliquot reagents under sterile conditions. We recommend using only sterile filter pipette tips when pipetting is involved.
Note: Storage conditions and shelf life are as indicated per manufacturer instructions.
| Reagent | Amount/Sample | Storage temperature (°C) |
|---|---|---|
| Buffer X (Neural Tissue Dissociation kit (P)) | 2,850 μL | 4°C |
| Enzyme P (Neural Tissue Dissociation kit (P)) | 75 μL | −20°C |
| Buffer Y (Neural Tissue Dissociation kit (P)) | 30 μL | 4°C |
| Enzyme A (Neural Tissue Dissociation kit (P)) | 15 μL | −20°C |
| Myelin Removal Beads II | 200 μL | 4°C |
| Red Blood Cell Lysis Solution | 500 μL | 4°C |
| CD11b MicroBeads mouse/human | 10 μL | 4°C |
| Binding Buffer Stock Solution (Dead Cell Removal Kit) | 250 μL | 4°C |
| Dead Cell Removal MicroBeads (Dead Cell Removal Kit) | 100 μL | 4°C |
Preparation on the day of the experiment
-
3.Make sure that centrifuges and lab ovens have reached the required temperature before starting the procedure.
-
a.Centrifuges to 4°C (Eppendorf; Cat# 5810R and 5425).
-
b.Laboratory oven to 37°C (Thomas Scientific; Cat# 1197F66).
-
a.
Note: Steps 1–3 can be done the day prior or the day of the experiment
-
4.
Prepare Enzyme mix 1 and Enzyme mix 2 according to the table below: enzymes are provided in the Neural Tissue Dissociation kit (P) (Miltenyi Biotec; Cat# 130-092-628).
Enzyme mix 1 (per 1 brain)
| Reagent | Amount |
|---|---|
| Buffer X | 2,850 μL |
| Enzyme P | 75 μL |
| Total | 2,925 μL |
Enzyme mix 2 (per 1 brain)
| Reagent | Amount |
|---|---|
| Buffer Y | 30 μL |
| Enzyme A | 15 μL |
| Total | 45 μL |
CRITICAL: Enzyme mix 1 and mix 2 should be made within 20 min of use.
Note: The mouse cortical tissue weight is typically less than 600 mg. The allotted volume for the neural dissociation kit given above is optimized for 600 mg or less of starting tissue. However, if working with samples greater than 600 mg, linearly scale up reagent and total volume accordingly.
Key resources table
| REAGENT or RESOURCE | SOURCE | IDENTIFIER |
|---|---|---|
| Chemicals, peptides, and recombinant proteins | ||
| Bovine Serum Albumin solution | Sigma-Aldrich | A9576 |
| Isoflurane | Piramal Critical Care | 66794-017-25 |
| DPBS (calcium and magnesium free) | Thermo Fisher Scientific | 14190342 |
| HBSS (with calcium and magnesium) | Thermo Fisher Scientific | 14025092 |
| Critical commercial assays | ||
| Neural Tissue Dissociation Kit (P) | Miltenyi Biotec | 130-092-628 |
| Myelin Removal Beads II | Miltenyi Biotec | 130-096-733 |
| CD11b MicroBeads, human and mouse | Miltenyi Biotec | 130-093-634 |
| Red Blood Cell Lysis Solution, 10× | Miltenyi Biotec | 130-094-183 |
| Dead Cell Removal Kit | Miltenyi Biotec | 130-090-101 |
| Trypan Blue | Bio-Rad | 1450021 |
| ChromiumTM Single Cell 3′ Library & Gel Beads Kit v2 | 10x Genomics | PN-120267 |
| Chromium i7 Multiplex Kit | 10x Genomics | PN-120262 |
| Bioanalyzer 2100 High Sensitivity DNA Kit | Agilent Technologies | 5067-4626 |
| LIVE/DEADTM Viability/Cytotoxicity Kit | Thermo Fisher Scientific | L3224 |
| Deposited data | ||
| scRNA-Seq raw data | Yamazaki et al., 2021 | AD Knowledge Portal: https://doi.org/10.7303/syn22313650 |
| Experimental models: Organisms/strains | ||
| Mouse | Yamazaki et al., 2021 | N/A |
| Oligonucleotides | ||
| Primers for real-time PCR : See Table 1 | IDT | N/A |
| SsoAdvanced Universal SYBR® Green Supermix | Bio-Rad | 1725274 |
| Software and algorithms | ||
| 10x Genomics Cell Ranger Single Cell Software Suite | 10x Genomics | Version:3.0.0 |
| Other | ||
| 70 μm Cell Strainer | BD Falcon | 352350 |
| Quadro MACS Separator | Miltenyi Biotec | 130-090-976 |
| Octo MACS Separator | Miltenyi Biotec | 130-042-109 |
| MACS MultiStand | Miltenyi Biotec | 130-042-303 |
| LS Columns | Miltenyi Biotec | 130-042-401 |
| MS Columns | Miltenyi Biotec | 130-042-201 |
| Petri dishes, polystyrene (100 mm) | Sigma-Aldrich | P5606-400EA |
| 5 mL Snap cap Eppendorf tubes | Eppendorf | 0030119401 |
| 15 mL Conical tube | Thermo Fisher Scientific | 339650 |
| 50 mL Conical tube | Thermo Fisher Scientific | 339652 |
| 1 mL Disposable syringe | BD | BD309659 |
| 20 G needle | BD | 305175 |
| 23 G needle | BD | 305145 |
| Cotton-Plugged Borosilicate-Glass Pasteur Pipet | Fisher Scientific | 13-678-8A |
| Refrigerated centrifuge | Eppendorf | 5810R |
| Refrigerated centrifuge | Eppendorf | 5425 |
| Disposable Hemacytometers | Fisher Scientific | 22-600-107 |
| 10× Chromium Controller | 10x Genomics | 120263 |
| Dissection scissors | Sigma-Aldrich | S3146-1EA |
| Laboratory oven | Thomas Scientific | 1197F66 |
| End-over-end Multi-Functional Tube Rotator | Waken Btech | WKN-3063 |
| Accuri C6 Flow Cytometer | BD Biosciences | N/A (discontinued) |
| BenchMixer Vortexer, Q-drive balancing, 200–3200 rpm, 115V | Benchmark Scientific | BV1000 |
Table 1.
Primers for real-time PCR
| Cell type | Marker | Forward | Reverse |
|---|---|---|---|
| Astrocytes | Gfap [1] | AGG GCG AAG AAA ACC GCA TC | TTC TTT GGT GCT TTT GCC CC |
| Endothelial Cells | Glut1 [2] | TTG CCC AGG TGT TTG GCT TA | GTA GCA GGG CTG GGA TGA AG |
| Endothelial Cells | Mcam [3] | CGT GCC GCG GGT GTG | ACT TGG CTG AAG TTG CCT GA |
| Oligo Precursor Cells | Olig1 [4] | ACT ATG CGA TTT CCC AGG CG | AAC CCA CCA GCT CAT ACA GC |
| Pericytes | Pdgfrb [5] | GGC AGA AGA AGC CAC GCT ATG | AAG GCA ACT GCA CAG GGT C |
| Neuron | Tubb3 [6] | TGA GGC CTC CTC TCA CAA GT | GTC GGG CCT GAA TAG GTG TC |
| Smooth Muscle Cells | Acta2 [7] | TTC ATT GGG ATG GAG TCA GCG | AAT GCC TGG GTA CAT GGT GG |
| House Keeping Gene | Actin [8] | AGT GTG ACGTTG ACATCC GTA | GCC AGA GCA GTA ATC TCC TTC |
| Microglia | Cd11b [9] | CTG GGA GAT GTG AAT GGA G | ACT GAT GCT GGC TAC TGA TG |
[1] Itoh et al., 2016; [2–5] In house; [6] Huang et al., 2018; [7] Marchant et al., 2015; [8] Huang et al., 2018; [9] Holguin et al., 2007.
Real-time PCR was conducted using a SYBR green mix with a QuantStudio Cycler. During the PCR stage, after the initial denaturation step at 95°C for 2 min, samples were held for 15 s at 95°C then decreased and held at 60°C for 1 min for 40 cycles. The final melt curve stage occurred immediately after the PCR stage where samples were held for 15 s at 95°C, decreased to 60°C for 1 min, and increased to 95°C for the final 15 s at a rate of 0.05°C/s. All intermediate temperature changes occurred at a rate of 1.6°C/s.
Step-by-step method details
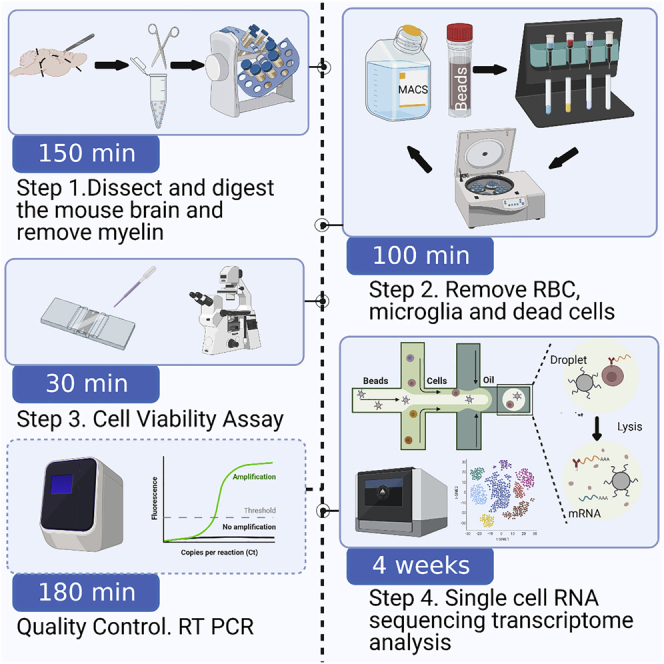
Figure 1 depicts the complete workflow for the procedure.
Note: It is not recommended to handle more than 2 samples per person in each experiment to ensure high cell viability. This minimizes the processing time per sample in each step.
Figure 1.

Workflow of single cell isolation from mouse brain tissue for glio-vascular cell enriched single-cell RNA sequencing
Graphical summary of the main steps to obtain a live single cell suspension of enriched mouse brain vascular cells.
Mouse brain preparation
-
1.Anesthetize a mouse (6–12 months old, male or female) with isoflurane and conduct a trans-cardial perfusion using ice-cold DPBS.
-
a.25 mL of PBS would be used during the perfusion at a flow of 10–15 mL/min.
-
a.
-
2.
Collect and store brain tissue in ice-cold HBSS.
Cell dissociation and myelin removal
-
3.
Prepare enzyme mix 1 (see before you begin).
-
4.
Warm enzyme mix 1 at 37°C for 10 min in a laboratory oven.
-
5.
Dissect out cortical tissue on a 100 mm petri dish (Figures 2A–2D).
Note: We recommend placing the dissected cortex on a Kimwipe soaked in PBS to prevent slippage during the dissection process. The process of dabbing the surfaces of brain cortical tissue with a Kimwipe helps in the removal of meninges that contain superficial vessels, meningeal, and fibroblast-like cells. This technique reduces potential sources of contamination during glio-vascular cell profiling.
-
6.
Keep dissected brains fully submerged in cold HBSS as enzyme mix 1 is heating up.
-
7.
Add 2925 μL of enzyme mix 1 into an empty 5 mL snap cap Eppendorf tube (per sample).
Note: A 5 mL tube is recommended for this step as it is easier for dissection scissors to reach to the bottom to mince the samples.
Optional: Alternatively, the slicing process can be performed in petri dish with a blade or dissection scissor if the users find it easier to do so. The critical point is to mince the brain tissues efficiently to reduce the time between mincing and incubation.
-
8.
Move brain cortices into the 5 mL tube with enzyme mix 1.
Note: Remove excess HBSS when moving dissected cortices to 5 mL Eppendorf tubes.
-
9.
Cut the brain tissue into small pieces with sharp dissection scissors, until small enough to pass through the opening of a Pasteur pipet (approximately 30 s), see Figure 2E.
Note: Do not pipet to test if the chunks are small enough. Suction from pipetting may cause brain chunks to stick to the pipet tip filter leading to sample loss. Dissection scissors must be sterilized using 70% ethanol before use.
-
10.
Incubate samples for 17 min at 37°C under continuous rotation at 20 rpm using a rotator.
-
11.
During the incubation, prepare enzyme mix 2 at room temperature (RT; 20°C–26°C) (see before you begin).
Note: Do not prewarm enzyme mix 2.
-
12.
After incubation, remove the tube from the laboratory oven and add 45 μL of enzyme mix 2 per sample.
-
13.
Mix the tissue/enzyme solution 10–15 times at a rate of 1 mL/s using a sterilized glass cotton-plugged Pasteur pipet topped with a rubber bulb (Figure 2F).
-
14.
Incubate samples for 12 min at 37°C under continuous rotation at 20 rpm.
-
15.
Pass the tissue/enzyme solution 5 times using a 1 mL syringe with a 20 G needle at a rate of 0.5 mL/s.
Note: Each pass is one cycle of (in/out)
-
16.
Switch to a 1 mL syringe with 23 G needle and pass the tissue/enzyme solution 10 times at a rate of 0.25 mL/s until solid pieces are no longer visible (Figure 2G).
Optional: While they have not been tested in this protocol, commercialized tissue dissociating devices (e.g., gentleMACS™ Octo Dissociator with Heaters. Miltenyi Biotec; Cat# 130-096-427) might also be used for steps 9, 10, 13, 14, 15, 16, and 17. The users are recommended establishing a customized program for tissue dissociation based on our protocol.
-
17.
Incubate samples for 10 min at 37°C under continuous rotation at 20 rpm.
-
18.
During incubation, rinse a 70 μm cell strainer with 2 mL of ice-cold (calcium and magnesium free) DPBS.
-
19.
Transfer the tissue/enzyme solution to a 50 mL conical tube and add 20 mL ice-cold DPBS.
-
20.
Apply the tissue suspension to the 70 μm cell strainer placed on a separate 50 mL collection tube on ice.
-
21.
Centrifuge tissue suspension at 300 × g for 5 min at 4°C.
-
22.
Aspirate supernatant carefully and completely.
-
23.
Resuspend the cell pellet in 1,800 μL of cold MACS buffer (4°C).
-
24.
Add 200 μL of Myelin Removal Beads.
-
25.
Mix well. Incubate for 15 min at 37°C without rotation.
-
26.
After incubation, add 18 mL of cold MACS buffer.
-
27.
Centrifuge at 300 × g for 5 min at 4°C.
-
28.
During centrifugation, prepare three LS columns per sample (Figure 2H).
-
29.
Place the columns on the Quadro MACS Separator with MACS MultiStand and rinse the columns with 3 mL of MACS buffer.
-
30.
Aspirate the supernatant.
-
31.
Resuspend the cell pellet in 3 mL MACS buffer.
-
32.
Place 15 mL conical collection tubes below each column.
-
33.
Apply 1 mL cell suspension per each LS column.
-
34.
Wash column twice with 1 mL of MACS buffer.
-
35.
Collect total effluent.
Note: Wait until the buffer in the column goes through before adding the next 1 mL of buffer.
-
36.
Combine eluents from the 3 separate columns of the same sample.
-
37.
Centrifuge the eluent at 300 × g for 5 min at 4°C.
Figure 2.

Brain tissue dissection, cell dissociation, and MACS separator setup
(A–D) Step-by-step dissection of cortical brain tissue. Scale bar, 1 cm. (A) Whole mouse brain. (B) Remove the cerebellum from the cerebrum. (C) Halve the cerebrum along the longitudinal fissure and dissect out the subcortex, hippocampus, and midbrain. (D) The final dissected cortex is used for downstream neural cell dissociation and isolation of vascular enriched cells.
(E–G) Brain tissue dissociation and generation of homogeneous cell suspension. (E) Consistency of the initial brain mince using surgical scissors in enzyme mix 1. Brain chunks should be small enough to pass through a Pasteur pipet. (F) Brain suspension with the addition of enzyme mix 2. The cortex is further dissociated after passing through a Pasteur pipet. At this stage the suspension should be turning cloudy. (G) Cell suspension after passing through a 20 G and 23 G needle. There are no visible chunks, and the suspension should be murky with a smooth consistency.
(H) Quadro MACS Separator set up.
Red blood cell removal
-
38.
During centrifugation, prepare 1× Red Blood Cell Lysis Solution.
Note: Add 0.5 mL of 10× Red Blood Cell Lysis Solution to 4.5 mL ddH2O. (5 mL of 1× solution per sample). Keep the solution at RT.
-
39.
Aspirate the supernatant.
-
40.
Resuspend the cell pellet in 500 μL of ice-cold MACS buffer.
-
41.
Add 5 mL of 1× Red Blood Cell Lysis Solution to the cell suspension.
-
42.
Vortex gently for 5 s.
Note: Please do not use vortex settings above 600 rpm.
-
43.
Incubate at RT for 2 min.
-
44.
Centrifuge at 300 × g for 5 min at 4°C.
Microglia removal
Note: In comparison to the entirety of the mouse cortex, our single cell suspension enriches vascular cell types (e.g., smooth muscle cells, pericytes, and endothelial cells) by targeted removal of microglia. The addition of the myelin removal beads also contributes to the removal of the oligodendrocyte population.
-
45.
Aspirate the supernatant.
-
46.
Resuspend the cell pellet in 90 μL of MACS buffer.
-
47.
Add 10 μL of CD11b MicroBeads.
-
48.
Incubate for 15 min in a 4°C refrigerator.
-
49.
After the 15 min incubation, add 2 mL of MACS buffer.
-
50.
Centrifuge at 300 × g for 10 min at 4°C.
-
51.
During centrifugation, set one MS column per sample on the Octo MACS Separator with MACS MultiStand and rinse columns with 500 μL of MACS buffer.
-
52.
Place collection tubes on ice under each MS column to collect effluent.
-
53.
Aspirate the supernatant.
-
54.
Resuspend the cell pellet in 500 μL of MACS buffer.
-
55.
Apply the cell suspension to the MS column.
-
56.
Wash columns three times with 500 μL of MACS buffer.
-
57.
Collect total effluent.
Note: Wait until the buffer in the column goes through before adding the next 500 μL of MACS buffer.
-
58.
Centrifuge the cell suspension at 300 × g for 5 min at 4°C.
Dead cell removal
-
59.
During centrifugation, prepare 1X Binding buffer.
Note: Add 4.75 mL ddH2O to 0.25 mL of 20X Binding Buffer Stock Solution per sample. Keep on ice. This dilution yields 1.5 mL of excess buffer. 20X Binding Buffer Stock Solution is provided in the Dead Cell Removal Kit (Miltenyi Biotec; Cat# 130-090-101).
-
60.
Aspirate the supernatant.
-
61.
Resuspend the cell pellet in 100 μL of Dead Cell Removal MicroBeads (provided in the Dead Cell Removal Kit).
-
62.
Incubate for 15 min at RT.
-
63.
During incubation, rinse 1 MS column per sample with 500 μL of 1× Binding buffer.
-
64.
After incubation, add 1 mL of 1× Binding buffer to the cell/bead suspension.
-
65.
Place 15 mL collection tubes below each column.
-
66.
Apply the cell suspension to the MS column.
-
67.
Wash the column four times with 500 μL of 1× Binding buffer.
-
68.
Collect everything.
Note: Wait until the buffer in the column goes through before adding the next 500 μL of 1× Binding buffer.
-
69.
Centrifuge at 300 × g for 5 min at 4°C.
Cell viability assay
-
70.
Aspirate supernatant and resuspend the cell pellet in 1 mL of cell suspension solution (0.04% BSA - see before you begin).
-
71.
Take 10 μL of the cell suspension and mix thoroughly with 10 μL of trypan blue.
-
72.
Load 10 μL of the mixture onto a disposable hemacytometer and determine the cell viability using a bright-field microscope (Figures 3A and 3B).
Note: The cell viability can also be assessed by flow cytometry using the LIVE/DEAD Viability /Cytotoxicity Kit.
-
73.
Centrifuge at 300 × g for 5 min at 4°C.
-
74.
Resuspend the cell pellet in the cell suspension solution. Adjust the cell suspension to ~ 1×10⁶ cells/mL of live cells.
Figure 3.

Cell viability evaluation of isolated single cells from mouse cortical brain tissues
(A and B) Representative hemocytometer image of cells stained with trypan blue. Cell suspension and trypan blue (1:1 ratio) were mixed and loaded onto a disposable hemacytometer. Live cells with intact cell membranes exclude trypan blue (open arrow), whereas cells with membrane disruption (i.e., dead cells) are strained blue (closed arrow). Images were taken using an EVOS Microscope under 10× (A; scale bar, 400 μm) and 20× (B; Scale bar, 100 μm).
(C) Representative FSC-A/SSC-A plot and doublet discrimination plot with corresponding gating.
(D and E) Representative results of cell viability assay using flow cytometry. Sample viability was assessed by a live/dead stain using fluorogenic ester Calcein-AM (CAM) and the nucleic acid dye Ethidium homodimer-1 (EthD-1). A total of 5,000 cells were analyzed using BD Accuri Flow Cytometer. CAM positive cells are ‘viable/live,’ whereas EthD-1 positive cells are ‘dead’. The histogram plots show the fluorescence emission profiles of samples treated with CAM (green) or EthD-1 (red). Unstained sample fluorescence emission is shown in black. (C) The shift in FL1 fluorescence in CAM-treated cells indicates that over 97% of cells are viable. (D) The FL2 fluorescence shift in EthD-1 treated cells indicates that about 13% of cells have a loss of cell membrane integrity and are considered non-viable. X axis: fluorescence intensity; Y axis; relative cell count for each population (normalized to mode).
Single-cell RNA sequencing
For complete details on scRNA-Seq and data analysis, please refer to Yamazaki et al. (2021).
-
75.
Proceed to the 10× Chromium protocol.
Note: Approximately 3,000 glio-vascular cells per animal were loaded into each sample well according to the 10× Chromium Controller protocol (10× Genomics).
Optional: After loading into the 10× Chromium Controller, surplus cells can be frozen as cell pellet or in an appropriate buffer (for RNA extraction) at −80°C for real-time PCR experiments at a later time to examine if the isolated cells are vascular cell-enriched populations. Please also refer to “Validation of vascular cell-enriched populations” in the ‘expected outcomes’ section. To ensure the optimal cell viability for scRNA-seq, the isolated single cells should be subjected to 10× Chromium Controller immediately.
-
76.
Prepare libraries for scRNA-Seq using Chromium™ Single Cell 3′ Library & Gel Bead Kit v2. Single cell libraries were constructed according to manufacturer’s instructions and sequenced at the 3′ end by an Illumina HiSeq 4000 Sequencing System at an average depth of 60,000 reads per cell.
Note: If you are testing differential gene expressions between condition A and B, consider using a sequencing design in which confounding caused by batch or lane effects are eliminated (Auer and Doerge, 2010). For example, if you have four scRNA-Seq libraries generated from four biological replicates (e.g., samples from animal 1 with condition A, animal 2 with condition A, animal 3 with condition B, and animal 4 with condition B), the four libraries are pooled, and the pool is divided into four equal amounts that are subjected for sequencing by multiple lanes. The number of lanes utilized for sequencing should be determined such that the targeted reading depth per cell is sufficiently recovered in each sample.
Note: Our data in this manuscript was completed using a V2 kit. As newer kits become available, we recommend following manufacturer instructions for use.
-
77.
Following scRNA-Seq, data can be analyzed by Seurat (Sajita et al., 2015) or other platforms.
Expected outcomes
This protocol is intended for the recovery of glio-vascular cells suitable for scRNA-Seq. Approximately 100,000 - 300,000 glial and vascular cells can be obtained from one adult mouse brain (both cortices) using the above protocol. It should be noted that this can vary depending on the strain and age of mice. In our experiments, we typically obtain single cells with approximately 90% cell viability examined in a trypan blue exclusion assay (Figures 3A and 3B).
We further validate the isolated vascular cell-enriched compositions of our isolated cells through real-time PCR using a variety of cell type specific markers (Figure 4). We recommend performing real-time PCR analysis when familiarizing and establishing the protocol. Given that cells used for subsequent scRNA-Seq procedures (i.e., into 10× Chromium Controller) must be processed immediately, real-time PCR validation will not be performed the day of single cell isolation for scRNA-Seq analysis.
Figure 4.

Enrichment of vascular cell populations in the single cell suspension evaluated by real-time PCR analysis
RNA was extracted from unprocessed cortical brain tissues and single cell suspensions, subject to reverse transcription, and subsequently real-time PCR analysis.
(A) The expression of vascular cell markers in total brain tissues (Brain) and vascular enriched single cells (Vascular), including Acta2 (SMC; smooth muscle cell), Glut1, Mcam (EC; endothelial cell), and Pdgfr (PC; pericyte). Results were normalized to actin and graphed expressions are visualized as ratios to total brain tissues (N=3 biological repeats). Data represents mean ± S.E.M. ∗∗p < 0.01. Two-tailed t-test.
(B) The expression of non-vascular cell markers in total brain tissues (Brain) and vascular enriched single cells (Vascular), including Tubb3 (Neu; neuron), Olig-1 (OPC; oligodendrocyte precursor cells), Cd11b (MG; microglia), and GFAP (AS; astrocyte). Results were normalized to actin and graphed expressions are visualized as ratios to total brain tissues (N=3–4 biological repeats). Data represents mean ± S.E.M. ∗p < 0.05, N.S., not significant. Two-tailed t-test.
We performed quality control for library preparation where representative results during library preparation are shown in Figure 5. With this protocol, our scRNA-Seq dataset identified major cell types in the brain, including glio-vascular cells (i.e., astrocytes, smooth muscle cells, pericytes, and endothelial cells), and non-vascular cells, (i.e., neurons, microglia/macrophages, and fibroblasts) (Figure 6). The average number of cells sequenced on average was around 2800 with mean reads per cell and median genes per cell were 102500 and 1500, respectively. UMI counts per cell averaged around 3300, where our average cDNA concentration yield is approximately 18 nmol/L for 35 μL. Details of scRNA-Seq analyses can be found in our recent publication (Yamazaki et al., 2021).
Figure 5.

Validations for cDNA amplification and gene expression library construction
(A) Major steps for generating Single Cell 3ʹ Gene Expression libraries from single cell suspensions. Please refer to Chromium Single Cell 3ʹ Reagent Kits v2 user guide for details.
(B) cDNA quality control (QC) and quantification. Samples enriched in glial and vascular cells were processed using the Chromium Single Cell 3ʹ Reagent Kits. Specifically, after reverse transcription, cDNA amplification with 12 cycles of PCR, and SPRI-based sample clean-up, 1 μL of the undiluted sample was analyzed on an Agilent Bioanalyzer High Sensitivity DNA chip. Representative images of the Bioanalyzer microgel (left) and its electropherogram trace (right) are shown (n=2, independent; a1, a2).
(C) Post library construction QC. After passing quality control described in B, the samples were further processed with the Chromium Single Cell 3ʹ Library Kits. Specifically, after fragmentation, adapter ligation, sample index PCR amplification with cycles of 14, and SPRI-based sample clean-up, 1 μL of the sample at 1:5 dilution was analyzed on an Agilent Bioanalyzer High Sensitivity DNA chip. Representative images of the Bioanalyzer microgel (left) and its electropherogram trace (right) are shown (n=2, independent; b1, b2). Peaks at 35 and 10380 bp represent spiked-in controls. M, marker.
Figure 6.

Example of glio-vascular cell-enriched scRNA-Seq analysis
(A) A t-SNE plot showing a variety of cell types within the captured glio-vascular unit. SMC, smooth muscle cell; MΦ, macrophage.
(B) Feature plot of markers defining major cell types in scRNA-Seq datasets. Astrocyte (Dclk1, Gfap); pericyte (Vtn); Smooth muscle cells (Acta2, Sncg); Choroid plexus (Enpp2); Endothelial cell (Cldn5); Neuron (Tubb3).
(C) A representative split dot plot depicting marker genes for each cell population from Yamazaki et al. 2021.
(D) The scRNA-Seq datasets show differential transcriptomic profiles of glio-vascular cells. Metascape analysis of differentially expressed genes (DEGs) in the pericyte cluster showed an angiogenic upregulation in apoE3 mice. In contrast, glial activation, and cell-matrix adhesion increases were identified in the corresponding apoE4 astrocyte cluster. Figure reprinted with permission from Yamazaki et al., 2021.
Limitations
Our protocol is optimized for glio-vascular cell isolation, which requires strong enzymatic digestion. Such treatment conditions can potentially activate other cells, such as microglia which may influence results. To enrich glio-vascular cells, microglia are targeted for removal during the isolation process. Only CD11b is targeted due to market availability. If future beads targeting a different marker for microglia are available, additional steps may be added to the protocol to optimize microglial removal.
During troubleshooting and validation, we obtain approximately 70%–90% cell viability in a flow cytometry-based cell viability assay (Figures 3C–3E). Decreased cell viability in a flow cytometry live/dead stain may be due to debris contamination counting as dead cells. For the actual experiment, we recommend manual counting with a hemocytometer as it may improve live cell count accuracy and can be performed right away with a few μL of sample. Do not proceed with scRNA-Seq if cell viability is below 90%.
Note: The general guideline is that cell viability must be assessed as quickly as possible, and can be examined by means of method of your choice that provides fast and accurate results.
Troubleshooting
Problem 1
The viability of the cells is below 90%. The major potential causes may include: 1) The incubation time in the red blood cell removal step (step 43) might be longer than necessary for well-perfused samples, contributing to decreased cell viability. 2) Incubation during the neural dissociation steps (steps 10, 14, and 17) is ideal for minced brain chunks. Increased incubation time to facilitate dissociation may decrease cell viability. Note that the duration of red blood cell removal step (step 43) is only 2 min. Please be cognizant of the time particularly during this step. 3) Strong vortexing or rough handling of cells may potentially induce cell death.
Potential solution
Cell viability decreases with time following extraction. We recommend preparing all reagents prior to each step to avoid delay in any of the steps following cortex dissection. Incubation time for the red blood cell removal step (step 43) can be decreased to 1 min or as needed for optimal cell viability if the brain was well perfused.
Problem 2
The number of cells ultimately sequenced in scRNA-Seq dataset is lower than expected.
Potential solution
Re-evaluate cell preparation methods including cell viability, cell counting method and pipetting techniques (see also: TECHNICAL NOTE Guidelines for Accurate Target Cell Counts Using 10× Genomics Single Cell Solutions, 10× Genomics). Load 110%–120% of the targeted cell numbers to ensure that the numbers of cells ultimately sequenced in scRNA-Seq dataset are as close to the targeted cell numbers as possible.
Problem 3
Not enough vascular cells in the scRNA-Seq analysis after clustering and identifying cell types with cell-type specific markers (step 77).
Potential solution
If there is an overabundance of microglia in the scRNA-Seq data, consider increasing the amount of CD11b beads in the microglia removal step (step 47). Beads against additional/alternative microglia markers can be considered when optimizing microglia removal.
Problem 4
Substantial upregulation of immediate early genes, such as Fos, Egr1, Fosb, Nr4a1, and Dusp1, presumably associated with dissociation procedures, is detected in scRNA-Seq data.
Potential solution
Consider applying actinomycin D, a general transcription inhibitor, during dissociation procedures (Wu et al., 2017). However, we have not yet tested this out and have no data on the compatibility of actinomycin D with the 10× Single Cell 3′ workflows.
Problem 5
There are not enough vascular cells for scRNA-Seq (step 72).
Potential solution
Cell dissociation was too weak (step 14). Without proper digestion and dissociation, it will be difficult to see vascular cells in scRNA-Seq. Some training may be required to acquire to balance cell viability and BVC yield. If the digestion is too strong, there will be cell damage. If the digestion is too weak, then there will be a low yield of BVCs.
Resource availability
Lead contact
Further information, requests for resources and reagents should be directed to and will be fulfilled by the lead contact, Dr. Chia-Chen Liu (Liu.chiachen@mayo.edu).
Materials availability
This protocol did not generate new unique reagents.
Data and code availability
No custom code is necessary to perform this protocol. All datasets mentioned in this protocol have been described in Yamazaki et al., 2021. The accession number for the single-cell RNA sequencing data reported in this paper is AD Knowledge Portal: https://doi.org/10.7303/syn22313650. Graphical abstract was prepared using Biorender.com.
Acknowledgments
The authors thank Dr. Laura Lewis Tuffin for technical support and Tadafumi (Clark) Ikezu and Hongmei Li for careful reading of the manuscript. This research was supported by the National Institute of Health (NIH) (grants R37AG027924, RF1AG051504, RF1AG057181, RF1AG046205, and P30AG062677 to G.B.; and grant R01AG062110 to C.-C.L.), a Cure Alzheimer’s Fund (G.B.), the American Heart Association (fellowship 17POST33410227 to Y.Y.), Florida Department of Health Ed and Ethel Moore Alzheimer’s Disease Research Program (8AZ07), and a grant from Brightfocus (to C.-C.L.).
Author contributions
A.Y., F.S., and Y.Y. performed single-cell extraction; A.Y. and F.S. performed PCR validation experiments; A.Y. and Y.A.M. performed flow cytometry; F.S., Y.Y., Y.A.M., and C.-C.L. analyzed data; and A.Y., F.S., Y.Y., Y.A.M., G.B., and C.-C.L. wrote the manuscript, with input from all authors.
Declaration of interests
The authors declare no competing interests.
Contributor Information
Guojun Bu, Email: Bu.guojun@mayo.edu.
Chia-Chen Liu, Email: Liu.chiachen@mayo.edu.
References
- Auer P.L., Doerge R.W. Statistical design and analysis of RNA sequencing data. Genetics. 2010;185:405–416. doi: 10.1534/genetics.110.114983. [DOI] [PMC free article] [PubMed] [Google Scholar]
- Holguin A., Frank M.G., Biedenkapp J.C., Nelson K., Lippert D., Watkins L.R., Rudy J.W., Maier S.F. Characterization of the temporo-spatial effects of chronic bilateral intrahippocampal cannulae on interleukin-1beta. J. Neurosci. Methods. 2007;161:265–272. doi: 10.1016/j.jneumeth.2006.11.014. [DOI] [PMC free article] [PubMed] [Google Scholar]
- Huang J., Li J., Feng C., Huang X., Wong L., Liu X., Nie Z., Xi G. Blood-brain barrier damage as the starting point of leukoaraiosis caused by cerebral chronic hypoperfusion and its involved mechanisms: effect of agrin and aquaporin-4. Biomed Res. Int. 2018;2018:2321797. doi: 10.1155/2018/2321797. [DOI] [PMC free article] [PubMed] [Google Scholar]
- Itoh K., Ishihara Y., Komori R., Nochi H., Taniguchi R., Chiba Y., Ueno M., Takata-Tsuji F., Dohgu S., Kataoka Y. Levetiracetam treatment influences blood-brain barrier failure associated with angiogenesis and inflammatory responses in the acute phase of epileptogenesis in post-status epilepticus mice. Brain Res. 2016;1652:1–13. doi: 10.1016/j.brainres.2016.09.038. [DOI] [PubMed] [Google Scholar]
- Marchant V., Droguett A., Valderrama G., Burgos M.E., Carpio D., Kerr B., Ruiz-Ortega M., Egido J., Mezzano S. Tubular overexpression of Gremlin in transgenic mice aggravates renal damage in diabetic nephropathy. Am. J. Physiol. Renal Physiol. 2015;309:F559–F568. doi: 10.1152/ajprenal.00023.2015. [DOI] [PubMed] [Google Scholar]
- Sajita R., Farrell J.A., Gennert D., Schier A.F., Regev A. Spatial reconstruction of single-cell gene expression data. Nat. Biotechnol. 2015;33:495–502. doi: 10.1038/nbt.3192. [DOI] [PMC free article] [PubMed] [Google Scholar]
- Vanlandewijck M., He L., Mae M.A., Andrae J., Ando K., Del Gaudio F., Nahar K., Lebouvuier T., Lanvina B., Gouveia L. A molecular atlas of cell types and zonation in the brain vascular. Nature. 2018;554:475–480. doi: 10.1038/nature25739. [DOI] [PubMed] [Google Scholar]
- Wu Y.E., Pan L., Zuo Y., Li X., Hong W. Detecting activated cell populations using single-cell RNA-seq. Neuron. 2017;96:313–329. doi: 10.1016/j.neuron.2017.09.026. [DOI] [PubMed] [Google Scholar]
- Yamazaki Y., Liu C.C., Yamazaki A., Shue F., Martens Y.A., Chen Y., Qiao W., Kurti A., Oue H., Ren Y. Vascular ApoE4 impairs behavior by modulating gliovascular function. Neuron. 2021;109:1–10. doi: 10.1016/j.neuron.2020.11.019. [DOI] [PMC free article] [PubMed] [Google Scholar]
Associated Data
This section collects any data citations, data availability statements, or supplementary materials included in this article.
Data Availability Statement
No custom code is necessary to perform this protocol. All datasets mentioned in this protocol have been described in Yamazaki et al., 2021. The accession number for the single-cell RNA sequencing data reported in this paper is AD Knowledge Portal: https://doi.org/10.7303/syn22313650. Graphical abstract was prepared using Biorender.com.