Abstract
Background and Objectives
To estimate the proportions of patients with relapsing-remitting multiple sclerosis who despite achieving the no evidence of disease activity-3 (NEDA-3) status in the first 2 treatment years experienced relapse-associated worsening (RAW) or progression independent from relapse activity (PIRA) in the following years.
Methods
We selected patients with NEDA-3—defined as no relapse, no disability worsening, and no MRI activity—in the first 2 years of either glatiramer acetate or interferon beta as initial treatment. We estimated the long-term probability of subsequent RAW and PIRA (considered as 2 contrasting outcomes) by cumulative incidence functions. Competing risk regressions were used to identify the baseline (i.e., at treatment start) predictors of RAW and PIRA.
Results
Of 687 patients, 224 (32.6%) had NEDA-3 in the first 2 treatment years. After a median follow-up time of 12 years from treatment start, 58 patients (26%) experienced disability accrual: 31 (14%) had RAW and 27 (12%) had PIRA. RAW was predicted by the presence of >9 T2 lesions (subdistribution hazard ratio [SHR] = 3.92, p = 0.012) and contrast-enhancing lesions (SHR = 2.38, p = 0.047) on baseline MRI scan and either temporary or permanent discontinuation of the initial treatment (SHR = 1.11, p = 0.015). PIRA was predicted by advancing age (SHR = 1.05, p = 0.036 for each year increase) and presence of ≥1 spinal cord lesion on baseline MRI scan (SHR = 4.08, p = 0.016).
Discussion
The adoption of NEDA-3 criteria led to prognostic misclassification in 1 of 4 patients. Different risk factors were associated with RAW and PIRA, suggesting alternative mechanisms for disability accrual.
Classification of Evidence
This study provides Class II evidence that in patients with RRMS who attained NEDA-3 status, subsequent RAW was associated with baseline MRI activity and discontinuation of treatment and PIRA was associated with age and the presence of baseline spinal cord lesions.
The no evidence of disease activity-3 (NEDA-3), defined as no relapse, no disability increase, and no MRI activity, is deemed to be a treat-to-target strategy of disease-modifying treatments (DMTs) for relapsing-remitting multiple sclerosis (RRMS).1 Achieving the NEDA-3 status in the first 2 treatment years was shown to hold 80%–90% positive predictive value for the absence of longer-term disability accrual in the following years.2 Nevertheless, whether NEDA-3 actually represents a reliable surrogate marker of disease activity-free status is still debated.3,4
Growing data suggest that a multiple sclerosis (MS)-related disability increase may occur not only as relapse-associated worsening (RAW) but also as progression independent of relapse activity (PIRA).5 This latter outcome, also called “silent progression,”6 has been reported at a rate of 2%–5% per year6 and can be observed over time in those patients who keep the NEDA-3 status in the first treatment years.7 Therefore, some authors have proposed a paradigm shift in the assessment of disability progression, which is based not only on clinical relapses and focal MRI activity but also on measures of neurodegeneration.8 This may allow in identifying patients at risk of relentless progression of disability even when inflammatory activity is not evident.4,8
To date, only a single post hoc analysis of 2 randomized clinical trials (OPERA I and II) has distinguished the rates of RAW and PIRA in patients with RRMS treated with interferon beta (IFNB) or ocrelizumab, highlighting that the most disability accumulation was not associated with overt clinical relapses.5 Given the current uncertainty in defining the long-term predictive value of the NEDA-3 status, we designed a retrospective study with the following aims: (1) to estimate the proportions of patients with NEDA-3 in the first 2 treatment years experiencing PIRA and RAW in the subsequent years and (2) to identify factors associated with RAW and PIRA, respectively.
Methods
Study Design and Participants
This was an independent, 2-center, retrospective cohort study based on data collected in the real-world setting. We analyzed data of patients diagnosed with RRMS according to McDonald criteria9 and their following revisions10,11 and those regularly attending 2 tertiary MS Centres in Rome (S. Camillo-Forlanini Hospital and S. Andrea Hospital, Rome, Italy).
We collected data of patients with RRMS according to the following criteria:
Patients received any formulation of either glatiramer acetate (GA) or IFNB as initial treatment.
An Expanded Disability Status Scale (EDSS)12 score <3.0 at treatment start (henceforth defined as ‟baseline”) evaluated at least 3 months apart from a relapse.
Regular at least biannual clinical visits from treatment start including EDSS scoring performed by certified neurologists (neurostatus.net).
Complete MRI data on brain and spinal cord at baseline (within 1 month before treatment start) and after 1 and 2 years (±1 month) since treatment start acquired with the same magnet in each patient according to established guidelines.13-15
A minimum of 10 years of follow-up from initial DMT start.
We chose to include only patients who started injectable DMTs to obtain long-term data, given that oral DMTs were available only after 2013 in Europe (therefore missing the 10-year follow-up needed for our study).
Standard Protocol Approvals, Registrations, and Patient Consents
We gathered all data after obtaining an informed consent from each participant and after notification to our institutional ethical committee (Comitato Etico Lazio 1; e-mail: comitatoeticolazio1.it) that provided exemption of approval for noninterventional retrospective studies. In no way, this study did interfere in the care received by patients. Anonymized data presented in this article will be made available by a reasonable request of a qualified investigator (requests should be sent to the first author: luca.prosperini@gmail.com).
Measures of Disease Activity
To conform with the main purpose of our study, the main analysis was focused only on patients who had NEDA-3 in the first 2 years of their initial treatment. The NEDA-3 status was identified by the absence of the following parameters: clinical relapses, 6-month confirmed increase in EDSS score, and MRI activity.1
A clinical relapse was defined as any new neurologic symptom not associated with fever or infection lasting for at least 24 hours and accompanied by new neurologic signs or symptoms.9-11 A confirmed disability increase was defined as 1.5-point increase (if the baseline EDSS score was 0), 1.0-point increase (if the baseline EDSS score was <5.5), or 0.5-point increase (if the baseline EDSS score was ≥5.5) confirmed 6 months apart.16
MRI activity included the presence of contrast-enhancing lesions (CELs) and new T2-hyperintense lesions (as compared with the baseline scan) on brain and spinal cord. CELs were detected on T1-weighted spin echo axial (for brain imaging) and sagittal (for spinal cord imaging) images after gadolinium-diethylenetriamine penta-acetic acid administration sequences.13 New focal T2 lesions were detected on axial T2/proton density–weighted fast spin echo and fluid-attenuated inversion recovery sequences (for brain imaging) and sagittal and axial T2-weighted fast spin echo and T2-short-tau inversion recovery (for spinal cord imaging). Enlarging T2 lesions were not counted because of the poor between-rater agreement for this metric under routine clinical setting.14,17
Outcome Definition
We analyzed 2 different outcomes: RAW, defined as sustained disability worsening occurring within 3 months after a clinical relapse, and PIRA, defined as sustained increase in disability occurring in patients who were relapse-free.5 Although RAW and PIRA are considered 2 nonmutually exclusive drivers for long-term disability accrual, in this study, we considered PIRA and RAW as 2 competing outcomes (i.e., the occurrence of one precludes the other one and vice versa), whichever came first.
Both outcomes were retrospectively identified on the basis of disability increase, as afore defined.16 Long-term disability accrual due to RAW or PIRA had to be confirmed in at least 2 consecutive visits and sustained (stable or higher) over the entire follow-up.
Statistical Analysis
Descriptive data were presented as count (proportion) for categorical variables and mean ± SD or median (interval) for continuous variables. Between-group differences were tested by the Fisher exact test or the Mann-Whitney U test, as appropriate.
Baseline variables of interest included the following: sex (female or male), age (years), comorbidity (presence or absence), onset symptom (afferent or efferent), disease duration (years), EDSS score, pretreatment annualized relapse rate, CELs on brain and/or spinal MRI scan (absence or presence), brain lesion count (≤9 or >9 T2 lesions), infratentorial lesion (absence or presence), and spinal cord lesion (absence or presence).
The first aim of this study was explored by estimating the probabilities of RAW and PIRA using the cumulative incidence function (CIF) method.18 We also compared the proportions of patients who experienced PIRA and RAW in the subgroup of patients with NEDA-3 status and in those who did not maintain their NEDA-3 status at year 2 postinitial DMT start.
For the second aim of this study, we ran 2 competing risk analyses according to the Fine-Gray model19,20 to estimate the subdistribution hazard ratio (SHR) of each covariate of interest on the CIF for PIRA and RAW. Both models were adjusted by calendar year at treatment start to account for revisions of diagnostic criteria over time.9-11 Temporary interruption (≥6 months) or permanent discontinuation of DMT was also inserted in the models as time-varying covariate to explore the effect of treatment withdrawal on the risk of PIRA and RAW. Two-sided p values < 0.05 were considered as significant.
Results
Participants
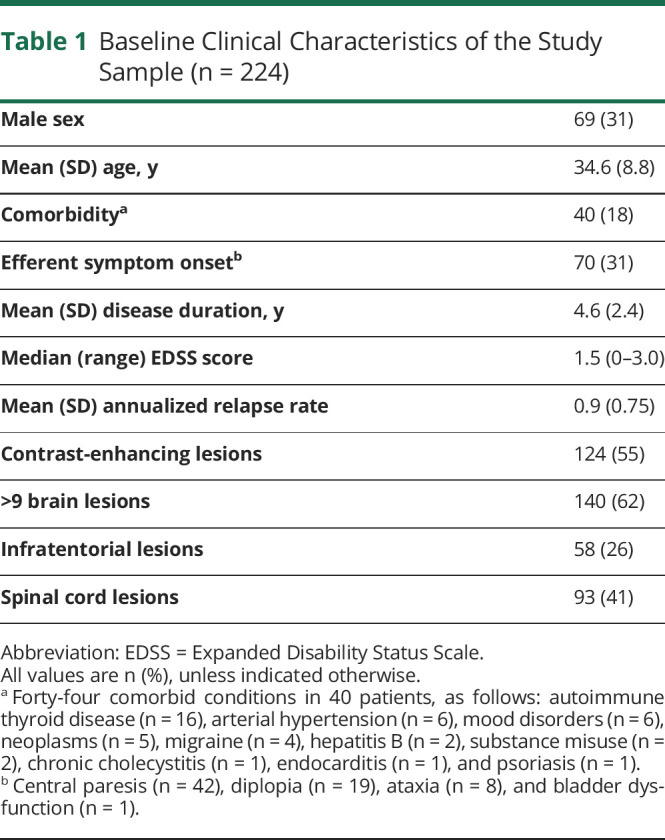
Of 687 patients who started a platform DMT before 2010, we identified 224 (32.6%) with NEDA-3 in the first 2 treatment years with subcutaneous IFNB-1a (n = 111), IM IFNB-1a (n = 47), subcutaneous IFNB-1b (n = 41), or subcutaneous GA (n = 25). Their baseline characteristics are summarized in Table 1. Patients with evidence of disease activity during the initial 2 years of treatment (n = 463) were younger and had greater disability and more pretreatment relapses and CELs than those with NEDA-3 (p ≤ 0.01).
Table 1.
Baseline Clinical Characteristics of the Study Sample (n = 224)
Follow-up
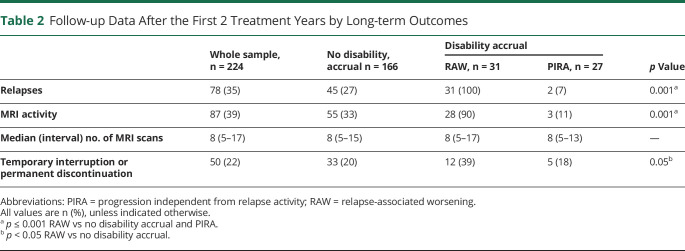
The 224 patients with NEDA-3 in the first 2 treatment years were followed up for a median time of 12 (range: 10–19) years from initial DMT start. The median frequency of MRI assessments was approximately 1 scan every 1.5 years per patient. Despite their NEDA-3 status in the first 2 years, 79 (35%) experienced clinical relapses and 87 (39%) had MRI activity over the following years.
Of the 224 patients, 42 (19%) changed their initial treatment after a median time of 6 (range 3–10) years: 28 switched to oral DMTs because of “needle fatigue” (22 to dimethyl fumarate and 6 to teriflunomide) and 14 escalated to high-effective DMTs for clinical and MRI activities (10 to fingolimod and 4 to natalizumab). Along the follow-up, after a median time of 9 (range 2–17) years, 38 patients (17%) temporarily interrupted (26 because of pregnancy and 12 for patient's decision) and 12 patients (5%) permanently discontinued their initial DMT for loss of adherence. Table 2 summarizes the follow-up data after the first 2 treatment years.
Table 2.
Follow-up Data After the First 2 Treatment Years by Long-term Outcomes
Outcomes
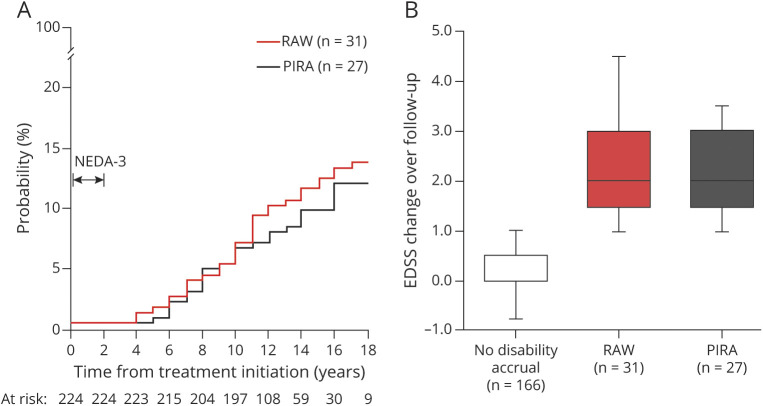
Of the 224 patients, 58 patients (26%) experienced disability accrual: 31 (14%) had RAW and 27 (12%) had PIRA (Figure 1). The median time from treatment start to RAW and to PIRA was 10 (range: 3–18) and 9 (range: 4–15) years, respectively (p = 0.51). Figure 2A shows the CIF for experiencing PIRA and RAW. The median EDSS change over time did not differ between RAW and PIRA subgroups (Figure 2B).
Figure 1. Study Flowchart of Patients' Disposition.
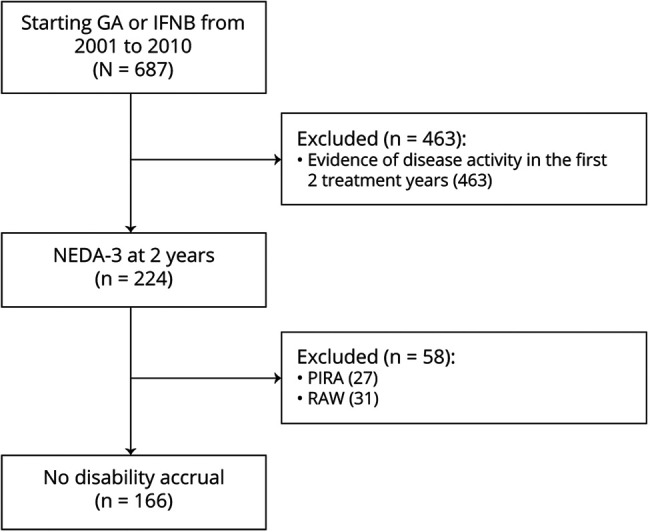
Figure 2. (A) Cumulative Incidence Functions of Progression Relapse-Associated Worsening (RAW) and Progression Independent From Relapse Activity (PIRA) in Patients With No Evidence of Disease Activity-3 (NEDA-3) After 2 Years From Treatment Start; (B) Disability Changes, Expressed as Step of Expanded Disability Status Scale (EDSS), by Long-term Outcomes (n = 224).
After the first 2 treatment years, 47 patients (21%) experienced relapses not associated with disability worsening. MRI activity was more frequent in the RAW subgroup (90%) than in the PIRA subgroup (11%) and in patients without disability accrual (33%). The median number of scans per patient did not differ across subgroups.
In the PIRA subgroup, MRI activity was detected from 2 to 5 years in advance of the disability accrual; therefore, we believe a causal direct connection unlikely. The rate of temporary interruption or permanent discontinuation of the platform DMT during the follow-up was higher in the RAW subgroup (39%) than in the remaining subgroups with PIRA (18%) and without disability accrual (20%), as summarized in Table 2.
As additional analysis, we found RAW more frequent in patients with early disease activity (n = 463) than in those with NEDA-3 (n = 224) in the first 2 treatment years (p < 0.001), whereas there was no difference in patients with PIRA (p = 0.54) (Figure 3). Notably, there was no between-group difference in follow-up time (p = 0.77).
Figure 3. Proportion of Patients Experiencing Relapse-Associated Worsening (RAW) and Progression Independent From Relapse Activity (PIRA) by Disease Activity After 2 Years From Treatment Start (Median Follow-up Time of 12 Years).
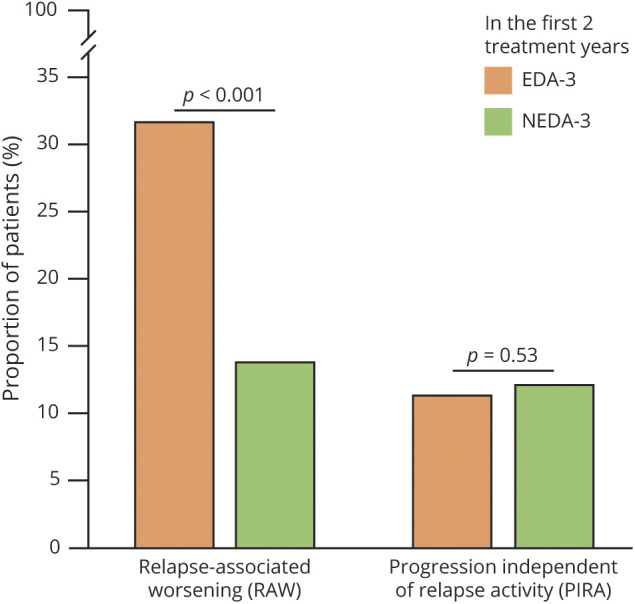
EDA-3 = evidence of disease activity-3 (n = 463); NEDA-3 = no evidence of disease activity-3 (n = 224).
Competing Risk Analyses
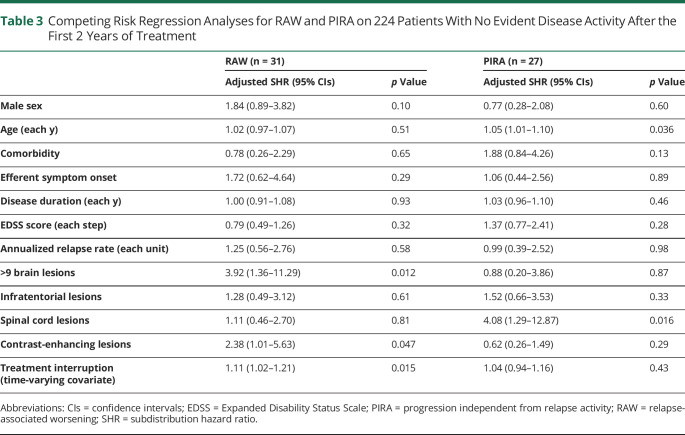
We found different baseline factors associated with RAW and PIRA in patients with NEDA-3 in the first 2 treatment years (Table 3). The risk of RAW was associated with the detection of CELs (adjusted SHR = 2.38, p = 0.047), the presence of >9 T2 lesions (adjusted SHR = 3.92, p = 0.012), and the event of both temporary interruption and permanent discontinuation of the initial DMT (adjusted SHR = 1.11, p = 0.015).
Table 3.
Competing Risk Regression Analyses for RAW and PIRA on 224 Patients With No Evident Disease Activity After the First 2 Years of Treatment
The risk of PIRA was associated with increasing age (adjusted SHR = 1.05 for each year increase, p = 0.036) and the presence of spinal cord lesions at baseline MRI scan (adjusted SHR = 4.08, p = 0.016). Neither temporary interruption nor permanent discontinuation of the initial DMT influenced the risk of PIRA. These findings did not substantially change even after exploring cause-specific HR by classic Cox regression analyses (data not shown).
Discussion
In this study, we explored the long-term outcomes of patients who kept the NEDA-3 status in the first 2 treatment years with their platform DMT. The novelty of our work stands in the competitive risk analysis of RAW and PIRA as 2 different drivers of disability accrual. Although other authors have already approached this issue,2,7,21-23 the competing risk of experiencing RAW or PIRA has never been purposefully investigated before in the real-world setting. We found approximately 3 in 4 patients correctly classified and 1 in 4 patients misclassified on the basis of the NEDA-3 construct because they experienced long-term disability accrual despite achieving the NEDA-3 status in the first 2 treatment years. Although most patients were correctly classified, our finding is clinically relevant because a certain amount of patients had an (apparent) early optimal treatment response, but a long-term disability accrual was nevertheless observed. We should also consider that previous studies demonstrated long-term clinical stability in patients with minimal evidence of disease activity,22,24 thus further reinforcing skepticism about the long-term prognostic value of the NEDA-3, which is mainly weighted on neuroinflammation and focal demyelination parameters rather than on other measures assessing subtle diffuse inflammatory damage and neurodegeneration.4,25 In addition to relapses, disability worsening, and MRI activity, the inclusion of brain volume change over time (the so-called NEDA-4) can provide a more comprehensive and balanced measure for predicting long-term disease evolution.26 However, the longitudinal brain volume assessment is considered unreliable at present14; therefore, our findings reiterate the urgent need for clinical or paraclinical indicators of subtle disability accrual.4
As today, the most promising strategy seems to be a multimodal approach that integrates serologic (neurofilaments) and nonconventional MRI biomarkers, including brain and spinal cord atrophy, smoldering and cortical lesions,27 and neurophysiologic measurements. Unfortunately, all these biomarkers are still not applicable to routine clinical practice.4
In our study, long-term disability accrual was attributable to RAW in 14% of patients and to PIRA in 12% of patients. These findings are somewhat conflicting with previous literature data showing that PIRA events comprised most (approximately 70%–90%) of all disability accrual events in a follow-up time of 2–10 years.5,6,28 These discrepancies can be explained by differences in study design (real-world vs post hoc analyses of randomized clinical trials) and PIRA definition. We calculated EDSS changes using a fixed reference value rather than the more sensitive roving value, possibly leading to an underestimation of the proportion of patients with PIRA as compared with previous studies.28,29 Other studies adopted composite scores to define PIRA events, including the 25-foot walking test, the 9-hole peg test, and the symbol digit modalities test.5,6
In our sample, RAW was associated with focal neuroinflammation parameters such as the presence of >9 T2 brain lesions and CELs on baseline MRI scan, whereas the risk of PIRA was mainly related to advancing age and spinal cord lesions. These findings hold clinically relevant implications because RAW results to be somewhat prevented by the currently available DMTs, whereas PIRA does not seem to be affected by platform treatments. This latter hypothesis is supported by the additional analysis revealing that the initial treatment response predicted the long-term risk of RAW but had no effect on the risk of PIRA. In other words, although we analyzed only patients with NEDA-3 in the first 2 treatment years—thus selecting a sample with an inherent better prognosis—the proportions of PIRA did not differ between patients with NEDA-3 and those who did not in the first 2 treatment years (Figure 3).6,7
Permanent discontinuation or even temporary interruption of the platform DMT resulted associated with an increased risk of RAW. If, on one hand, this is quite expected on the basis of existing literature,30-32 on the other hand, our finding conflicts with other authors who observed better outcomes in those patients who withdrew their DMTs after a prolonged period without relapses.33-35 However, our data discourage permanent discontinuation or even temporary interruption of the initial DMT even in patients who early achieved the NEDA-3 status and remained stable over time.
Basically, PIRA can be comparable with the so-called silent progression.6 Because it occurs in the absence of clinical relapses and MRI activity, silent progression may escape routine clinical assessment, resulting in a misperception of the DMT effectiveness.8 Age at treatment start and presence of spinal cord lesions were the main factors associated with PIRA in apparently stable patients. Emerging evidence supports that both the clinical onset of the progressive phase and its pathologic hallmarks are dependent on age-related processes.36,37 Moreover, increasing age was shown to be associated with a smaller treatment effect of the currently available DMTs.38
High rates of spinal cord lesions have been associated with a more aggressive disease course, regardless of disease duration.39 Our finding is in line with this latter evidence because the damage of long neural pathways, representing functional “bottlenecks” (including the efferent corticospinal tracts for movement), resulted to be associated with neurologic impairment and long-term disability.40
The limitations of our study are intrinsic in its retrospective and observational design, in addition to the relatively small sample size, and the inclusion of only patients initially treated with either GA or IFNB (that was required to obtain long-term data). Consequently, our findings should be limited only to patients under injectable DMTs and cannot be generalized to the newer oral DMTs.
Our long-term outcome was based only on sustained EDSS increase, not encompassing other relevant measures, e.g., upper limb deficit and cognitive impairment.5
Another concern is the retrospective distinction of a ‟bona fide” progression from a permanent ‟inflammation”-related disability worsening.37 According to the last classification of clinical disease course, progression without activity should be determined not only by the absence of clinical relapses but also by the absence of MRI activity assessed at least annually.41 In our study, MRI activity was uncommon in the PIRA subgroup (only 11%) and was always detected several years before the disability accrual. Unfortunately, considering the real-world setting, we cannot rule out that some PIRA events could have been accompanied by MRI activity. Furthermore, our study is based on the past clinical practice of performing an MRI scan at baseline and after 1 and 2 years, whereas current guidelines recommend a rebaseline MRI scan around 3–6 months after baseline to exclude residual disease activity due to the gap between the treatment start and its actual effect.4
We are confident that our study has also some strengths, including the long-term follow-up and the availability of serial MRI scans of the brain and spinal cord with the same scanner for each patient that minimized the potential bias in estimating new T2 lesions. In addition, we adopted a statistical approach (competing risk analysis), which allowed us to explore contrasting outcomes (i.e., disability accrual related to either relapse or progression).
Our study suggests that NEDA-3 does not ensure long-term clinical stability because disability accrual may occur as both RAW and PIRA in a certain proportion of patients. Although RAW can be prevented by high-effective DMTs and by promoting treatment adherence, PIRA largely depends on nonmodifiable (at present) risk factors such as age-related processes and MS-related damage in neural pathways representing functional bottlenecks. Future efforts should thereby focus on better elucidating mechanisms leading to neurodegeneration and neurorestoration to identify the best candidate treatments for slowing disease progression and promoting functional recovery.
Glossary
- CELs
contrast-enhancing lesions
- CIF
cumulative incidence function
- DMTs
disease-modifying treatments
- EDSS
Expanded Disability Status Scale
- GA
glatiramer acetate
- IFNB
Interferon beta
- NEDA-3
no evidence of disease activity-3
- PIRA
progression independent of relapse activity
- RAW
relapse-associated worsening
- RRMS
relapsing-remitting multiple sclerosis
- SHR
subdistribution hazard ratio
- MS
multiple sclerosis
Appendix. Authors
Contributor Information
Serena Ruggieri, Email: serena.ruggieri@gmail.com.
Shalom Haggiag, Email: lvshalom@hotmail.com.
Carla Tortorella, Email: carla.tortorella@gmail.com.
Carlo Pozzilli, Email: carlo.pozzilli@uniroma1.it.
Claudio Gasperini, Email: c.gasperini@libero.it.
Study Funding
The authors report no targeted funding.
Disclosure
L. Prosperini: consulting fees from Biogen, Novartis, and Roche; speaker honoraria from Biogen, Genzyme, Merck-Serono, Novartis, and Teva; travel grants from Biogen, Genzyme, Novartis, and Teva; and research grants from the Italian MS Society (Associazione Italiana Sclerosi Multipla) and Genzyme. S. Ruggieri: personal fees and nonfinancial support from Biogen, Genzyme, Merck-Serono, Novartis, and Teva. S. Haggiag: travel funding and/or speaker honoraria from Biogen, Roche, Genzyme, Novartis, and CSL Behring. C. Tortorella: honoraria for speaking and travel grants from Biogen, Sanofi-Aventis, Merck Serono, Bayer-Schering, Teva, Genzyme, Almirall, and Novartis. C. Pozzilli: scientific advisory boards for Actelion, Biogen, Genzyme, Hoffmann-La Roche Ltd, Merck-Serono, Novartis, Sanofi, and Teva and consulting and/or speaking fees, research support, and travel grants from Allergan, Almirall, Biogen, Genzyme, Hoffmann-La Roche Ltd, Merck-Serono, Novartis, Sanofi, and Teva. C. Gasperini: fees as invited speaker or travel expenses for attending meeting from Biogen, Merck-Serono, Teva, Sanofi, Novartis, and Genzyme. Go to Neurology.org/NN for full disclosures.
References
- 1.Giovannoni G, Tomic D, Bright JR, Havrdová E. ‟No evident disease activity”: the use of combined assessments in the management of patients with multiple sclerosis. Mult Scler. 2017;23(9):1179-1187. [DOI] [PMC free article] [PubMed] [Google Scholar]
- 2.Rotstein DL, Healy BC, Malik MT, Chitnis T, Weiner HL. Evaluation of No evidence of disease activity in a 7-year longitudinal multiple sclerosis cohort. JAMA Neurol. 2015;72(2):152-158. [DOI] [PubMed] [Google Scholar]
- 3.Hegen H, Bsteh G, Berger T. ‟No evidence of disease activity”–is it an appropriate surrogate in multiple sclerosis? Eur J Neurol. 2018;25(9):1107-e101. [DOI] [PMC free article] [PubMed] [Google Scholar]
- 4.Gasperini C, Prosperini L, Tintoré M, et al. Unraveling treatment response in multiple sclerosis: a clinical and MRI challenge. Neurology. 2019;92(4):180-192. [DOI] [PMC free article] [PubMed] [Google Scholar]
- 5.Kappos L, Wolinsky JS, Giovannoni G, et al. Contribution of relapse-independent progression vs relapse-associated worsening to overall confirmed disability accumulation in typical relapsing multiple sclerosis in a pooled analysis of 2 randomized clinical trials. JAMA Neurol. 2020;77(9):1132-1140. [DOI] [PMC free article] [PubMed] [Google Scholar]
- 6.University of California, San Francisco MS-EPIC Team; Cree BAC, Hollenbach JA, Bove R, et al. Silent progression in disease activity-free relapsing multiple sclerosis. Ann Neurol. 2019;85(5):653-666. [DOI] [PMC free article] [PubMed] [Google Scholar]
- 7.University of California, San Francisco MS-EPIC Team; Cree BAC, Gourraud P, Oksenberg JR, et al. Long‐term evolution of multiple sclerosis disability in the treatment era. Ann Neurol. 2016;80(4):499-510. [DOI] [PMC free article] [PubMed] [Google Scholar]
- 8.Filippi M, Rocca MA. Classifying silent progression in relapsing-remitting MS. Nat Rev Neurol. 2019;15(6):315-316. [DOI] [PubMed] [Google Scholar]
- 9.McDonald WI, Compston A, Edan G, et al. Recommended diagnostic criteria for multiple sclerosis: guidelines from the International Panel on the diagnosis of multiple sclerosis. Ann Neurol. 2001;50(1):121-127. [DOI] [PubMed] [Google Scholar]
- 10.Polman CH, Reingold SC, Edan G, et al. Diagnostic criteria for multiple sclerosis: 2005 revisions to the ‟McDonald Criteria.” Ann Neurol. 2005;58(6):840-846. [DOI] [PubMed] [Google Scholar]
- 11.Polman CH, Reingold SC, Banwell B, et al. Diagnostic criteria for multiple sclerosis: 2010 revisions to the McDonald criteria. Ann Neurol. 2011;69(2):292-302. [DOI] [PMC free article] [PubMed] [Google Scholar]
- 12.Kurtzke JF. Rating neurologic impairment in multiple sclerosis: an expanded disability status scale (EDSS). Neurology. 1983;33(11):1444-1452. [DOI] [PubMed] [Google Scholar]
- 13.Filippi M, Rocca MA, Bastianello S, et al. Guidelines from the Italian Neurological and Neuroradiological Societies for the use of magnetic resonance imaging in daily life clinical practice of multiple sclerosis patients. Neurol Sci. 2013;34:2085-2093. [DOI] [PubMed] [Google Scholar]
- 14.Wattjes MP, Rovira À, Miller D, et al. Evidence-based guidelines: MAGNIMS consensus guidelines on the use of MRI in multiple sclerosis: establishing disease prognosis and monitoring patients. Nat Rev Neurol. 2015;11(10):597-606. [DOI] [PubMed] [Google Scholar]
- 15.Brisset JC, Kremer S, Hannoun S, et al. New OFSEP recommendations for MRI assessment of multiple sclerosis patients: special consideration for gadolinium deposition and frequent acquisitions. J Neuroradiol. 2020;47:250-258. [DOI] [PubMed] [Google Scholar]
- 16.Río J, Nos C, Tintoré M, et al. Defining the response to interferon-beta in relapsing-remitting multiple sclerosis patients. Ann Neurol. 2006;59(2):344-352. [DOI] [PubMed] [Google Scholar]
- 17.Erbayat Altay E, Fisher E, Jones SE, Hara-Cleaver C, Lee JC, Rudick RA. Reliability of classifying multiple sclerosis disease activity using magnetic resonance imaging in a multiple sclerosis clinic. JAMA Neurol. 2013;70(3):338-344. [DOI] [PMC free article] [PubMed] [Google Scholar]
- 18.Putter H, Fiocco M, Geskus RB. Tutorial in biostatistics: competing risks and multi-state models. Stat Med. 2007;26(11):2389-2430. [DOI] [PubMed] [Google Scholar]
- 19.Fine JP, Gray RJ. A proportional hazards model for the subdistribution of a competing risk. J Am Stat Assoc. 1999;94(446):496-509. [Google Scholar]
- 20.Austin PC, Fine JP. Practical recommendations for reporting Fine-Gray model analyses for competing risk data. Stat Med. 2017;36(27):4391-4400. [DOI] [PMC free article] [PubMed] [Google Scholar]
- 21.Tsantes E, Curti E, Collura F, Bazzurri V, Fiore A, Granella F. Five- and seven-year prognostic value of new effectiveness measures (NEDA, MEDA and six-month delayed NEDA) in relapsing-remitting multiple sclerosis. J Neurol Sci. 2020;414:116827. [DOI] [PubMed] [Google Scholar]
- 22.Río J, Rovira À, Tintoré M, et al. Disability progression markers over 6-12 years in interferon-β-treated multiple sclerosis patients. Mult Scler. 2018;24(3):322-330. [DOI] [PubMed] [Google Scholar]
- 23.Uher T, Havrdova E, Sobisek L, et al. Is no evidence of disease activity an achievable goal in MS patients on intramuscular interferon beta-1a treatment over long-term follow-up? Mult Scler. 2017;23(2):242-252. [DOI] [PubMed] [Google Scholar]
- 24.Prosperini L, Mancinelli C, Haggiag S, et al. Minimal evidence of disease activity (MEDA) in relapsing-remitting multiple sclerosis. J Neurol Neurosurg Psychiatry. 2020;91(3):271-277. [DOI] [PubMed] [Google Scholar]
- 25.Lassmann H, Brück W, Lucchinetti CF. The immunopathology of multiple sclerosis: an overview. Brain Pathol. 2007;17(2):210-218. [DOI] [PMC free article] [PubMed] [Google Scholar]
- 26.Kappos L, De Stefano N, Freedman MS, et al. Inclusion of brain volume loss in a revised measure of 'no evidence of disease activity' (NEDA-4) in relapsing-remitting multiple sclerosis. Mult Scler. 2016;22(10):1297-1305. [DOI] [PMC free article] [PubMed] [Google Scholar]
- 27.Rocca MA, Filippi M. Targeting progression in multiple sclerosis–an update. Nat Rev Neurol. 2019;15(2):62-64. [DOI] [PubMed] [Google Scholar]
- 28.Kappos L, Butzkueven H, Wiendl H, et al. Greater sensitivity to multiple sclerosis disability worsening and progression events using a roving versus a fixed reference value in a prospective cohort study. Mult Scler. 2018;24(7):963-973. [DOI] [PMC free article] [PubMed] [Google Scholar]
- 29.Lepore V, Bosetti C, Santucci C, Iaffaldano P, Trojano M, Mosconi P. Detection of disability worsening in relapsing-remitting multiple sclerosis patients: a real-world roving Expanded Disability Status Scale reference analysis from the Italian Multiple Sclerosis Register. Eur J Neurol. 2021;28(2):567-578. [DOI] [PubMed] [Google Scholar]
- 30.Siger M, Durko A, Nicpan A, Konarska M, Grudziecka M, Selmaj K. Discontinuation of interferon beta therapy in multiple sclerosis patients with high pre-treatment disease activity leads to prompt return to previous disease activity. J Neurol Sci. 2011;303(1-2):50-52. [DOI] [PubMed] [Google Scholar]
- 31.Kister I, Spelman T, Alroughani R, et al. Discontinuing disease-modifying therapy in MS after a prolonged relapse-free period: a propensity score-matched study. J Neurol Neurosurg Psychiatry. 2016;87(10):1133-1137. [DOI] [PubMed] [Google Scholar]
- 32.Lus G, Signoriello E, Maniscalco GT, et al. Treatment withdrawal in relapsing−remitting multiple sclerosis: a retrospective cohort study. Eur J Neurol. 2016;23(3):489-493. [DOI] [PubMed] [Google Scholar]
- 33.Fagius J, Feresiadou A, Larsson EM, Burman J. Discontinuation of disease modifying treatments in middle aged multiple sclerosis patients. First line drugs vs natalizumab. Mult Scler Relat Disord. 2017;12:82-87. [DOI] [PubMed] [Google Scholar]
- 34.Bsteh G, Feige J, Ehling R, et al. Discontinuation of disease-modifying therapies in multiple sclerosis–clinical outcome and prognostic factors. Mult Scler. 2017;23(9):1241-1248. [DOI] [PubMed] [Google Scholar]
- 35.Moisset X, Fouchard AA, Pereira B, et al. Untreated patients with multiple sclerosis: a study of French expert centers. Eur J Neurol. 2021;28(6):2026-2936. [DOI] [PubMed] [Google Scholar]
- 36.Zeydan B, Kantarci OH. Progressive forms of multiple sclerosis. Neurol Clin. 2018;36(1):163-171. [DOI] [PubMed] [Google Scholar]
- 37.Tomassini V, Fanelli F, Prosperini L, Cerqua R, Cavalla P, Pozzilli C. Predicting the profile of increasing disability in multiple sclerosis. Mult Scler. 2019;25(9):1306-1315. [DOI] [PMC free article] [PubMed] [Google Scholar]
- 38.Weideman AM, Tapia-Maltos MA, Johnson K, Greenwood M, Bielekova B. Meta-analysis of the age-dependent efficacy of multiple sclerosis treatments. Front Neurol. 2017;8:577. [DOI] [PMC free article] [PubMed] [Google Scholar]
- 39.Eden D, Gros C, Badji A, et al. Spatial distribution of multiple sclerosis lesions in the cervical spinal cord. Brain. 2019;142(3):633-646. [DOI] [PMC free article] [PubMed] [Google Scholar]
- 40.Kerbrat A, Gros C, Badji A, et al. Multiple sclerosis lesions in motor tracts from brain to cervical cord: spatial distribution and correlation with disability. Brain. 2020;143(7):2089-2105. [DOI] [PMC free article] [PubMed] [Google Scholar]
- 41.Lublin FD, Reingold SC, Cohen JA, et al. Defining the clinical course of multiple sclerosis: the 2013 revisions. Neurology. 2014;83(3):278-286. [DOI] [PMC free article] [PubMed] [Google Scholar]


