

Abstract
A burgeoning epidemic of drug-resistant tuberculosis threatens to derail global control efforts. Although the mechanisms remain poorly clarified, drug-resistant strains are widely believed to be less infectious than drug-susceptible strains. Consequently, we hypothesised that lower proportions of drug-resistant TB patients would have culturable Mycobacterium tuberculosis from respirable cough-generated aerosols compared to drug-susceptible TB patients, and that multiple factors, including mycobacterial genomic variation, would predict culturable cough aerosol production. We enumerated colony forming units (CFU) in aerosols (≤10μm) from 500 tuberculosis patients (227 with drug-resistance), compared clinical characteristics, and performed mycobacterial whole genome sequencing, dormancy phenotyping, and drug susceptibility analyses on M. tuberculosis from sputum. After considering treatment duration, we found that almost half of drug-resistant tuberculosis patients were cough aerosol culture-positive. Surprisingly, neither mycobacterial genomic variants, lineage, nor dormancy status predicted cough aerosol culture-positivity. However, mycobacterial sputum bacillary load and clinical characteristics, including a lower symptom score and stronger cough, were strongly predictive; thereby supporting targeted transmission-limiting interventions. Effective treatment largely abrogated cough aerosol culture-positivity, however, this was not always rapid. These data question current paradigms, inform public health strategies, and suggest the need to redirect tuberculosis transmission-associated research efforts towards host-pathogen interactions.
Introduction
Drug-resistant tuberculosis (TB), an underdiagnosed disease characterised by high mortality, unsustainable costs, limited effective drugs, and severe treatment-related adverse events, is predominantly caused by airborne transmission rather than reactivation or acquired drug resistance.1 Animal2,3, epidemiological4-8, and modelling studies9,10 all indicate that an infectious minority of patients drive TB epidemics. Understanding and identifying these sentinels of transmission – sometimes termed “super-spreaders” – and rendering them non-infectious is critical for epidemic control.9,11 There are, however, few data about the differential infectiousness of patients with drug-resistant TB12. One important component of infectiousness is the joint ability of the index case and pathogen to generate infectious quanta, which may be approximated using respirable Mycobacterium tuberculosis colony forming units from inhalable cough aerosol13. We hypothesised that drug-resistant and drug-susceptible patients would exhibit large variation in this readout. We reasoned this would be explained by host and mycobacterial factors, including those known fitness-encoding mutations14, given that these genomic variations would likely underpin the ability of more infectious strains to better withstand the environmental stress of aerosolisation, dehydration, airborne travel and deposition than less infectious strains. We also evaluated the effect of treatment on aerosol culture readouts, which has implications for transmission-interruption interventions.
We therefore undertook a large study of respirable cough aerosols (Extended Data Figure 1) from adult drug-susceptible and drug-resistant pulmonary TB patients (n=500 total). Our approach used a cough aerosol sampling system (CASS) (Figure 1A) that enumerates and size-classifies cough aerosol particles that contain culturable M. tuberculosis.13,15,16 We collected comprehensive clinical data that included a previously-described symptom score17, HIV status, lung function, chest radiography, and treatment history. Microbiological information from sputum included Xpert MTB/RIF (Xpert), Nile-Red staining of dormancy-associated M. tuberculosis intracellular fatty acids18, smear microscopy, MGIT960 culture, and, from sputum culture isolates, spoligotyping, whole genome sequencing (lineage, inter-isolate SNP distances, GWAS analyses, genotypic drug susceptibility testing) and phenotypic drug susceptibility testing. Using drug susceptibility data, we categorised patients into Groups 1 (non-rifampicin resistant; n=227), 2 (rifampicin-resistant but not resistant to both fluroquinolones and aminoglycosides; n=162), or 3 (extensively drug-resistant; resistance to rifampicin, fluroquinolones and aminoglycosides; n=109). Patients were treated by TB-programme affiliated health workers using contemporary treatment guidelines19 (CASS status did not inform treatment). We defined “CASS-positives” as patients with any M. tuberculosis aerosol colony forming units (CFUs) and a drug as “likely effective” if resistance was not documented. We re-sampled CASS-positive patients and separately assessed reproducibility. The Methods contains further detail.
Figure 1.
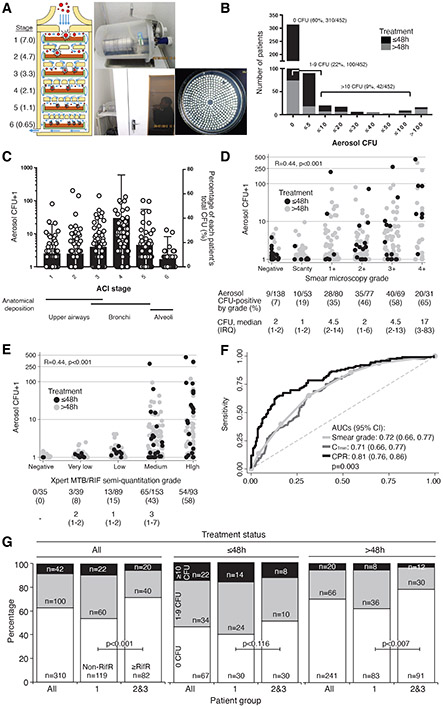
A cough aerosol sampling system (CASS) was used to measure culturable M. tuberculosis in cough aerosol droplets. This system (A) consisted of (i) a six-stage Anderson Cascade Impactor [median expected droplet diameter (μm) for each stage is shown] that (ii) lies horizontally in a 10 l autoclavable chamber that (iii) patients cough into (iv) permitting CFU from individual aerosol droplets to be isolated in a size-dependent manner. (B) Most patients (n=310) were CASS-negative and a minority of CASS-positives with varied CFU readouts (1-310 CFU) were identified. (C) CFU counts were highest in the 2.1-4.7 μm particle size range (stages 3-4) (circles, left y-axis), and, on average, most patients’ total CFU came from particles 2.1-3.3 μm in diameter (stage 4) [bars (standard deviation, right y-axis]. CFU in aerosol correlated with (D) sputum smear microscopy grade and (E) Xpert MTB/RIF semi-quantitation grade [both D and E have the proportion of CASS-positive patients and median (IQR) aerosol CFU in CASS-positives indicated], and (F) these translated into moderate-to-high receiver operator characteristic curve areas under the curves (AUCs) in analyses for CASS-positivity (shown for sputum Xpert MTB/RIF-positive patients) that were improved by a clinical prediction rule. (G) CASS-positivity is shown by patient group and treatment status (all patients, treatment ≤48 h, treatment >48h). Black, grey, and white indicate the proportions of patients with >10, 1-9, or 0 aerosol CFU. P-values are for comparisons of Group 1 vs. Groups 2 and 3 within patients of the same treatment status. After adjustment for treatment status, no differences in CASS-readouts by drug susceptibility were detected (Supplementary Table 4). B, D-E: black indicates no treatment or on treatment ≤48 h, grey indicates treatment >48 h. C and D have logarithmic axes and one was added. A is adapted from 40. Abbreviations: AUC, area under the curve; CASS, cough aerosol sampling system; CFU, colony forming units; CI, confidence interval; IQR, interquartile range; RifR, rifampicin resistant. Missing data: Smear microscopy grade (n=2); Xpert MTB/RIF grade (n=46).
Results
Cohort characteristics
Compared to Group 1, Group 2 and 3 patients had more disease on chest radiography, more previous TB episodes (including more previous drug-resistance episodes), worse lung function [peak expiratory flow (PEF), forced expiratory volume (FEV1)], were more likely to be on treatment for at least 48 h prior to CASS, and, despite more TB drugs, received fewer likely effective drugs (Supplementary Tables 1 and 2).
Frequency of CASS-positivity and relationship with sputum bacillary load
Of 452 patients with reliable (non-contaminated) CASS results, 142 (31%) were CASS-positive (Figure 1B). 42/142 (30%) of CASS-positives had ≥10 CFU from aerosol and on average 60% of patients’ CFUs in particles ≤4.7 μm (hence likely to be deposited in the smallest airways20) (Figure 1C). 24/34 (70%) of Group 2 and 9/23 (40%) of Group 3 CASS-positives were outpatients, reflecting community transmission risk. Although some smear-negatives were CASS-positive [9/137 (7%)], aerosol CFU positively correlated with sputum bacillary load (Figures 1D-E), which permitted the diagnostic accuracy of different markers for CASS-positivity to be calculated (Supplementary Table 3). Receiver operator characteristic areas under the curves (smear grade, CTmin; Figure 1F) were similar and, at rule-out thresholds (≥95% sensitivity), specificities were suboptimal (42% for smear, 33% for Xpert). At rule-in thresholds (≥95% specificity), sensitivities were poor (14%, 15%).
Relationship between CASS positivity and duration of treatment
Before accounting for treatment duration, a greater proportion of Group 1 patients were CASS-positive than in Groups 2 and 3 combined [82/201 (41%) vs. 60/249 (24%); p<0.001] (Figure 1G). In patients not on treatment or treatment ≤48h, similar proportions of Group 1 patients compared to Groups 2 and 3 combined were CASS-positive [38/73 (52%) vs. 18/48 (48%); p=0.116]. Overall, CASS-positivity was more frequent in patients on treatment for shorter durations [e.g., Group 1: 28/73 (53%) ≤48h vs. 86/329 (26%) >48h, p<0.001; Supplementary Table 4]. Aerosol CFU exhibited a similar pattern (Extended Data Figure 2). However, some patients posed an infectious risk despite likely effective treatment and adherence per records. For example, amongst Group 1 patients who had been on treatment for durations of three, four, five and six days prior to CASS, 9/26 (35%), 11/31 (35%), 12/37 (32%), and 7/26 (27%) were CASS-positive, respectively (Supplementary Tables 5 and 6).
Predictors of CASS positivity
In unadjusted univariate analyses (Table 1), CASS-positivity was associated with younger age, male sex, smoking, being community-based, a lower symptom score, no HIV infection, not receiving TB treatment, better lung function (PEF, FEV1), higher peak cough flow (PCF), viscous sputum (purulent or mucopurulent), sputum bacillary load, and drug-susceptibility (patient group). When symptom information, including the components of the symptom score were examined by CASS status, CASS-positives were more likely to self-report as having cough (and the coughing of phlegm) as a symptom, and had higher median middle upper arm circumference (Supplementary Table 8). However, in multivariate analyses, a lower symptom score, stronger PCF, treatment status, and increased sputum bacillary load independently-predicted CASS-positivity. HIV-positives were also, compared to HIV-negatives, less likely to be CASS-positive. HIV-positives had, amongst other differences, more morbidity (higher symptom score), less sputum bacillary load, less chest disease and cavitation, and less viscous sputum (Supplementary Table 9). Overall, Group was significantly associated with CASS status in multivariate models, likely due to longer treatment durations in Groups 2 and 3 compared to Group 1. Although pulmonary cavitation was weakly associated with sputum bacillary load and CASS-positivity (Extended Data Figure 3), it was not associated with CASS-positivity in multivariate models. In a clinically-orientated model with data available from rapid diagnostic tools including sputum bacillary load, a clinical prediction rule had higher AUC than Xpert CTmin alone; correctly classifying approximately double the proportion of CASS-positives [32% (95% CI: 24, 41) vs. 15% (9, 22), p<0.001)] (Figure 1F, Supplementary Table 3).
Table 1.
Univariate and multivariate logistic regression analyses of predictors of cough aerosol culture-positivity. When analyses were repeated restricted to patients on treatment >48h (Supplementary Table 15), the same predictors remained significant. Data are median (IQR) or n/N (%) unless otherwise stated.
| Univariate analyses (n=452) | Multivariate analyses† | |||||||
|---|---|---|---|---|---|---|---|---|
| Sputum culture-positive n=254 |
Sputum Xpert MTB/RIF-positive n=377 |
|||||||
| CASS- negative (n=310) |
CASS- positive (n=142) |
Unadjusted odds ratio (95% CI) |
P- value |
Adjusted odds ratio (95% CI) |
P- value |
Adjusted odds ratio (95% CI) |
P-value | |
| Demographic characteristics | ||||||||
| Age, years | 35 (28-45) | 33 (27-43) | 9.83 (9.65, 10.00) (per 10 years) | 0.061 | - | - | ||
| Female sex | 137/308 (45) | 43/142 (30) | 0.54 (0.36, 0.83) | 0.004 | - | - | ||
| Smoker (current or previous) | 184/308 (60) | 100/142 (70) | 1.59 (1.03, 2.43) | 0.034 | - | - | ||
| Based in the community | 195/308 (63) | 117/142 (83) | 2.69 (1.65, 4.38) | <0.001 | - | - | ||
| Clinical characteristics ‡ | ||||||||
| TB symptom score‡‡ | 4 (2-5) | 3 (2-5) | 0.91 (0.63, 1.00) (per unit) | 0.054 | 0.78 (0.68, 0.90) (per unit) | 0.001 | 0.79 (0.69, 0.91) (per unit) | 0.001 |
| HIV-positive | 142/307 (46) | 41/141 (29) | 0.48 (0.31, 0.74) | 0.001 | 0.41 (0.23, 0.75) | 0.003 | 0.55 (0.32, 0.96) | 0.034 |
| On TB treatment >48 h§ | 241/308 (78) | 77/142 (54) | 0.33 (0.21, 0.50) | <0.001 | - | - | 0.54 (0.31, 0.94) | 0.030 |
| Prior TB | 167/308 (54) | 67/142 (47) | 0.75 (0.51,1.12) | 0.165 | - | - | - | - |
| CXR disease extent | ||||||||
| Bilateral* | 208/276 (75) | 100/130 (77) | 1.09 (0.67, 1.78) | 0.732 | - | - | - | - |
| Any cavitation | 99/276 (36) | 66/130 (51) | 1.84 (1.21, 2.81) | 0.004 | ||||
| Lung function | ||||||||
| PEF (l/min) | 165 (58-252) | 223 (43-280) | 1.22 (1.04, 1.40) (per 100 units) | 0.014 | - | - | - | - |
| PCF (l/min) | 300 (240-363) | 330 (280-397) | 10.05 (10.02, 10.07) (per 10 units) | <0.001 | 10.08 (10.04, 10.11) (per 10 units) | <0.001 | 10.07 (10.03, 10.10) (per 10 units) | <0.001 |
| FEV1 (l) | 1.2 (0.46-1.70) | 1.49 (0.65-1.86) | 1.42 (1.06, 1.91) (per unit) | 0.018 | - | - | - | - |
| Aerosol sampling | ||||||||
| Cough count during sampling session | 83 (62.5-107) | 85.5 (66-110) | 1.03 (0.99, 1.11) (per 10 units) | 0.259 | - | - | - | - |
| Ambient conditions | ||||||||
| Room temperature (°C) | 19.3 (17.8-22.1) | 20 (18-22.3) | 1.04 (0.97, 1.11) | 0.260 | - | - | - | - |
| Humidity | 61 (56-69) | 62.5 (55-72) | 1.01 (0.99, 1.03) | 0.335 | - | - | - | - |
| Sputum microbiology | ||||||||
| Nile-Red positive bacilli (in patients with a sputum smear grade ≥2+), mean proportion (SD) | 0.76 (0.30) | 0.80 (0.59) | 1.24 (0.41, 3.81) | 0.701 | ||||
| Sputum viscosity | ||||||||
| Salivary/mucosalivary | 188/259 (73) | 73/124 (59) | Reference | N/A | - | - | - | - |
| Purulent/mucopurulent | 71/259 (27) | 51/124 (41) | 1.86 (1.19, 2.91) | 0.007 | - | - | - | - |
| Smear grade | Omitted in favour of time-to-positivity | Omitted in favour of CTmin | ||||||
| Negative | 127/306 (42) | 91/142 (6) | Reference | N/A | - | - | ||
| Positive | 179/306 (58) | 133/142 (94) | 10.49 (5.14, 21.38) | <0.001 | - | - | ||
| Scanty | 43/306 (14) | 10/142 (7) | 3.28 (1.25, 8.61) | 0.016 | - | - | ||
| P+ | 54/306 (18) | 28/142 (20) | 7.31 (3.24, 16.54) | <0.001 | - | - | ||
| P++ | 42/306 (14) | 35/142 (25) | 11.76 (5.22, 26.47) | <0.001 | - | - | ||
| P+++ | 29/306 (10) | 40/142 (28) | 19.46 (8.50, 44.55) | <0.001 | - | - | ||
| P++++ | 11/306 (4) | 20/142 (14) | 25.65 (9.45, 69.69) | <0.001 | - | - | ||
| Xpert-positive | 252/287 (87) | 136/136 (100) | Non-calcuable | <0.001 | Omitted in favour of time-to-positivity | N/A | N/A | |
| CTmin | 21.6 (17.7-26.2) | 17.3 (14.7-19.8) | 0.84 (0.80, 0.88) (per unit) | <0.001 | - | 0.80 (0.76, 0.86) | <0.001 | |
| Culture-positive | 253/297 (85) | 141/142 (99) | 24.58 (3.35, 180.38) | 0.002 | N/A | N/A | Omitted in favour of CTmin. Culture unavailable for rapid decision making | |
| TTP (days) | 12 (8-16) | 8 (5-10) | 0.80 (0.76, 0.86) | <0.001 | 0.78 (0.72, 0.84) | <0.001 | - | - |
| Strain family (spoligotype) | ||||||||
| Beijing | 159/245 (65) | 86/138 (62) | Reference | N/A | - | - | - | - |
| LAM | 30/245 (12) | 18/138 (13) | 1.06 (0.55, 2.03) | 0.821 | - | - | - | - |
| T | 35/245 (14) | 18/138 (13) | 1.54 (0.50, 4.74) | 0.368 | - | - | - | - |
| X | 4/245 (2) | 2/138 (1) | 0.52 (0.51, 1.79) | 0.890 | - | - | - | - |
| Other | 7/245 (3) | 7/138 (5) | 1.40 (0.50, 5.01) | 0.267 | - | - | - | - |
| Unknown | 10/245 (4) | 7/138 (5) | 0.90 (0.16, 5.02) | 0.651 | - | - | - | - |
| Lineage (WGS)** | - | - | - | - | ||||
| 2.2.1 (East-Asian – Typical Beijing) | 69/201 (34) | 34/112 (30) | Reference | N/A | - | - | - | - |
| 4 (Euro-American) | 70/201 (35) | 40/112 (36) | 1.16 (0.66, 2.04) | 0.608 | - | - | - | - |
| 2.2.2 (East-Asian – Atypical Beijing) | 37/201 (18) | 14/112 (13) | 0.77 (0.37, 1.61) | 0.484 | - | - | - | - |
| 3 (East-African-Indian) and 1 (Indo-Oceanic) | 1/201 (0) | 3/112 (3) | 6.09 (0.61, 60.73) | 0.124 | - | - | - | - |
| 2.2.1.1 (East-Asian – Typical Beijing) | 24/201 (12) | 21/112 (19) | 1.78 (0.87, 3.63) | 0.116 | - | - | - | - |
| Drug-resistance category | ||||||||
| Group 1 (Rifampicin susceptible) | 119/308 (39) | 82/142 (58) | Reference | N/A | Reference | N/A | Reference | N/A |
| Group 2 (Rifampicin resitant but not XDR) | 112/308 (36) | 36/142 (25) | 0.47 (0.29, 0.75) | 0.001 | 0.48 (0.26, 0.90) | 0.023 | 0.45 (0.25, 0.82) | 0.010 |
| Group 3 (XDR) | 77/308 (25) | 24/142 (17) | 0.45 (0.26, 0.77) | 0.004 | 0.57 (0.27, 1.21) | 0.144 | 0.51 (0.25, 1.01) | 0.053 |
| Groups 2 and 3 combined | 119/308 (37) | 60/142 (42) | 0.46 (0.31, 0.69) | <0.001 | Omitted in favour of individual groups (1, 2, or 3). | |||
Patients with a normal CXR were pooled with those with unilateral disease for the comparison with patients with bilaterial disease.
Data on cough duration, which had no association with CASS status, is in Supplementary Table 7.
Values as in the final models.
Due to the small number of patients not on any treatment whatsoever, a treatment duration cut-point of 48h was used.
Sub-lineages categories collapsed when less than 10 isolates were in a category.
Defined in Methods per Wejse et al., 200917. Additional analyses comparing the components of the TB symptom score, as well as other symptom information, by CASS status are in Supplementary Table 8.
Abbreviations: CASS, cough aerosol sampling system; CTmin, minimum cycle threshold value; CXR, chest radiography; IQR, interquartile range; PEF, peak expiratory flow; FEV, forced expiratory volume; SD, standard deviation; TTP, time-to-positivity; WGS, whole genome sequencing.
Relationship between CASS status and mycobacterial factors
Neither lineage (overall in Table 1 and after patient group stratification in Supplementary Table 10; cladogram in Extended Data Figure 4) nor M. tuberculosis genomic variants (SNPs, SNP interactions) were associated with CASS-positivity in univariate analyses [in all patients (Figure 2A) or stratified by clinically-important subgroups (Figure 2B)], a multivariate logistic regression model including two principal components, patient age, symptom score, HIV-status, duration of treatment less than 48h, PCF, culture time to positivity, and drug-resistance category (Extended Data Figure 5) or in interaction, phylogenetic convergence or efficient mixed-models analyses either per nsSNP, nsSNP per gene (Supplementary Table 11) or nsSNP per pathway. Nonsynonymous rpoB and pks1 variants trended towards associations but did not reach significance. When the frequency of putative fitness- and/or compensatory-mutations was examined, no associations were detected with CASS positivity (Supplementary Table 12). Furthermore, when the size, distance, and connectedness between clusters based on inter-isolate SNP distances were examined by CASS status, no associations were detected (Supplementary Table 13). When a GWAS analysis was performed by previous TB history (which may indicate a propensity of some strains to be transmitted; Supplementary Table 14) no associations were detected. Lastly, sputum-based Nile-Red staining did not detect an association with CASS-positivity (Figure 2B).
Figure 2.
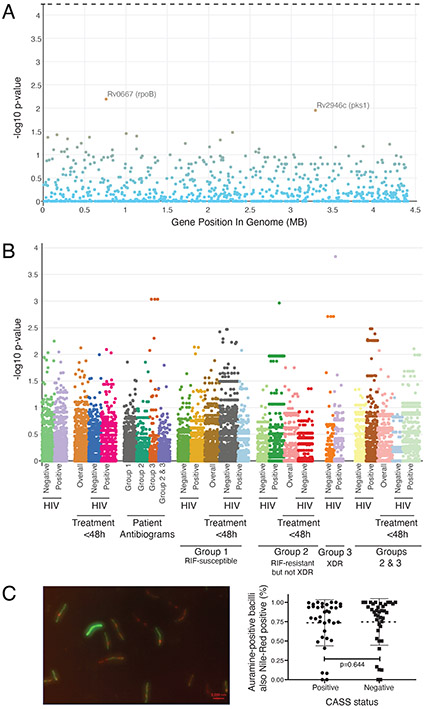
Comparison of mycobacterial factors in CASS-positive and negative patients. (A) Manhattan plot showing that whole genome sequencing of sputum culture isolates identified no variants associated with CASS-status that met significance thresholds (n=115 CASS-positives, n=203 CASS-negatives). The top variant was in rpoB (a S531L mutation known to cause rifampicin resistance). The dashed lines above panel represent the p-value threshold for significant associations. (B) Analyses sub-stratified by patient group, treatment status, and HIV status reached similar conclusions [Supplementary Table 11 shows the top three SNPs (with and without population correction) in each stratum]. (C) A representative image of Auramine and Nile-Red strained sputum showing a mixture of Auramine-positive bacilli (green) with or without Nile-Red co-localisation (red; left panel) and a dot plot (mean, standard deviation) of the proportion of Auramine-positive bacilli also Nile-Red positive (Nile-Red results are also in the Supplement).
Relationship between CASS status, regimen, and likely drug effectiveness
We next examined the association of drug regimen with CASS-positivity in patients on treatment at the time of initial sampling. In univariate analyses, CASS-positivity was inversely associated with each additional drug in the regimen [OR (95% CI) 0.77 (0.67, 0.88) per drug irrespective of likely effectiveness; p<0.001] and a fluoroquinolone (FQ)-based regimen [0.36 (0.22, 0.57); p<0.001] (Supplementary Table 15). A FQ-based regimen was the only drug variable significant in a multivariate model [adjusted OR 0.34 (0.17, 0.65); p=0.001] amongst all patients on treatment, including after accounting for treatment duration. When analyses were limited to patients who received only a first-line or FQ-based regimen, likely drug effectiveness was not association with CASS-positivity, with the exception of ethionamide [0.12 (0.02, 9,94; p=0.044], however, this association only occurred in a univariate analysis.
Repeat CASS sampling in patients initially CASS-positive
We repeatedly sampled baseline CASS-positive patients in Groups 1, 2, and 3 [66/80 (83%), 29/34 (85%), and 18/23 (78%) re-sampled at least once during treatment (Figure 3). 3/66 (5%) in Group 1 were repeat CASS-positive despite likely effective treatment and adherence, the one repeat positive Group 2 patient was non-adherent, and 7/18 (40%) Group 3 patients that were initially CASS-positive displayed prolonged CASS-positivity; however, the number of likely effective drugs overall was low (Supplementary Tables 16-17). Furthermore, three Group 3 CASS-positive patients not on any treatment were repeat CASS-negative. In a separate cohort of pre-treatment TB patients (n=29; Supplementary Tables 18-19), CASS was most reproducible across morning samplings (“fair”21 CASS-positivity kappa; “substantial”22 aerosol CFU intraclass correlation coefficient).
Figure 3.
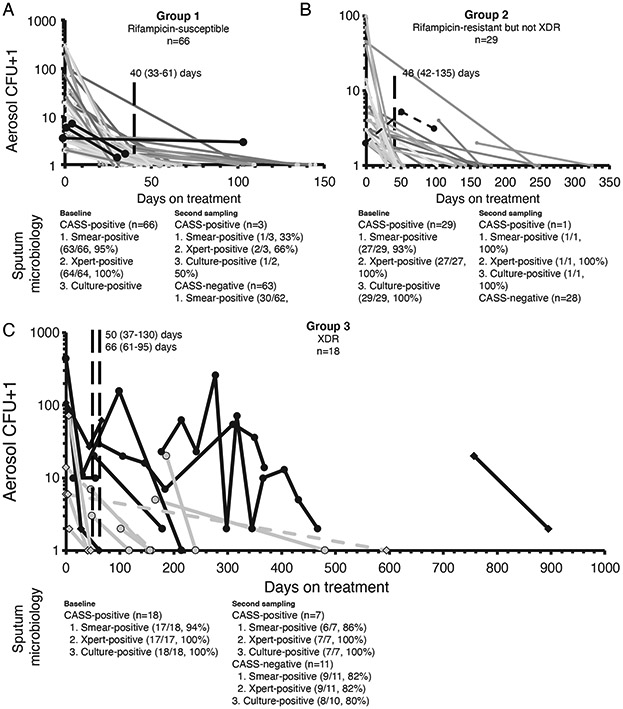
Repeat cough aerosol sampling results in patients initially CASS-positive who were re-sampled until CASS-negative. Days on treatment for the current episode are shown for all patients except the one, six and three in Groups 1, 2, and 3, respectively who were not on any TB treatment between CASS readings (dashed lines). Most Group 1 (A) and all adherent Group 2 (B) patients were CASS-negative at repeat sampling after treatment and many Group 3 patients were repeatedly CASS-positive (C), however, the Group 3 patients they were on a low number of likely effective drugs (Supplementary Tables 16-17). Each line represents a patient and each symbol a sampling event (CASS and sputum microbiology). Microbiology (microscopy, Xpert MTB/RIF, culture) from paired sputa, shown below each graph, and continued to have poor diagnostic accuracy for CASS-positivity. All patients on treatment, irrespective of the treatment’s likely effectiveness, are shown. Patients CASS-positive more than once are shown as thick black lines (lines in grey represent patients only CASS-positive at baseline). Diamonds in (C) indicate patients discharged with programmatically uncured drug-resistant TB (three baseline CASS-positives of this type, indicated by a dashed line, who were not on any treatment were CASS-negative at re-testing). Vertical dashed lines indicate the median days to the second and third CASS. Y-axes are logarithmic and one was added to CFU counts.
Discussion
Our two main findings are that almost half the patients with drug-resistant TB (including community-discharged programmatically incurable patients – either not on treatment or on treatment for less than 48 h – had culturable and respirable bacilli in their cough aerosol, and there was no association between CASS-positivity and mycobacterial genomic variants. Other key findings were that 1) mycobacterial physiological state was similar in CASS-positives versus negatives, 2) specific host factors (fewer symptoms, stronger cough, no HIV, treatment ≤48h) and mycobacterial factors (higher sputum bacillary load) independently predicted the presence of culturable bacilli in cough aerosol, 3) a subset of patients were CASS-positive during likely effective treatment for up to a week (although more pronounced for drug-resistant TB, this was also observed for drug-susceptible TB), and 4) fluoroquinolone-based regimens were strongly associated with reduced aerosol culture load.
The differential transmissibility of drug resistant strains is controversial12. We have now shown that patients with drug-resistant TB have high M. tuberculosis culturability from respirable aerosol. We hypothesised that lineage and genomic variants influence CASS-positivity; however, we found no such linkages. This suggests that post-aerosolisation mediators of strain success, including host genetic background, inhalational burden reaching alveoli, and repetitive infection events, likely play an important role. Lastly, sputum with frequent Nile-Red positivity is associated with reduced culturability39,40 but we did not detect associations with CASS-positivity.
We identified new host factors that overwhelmingly drove the presence of culturable M. tuberculosis in cough aerosol droplets, in addition to those described earlier.16,23 Our finding that patients with a lower symptom score are more likely to have culturable cough aerosol supports case finding strategies that target patients who do not necessarily have severe symptoms but cough. The advent of portable molecular diagnostics makes this approach feasible24. Further investigation of CASS-positivity, infectiousness, and transmission in minimally symptomatic patients is required.
Patients with drug-sensitive TB are often considered non-infectious two weeks after effective treatment initiation25,26 and an animal model suggests that, even within 48 h, drug-resistant cases may not transmit27. We found 34% of drug-susceptible cases on likely effective treatment for at least 48 h were CASS-positive, and ~30% of patients on treatment for six days were CASS-positive (including Group 1 patients on likely effective treatment and patients with drug-resistant TB). Although we did not recruit drug-susceptible cases on treatment beyond two weeks, a low proportion of drug-susceptible CASS-positives (4%) were still CASS-positive a month after their initial sampling, suggesting the presence of a persistently infectious subset of patients. This may be because of suboptimal pharmacokinetics, poor cavitary penetration28, heteroresistance, or undocumented treatment non-adherence. These data support cautious approaches to decide when TB patients are non-infectious.26,29 Indicative of few treatment options available at the time, when baseline Group 3 CASS-positives were re-sampled, 40% remained CASS-positive – including some after more than a year of treatment. This underscores the need for scale-up of new drugs and provision of community-based palliative and long stay facilities30. Our inability to establish an accurate clinical prediction rule suggests the need for a user-friendly test for CASS-positivity.
A strength and limitation of our approach is that we measured a key component of infectiousness rather than transmission itself, which is a complex multifactorial process31, and would require a large long-term study of thousands of secondary cases. Indeed, we could not measure the effect of antimycobacterial therapy on additional stresses during survival in aerosol, inhalation, alveolar germination, and contact immunity; all of which animal models do32-34, and we did not investigate host immunology and genetics. However, CASS-measured cough aerosol culturability is a biomarker highly associated with human transmission-related outcomes (skin test conversion and incident TB) and better than traditional markers such as the sputum smear microscopy 16,35; however, more data are needed, especially from settings with different intensities of community-based TB transmission. CASS-negative patients may still transmit M. tuberculosis if exposure is prolonged, repetitive, or in poorly ventilated areas, and strains with reduced CASS culturability may still generate secondary cases. Characterising M. tuberculosis in aerosol, especially in its de novo physiological state, is challenging and we hence interrogated sputum Nile Red status, however, this measures only one dimension of dormancy and alternative methods of measuring viable non-culturable bacilli36 might be more sensitive. We used short read sequencing to investigate the M. tuberculosis genome and may have missed features in repetitive regions or epigenetic components that may a role in CASS-positivity. Although our strains reflect our local epidemiology37, studies in different settings may detect a role for strain lineage. While we used a combined phenotypic and genotypic scheme to determine drug-susceptibility, the Sensititre MYCOTB phenotypic platform has suboptimal reproducibility for some drugs38. Finally, new drug-resistant TB regimens are being scaled-up and early evidence39 suggests that specific combinations and doses may not rapidly abrogate infectiousness. The effect of these regimens on CASS readouts should be measured, ideally at pre-specified time points throughout treatment, which would allow for the accurate measurement of time to aerosol sterilisation.
In conclusion, drug-resistant TB patients have high numbers of culturable M. tuberculosis in respirable cough aerosol. Mycobacterial genomic variation and physiological state (defined by Nile Red staining) were not associated with culturable aerosols. M. tuberculosis was isolated from cough aerosol cultures from patients for up to six days despite likely effective treatment, and patients not receiving high numbers of effective drugs displayed prolonged CASS-positivity for long periods. The increased risk of culturable M. tuberculosis in respirable aerosol from patients with lower symptom scores support the urgent need for interventions to target such patients.
Methods
Study design and eligibility criteria
We used a cross-sectional study design with prospective follow-up. There was a longitudinal component with repeated measures in the subset of patients CASS-positive at their first sampling (who were re-sampled until CASS-negative). To enter the study, patients had to be ≥18 years, and willing to provide two sputa and undergo cough aerosol sampling. We excluded patients who did not provide informed consent, had eaten within hours, or had blood in their spit or sputum. We recruited patients with DS-TB or MDR-TB as close as possible to treatment initiation (including pre-treatment). Patients with second-line resistance were recruited as close as possible to admission to Brooklyn Chest Hospital (BCH; a provincial DR-TB referral hospital in Cape Town) where the CASS was installed, however, if no recently admitted inpatients were available nor any patients who had not yet started treatment, we recruited patients whose most recent smear or culture results (done for treatment monitoring as part of routine care) were positive. We also recruited programmatically home-discharged patients with uncured drug-resistant TB. We aimed to recruit at least 100 patients per patient group (Groups 1, 2, and 3), expecting 20-30% in each to be CASS-positive.
Participant identification
We identified outpatients through a programmatically-generated list of Xpert MTB/RIF-(Xpert) or smear-positive patients at clinics in Cape Town received weekly from the National Health and Laboratory Service in Cape Town, South Africa from February 2013 to July 2017. This list contains results from across the metropole of Cape Town (we did not place restrictions on patient location or patient type). We prioritised recruitment of rifampicin-resistant patients. Inpatients were identified through the screening of BCH admission logs. The programmatically home-discharged patients were identified from a previously-described registry1.
Patient clinical information
Consenting patients underwent a nurse-administered clinical examination, including symptom severity (TBscore)2, HIV-testing, and chest radiography (radiographs were read in a blinded standardised manner by a trained reader3; Supplementary Table 21). Peak expiratory flow (PEF), forced expiratory volume (FEV1) and peak cough flow (PCF) were measured using an Asma-1 Electronic Respiratory Monitor (Vitalograph, United Kingdom) and a Respi-Aide Peak Flow Meter (GaleMed, China). The average of three consecutive blows were used. All procedures were done at one visit in the same order.
Sputum microbiology
Patients expectorated two sputa, one of which was arbitrarily selected for Xpert (Cepheid) and the other NALC-NaOH decontaminated before double Ziehl-Neelsen concentrated smear microscopy4 and one MGIT 960 liquid culture (BD, United States) done in an accredited laboratory by a trained technician. Patients needed at ≥1 positive smear (including scanty) to be classified as smear-positive. When gradings were discrepant, the highest was used. The viscosity of the sputum used for Xpert was graded by appearance5 and an aliquot used for Auramine O-Nile Red staining to detect dormancy-associated intracellular lipid bodies.6 Culture isolates were confirmed as positive for acid-fast bacilli (AFB) and M. tuberculosis complex (MTBDRplus, Hain Lifesciences) and used for minimum inhibitory concentration determination using Sensititre MYCOTB plates (Thermofisher, United States; Supplementary Table 22).7
Sputum Auramine-Nile Red staining
We used a modified version of previously-described protocols.6,8 Briefly, a NALC-NaOH decontaminated sputum was centrifuged and resuspended in 125 μl phosphate buffer. 30 μl of the resuspension was mixed with 10 μl fixative (National Health Laboratory Service) and the mixture smeared on a slide before fixation using a heating block at 80 °C for 2 h. In parallel, an additional 125 μl phosphate buffer was added to the resuspended decontaminated sputum (to minimise background fluorescence seen in some specimens) and the same procedure followed using both undiluted and diluted slides. Once heat fixed, the slide was sprayed with Mercofix (Merck, United States). Prior to visualization, the slide was flooded with Auramine O (National Health Laboratory Service, South Africa) for 15 min, rinsed with water, decolourised with 0.5% (v/v) acid alcohol, rinsed again, flooded with Nile Red solution (Sigma-Aldrich, South Africa; 10 μg/ml in phosphate buffered saline), rinsed again, flooded with 0.1% (w/v) potassium permanganate for 1 min, rinsed a final time and dried. Three drops of Mowiol mounting agent with DABCO (Merck, United states) were added and slides visualised within 24 h using an 880 LSM confocal microscope (Carl Zeiss, Germany) and Zen 2011 software (Carl Zeiss, Germany). Stained slides were stored in the dark at 4 °C before visualisation. We counted bacilli with intact Auramine O-positive cell walls as positive for M. tuberculosis up to a maximum of 100 per slide. After Auramine O-positive bacilli were identified, we switched to the red-light channel and counted the proportion with Nile Red-positive co-localisation. We encountered significant levels of Nile Red-positive background that made it difficult to consistently distinguish individual cells. After consultation with an imaging specialist, we only counted Auramine O-positive bacilli as Nile Red-positive if the intensity of the red light at that location was at least 50% higher than the background red. Each slide was independently counted by at least two trained readers and the average proportion reported. If readers’ counts differed by ≥20%, a third reader was used and the average of the two closest counts reported. We only did Nile Red staining on sputum due to concentrations of bacilli in aerosol below the limit of detection.
Cough aerosol sampling
Procedure
The CASS9 consists of a six-stage Andersen Cascade Impactor (ACI; Thermofisher, United States) for viable air sampling within a 10 l polypropylene chamber (the maximum autoclavable size in our laboratory). CASS collects aerosol in a particle size-dependent manner. Each ACI stage holds 7H11 solid agar plates (Middlebrook, United States) supplemented with OADC (Middlebrook) and Selectatab (Kircher, United States). CASS was done before sputum expectoration, typically by late morning, using a modified version of a previously-described procedure.9 The process was overseen by a specially trained and GCP-accredited research nurse. Briefly, patients coughed as forcefully and as frequently as possible into the CASS for 5 min via a 1 m silicone pipe that ran from the patient in a sputum induction booth into the 10 l chamber. Ambient temperature and humidity and the number of coughs were recorded. For all CASS samplings (as with all other clinical and microbiological methods), measurements were done once off per visit. The same patients or specimens were not measured repeatedly at a single visit.
Biosafety
The apparatus was autoclaved after each use and the plates loaded in a class-2 biosafety cabinet. chamber. The 1 m pipe patients coughed into which was chemically-disinfected and autoclaved after each use. A disposable mouthpiece was used. After passing through the ACI, air was drawn through high efficiency HEPA filters (Whatman, United States) in a filter holder (Model IDN-6G, Parker Hannifin, United States) by a pump (Thermo Fischer, United States) at 28 l/min. Flow rate was monitored using a flow meter (SKC, United States) calibrated using a gas flow calibrator (Dri Cal, United States). After completion, CASS parts were double-bagged, transported to the Stellenbosch University Biosafety Level-3 facility, dissembled and autoclaved. If patients had to expectorate sputum during CASS, they first turned away from the sampling pipe.
Microbiology
Plates from the ACI were incubated for 10 weeks at 37 °C and checked weekly for growth from week four and AFB-positive CFU counted. Plates overgrown with non-acid fast contaminants were discarded. Patients with contaminated aerosol had unknown CASS status (method of designation as contaminated below).
Classification of agar plates as contaminated
Agar plates from the ACI were checked for M. tuberculosis CFU (off-white, grey, crinkled and Ziehl-Neelsen acid fast bacilli positive) for eight weeks. The presence and morphology of any other growth were recorded. Plates with non-M. tuberculosis growth, which most frequently appeared fungal, were transferred to a separate container. These plates were subsequently checked for M. tuberculosis CFU weekly until a lawn of overgrowth was seen. Plates were discarded prior to eight weeks if overgrown. The median (IQR) time until M. tuberculosis CFU detection was 28 (25-39) days. We classified patients as having contaminated aerosol if 1) no M. tuberculosis CFU were observed and 2) at least three (half of their total plates) were discarded prior to the median time to M. tuberculosis CFU detection (28 days). Such patients could not be confidently classified as CASS-positive or – negative.
Repeat CASS sampling
As soon as a patient’s CASS plates had grown CFU, the patient was rescheduled for another CASS sampling (and a repeat of sputum microbiological tests). This process was repeated until a negative CASS readout was obtained. The only eligibility criterion for repeat sampling was thus a prior positive CASS result. As CFU take up to 10 weeks to grow, some repeat CASS-positive patients could not be re-sampled as they were lost to follow-up, deceased, or declined further participation.
Reproducibility sub-study
We used a modified version of a previously-described protocol.9 We did two CASS samplings per day (at least 4 h apart) on two consecutive days and counted the number of CFU from the ACI from each sampling. We recruited patients (n=29) independent of the parent study. Patients typically expectorated sputum during the CASS, however, if they did not, they were asked to expectorate sputum after CASS. Sputa underwent smear microscopy and culture or Xpert (if only one sputum was available, it was used for smear and culture). To improve chances of CASS-positivity, we recruited patients with high sputum bacillary load (at least smear-grade 2+ positive or Xpert semi-quantitation level “medium”), and had been on treatment less than 48 h. Fleiss kappa values were used to compare dichotomous test results and intraclass correlation coefficients were assessed for continuous data.
DNA extractions
DNA for spoligotyping and whole genome sequencing (WGS) was extracted from primary sputum culture isolates as previously described.10
Sequence analysis
Processing, alignment and single nucleotide variant calling
Whole-genome sequencing was done using Illumina HiSeq2500. Library preparation was done using the Illumina Genomic DNA Sample Preparation Kit to achieve paired-end sequencing (2×101 bp) with an average insert size of 500 bp. The data processing pipeline used has been described previously1. Briefly, we mapped raw sequence data uniquely to the corrected H37Rv reference genome (Genbank accession AL123456.3) using bwa-mem (v0.7) software. We used SAMtools (v1.3) and GATK (v3.3-0) to call single nucleotide polymorphisms (SNPs) and indels. We selected the intersection of variants with quality scores of Q30 or higher, equating to one error per 1000 base positions for further analysis. Genotypes were called in positions of ten-fold coverage; otherwise positions were classified as missing. Highly repetitive and variable regions were removed by calculating mappability values along the reference genome using a k-mer length of 50 base pairs and 0.04% of allowed substitutions while mapping. 364 of the 394 (93%) culture-positive isolates from patients with a valid CASS status had DNA was extracted and sequencing was attempted. Isolates were assigned to a lineage based on the presence or absence of SNPs11. Isolates with more than one lineage-associated SNP were considered a mixed-infection and excluded from downstream analyses.
Genome-wide association studies
Genome wide associations (GWAS) were computed using R11 (v 3.3.0). For each analysis, we masked positions of less than ten-depth coverage and excluded isolates with >10% variants. Only variants where the minor allele frequency was at least 0.9 per isolate, and at a frequency of 0.05 across samples were investigated. Univariate analysis with binomial phenotypes (response variables) were computed using a Fisher’s Exact test. For multivariate analysis of binomial phenotypes, GWAS was done with nsSNPs collapsed per gene (or pathway) using an efficient mixed model approach with a kinship matrix to adjust for population structure or using a logistic regression with correction for population structure using principal components. Multivariate logistic regression model for association with CASS-status included two principal components, patient age, TB symptom score, HIV-status, duration of treatment less than 48h, PCF, culture time to positivity, and drug-resistance category. We also performed GWAS by investigating phylogenetic convergence using the R package treeWAS. We used both parsimony trees and the best scoring maximum likelihood tree using a general time-reversible model and gamma correction for among-site rate variation using 1000 random bootstrap replicates made with RaxML. We used terminal, simultaneous and subsequent tests for association testing. Similar methods were applied to the presence of indels on a gene level (i.e., if an indel overlapped a gene region, then it was marked as a mutation). SNP interactions were identified using the logitFS R-package, and estimates then made using an efficient mixed model. Linear regression models were used for association testing of discrete variables. Correction for multiple testing was done using the Benjamini–Hochberg procedure to control false discovery rate at an alpha of 0.05.
Frequency of fitness-implicated mutations
We examined published fitness- and compensatory-associated mutations association in PonA112, and rpoA and rpoC13,14,15,16,17 (Supplementary Table 12A) with CASS status using Fishers’ Exact test (Supplementary Table 12B).
Inter-isolate SNP comparisons
These were done using all SNPs. 326/364 (90%) of isolates were included in these analyses after filtering those with >10% of the genome having less than ten-depth coverage and presumed mixed-infections. We constructed a pairwise Manhattan distance matrix an inter-isolate SNP threshold of 5 (5 to 10 in sub-analyses) was used to link similar strains. Low coverage positions were excluded on a per pair basis. Graphs were constructed in R using igraph (v1.2.4.1). Edge directionality was determined using date of TB diagnosis for the current episode. We constructed optimal branching networks using Edmonds' algorithm. Fisher’s exact test was used to test the differences between the number of linked isolates by the dependent variable and the number of connections to and from isolates. The Kruskal-Wallis rank sum test was used to test the differences in median edges (links) between isolates.
Drug susceptibility categorisation
All DST were done on sputum culture isolates. We used a “rule-in” strategy, where if Sensititre MYCOTB plates indicated phenotypic resistance (isoniazid, rifampicin, ethambutol, ethionamide, kanamycin, ofloxacin, p-aminosalicylic acid, rifabutin, streptomycin, cycloserine, amikacin, and moxifloxacin; critical concentrations in Supplementary Table 22), WGS (using a previously-described panel18 for all drugs except pyrazinamide and rifabutin, for which different panels were used19-21) indicated genotypic resistance or, for rifampicin, Xpert indicated resistance, patients were classified as resistant to that drug. If patients were missing drug susceptibility test (DST) information from the time of recruitment (e.g., culture-negative or -contaminated), we used DST data available from programmatic records generated from a specimen collected within six months of recruitment (Xpert, MTBDRplus, MTBDRsl, phenotypic MGIT960 DST). If no DST data were still available, we used diagnoses from medical records (listed as DS-, MDR-, pre-XDR-, or XDR-TB). Neither Sensititre MYCOTB nor WGS data were used for patient management. Routine DST results, including Xpert, MTBDRplus, and MTBDRsl done by the national laboratory service, together with phenotypic DST for moxifloxacin and amikacin, were available to health workers.
We first classified patients according to standard definitions as drug-susceptible (susceptible to rifampicin and isoniazid), rifampicin or isoniazid mono-resistant (resistance to one of these drugs), MDR- (resistant to both rifampicin and isoniazid and susceptible to the second line drugs), pre-XDR (MDR and resistance to fluoroquinolones or the second line injectable agents), and XDR (MDR and resistance to fluoroquinolones and second line injectable agents).22 To improve sample size and reduce data over-stratification (which compromises precision)23, we further categorised patients in a manner congruent with World Health Organization-treatment guidelines at the time of the study.24
Drug likely effectiveness
A drug was considered “likely effective” if there was documented susceptibility and no evidence of resistance (phenotypic or genotypic). If a susceptible or resistant phenotypic result was not available (culture-negative, culture-contaminated, or indeterminate) as well as no WGS (and, for rifampicin, a positive Xpert result), the drug was classified as being of unknown effectiveness. Using a combination of these tests and sputum culture isolate drug susceptibility categorisation scheme outlined above, we were able to classify the likely effectiveness of the following drugs: RIF, INH, PZA, EMB, MOX, OFL, KAN, CAP, ETH, PAS, and LNZ.
Spoligotyping
Decontaminated sputum specimens or MGIT culture aliquots were heated at 100°C for ≥1 h. Two microliters of lysate was used for spoligotyping PCR (Kamerbeek method25). Briefly, PCR was done to selectively amplified the left and central direct repeat target with the internationally standardized PCR protocol in combination with primers DRa (GGTTTTGGGTCTGACGAC, 5′ biotinylated) and DRb (CCGAGAGGGGACGGAAAC).25 Products were then hybridized to a membrane containing bound oligonucleotides and detected via chemiluminescene on X-ray film. Isolates were assigned a genotype family as described by SITVIT.26 In silico spoligotypes were predicted using SpolPred on sputum culture isolate WGS data.27
Definitions
“CASS-positive”, patients with any M. tuberculosis CFU from cough aerosol. Patients were classified into groups based on antibiograms or clinical records into Group 1 (non-rifampicin resistant), Group 2 (rifampicin resistant but not XDR), and Group 3 (XDRs).28,29 Patients with isoniazid mono-resistance were included with drug-susceptible patients (Group 1), those with rifampicin mono-resistance or pre-XDR were included with MDR patients (Group 2), and XDR- patients were allocated to a separate category (Group 3).
Statistical analyses
The chi-squared test was used for comparisons between proportions. We used Fisher’s exact test with mid-p correction for comparisons between proportions and the Mann-Whitney test was used to compare differences in non-parametric continuous data. Multivariable logistic regression was done to adjust for potential confounding (parameters p≤0.100 included in models). A backward elimination strategy using the log likelihood ratio test was used to finalise models. Analyses were done using Graphpad Prism (version 6.0; GraphPad Software, United States) and Stata (version 14; StataCorp, United States). All statistical tests were two-sided at α=0.05. Continuous data were tested for normality using the D'Agostino-Pearson omnibus test. Adjustments for multiple comparisons were not done.
Ethics
All patients provided written informed consent. The Human Research Ethics Committee, Faculty of Health Sciences, University of Cape Town (038/2008) and the Human Research Ethics Committee, Faculty of Medicine and Health Sciences, Stellenbosch University (N13/01/001) approved the study.
Extended Data
Extended Data Fig. 1. Study profile and participant overview.
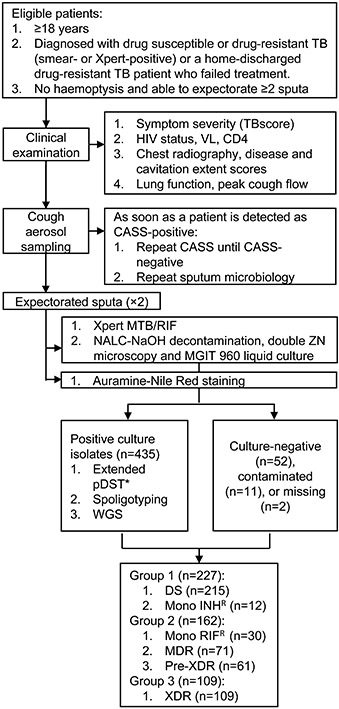
Abbreviations: CASS, cough aerosol sampling system; DS, drug-susceptible; INH, isoniazid; MDR, multidrug-resistant; MGIT, mycobacterial growth indicator tube; RIF, rifampicin; TB, tuberculosis; XDR, extensively drug-resistant; VL, viral load; WGS, whole genome sequencing. *Done using Sensititre MYCOTB plates for isoniazid, rifampicin, ethambutol, ethionamide, kanamycin, ofloxacin, p-aminosalicylic acid, rifabutin, streptomycin, cycloserine, amikacin, and moxifloxacin.
Extended Data Fig. 2. M. tuberculosis CFU from cough aerosol particles at recruitment as a function of days on treatment before CASS stratified by regimen type.
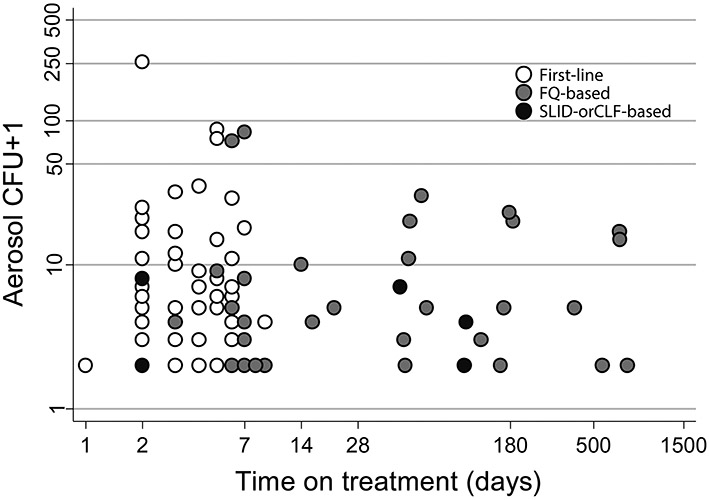
Beyond eight days, no patients receiving the first-line regimen were CASS-positive, whereas patients receiving second-line regimens had CFU in their aerosol for months. The y-axis is logarithmic and one was added to CFU counts. Abbreviations: ACI, Andersen Cascade Impactor; CLF, clofazimine; FQ, fluoroquinolone; IQR, interquartile range; SLID, second-line injectable drug.
Extended Data Fig. 3.
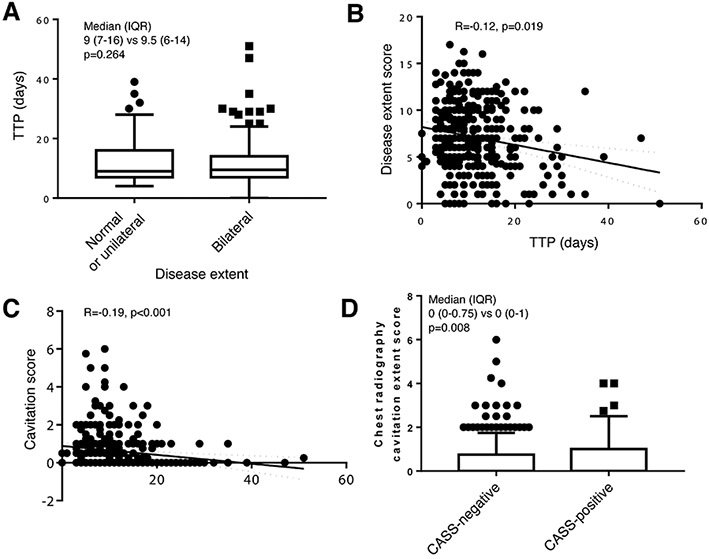
Relationships between sputum bacillary load (liquid culture time-to-positivity) and disease extent (A and B) and cavitation score (C), and between CASS-status and cavitation score (D) assessed by chest radiography using the standardised reporting system in Supplementary Table 2.
Extended Data Fig. 4.
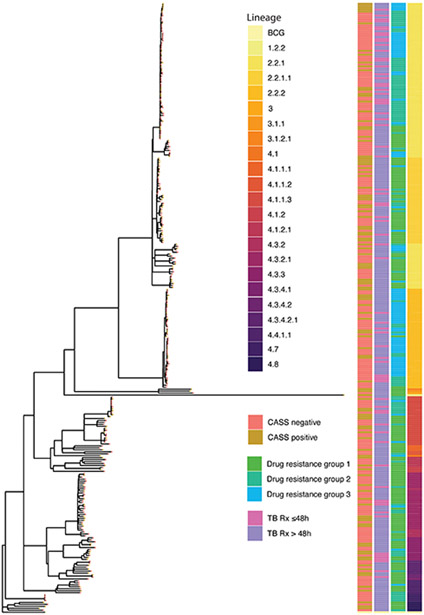
Maximum likelihood phylogenetic tree of baseline CASS isolates (n=318) rooted to Mycobacterium bovis BCG. Heatmaps to the right of the tree denote from left to right CASS status (also denoted on the branch nodes), treatment duration, drug resistance group and M. tuberculosis lineage
Extended Data Fig. 5. A Manhattan plot of multivariate genome wide association study (GWAS) using nsSNPs per gene for CASS-positivity including two principal components, patient age, TB symptom score, HIV-status, duration of treatment less than 48h, PCF, culture time to positivity, and drug-resistance category did not detect significant associations.
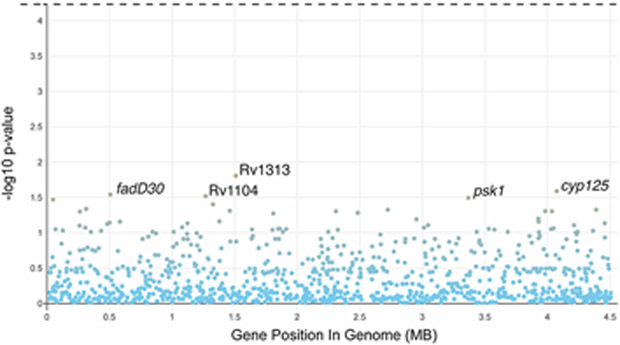
The horizontal dashed line represents the threshold of statistical significance.
Supplementary Material
Acknowledgements
The authors are indebted to the patients who participated. The study would not have been possible without the remarkable efforts of Ruth Wilson and Gerrit Pretorius. We also thank for their invaluable assistance Maria Pienaar and Marietjie Pretorius, Paul Spiller, Marinus Barnard, and John Simpson, and Tania Dolby, Ruzayda van Aarde, Charlene Clarke, and Brigitta Derendinger. WGS computations were done using facilities provided by the University of Cape Town’s ICTS High Performance Computing team.
Funding statement
The project was funded by the NIH (1R01AI104817-01), Wellcome Trust (099854/Z/12/Z), South African Medical Research Council (SA-MRC; Career Development Award, Self-initiated Research Award), and the National Research Foundation of South Africa. The content is solely the responsibility of the authors and does not necessarily represent the official views of the South African Medical Research Council. GT acknowledges funding from SA-MRC (RFA-IFSP-01-2013), the EDCTP2 programme supported by the European Union (SF1401, OPTIMAL DIAGNOSIS), and the Faculty of Medicine and Health Sciences, Stellenbosch University. KD acknowledges funding from the SA MRC (RFA-EMU-02-2017), EDCTP (TMA-2015SF-1043, TMA-1051-TESAII, TMA-CDF2015), UK Medical Research Council (MR/S03563X/1) and the Wellcome Trust (MR/S027777/1).. KF was supported by the Intramural Research Program of the NIH, National Heart, Lung, and Blood Institute. The financial assistance of the National Research Foundation (NRF) towards this research is acknowledged. Opinions expresses and conclusions arrived at, are those of the author(s) and should not necessarily to be attributed to the NRF.
Footnotes
Competing Interests Statement:
None of the authors declare competing interests.
Data availability statement
De-identified datasets generated during and/or analysed during the study are available from the corresponding author without restriction. Sequence data are available in SRA (accession number PRJNA600338).
References:
- 1.Dheda K et al. The epidemiology, pathogenesis, transmission, diagnosis, and management of multidrug-resistant, extensively drug-resistant, and incurable tuberculosis. The lancet Respiratory medicine 5, 291–360 (2017). [DOI] [PubMed] [Google Scholar]
- 2.Riley R et al. Infectiousness of air from a tuberculosis ward. Ultraviolet irradiation of infected air: comparative infectiousness of different patients. The American review of respiratory disease 85, 511 (1962). [DOI] [PubMed] [Google Scholar]
- 3.Sultan L et al. Tuberculosis disseminators. A study of the variability of aerial infectivity of tuberculous patients. American Review of Respiratory Disease 82, 358–369 (1960). [DOI] [PubMed] [Google Scholar]
- 4.Tostmann A et al. Tuberculosis transmission by patients with smear-negative pulmonary tuberculosis in a large cohort in the Netherlands. Clinical infectious diseases : an official publication of the Infectious Diseases Society of America 47, 1135–1142, doi: 10.1086/591974 (2008). [DOI] [PubMed] [Google Scholar]
- 5.Walker TM et al. Whole-genome sequencing to delineate Mycobacterium tuberculosis outbreaks: a retrospective observational study. The Lancet. Infectious diseases 13, doi: 10.1016/s1473-3099(12)70277-3 (2013). [DOI] [PMC free article] [PubMed] [Google Scholar]
- 6.Van Geuns H, Meijer J & Styblo K Results of contact examination in Rotterdam, 1967-1969. Bulletin of the International Union against Tuberculosis 50, 107 (1975). [PubMed] [Google Scholar]
- 7.Melsew YA et al. The role of super-spreading events in Mycobacterium tuberculosis transmission: evidence from contact tracing. BMC Infect Dis 19, 244, doi: 10.1186/s12879-019-3870-1 (2019). [DOI] [PMC free article] [PubMed] [Google Scholar]
- 8.Ypma RJ, Altes HK, van Soolingen D, Wallinga J & van Ballegooijen WM A sign of superspreading in tuberculosis: highly skewed distribution of genotypic cluster sizes. Epidemiology 24, 395–400 (2013). [DOI] [PubMed] [Google Scholar]
- 9.Lloyd-Smith JO, Schreiber SJ, Kopp PE & Getz W Superspreading and the effect of individual variation on disease emergence. Nature 438, 355–359 (2005). [DOI] [PMC free article] [PubMed] [Google Scholar]
- 10.McCreesh N & White RG An explanation for the low proportion of tuberculosis that results from transmission between household and known social contacts. Scientific reports 8, 5382, doi: 10.1038/s41598-018-23797-2 (2018). [DOI] [PMC free article] [PubMed] [Google Scholar]
- 11.Woolhouse MEJ et al. Heterogeneities in the transmission of infectious agents: implications for the design of control programs. Proceedings of the National Academy of Sciences 94, 338 (1997). [DOI] [PMC free article] [PubMed] [Google Scholar]
- 12.Kodama C et al. Mycobacterium tuberculosis transmission from patients with drug-resistant compared to drug-susceptible TB: a systematic review and meta-analysis. 50, 1701044, doi: 10.1183/13993003.01044-2017%J European Respiratory Journal (2017). [DOI] [PubMed] [Google Scholar]
- 13.Fennelly KP et al. Cough-generated aerosols of Mycobacterium tuberculosis: a new method to study infectiousness. American journal of respiratory and critical care medicine 169, 604–609 (2004). [DOI] [PubMed] [Google Scholar]
- 14.Gagneux S et al. Impact of bacterial genetics on the transmission of isoniazid-resistant Mycobacterium tuberculosis. PLoS pathogens 2, e61 (2006). [DOI] [PMC free article] [PubMed] [Google Scholar]
- 15.Fennelly KP et al. Variability of infectious aerosols produced during coughing by patients with pulmonary tuberculosis. American journal of respiratory and critical care medicine 186, 450–457 (2012). [DOI] [PMC free article] [PubMed] [Google Scholar]
- 16.Jones-López EC et al. Cough Aerosols of Mycobacterium tuberculosis Predict New Infection: A Household Contact Study. American journal of respiratory and critical care medicine (2013). [DOI] [PMC free article] [PubMed] [Google Scholar]
- 17.Wejse C et al. TBscore: Signs and symptoms from tuberculosis patients in a low-resource setting have predictive value and may be used to assess clinical course. Scandinavian Journal of Infectious Diseases 40, 111–120 (2008). [DOI] [PubMed] [Google Scholar]
- 18.Garton NJ, Christensen H, Minnikin DE, Adegbola RA & Barer MR Intracellular lipophilic inclusions of mycobacteria in vitro and in sputum. Microbiology 148, 2951–2958 (2002). [DOI] [PubMed] [Google Scholar]
- 19.Health, S. A. D. o. (South Africa, 2011). [Google Scholar]
- 20.Six and Two Stage Viable Samplers Instruction Manual. ThermoFisher Scientific, O. [Google Scholar]
- 21.Landis JR & Koch GG The measurement of observer agreement for categorical data. biometrics, 159–174 (1977). [PubMed] [Google Scholar]
- 22.Koo TK & Li MY A guideline of selecting and reporting intraclass correlation coefficients for reliability research. Journal of chiropractic medicine 15, 155–163 (2016). [DOI] [PMC free article] [PubMed] [Google Scholar]
- 23.Acuña-Villaorduña C et al. in Open forum infectious diseases. ofz184 (Oxford University Press; US: ). [Google Scholar]
- 24.Calligaro GL et al. Effect of new tuberculosis diagnostic technologies on community-based intensified case finding: a multicentre randomised controlled trial. The Lancet Infectious Diseases 17, 441–450 (2017). [DOI] [PubMed] [Google Scholar]
- 25.Rouillon A, Perdrizet S & Parrot R Transmission of tubercle bacilli: The effects of chemotherapy. Tubercle 57, 275–299, doi: 10.1016/S0041-3879(76)80006-2 (1976). [DOI] [PubMed] [Google Scholar]
- 26.Noble RC Infectiousness of pulmonary tuberculosis after starting chemotherapy: review of the available data on an unresolved question. American Journal of Infection Control 9, 6–10 (1981). [Google Scholar]
- 27.Dharmadhikari AS et al. Rapid impact of effective treatment on transmission of multidrug-resistant tuberculosis. The International Journal of Tuberculosis and Lung Disease 18, 1019–1025 (2014). [DOI] [PMC free article] [PubMed] [Google Scholar]
- 28.Dheda K et al. Drug-penetration gradients associated with acquired drug resistance in patients with tuberculosis. 198, 1208–1219 (2018). [DOI] [PMC free article] [PubMed] [Google Scholar]
- 29.Fitzwater SP et al. Prolonged infectiousness of tuberculosis patients in a directly observed therapy short-course program with standardized therapy. Clinical infectious diseases 51, 371–378 (2010). [DOI] [PMC free article] [PubMed] [Google Scholar]
- 30.Pietersen E et al. Long-term outcomes of patients with extensively drug-resistant tuberculosis in South Africa: a cohort study. The Lancet (2014). [DOI] [PubMed] [Google Scholar]
- 31.Yates TA et al. The transmission of Mycobacterium tuberculosis in high burden settings. The Lancet Infectious Diseases 16, 227–238, doi: 10.1016/S1473-3099(15)00499-5 (2016). [DOI] [PubMed] [Google Scholar]
- 32.Escombe AR et al. The detection of airborne transmission of tuberculosis from HIV-infected patients, using an in vivo air sampling model. Clinical Infectious Diseases 44, 1349–1357 (2007). [DOI] [PMC free article] [PubMed] [Google Scholar]
- 33.Dharmadhikari AS et al. Natural infection of guinea pigs exposed to patients with highly drug-resistant tuberculosis. Tuberculosis 91, 329–338 (2011). [DOI] [PMC free article] [PubMed] [Google Scholar]
- 34.Lin PL et al. Early events in Mycobacterium tuberculosis infection in cynomolgus macaques. 74, 3790–3803 (2006). [DOI] [PMC free article] [PubMed] [Google Scholar]
- 35.Jones-Lopez EC et al. Cough Aerosols of Mycobacterium tuberculosis Predict Incident Tuberculosis Disease in Household Contacts. Clinical infectious diseases : an official publication of the Infectious Diseases Society of America, doi: 10.1093/cid/ciw199 (2016). [DOI] [PMC free article] [PubMed] [Google Scholar]
- 36.Chengalroyen MD et al. Detection and quantification of differentially culturable tubercle bacteria in sputum from patients with tuberculosis. American journal of respiratory and critical care medicine 194, 1532–1540 (2016). [DOI] [PMC free article] [PubMed] [Google Scholar]
- 37.Johnson R et al. Drug-resistant tuberculosis epidemic in the Western Cape driven by a virulent Beijing genotype strain. 14, 119–121 (2010). [PubMed] [Google Scholar]
- 38.Yu X et al. Sensititre® MYCOTB MIC plate for drug susceptibility testing of Mycobacterium tuberculosis complex isolates. 20, 329–334 (2016). [DOI] [PubMed] [Google Scholar]
- 39.Stoltz AC et al. in A26. DIAGNOSIS AND TREATMENT OF TUBERCULOSIS A1187–A1187 (American Thoracic Society, 2017). [Google Scholar]
- 40.Centre for Disease Control and Prevention. NIOSH Manual of Analytical Methods (NMAM), 5thEdition. (2017). [Google Scholar]
References for Methods
- 1.Dheda K, Limberis JD, Pietersen E, et al. Outcomes, infectiousness, and transmission dynamics of patients with extensively drug-resistant tuberculosis and home-discharged patients with programmatically incurable tuberculosis: a prospective cohort study. The lancet Respiratory medicine 2017; 5(4): 269–81. [DOI] [PubMed] [Google Scholar]
- 2.Wejse C, Gustafson P, Nielsen J, et al. TBscore: Signs and symptoms from tuberculosis patients in a low-resource setting have predictive value and may be used to assess clinical course. Scandinavian Journal of Infectious Diseases 2008; 40(2): 111–20. [DOI] [PubMed] [Google Scholar]
- 3.te Riele JB, Buser V, Calligaro G, et al. Relationship between chest radiographic characteristics, sputum bacterial load, and treatment outcomes in patients with extensively drug-resistant tuberculosis. International Journal of Infectious Diseases. [DOI] [PubMed] [Google Scholar]
- 4.World Health Organization. Mycobacteriology Laboratory Manual. 1st ed. Global Laboratory Initiative. Geneva, Switzerland; 2014. [Google Scholar]
- 5.Rieder HL, Chonde TM, Myking H, et al. The public health service national tuberculosis reference laboratory and the national laboratory network; minimum requirements, role and operation in a low-income country: International Union Against Tuberculosis And Lung Disease (IUATLD); 1998. [Google Scholar]
- 6.Garton NJ, Christensen H, Minnikin DE, Adegbola RA, Barer MR. Intracellular lipophilic inclusions of mycobacteria in vitro and in sputum. Microbiology 2002; 148(10): 2951–8. [DOI] [PubMed] [Google Scholar]
- 7.Lee J, Armstrong DT, Ssengooba W, et al. Sensititre MYCOTB MIC plate for testing Mycobacterium tuberculosis susceptibility to first-and second-line drugs. Antimicrobial agents and chemotherapy 2014; 58(1): 11–8. [DOI] [PMC free article] [PubMed] [Google Scholar]
- 8.Sloan DJ, Mwandumba HC, Garton NJ, et al. Pharmacodynamic modeling of bacillary elimination rates and detection of bacterial lipid bodies in sputum to predict and understand outcomes in treatment of pulmonary tuberculosis. Clinical infectious diseases 2015; 61(1): 1–8. [DOI] [PMC free article] [PubMed] [Google Scholar]
- 9.Fennelly KP, Martyny JW, Fulton KE, Orme IM, Cave DM, Heifets LB. Cough-generated aerosols of Mycobacterium tuberculosis: a new method to study infectiousness. American journal of respiratory and critical care medicine 2004; 169(5): 604. [DOI] [PubMed] [Google Scholar]
- 10.Warren R, de Kock M, Engelke E, et al. Safe Mycobacterium tuberculosis DNA extraction method that does not compromise integrity. Journal of clinical microbiology 2006; 44(1): 254–6. [DOI] [PMC free article] [PubMed] [Google Scholar]
- 11.Team RC. R: A Language and Environment for Statistical Computing. 2016. [Google Scholar]
- 12.Casali N, Nikolayevskyy V, Balabanova Y, et al. Evolution and transmission of drug-resistant tuberculosis in a Russian population. Nature genetics 2014; 46(3): 279–86. [DOI] [PMC free article] [PubMed] [Google Scholar]
- 13.Trauner A, Borrell S, Reither K, Gagneux S. Evolution of drug resistance in tuberculosis: recent progress and implications for diagnosis and therapy. Drugs 2014; 74(10): 1063–72. [DOI] [PMC free article] [PubMed] [Google Scholar]
- 14.Song T, Park Y, Shamputa IC, et al. Fitness costs of rifampicin resistance in Mycobacterium tuberculosis are amplified under conditions of nutrient starvation and compensated by mutation in the beta' subunit of RNA polymerase. Molecular microbiology 2014; 91(6): 1106–19. [DOI] [PMC free article] [PubMed] [Google Scholar]
- 15.de Vos M, Muller B, Borrell S, et al. Putative compensatory mutations in the rpoC gene of rifampin-resistant Mycobacterium tuberculosis are associated with ongoing transmission. Antimicrob Agents Chemother 2013; 57(2): 827–32. [DOI] [PMC free article] [PubMed] [Google Scholar]
- 16.Farhat MR, Shapiro BJ, Kieser KJ, et al. Genomic analysis identifies targets of convergent positive selection in drug-resistant Mycobacterium tuberculosis. Nature genetics 2013; 45(10): 1183–9. [DOI] [PMC free article] [PubMed] [Google Scholar]
- 17.Comas I, Borrell S, Roetzer A, et al. Whole-genome sequencing of rifampicin-resistant Mycobacterium tuberculosis strains identifies compensatory mutations in RNA polymerase genes. Nature genetics 2012; 44(1): 106–10. [DOI] [PMC free article] [PubMed] [Google Scholar]
- 18.Walker TM, Kohl TA, Omar SV, Hedge J, Elias CDO, Bradley P. Whole-genome sequencing for prediction of Mycobacterium tuberculosis drug susceptibility and resistance: a retrospective cohort study. The Lancet Infectious diseases 2015; 15. [DOI] [PMC free article] [PubMed] [Google Scholar]
- 19.Coll F, McNerney R, Preston MD, Guerra-Assunção JA, Warry A, Hill-Cawthorne G. Rapid determination of anti-tuberculosis drug resistance from whole-genome sequences. Genome Med 2015; 7. [DOI] [PMC free article] [PubMed] [Google Scholar]
- 20.Sirgel FA, Warren RM, Böttger EC, Klopper M, Victor TC, Helden PD. The rationale for using rifabutin in the treatment of MDR and XDR tuberculosis outbreaks. PLoS One 2013; 8. [DOI] [PMC free article] [PubMed] [Google Scholar]
- 21.Whitfield MG, Warren RM, Streicher EM, et al. Mycobacterium tuberculosis pncA polymorphisms that do not confer pyrazinamide resistance at a breakpoint concentration of 100 micrograms per milliliter in MGIT. Journal of clinical microbiology 2015; 53(11): 3633–5. [DOI] [PMC free article] [PubMed] [Google Scholar]
- 22.Definitions and Reporting Framework for Tuberculosis – 2013 revision. Geneva, Switzerland: World Health Organization; 2013. [Google Scholar]
- 23.De Stavola B, Cox D. On the consequences of overstratification. Biometrika 2008; 95(4): 992–6. [Google Scholar]
- 24.World Health Organization. WHO treatment guidelines for drug-resistant tuberculosis (2016 update). Available from: http://www.who.int/tb/areas-of-work/drug-resistant-tb/treatment/resources/en/.Geneva, Switzerland; 2016. [PubMed] [Google Scholar]
- 25.Policy Statement: Automated real-time Nucleic Acid Amplification Technology for Rapid and Simultaneous Detection of Tuberculosis and Rifampicin Resistance: Xpert MTB/RIF System. Geneva, Switzerland: World Health Organization; 2011. [PubMed] [Google Scholar]
- 26.Demay C, Liens B, Burguiere T, et al. SITVITWEB--a publicly available international multimarker database for studying Mycobacterium tuberculosis genetic diversity and molecular epidemiology. Infection, genetics and evolution : journal of molecular epidemiology and evolutionary genetics in infectious diseases 2012; 12(4): 755–66. [DOI] [PubMed] [Google Scholar]
- 27.Coll F, Mallard K, Preston MD, et al. SpolPred: rapid and accurate prediction of Mycobacterium tuberculosis spoligotypes from short genomic sequences. Bioinformatics 2012; 28(22): 2991–3. [DOI] [PMC free article] [PubMed] [Google Scholar]
- 28.Dheda K, Gumbo T, Maartens G, et al. The epidemiology, pathogenesis, transmission, diagnosis, and management of multidrug-resistant, extensively drug-resistant, and incurable tuberculosis. The lancet Respiratory medicine 2017; 5(4): 291–360. [DOI] [PubMed] [Google Scholar]
- 29.World Health Organization. Global Tuberculosis Report. Geneva, Switzerland; 2016. [Google Scholar]
Associated Data
This section collects any data citations, data availability statements, or supplementary materials included in this article.
Supplementary Materials
Data Availability Statement
De-identified datasets generated during and/or analysed during the study are available from the corresponding author without restriction. Sequence data are available in SRA (accession number PRJNA600338).