

Abstract
Severe acute respiratory syndrome coronavirus 2 (SARS-CoV-2) utilizes an extensively glycosylated surface spike (S) protein to mediate host cell entry, and the S protein glycosylation plays key roles in altering the viral binding/function and infectivity. However, the molecular structures and glycan heterogeneity of the new O-glycans found on the S protein regional-binding domain (S-RBD) remain cryptic because of the challenges in intact glycoform analysis by conventional bottom-up glycoproteomic approaches. Here, we report the complete structural elucidation of intact O-glycan proteoforms through a hybrid native and denaturing top-down mass spectrometry (MS) approach employing both trapped ion mobility spectrometry (TIMS) quadrupole time-of-flight and ultrahigh-resolution Fourier transform ion cyclotron resonance (FTICR)-MS. Native top-down TIMS-MS/MS separates the protein conformers of the S-RBD to reveal their gas-phase structural heterogeneity, and top-down FTICR-MS/MS provides in-depth glycoform analysis for unambiguous identification of the glycan structures and their glycosites. A total of eight O-glycoforms and their relative molecular abundance are structurally elucidated for the first time. These findings demonstrate that this hybrid top-down MS approach can provide a high-resolution proteoform-resolved mapping of diverse O-glycoforms of the S glycoprotein, which lays a strong molecular foundation to uncover the functional roles of their O-glycans. This proteoform-resolved approach can be applied to reveal the structural O-glycoform heterogeneity of emergent SARS-CoV-2 S-RBD variants as well as other O-glycoproteins in general.
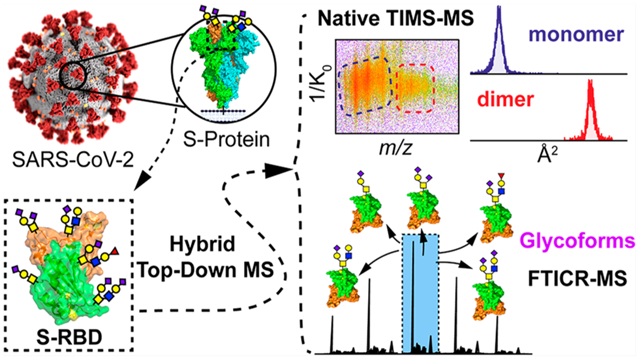
Graphical Abstract
INTRODUCTION
The novel zoonotic 2019 coronavirus disease (COVID-19) global pandemic1 has led to more than 102 million reported cases and over 3 million deaths as of June 2021.2 The causative pathogen of COVID-19, severe acute respiratory syndrome coronavirus-2 (SARS-CoV-2), utilizes an extensively glycosylated spike (S) protein that protrudes from the viral surface to bind receptor angiotensin-converting enzyme 2 (ACE2) for cell entry.3 The evolution of the surface S protein is particularly important as it initiates pathogenesis4 and is the main target of vaccination5 and antibody therapeutic design,6 and a substantial number of predicted mutations in the S protein regional-binding domain (RBD) can potentially enhance ACE2 binding.7 Moreover, the more than 1 900 000 viral genomic sequences generated from global molecular epidemiology studies (as of June 9, 2021, www.gisaid.org)8 reveal the emergence of a number of variants in the S protein, indicating that SARS-CoV-2 may be evolving to acquire selective replication advantages, drug insensitivity, and immunological resistance, thereby underscoring the need for new technologies capable of rapid and deep structural profiling of the virus.9
Importantly, glycans flank the polybasic furin cleavage site of S protein necessary for S stability during biogenesis and influence the conformational dynamics by masking protein regions from cleavage during ACE2 binding.10–12 How these different sites are glycosylated and how they influence ACE2 binding are likely to affect cell infectivity and could shield certain epitopes from antibody neutralization.13–15 The SARS-CoV-2 S protein carries 22 N-glycosylation sequons per protomer, which have been characterized in detail.16 However, characterization of O-glycosylation is a major challenge,17–19 and only putative O-glycosites have been reported.12,20,21 The presence and exact molecular structures of these O-glycans remain cryptic due to the immense glycan microheterogeneity and the lack of intact glycoprotein analysis.22–24 Importantly, individual glycosites can give rise to many glycan structural variants, i.e., glycoforms, and these differences in glycan structures, even at a single glycosite, can have critical implications on biological functions.15,25–27 It is crucial to decipher the intact O-glycoforms of the S-RBD because they are expected to play a role in viral function and viral binding with ACE2.13,20,21,28 Therefore, new approaches capable of the comprehensive structural elucidation of O-glycans are essential to provide new avenues for rational therapeutic development22,29–31 and to investigate S protein alterations in the emerging SARS-CoV-2 variants.9,32
Conventional methods to analyze protein glycosylation rely on the bottom-up MS approach of analyzing glycopeptides obtained through enzymatic digestion.26,33,34 Although the bottom-up MS approach is a high-throughput method for global proteome identification of glycosites and N-glycan heterogeneity from complex samples, the relative abundance of various intact glycoforms and the overall post-translational modification (PTM) compositions of different coappearing “proteoforms”35 are lost.36–38 Moreover, O-glycan heterogeneity and structure characterization have not been achieved by the current methods.34 In contrast, by combining glycoproteomics with the top-down MS approach, which preserves the intact glycoprotein enabling high-resolution proteoform-resolved analysis,39–42 we could achieve simultaneous characterization of the molecular structures, the site specificity, and the relative abundance of various glycoforms. By further integrating native MS, which has recently emerged as a powerful structural biology tool to study protein structure–function relationships,36–38,43–49 with trapped ion mobility spectrometry (TIMS),50–56 we could investigate the gas-phase structural heterogeneity to achieve the direct quantification of individual glycoproteoforms.
Here, we developed a hybrid native and denaturing top-down MS method for the structural analysis of intact O-glycan proteoforms of the S-RBD (Figure 1). We harness the capabilities of a hybrid TIMS quadrupole time-of-flight (QTOF) mass spectrometer (timsTOF Pro) (Figure 1C), which provides high resolving power and sensitivity for both selective and comprehensive ion mobility separations of various native protein conformers and analyze their gas-phase structural heterogeneity, and the ultrahigh-resolution of a 12T Fourier transform ion cyclotron resonance (FTICR)-MS (Figure 1D), to comprehensively characterize the O-glycoforms of the S-RBD, including the exact glycan structures and relative molecular abundance (Figure 1E). We demonstrate that this hybrid native top-down MS approach can provide a high-resolution and wholistic proteoform-resolved landscape of diverse O-glycoforms of the S-RBD.
Figure 1.

High-resolution glycoform characterization of intact S-RBD by hybrid top-down MS. (A–D) Illustration of the top-down glycoproteomics workflow for the comprehensive analysis of the S-RBD glycoforms. (A) SARS-CoV-2 coronavirus features a surface S protein that possesses a glycosylated RBD (highlighted in the dashed box in B). (B) Intact glycoprotein analysis proceeds by directly infusing solubilized S-RBD and electrospraying S-RBD protein ions into either (C) a hybrid trapped ion mobility spectrometry (TIMS) MS device (timsTOF) for native ion mobility MS/MS analysis or (D) an ultrahigh-resolution Fourier transform ion cyclotron (FTICR)-MS for denaturing top-down MS/MS. (E) Specific isolation of S-RBD proteoforms by top-down MS analysis, illustrating raw MS1 and corresponding deconvoluted protein spectrum, for structural characterization of glycoforms. PDB: 6VXX (A) and 6M0J (B and E).
RESULTS AND DISCUSSION
Native TIMS-MS Analysis of the S-Protein RBD.
S-RBD protein expressed from HEK293 cells was used to perform native top-down MS for comprehensive glycoform analysis (Figure 1). We leveraged a native TIMS-MS approach to uncover multiple levels of information related to the intact protein structure, the intact glycoforms, and the native structural heterogeneity arising from the complexity and structural diversity of the S-RBD glycans. After ensuring reproducible native S-RBD protein sample preparation (Figure S1), we used the TIMS, the front-end of the timsTOF Pro (see Materials and Methods for details), to achieve high-resolution ion mobility separation of protein conformers. TIMS is a relatively recent high-resolution ion mobility method in which multiple ions are held in place against a moving gas under an electric field and then ejected at characteristic elution voltages from the TIMS cell enabling the determination of ion mobility (1/K0) for structural analysis.53–55 The mobility measured in TIMS allows collision cross-section (CCS) determination of protein conformers, which relates to their overall size and shape, and consequently can be used to evaluate changes in the three-dimensional structure.54,57 However, ion mobility mapping and MS1 analysis reveal enormous complexity in the native S-RBD sample (Figure S2). The diffuse spread of the ion mobility spectrum suggests multiple coexisting S-RBD proteoforms potentially arising from the multiple glycans (Figure S2A and S2C). The native S-RBD without any deglycosylation could not be isotopically resolved due to multiple overlapping ion signals from all of the diverse glycoforms/proteoforms carrying different charges (Figure S2C and S2D), as observed in complex glycoproteins previously.36,50
To elucidate the O-glycans of the S-RBD, we completely removed the N-glycans from the S-RBD using a native PNGase F treatment (see Materials and Methods for details) to minimize the interference posed by the enormous N-glycan heterogeneity (Figure 2A). The removal of N-glycans constitutes >10 kDa of molecular weight loss compared to the fully glycosylated S-RBD, as expected from the multiple proteoforms detected by native TIMS-MS analysis (Figure S2). Fortunately, we found that after complete removal of N-glycans, the remaining O-glycans on the S-RBD were fully resolvable by native MS (Figure 2B). Although the remaining PNGase F was found to be coexisting with the S-RBD, further optimization of the deglycosylation treatment yielded highly resolved charge states of the S-RBD (Figure 2C). Deconvoluted MS analysis of the isotopically resolved charge states revealed multiple O-glycoforms with molecular weights ranging from 25.5 to 26.8 kDa (Figure 2C, inset).
Figure 2.

Isotopically resolved native top-down MS of intact S-RBD after N-glycan removal. (A) SDS-PAGE of the S-RBD before (−) and after (+) PNGase F treatment. Gel lanes were equally loaded (200 ng), and staining was visualized by SYPRO Ruby. (B) Native MS of the S-RBD before (−) and after (+) PNGase F treatment showing improved ion signal and resolution, corresponding to the data shown in A. (C) Isotopically resolved S-RBD obtained after optimization of PNGase F treatment. Protein charge states are labeled, and inset shows the corresponding deconvoluted mass spectrum. PDB: 6M0J.
We next used TIMS to separate and analyze the various S-RBD O-glycoforms after N-glycan removal by taking full advantage of the TIMS front end of the timsTOF Pro instrument. MS parameters were optimized to preserve the intact S-RBD O-glycoforms for native MS analysis (Figure S3). Moreover, we found that native-like conformers of the S-RBD could be resolved and analyzed under sufficiently soft TIMS cell activation parameters (Figure S4). After careful additional TIMS tuning and optimization of native desolvation parameters (Figures S5 and S6), the timsTOF was sufficiently sensitive to allow high-resolution ion mobility separation of intact S-RBD O-glycoforms (Figure 3). Both native S-RBD monomers (z = 8+ to 12+) and noncovalent dimers (z = 14+ to 16+) were resolved by the native TIMS-MS analysis (Figure 3A). TIMS mobility separation revealed two distinct protein gas-phase native conformers separated in regional mobility between 0.95 and 1.25 1/K0 (Figure 3B). By interrogating each of the resolved mobility regions, native MS1 analysis revealed that the two gas-phase conformers correspond to the S-RBD monomer (Region 1) and dimer (Region 2) (Figure 3C). TIMS enables the isolation of specific charge states corresponding to the ion mobility regions of the monomer (Figure S7) and dimer (Figure S8), thereby enabling the structural analysis of these native-like protein conformers. We note that the S-RBD dimer formation was persistent under various MS sample preparation conditions (Figure S9) and was also observed for the native S-RBD sample without deglycosylation (Figure S1). Recently, Brun et al. reported the presence of free recombinant S1 subunit found in HEK293 cell supernatants following viral infection.58 Thus, the native S-RBD dimer formation we observe suggests the potential for S1 dimer formation through RBD association and may point to functionally relevant roles during viral infection.
Figure 3.

Ion mobility separation of intact S-RBD O-glycoforms by native TIMS-MS. (A) Native MS1 analysis of intact S-RBD after N-glycan removal. Native monomers and dimers (see inset) of the S-RBD are resolved. (B) Ion mobility heat map corresponding to the data presented in A. Distinct gas-phase conformers labeled as Region 1 (blue) and Region 2 (red) were observed. (C) Native MS1 analysis of the various ion mobility regions corresponding to B. Regional native MS1 spectra correspond to the monomeric (Region 1) and dimeric (Region 2) S-RBD native conformations. (D) TIMS collision cross-section distribution for the S-RBD monomer (10+ charge state, 2625 m/z isolation, 1.10 1/K0 peak) and S-RBD dimer (15+ charge state, 3484 m/z isolation, 1.08 1/K0 peak) corresponding to the ion mobility Regions 1 and 2 in B and C obtained under nitrogen drift gas (TIMSCCSN2). (E) Plot of TIMSCCSN2 values as a function of charge state for the ion mobility regions 1 and 2 corresponding to B and C. Data are representative of n = 3 independent experiments with error bars indicating the standard deviation of the mean.
TIMS CCS distributions (determined using N2 as the TIMS buffer gas and hereafter referred to as TIMSCCSN2) of the most abundant ions corresponding to the native S-RBD monomer (10+ charge state) and dimer (15+ charge state) provided insight into the conformational heterogeneity of the two gas-phase structures (Figure 3D). We found that the CCS determined for the native S-RBD O-glycoform monomer (Region 1, 10+ charge state, TIMSCCSN2 2227 ± 4 Å2) is slightly higher (~50 Å2) than the theoretical value (~2180 Å2) calculated using the IMPACT method59 for the nonglycosylated S-RBD from the X-ray crystal structure (PDB: 6M0J).60 This discrepancy is likely a result of the influence of the additional O-glycans.61 Moreover, the CCS distribution for the native S-RBD O-glycoform dimer (Region 2, 15+ charge state, TIMSCCSN2 3246 ± 7 Å2) showed a slightly broader envelope relative to the monomer, which is consistent with the increased structural heterogeneity due to the additional glycoform combinations.50 A plot of the specific CCS values determined for each of the detected monomer (Region 1) and dimer (Region 2) charge states illustrates the global conformational landscape of the native S-RBD O-glycoforms (Figure 3E, Table S1). The variations in the conformational heterogeneity of the S-RBD O-glycoforms were found to be mobility region specific and separable under TIMS-MS analysis, illustrating the potential of this approach for investigating the gas-phase structural variations of glycoproteins.
Comprehensive Characterization of S-RBD O-Glycoforms by High-Resolution Hybrid Top-Down MS.
Although S-RBD glycoforms can be inferred from the native TIMS-MS analysis, we cannot assign the glycan structures or occupancy from only the results presented in Figures 2 and 3 due to the mass degeneracy and microheterogeneity of O-glycans.36,61 To reveal the intact S-RBD O-glycoform structures and their sites, native top-down TIMS-MS/MS analysis was performed using the timsTOF Pro (Figure 4). Following specific isolation of the native S-RBD O-glycoform ensemble (11+ charge state, 2388.3 m/z), MS/MS fragment ions obtained from collisionally activated dissociation (CAD) were output from the Bruker DataAnalysis software and analyzed in targeted protein analysis mode using MASH Explorer62 for proteoform characterization (Figure 4A).
Figure 4.

Native top-down MS/MS and native TIMS-MS of intact S-RBD O-glycoforms after PNGase F treatment. (A) Isolation of native monomer (z = 11+, centered at 2388.3 m/z) from MS followed by MS/MS analysis of isolated precursor. (Inset) Associated ion mobility heat map after isolation of the precursor and after CAD fragmentation. (B) Representative CAD fragment ions (b61+, b22011+, b141+, b471+, b404+, and b61+) obtained from the native MS/MS analysis with glycosite localized to Thr323 corresponding to Core 1 GalNAcGalNeuAc, GalNAcGal(NeuAc)2, and GalNAcGal glycoforms and Core 2 GalNAc(GalNeuAc)(GlcNAcGal) and GalNAcGal(GalNeuAc)(GlcNAcGalNeuAc) glycoforms. Theoretical ion distributions are indicated by the red dots, and mass accuracy errors are listed for each fragment ion. (C) Normalized extracted ion mobility spectra (EIMs) of various ion mobility regions isolated from the native monomer (z = 10+). O-Glycoform structures corresponding to the various EIMs are shown (compounds 1–3). MS isolation and ion mobility peak value are included for each EIM. Broad features suggest diverse structural heterogeneity between the various glycoforms. (D) Collision cross section of the S-RBD monomer (10+ charge state) obtained under nitrogen drift gas (TIMSCCSN2) for the various EIM compounds shown in C. Compounds 1, 2, and 3 (Comp 1, 2, and 3) correspond to GalNAcGalNeuAc, GalNAcGal(NeuAc)2, and GalNAcGal(GalNeuAc)(GlcNAcGalNeuAc) glycoforms, respectively. Nonglycosylated S-RBD (no glycan) X-ray structure (PDB: 6M0J) with disulfide bonds highlighted in yellow is used as the reference. Data are representative of n = 3 independent experiments with error bars indicating the standard deviation of the mean.
This approach allowed for direct characterization of the glycan structures, their glycosite localization, and their microheterogeneity to reveal multiple S-RBD glycoforms with Core 1 (Galβ1–3GalNAc-Ser/Thr) and Core 2 (GlcNAcβ1–6(Galβ1–3)GalNAc-Ser/Thr) O-glycan structures (Figure 4B). The major O-glycoforms identified were Core 1 glycan structures, namely, GalNAcGal, GalNAcGalNeuAc, and GalNAcGalNeuAc2 (most abundant glycoform), and Core 2 GalNAc(GalNeuAc)(GlcNAcGal) and GalNAcGal(GalNeuAc)(GlcNAcGalNeuAc) glycan structures. The most abundant glycoform identified for the dimeric S-RBD (15+ charge state) corresponds to a deconvoluted mass of 52 257.22 Da, consistent with the expected sequence mass of dimeric S-RBD with Core 1 GalNAcGalNeuAc2 (52 257.54 Da, protein sequence map provided in Figure S10). All of the detected S-RBD O-glycans were confidently assigned solely to Thr323 (Figure S10). Coincidentally, this Thr323 residue is also n + 1 adjacent to a proline at residue 322, which is consistent with previous reports of increased O-glycosylation frequency near proline residues.63 Importantly, the precise localization of the S-RBD O-glycoforms to Thr323 reported here addresses the O-glycosite ambiguity in the previous studies on HEK293-derived S-RBD encountered using bottom-up MS approaches.20,21 We found that some glycoforms were sufficiently separated in ion mobility and m/z to enable CCS determination (Figure 4C and Figure S11). Compared to the nonglycosylated S-RBD (~2180 Å2), the O-glycosylated S-RBD showed a notable CCS increase (~60 Å2 for the GalNAcGal(GalNeuAc)(GlcNAcGalNeuAc) glycan), which is consistent with a previous report on the effects of single-extended O-glycan structure elongation on protein CCS (Figure 4D).61 The ability to connect between specific S-RBD O-glycoforms and their gas-phase structural heterogeneity enables deeper insights into the structural diversity of these complex O-glycoforms. We note that the broad feature shown in the extracted ion mobility spectra for the various glycoforms suggests diverse structural and conformational heterogeneity that hinder the ion mobility resolution by the timsTOF Pro (Figure 4C). In addition, due to the presence of multiple disulfide bonds and the low MS/MS signal abundance corresponding to the lower abundance S-RBD proteoforms, we found that CAD fragmentation on the timsTOF Pro alone was not sufficient for complete characterization of all S-RBD O-glycoforms.
To achieve in-depth glycoform analysis, we further utilized an ultrahigh-resolution 12T FTICR-MS equipped with CAD and electron capture dissociation (ECD) fragmentation modes64,65 and capable of baseline isotopically resolving the S-RBD O-glycoforms for MS/MS analysis (see Materials and Methods for details, Figure S12). Following further MS1 analysis, individual glycoforms were directly visualized with high resolution (Figure 5A and 5B). Following specific quadrupole isolation centered at appropriate m/z widths to capture individual S-RBD proteoforms (Figure 5C), the resolved intact glycoforms can be characterized by MS/MS using a combination of fragmentation strategies to achieve confident protein sequence assignments (Figure 5D).
Figure 5.

S-RBD O-glycoform proteoform analysis by high-resolution top-down MS. (A) MS1 analysis of S-RBD O-glycoforms following denaturation. (B) Magnified MS1 from A showing isotopically and baseline resolved S-RBD proteoforms allowing for accurate determination of individual intact glycoforms. Most abundant charge state (15+) is isolated. Theoretical isotope distributions (red circles) are overlaid on the experimentally obtained mass spectrum to illustrate the high mass accuracy. All individual ion assignments are within 1 ppm from the theoretical mass. (C) Illustration of the isolation of a specific S-RBD glycoform using ultrahigh-resolution FTICR to enable glycan site and structure characterization from intact glycoforms. (D) MS/MS characterization of S-RBD proteoform isolated from the quadrupole window centered at 1760.5 m/z. Assignments of the glycan structures are marked in the spectrum with the legend shown on the right side. Glycoform characterization reveals the specific S-RBD proteoform to have a Core 2 type GalNAcGal(GalNeuAc)(GlcNAcGalFuc) glycan. Neutral loss glycan products are labeled. N-Terminal acetylation (Ac) is labeled and corresponds to a +42 Da mass shift. Solid star represents the 15+ charge state precursor ion corresponding to 1760.5 m/z, and hollow star represents the 15+ charge state precursor ion corresponding to 1757.7 m/z (−Ac). Asterisk “*” denotes an oxonium ion loss.
By applying this method on all detectable S-RBD proteoforms, a suite of MS/MS spectra was generated for sequence analysis (Figure S13). This approach allowed for in-depth characterization of the O-glycoforms to reveal multiple additional S-RBD glycoforms with Core 1 and Core 2 O-glycan structures (Figure 5; full details in Figures S14–S20). This high-resolution method enables the structural characterization of glycoforms that have not been previously observed. As shown for one such example in Figure 5D (highlighted in the red box on the right), neutral loss mapping revealed a Core 2 (GlcNAcβ1–6(Galβ1–3)GalNAc-Ser/Thr) glycoform (15+ most abundant charge state, centered at 1760.5 m/z) with a GalNAcGal(GalNeuAc)(GlcNAcGalFuc) structure at Thr323. Direct visualization of MS/MS fragment ions obtained from CAD/ECD along with the corresponding proteoform sequence mapping confirms the glycan structure assignment with high mass accuracy (Figure S14). A similar fucosylated Core 2 O-glycan structure but lacking the terminal NeuAc was previously reported for HEK293-derived S-RBD identified from glycopeptide digests (reported as HexNAc2Hex2Fuc1).20 Moreover, the majority of the O-glycan identifications in this previous study focused on a specific site (T678) and other potential sites outside of the RBD.20 In contrast, using our intact glycoform top-down MS/MS approach, we observed the complete GalNAcGal(GalNeuAc)(GlcNAcGalFuc) glycan structure without terminal NeuAc neutral loss by MS1, and the previously reported NeuAc neutral loss O-glycan structure was detected as a fragment ion byproduct during MS/MS analysis (Figure 5 and Figure S14A). The preservation of intact glycoform structures by this hybrid top-down MS approach underscores the importance of intact proteoform-level analysis to unambiguously assign complex O-glycan structures. In addition, the GalNAcGal(GalNeuAc)(GlcNAcGalFuc)-related proteoform without N-terminal acetylation (15+ most abundant charge state, centered at 1757.7 m/z) was also characterized (Figure S14). Therefore, the high-resolution glycoform mapping presented in Figure 5 illustrates a unique strength of this native top-down MS approach to achieve isotopically resolved and high-accuracy characterization of highly heterogeneous glycoproteins, a major challenge in intact glycoprotein analysis.36,66
We also identified and characterized Core 1 (Galβ1–3GalNAc-Ser/Thr) O-glycan structures such as GalNAcGalNeuAc (15+ most abundant charge state, centered at 1723.8 m/z) (Figure S15) and GalNAcGal(NeuAc)2 (15+ most abundant charge state, centered at 1743.2 m/z) (Figure S16). Interestingly, these two Core 1 O-glycans were previously reported for the S-RBD as potential modifications; however, the previous studies were not able to resolve the exact glycoforms and O-glycosite due to the challenges arising from inferring intact glycoprotein structures from peptide digests and the low signal abundance of O-glycans under conventional MS analysis.20,21,33 However, our native top-down MS strategy enables us to unambiguously reveal the exact glycoform corresponding to each of these Core 1 O-glycans. We detected an additional proteoform centered at 1745.5 m/z that could not be comprehensively characterized on both timsTOF Pro and FTICR due to low fragment ion abundance and close proximity to other glycoforms (Figure S17). However, this particular proteoform was found to only represent a minor ~4% of the total S-RBD proteoform abundance (Figure 6). Three additional Core 2 glycan structures were identified: GalNAcGal(GalNeuAc)(GlcNAcGal) (15+ most abundant charge state, centered at 1748.1 m/z, with additional N-terminal acetylated proteoform found at 1750.5 m/z) (Figures S18 and 19), GalNAcGal(GalNeuAc)(GlcNAcGal + S) (15+ most abundant charge state, centered at 1756.2 m/z, with N-terminal acetylation and additional sulfonation (S)) (Figure S20), and GalNAcGal(GalNeuAc)(GlcNAcGalNeuAc) (centered at 1767.6 m/z) (Figure S21).
Figure 6.

Complete characterization of the structures and relative abundance of S-RBD O-glycoforms by hybrid top-down MS. (A) Deconvoluted MS of the S-RBD O-glycoforms showing all eight intact glycan assignments revealed by top-down MS/MS. Experimental and theoretical mass assignments are illustrated for each glycoform. (B) Summary of the O-glycoform characterization for the S-RBD with the relative abundance and mass accuracy of each identified glycoform. Masses are reported as the monoisotopic mass. (C) Illustration of S-RBD O-glycan microheterogeneity identified by specific proteoform isolation and sequencing.
This hybrid native top-down MS approach enables the proteoform-resolved characterization of S-RBD O-glycoforms to identify and characterize multiple S-RBD O-glycoforms as well as a novel fucose-containing glycoform with Core 2 GalNAcGal(GalNeuAc)(GlcNAcGalFuc) glycan structure (Figure 6A). Figure 6A shows all eight identified O-glycoforms of the S-RBD, which are also listed in the table in Figure 6B. As a unique advantage of the top-down MS approach, the molecular abundance of each intact protein glycoform can be relatively quantified. We found that the relative abundance of Core 1 to Core 2 S-RBD O-glycan structures was roughly 67:27, with the Core 1 GalNAcGal(NeuAc)2 being the most abundant O-glycoform (~65% relative abundance) (Figure 6B). This ability to unambiguously elucidate the structure of a specific S-RBD glycoform with high accuracy and quantify its relative abundance demonstrates the distinct advantages of this native top-down MS strategy over glycopeptide-based bottom-up MS approaches.44,61 Together, this proteoform-resolved intact glycoprotein analysis strategy enables the simultaneous characterization of O-glycan structures of the S-RBD and its microheterogeneity, including structure and relative molecular abundance (Figure 6B,C). Importantly, the accurate determination of the relative abundance of intact glycoforms provides the technical foundation to understand the functional significance of these distinct glycoforms of the S protein in the future. We note that the S-RBD studied here is recombinant rather than virus derived or extracted after viral egress in cell culture models of infection and thus will require additional investigation from viral models to establish the functional roles of these O-glycoforms. Although these identified O-glycoforms are specifically for S-RBD expressed from HEK293 systems, the HEK293 cell expression system is known to reflect the glycosylation sites expected for the viron,16,20,21,67 and the S-RBD is currently one of the antigens used for vaccine candidates and virus functional studies.68,69
CONCLUSION
In summary, the combination of native TIMS-MS and MS/MS from the timsTOF Pro and top-down MS from ultrahigh-resolution 12 T FTICR-MS enables the deep and comprehensive analysis of the intact glycoforms of the S-RBD. The native TIMS-MS analysis establishes direct connections between specific S-RBD proteoforms and their structural heterogeneity to provide new insights into the structural diversity of the S-RBD O-glycoforms. Importantly, we report the complete structural characterization of eight S-RBD O-glycoforms along with a Core 2-fucosylated glycan structure not previously reported. Moreover, the relative molecular abundances of each of these intact glycoforms can be quantified, providing new insights into the complex landscape of S-RBD O-glycosylation. Our proteoform-resolved method provides complete structural characterization of O-glycan microheterogeneity and complex glycoproteins. This hybrid top-down mass spectrometry approach not only enables the comprehensive analysis of the S-RBD and the molecular signatures of emerging S-RBD variants of SARS-CoV-2 toward structure–function studies in the future but also can help catalyze the studies of other O-glycoproteins in general.
MATERIALS AND METHODS
Materials and Reagents.
All chemicals and reagents were purchased from MilliporeSigma (Burlington, MA, USA) and used as received without further purification unless otherwise noted. Aqueous solutions were made in nanopure deionized water (H2O) from Milli-Q water (MilliporeSigma). Ammonium acetate (AA) was purchased from Fisher Scientific (Fair Lawn, NJ). Bradford protein assay reagent was purchased from Bio-Rad (Hercules, CA, USA). A 10% gel (10 or 15 comb well, 10.0 cm × 10.0 cm, 1.0 mm thick) for SDS-polyacrylamide gel electrophoresis (SDS-PAGE) was homemade. Thermo Scientific Cimarec+ stirring hot plates were purchased from ThermoFisher Scientific. Amicon 0.5 mL cellulose ultra centrifugal filters with a molecular weight cutoff (MWCO) of 10 kDa were purchased from MilliporeSigma. The recombinant SARS-CoV-2 spike regional-binding domain protein expressed in the HEK 293 cell line was purchased from Sino Biological Inc. (cat. 40592-VNAH).
Complete N-Glycan Removal for O-Glycan Protein Analysis.
Peptide-N-glycosidase F (PNGase F) (New England Biolabs Inc., cat. P0704S) was used for complete removal of N-linked oligosaccharides. Briefly, 20 μg of protein sample was buffer exchanged into 150 mM AA (pH = 7.4) solution by washing the sample five times through a 10 kDa Amicon ultra centrifugal filter (MilliporeSigma, Burlington, MA, USA). PNGase F (5 U) was then added to the protein solution, and samples were incubated at 37 °C for 12 h on a Thermo Scientific Cimarec+ stirring hot plate.
Sample Preparation.
Native protein samples were prepared by buffer exchanging into 150 mM AA solution by washing the sample five times through a 10 kDa Amicon ultra centrifugal filter (MilliporeSigma, Burlington, MA, USA). The protein sample was then diluted to 20 μM in 150 mM AA prior to native top-down MS analysis. Denatured protein samples were reduced using 20 mM tris(2-carboxyethyl)phosphine hydrochloride (TCEP) and followed by buffer exchanging into 0.1% formic acid solution by washing the sample five times through a 10 kDa Amicon ultra centrifugal filter (MilliporeSigma, Burlington, MA, USA). The protein sample was then diluted to 20 μM in a 1:1 acetonitrile:water solution with 0.1% formic acid prior to top-down MS analysis. Protein samples subjected to N-glycan removal were prepared similarly following PNGase F reaction.
Top-Down MS Analysis.
Intact protein samples were analyzed by nanoelectrospray ionization via direct infusion using a TriVersa Nanomate system (Advion BioSciences, Ithaca, NY, USA) coupled to a solariX XR 12-T Fourier Transform Ion Cyclotron Resonance mass spectrometer64,65 (FTICR-MS, Bruker Daltonics, Billerica, MA, USA). For the nanoelectrospray ionization source using a TriVersa Nanomate, the desolvating gas pressure was set at 0.45 PSI and the voltage was set to 1.2–1.6 kV versus the inlet of the mass spectrometer. The source dry gas flow rate was set to 4 L/min at 124 °C. For the source optics, the capillary exit, deflector plate, funnel 1, skimmer voltage, funnel RF amplitude, octopole frequency, octopole RF amplitude, collision cell RF frequency, and collision cell RF amplitude were optimized at 190 V, 200 V, 100 V, 35 V, 250 Vpp, 2 MHz, 490 Vpp, 2 MHz, and 2000 Vpp, respectively. Mass spectra were acquired with an acquisition size of 4M-words of data (with a resolution of 530 000 at 400 m/z) in the mass range between 200 and 4000 m/z, and a minimum of 250 scans were accumulated for each sample. Ions were accumulated in the collision cell for 0.1 s, and a time-of-flight of 1.5 ms was used prior to their transfer to the ICR cell. For collisionally activated dissociation (CAD) tandem MS (MS/MS) experiments, the collision energy was varied from 10 to 30 V, ion accumulation was optimized to 400 ms, and acquisition size was 4M-words of data. For electron capture dissociation (ECD) MS/MS experiments, the pulse length, ECD bias, and ECD lens were set to 0.1 s, 0.6 V, and 15 V, respectively, and the ion accumulation was optimized to 1800 ms. Tandem mass spectra were output from the DataAnalysis 4.3 (Bruker Daltonics) software and analyzed using MASH Explorer.62
Native Top-Down MS Analysis.
A timsTOF Pro mass spectrometer (Bruker Daltonics, Bremen, Germany) was coupled to a Bruker nanoElute LC system (Bruker Daltonics, Bremen, Germany). Samples were directly infused using the nanoElute, injecting 5 μL of native protein sample with a flow rate of 1 μL/min. For the MS inlet, the end plate offset and capillary voltage were set to 500 and 3800 V, respectively. The nebulizer gas pressure (N2) was set to 1.5 bar with a dry gas flow rate of 6 L/min at 180 °C. The tunnel out, tunnel in, and TOF vacuum pressures were set to 0.8584, 2.577, and 1.752 × 10⁻⁷ mBar. To calibrate the MS and trapped ion mobility spectrometry (TIMS) device, Agilent tune mix was directly infused to provide species of known mass and reduced mobility.37 For MS calibration, the MS resolution for the most abundant calibrant signal, 1222 m/z, was 62 000. Calibrant points at 922, 1222, and 1522 m/z were used for TIMS calibration. The TIMS resolution for the most abundant calibrant signal, 1222 m/z, was 80.2 CCS/ΔCCS. IMS tunnel voltage deltas were optimized at −20, −120, 25, 50, 0, and 30 V for Δ1, Δ2, Δ3, Δ4, Δ5, and Δ6, respectively. TIMS funnel 1 RF was set to 200 Vpp, and TIMS collision cell energy was set to 200 V. An IMS imeX accumulation time of 50 ms and cycle ramp time of 400 ms were found to yield optimal resolving power without compromising the native structure. The TIMS accumulation time was locked to the mobility range (typically 0.9–1.5 1/K0). In the MS transfer optics the funnel 1 RF, funnel 2 RF, deflection delta, in-source collision-induced dissociation (isCID) energy, multipole RF, and quadrupole ion energy were optimized at 200 Vpp, 500 Vpp, 55 V, 100 eV, 800 Vpp, and 3 eV, respectively. For MS1 spectral collection, the quadrupole low mass was set to 500 m/z with a scan range of 200–5000 m/z. The collision energy was set to 4 eV, with a 3500 Vpp collision cell RF, a 100 μs transfer time, and a prepulse storage time of 22 μs. For MS/MS spectral collection, the quadrupole low mass was set to 200 m/z with a scan range from 200 to 5000 m/z. The collision cell RF was set to 3500 Vpp; a 100 μs transfer time and a prepulse storage time of 22 μs were used. Mass spectra were output from the DataAnalysis 5.3 (Bruker Daltonics) software and analyzed using MASH Explorer.62
Data Analysis.
All data were processed and analyzed using Compass DataAnalysis 4.3/5.3 and MASH Explorer.62 Maximum Entropy algorithm (Bruker Daltonics) was used to deconvolute all mass spectra with the resolution set to 80 000 for the timsTOF Pro or the instrument peak width set to 0.05 for the 12T FTICR. The sophisticated numerical annotation procedure (SNAP) peak-picking algorithm (quality factor 0.4; signal-to-noise ratio (S/N) 3.0; intensity threshold 500) was applied to determine the monoisotopic mass of all detected ions. The relative abundance for each protein isoform was determined using DataAnalysis. To quantify protein modifications, the relative abundances of specific modifications were calculated as their corresponding percentages among all of the detected protein forms in the deconvoluted averaged mass. MS/MS data were output from the DataAnalysis software and analyzed using MASH Explorer62 for proteoform identification and sequence mapping. All of the program-processed data were manually validated. For peak picking, the sophisticated numerical annotation procedure (SNAP) algorithm from Bruker DataAnalysis 5.3 was used with a quality threshold of 0.5 and an S/N lower threshold of 3. All fragment ions were manually validated using MASH Explorer. Peak extraction was performed using a signal-to-noise ratio of 3 and a minimum fit of 60%, and all peaks were subjected to manual validation. All identifications were made with satisfactory numbers of assigned fragment (>10), and a 25 ppm mass tolerance was used to match the experimental fragment ions to the calculated fragment ions based on the amino acid sequence. For ion mobility analysis by timsTOF Pro, the collisional cross section (CCS) in Å2 for a species of interest was determined via the Mason–Schamps equation (eq 1)
| (1) |
where μ is the reduced mass of the ion–gas pair (, where m and M are the ion and gas particle masses), kb is Boltzmann’s constant, T is the drift region temperature, z is the ionic charge, e is the charge of an electron, N0 is the buffer gas density, and K0 is the reduced mobility. Equation 1 was selected to agree with previously published CCS calculations.54,55,70 Theoretical CCS values were determined using the IMPACT method.59
Supplementary Material
ACKNOWLEDGMENTS
This research was supported by NIH R01 GM117058 (to S.J. and Y.G.). Y.G. would like to acknowledge NIH R01 GM125085, R01 HL096971, and S10 OD018475. D.S.R. would like to acknowledge support from the American Heart Association Predoctoral Fellowship Grant No. 832615/David S. Roberts/2021. We thank Guillaume Tremintin, Yue Ju, Conor Mullins, Christian Albers, Oliver Raether, Melvin Park, Michael Greig, Gary Kruppa, Paul Speir, and Rohan Thakur of Bruker Daltonics for their helpful discussion and provision of the Bruker timsTOF Pro used in this work.
Footnotes
The authors declare no competing financial interest.
Source data are available via the MassIVE repository with identifier MSV000087891 and the PRIDE repository via ProteomeXchange with identifier PXD027605.
Supporting Information
The Supporting Information is available free of charge at https://pubs.acs.org/doi/10.1021/jacs.1c02713.
Native S-RBD without PNGaseF treatment; native TIMS-MS optimization and analysis of the S-RBD O-glycoforms; S-RBD proteoform characterization illustration by top-down MS; detailed analysis of top-down MS/MS fragmentation data for each S-RBD O-glycoform; table summarizing CCS values determined for the native S-RBD (PDF)
Complete contact information is available at: https://pubs.acs.org/10.1021/jacs.1c02713
Contributor Information
David S. Roberts, Department of Chemistry, University of Wisconsin—Madison, Madison, Wisconsin 53706, United States;.
Morgan Mann, Department of Medicine, School of Medicine and Public Health, University of Wisconsin—Madison, Madison, Wisconsin 53705, United States;.
Eli J. Larson, Department of Chemistry, University of Wisconsin—Madison, Madison, Wisconsin 53706, United States;.
Yanlong Zhu, Human Proteomics Program, School of Medicine and Public Health and Department of Cell and Regenerative Biology, University of Wisconsin—Madison, Madison, Wisconsin 53705, United States;.
Allan R. Brasier, Department of Medicine, School of Medicine and Public Health and Institute for Clinical and Translational Research, University of Wisconsin—Madison, Madison, Wisconsin 53705, United States;.
Song Jin, Department of Chemistry, University of Wisconsin—Madison, Madison, Wisconsin 53706, United States;.
Ying Ge, Department of Chemistry, University of Wisconsin—Madison, Madison, Wisconsin 53706, United States; Department of Medicine, School of Medicine and Public Health and Human Proteomics Program, School of Medicine and Public Health, University of Wisconsin—Madison, Madison, Wisconsin 53705, United States;.
REFERENCES
- (1).Wu F; Zhao S; Yu B; Chen Y-M; Wang W; Song Z-G; Hu Y; Tao Z-W; Tian J-H; Pei Y-Y; Yuan M-L; Zhang Y-L; Dai F-H; Liu Y; Wang Q-M; Zheng J-J; Xu L; Holmes EC; Zhang Y-Z A new coronavirus associated with human respiratory disease in China. Nature 2020, 579 (7798), 265–269. [DOI] [PMC free article] [PubMed] [Google Scholar]
- (2).World Health Organization. Coronavirus Disease (COVID-19) Weekly Epidemiological Update for June 8th 2021; WHO, 2021. [Google Scholar]
- (3).Yan R; Zhang Y; Li Y; Xia L; Guo Y; Zhou Q Structural basis for the recognition of SARS-CoV-2 by full-length human ACE2. Science 2020, 367 (6485), 1444. [DOI] [PMC free article] [PubMed] [Google Scholar]
- (4).Liu C; Zhou Q; Li Y; Garner LV; Watkins SP; Carter LJ; Smoot J; Gregg AC; Daniels AD; Jervey S; Albaiu D Research and Development on Therapeutic Agents and Vaccines for COVID-19 and Related Human Coronavirus Diseases. ACS Cent. Sci 2020, 6 (3), 315–331. [DOI] [PMC free article] [PubMed] [Google Scholar]
- (5).Jackson LA; Anderson EJ; Rouphael NG; Roberts PC; Makhene M; Coler RN; McCullough MP; Chappell JD; Denison MR; Stevens LJ; Pruijssers AJ; McDermott A; Flach B; Doria-Rose NA; Corbett KS; Morabito KM; O’Dell S; Schmidt SD; Swanson PA; Padilla M; Mascola JR; Neuzil KM; Bennett H; Sun W; Peters E; Makowski M; Albert J; Cross K; Buchanan W; Pikaart-Tautges R; Ledgerwood JE; Graham BS; Beigel JH An mRNA Vaccine against SARS-CoV-2 — Preliminary Report. N. Engl. J. Med 2020, 383 (20), 1920–1931. [DOI] [PMC free article] [PubMed] [Google Scholar]
- (6).Hansen J; Baum A; Pascal KE; Russo V; Giordano S; Wloga E; Fulton BO; Yan Y; Koon K; Patel K; Chung KM; Hermann A; Ullman E; Cruz J; Rafique A; Huang T; Fairhurst J; Libertiny C; Malbec M; Lee W.-y.; Welsh R; Farr G; Pennington S; Deshpande D; Cheng J; Watty A; Bouffard P; Babb R; Levenkova N; Chen C; Zhang B; Romero Hernandez A; Saotome K; Zhou Y; Franklin M; Sivapalasingam S; Lye DC; Weston S; Logue J; Haupt R; Frieman M; Chen G; Olson W; Murphy AJ; Stahl N; Yancopoulos GD; Kyratsous CA Studies in humanized mice and convalescent humans yield a SARSCoV-2 antibody cocktail. Science 2020, 369 (6506), 1010. [DOI] [PMC free article] [PubMed] [Google Scholar]
- (7).Starr TN; Greaney AJ; Hilton SK; Ellis D; Crawford KHD; Dingens AS; Navarro MJ; Bowen JE; Tortorici MA; Walls AC; King NP; Veesler D; Bloom JD Deep Mutational Scanning of SARS-CoV-2 Receptor Binding Domain Reveals Constraints on Folding and ACE2 Binding. Cell 2020, 182 (5), 1295–1310. [DOI] [PMC free article] [PubMed] [Google Scholar]
- (8).Shu Y; McCauley J GISAID: Global initiative on sharing all influenza data – from vision to reality. Eurosurveillance 2017, 22 (13), 30494. [DOI] [PMC free article] [PubMed] [Google Scholar]
- (9).Thomson EC; Rosen LE; Shepherd JG; Spreafico R; da Silva Filipe A; Wojcechowskyj JA; Davis C; Piccoli L; Pascall DJ; Dillen J; Lytras S; Czudnochowski N; Shah R; Meury M; Jesudason N; De Marco A; Li K; Bassi J; O’Toole A; Pinto D; Colquhoun RM; Culap K; Jackson B; Zatta F; Rambaut A; Jaconi S; Sreenu VB; Nix J; Zhang I; Jarrett RF; Glass WG; Beltramello M; Nomikou K; Pizzuto M; Tong L; Cameroni E; Croll TI; Johnson N; Di Iulio J; Wickenhagen A; Ceschi A; Harbison AM; Mair D; Ferrari P; Smollett K; Sallusto F; Carmichael S; Garzoni C; Nichols J; Galli M; Hughes J; Riva A; Ho A; Schiuma M; Semple MG; Openshaw PJM; Fadda E; Baillie JK; Chodera JD; Rihn SJ; Lycett SJ; Virgin HW; Telenti A; Corti D; Robertson DL; Snell G Circulating SARSCoV-2 spike N439K variants maintain fitness while evading antibody-mediated immunity. Cell 2021, 184 (5), 1171–1187. [DOI] [PMC free article] [PubMed] [Google Scholar]
- (10).Walls AC; Park Y-J; Tortorici MA; Wall A; McGuire AT; Veesler D Structure, Function, and Antigenicity of the SARSCoV-2 Spike Glycoprotein. Cell 2020, 181 (2), 281–292. [DOI] [PMC free article] [PubMed] [Google Scholar]
- (11).Walls AC; Xiong X; Park Y-J; Tortorici MA; Snijder J; Quispe J; Cameroni E; Gopal R; Dai M; Lanzavecchia A; Zambon M; Rey FA; Corti D; Veesler D Unexpected Receptor Functional Mimicry Elucidates Activation of Coronavirus Fusion. Cell 2019, 176 (5), 1026–1039. [DOI] [PMC free article] [PubMed] [Google Scholar]
- (12).Andersen KG; Rambaut A; Lipkin WI; Holmes EC; Garry RF The proximal origin of SARS-CoV-2. Nat. Med 2020, 26 (4), 450–452. [DOI] [PMC free article] [PubMed] [Google Scholar]
- (13).Casalino L; Gaieb Z; Goldsmith JA; Hjorth CK; Dommer AC; Harbison AM; Fogarty CA; Barros EP; Taylor BC; McLellan JS; Fadda E; Amaro RE Beyond Shielding: The Roles of Glycans in the SARS-CoV-2 Spike Protein. ACS Cent. Sci 2020, 6 (10), 1722–1734. [DOI] [PMC free article] [PubMed] [Google Scholar]
- (14).Xiong X; Tortorici MA; Snijder J; Yoshioka C; Walls AC; Li W; McGuire AT; Rey FA; Bosch B-J; Veesler D Glycan Shield and Fusion Activation of a Deltacoronavirus Spike Glycoprotein Fine-Tuned for Enteric Infections. J. Virol 2018, 92 (4), e01628. [DOI] [PMC free article] [PubMed] [Google Scholar]
- (15).Grant OC; Montgomery D; Ito K; Woods RJ Analysis of the SARS-CoV-2 spike protein glycan shield reveals implications for immune recognition. Sci. Rep 2020, 10 (1), 14991. [DOI] [PMC free article] [PubMed] [Google Scholar]
- (16).Watanabe Y; Allen JD; Wrapp D; McLellan JS; Crispin M Site-specific glycan analysis of the SARS-CoV-2 spike. Science 2020, 369, 330–333. [DOI] [PMC free article] [PubMed] [Google Scholar]
- (17).Darula Z; Medzihradszky KF Analysis of Mammalian OGlycopeptides—We Have Made a Good Start, but There is a Long Way to Go*. Mol. Cell. Proteomics 2018, 17 (1), 2–17. [DOI] [PMC free article] [PubMed] [Google Scholar]
- (18).Ko BJ; Brodbelt JS Comparison of glycopeptide fragmentation by collision induced dissociation and ultraviolet photodissociation. Int. J. Mass Spectrom 2015, 377, 385–392. [DOI] [PMC free article] [PubMed] [Google Scholar]
- (19).Escobar EE; King DT; Serrano-Negrón JE; Alteen MG; Vocadlo DJ; Brodbelt JS Precision Mapping of O-Linked NAcetylglucosamine Sites in Proteins Using Ultraviolet Photodissociation Mass Spectrometry. J. Am. Chem. Soc 2020, 142 (26), 11569–11577. [DOI] [PMC free article] [PubMed] [Google Scholar]
- (20).Sanda M; Morrison L; Goldman R N- and O-Glycosylation of the SARS-CoV-2 Spike Protein. Anal. Chem 2021, 93 (4), 2003–2009. [DOI] [PMC free article] [PubMed] [Google Scholar]
- (21).Shajahan A; Supekar NT; Gleinich AS; Azadi P Deducing the N- and O-glycosylation profile of the spike protein of novel coronavirus SARS-CoV-2. Glycobiology 2020, 30 (12), 981–988. [DOI] [PMC free article] [PubMed] [Google Scholar]
- (22).Varki A Biological roles of glycans. Glycobiology 2017, 27 (1), 3–49. [DOI] [PMC free article] [PubMed] [Google Scholar]
- (23).Miller LM; Barnes LF; Raab SA; Draper BE; El-Baba TJ; Lutomski CA; Robinson CV; Clemmer DE; Jarrold MF Heterogeneity of Glycan Processing on Trimeric SARS-CoV-2 Spike Protein Revealed by Charge Detection Mass Spectrometry. J. Am. Chem. Soc 2021, 143 (10), 3959–3966. [DOI] [PMC free article] [PubMed] [Google Scholar]
- (24).Jensen PH; Kolarich D; Packer NH Mucin-type O-glycosylation – putting the pieces together. FEBS J. 2010, 277 (1), 81–94. [DOI] [PubMed] [Google Scholar]
- (25).Wu D; Struwe WB; Harvey DJ; Ferguson MAJ; Robinson CV N-glycan microheterogeneity regulates interactions of plasma proteins. Proc. Natl. Acad. Sci. U. S. A 2018, 115 (35), 8763. [DOI] [PMC free article] [PubMed] [Google Scholar]
- (26).Riley NM; Hebert AS; Westphall MS; Coon JJ Capturing site-specific heterogeneity with large-scale N-glycoproteome analysis. Nat. Commun 2019, 10 (1), 1311. [DOI] [PMC free article] [PubMed] [Google Scholar]
- (27).Khatri K; Klein JA; White MR; Grant OC; Leymarie N; Woods RJ; Hartshorn KL; Zaia J Integrated Omics and Computational Glycobiology Reveal Structural Basis for Influenza A Virus Glycan Microheterogeneity and Host Interactions*. Mol. Cell. Proteomics 2016, 15 (6), 1895–1912. [DOI] [PMC free article] [PubMed] [Google Scholar]
- (28).Serapian SA; Marchetti F; Triveri A; Morra G; Meli M; Moroni E; Sautto GA; Rasola A; Colombo G The Answer Lies in the Energy: How Simple Atomistic Molecular Dynamics Simulations May Hold the Key to Epitope Prediction on the Fully Glycosylated SARS-CoV-2 Spike Protein. J. Phys. Chem. Lett 2020, 11 (19), 8084–8093. [DOI] [PMC free article] [PubMed] [Google Scholar]
- (29).Mayr J; Lau K; Lai JCC; Gagarinov IA; Shi Y; McAtamney S; Chan RWY; Nicholls J; von Itzstein M; Haselhorst T Unravelling the Role of O-glycans in Influenza A Virus Infection. Sci. Rep 2018, 8 (1), 16382. [DOI] [PMC free article] [PubMed] [Google Scholar]
- (30).Suenaga T; Matsumoto M; Arisawa F; Kohyama M; Hirayasu K; Mori Y; Arase H Sialic Acids on Varicella-Zoster Virus Glycoprotein B Are Required for Cell-Cell Fusion. J. Biol. Chem 2015, 290 (32), 19833–19843. [DOI] [PMC free article] [PubMed] [Google Scholar]
- (31).Falkowska E; Kajumo F; Garcia E; Reinus J; Dragic T Hepatitis C Virus Envelope Glycoprotein E2 Glycans Modulate Entry, CD81 Binding, and Neutralization. J. Virol 2007, 81 (15), 8072. [DOI] [PMC free article] [PubMed] [Google Scholar]
- (32).Korber B; Fischer WM; Gnanakaran S; Yoon H; Theiler J; Abfalterer W; Hengartner N; Giorgi EE; Bhattacharya T; Foley B; Hastie KM; Parker MD; Partridge DG; Evans CM; Freeman TM; de Silva TI; Angyal A; Brown RL; Carrilero L; Green LR; Groves DC; Johnson KJ; Keeley AJ; Lindsey BB; Parsons PJ; Raza M; Rowland-Jones S; Smith N; Tucker RM; Wang D; Wyles MD; McDanal C; Perez LG; Tang H; Moon-Walker A; Whelan SP; LaBranche CC; Saphire EO; Montefiori DC Tracking Changes in SARS-CoV-2 Spike: Evidence that D614G Increases Infectivity of the COVID-19 Virus. Cell 2020, 182 (4), 812–827. [DOI] [PMC free article] [PubMed] [Google Scholar]
- (33).Riley NM; Bertozzi CR; Pitteri SJ A Pragmatic Guide to Enrichment Strategies for Mass Spectrometry–Based Glycoproteomics. Mol. Cell. Proteomics 2021, 20, 100029. [DOI] [PMC free article] [PubMed] [Google Scholar]
- (34).Wilkinson H; Saldova R Current Methods for the Characterization of O-Glycans. J. Proteome Res 2020, 19 (10), 3890–3905. [DOI] [PubMed] [Google Scholar]
- (35).Smith LM; Kelleher NL; et al. Proteoform: a single term describing protein complexity. Nat. Methods 2013, 10, 186–187. [DOI] [PMC free article] [PubMed] [Google Scholar]
- (36).Wang G; de Jong RN; van den Bremer ETJ; Parren PWHI; Heck AJR Enhancing Accuracy in Molecular Weight Determination of Highly Heterogeneously Glycosylated Proteins by Native Tandem Mass Spectrometry. Anal. Chem 2017, 89 (9), 4793–4797. [DOI] [PMC free article] [PubMed] [Google Scholar]
- (37).Leney AC; Rafie K; van Aalten DMF; Heck AJR Direct Monitoring of Protein O-GlcNAcylation by High-Resolution Native Mass Spectrometry. ACS Chem. Biol 2017, 12 (8), 2078–2084. [DOI] [PMC free article] [PubMed] [Google Scholar]
- (38).Yang Y; Liu F; Franc V; Halim LA; Schellekens H; Heck AJR Hybrid mass spectrometry approaches in glycoprotein analysis and their usage in scoring biosimilarity. Nat. Commun 2016, 7 (1), 13397. [DOI] [PMC free article] [PubMed] [Google Scholar]
- (39).Tiambeng TN; Roberts DS; Brown KA; Zhu Y; Chen B; Wu Z; Mitchell SD; Guardado-Alvarez TM; Jin S; Ge Y Nanoproteomics enables proteoform-resolved analysis of low-abundance proteins in human serum. Nat. Commun 2020, 11 (1), 3903. [DOI] [PMC free article] [PubMed] [Google Scholar]
- (40).Melby JA; Roberts DS; Larson EJ; Brown KA; Bayne EF; Jin S; Ge Y Novel Strategies to Address the Challenges in Top-Down Proteomics. J. Am. Soc. Mass Spectrom 2021, 32 (6), 1278–1294. [DOI] [PMC free article] [PubMed] [Google Scholar]
- (41).Brown KA; Melby JA; Roberts DS; Ge Y Top-down proteomics: challenges, innovations, and applications in basic and clinical research. Expert Rev. Proteomics 2020, 17 (10), 719–733. [DOI] [PMC free article] [PubMed] [Google Scholar]
- (42).Chen B; Brown KA; Lin Z; Ge Y Top-Down Proteomics: Ready for Prime Time? Anal. Chem 2018, 90 (1), 110–127. [DOI] [PMC free article] [PubMed] [Google Scholar]
- (43).Vimer S; Ben-Nissan G; Morgenstern D; Kumar-Deshmukh F; Polkinghorn C; Quintyn RS; Vasil’ev YV; Beckman JS; Elad N; Wysocki VH; Sharon M Comparative Structural Analysis of 20S Proteasome Ortholog Protein Complexes by Native Mass Spectrometry. ACS Cent. Sci 2020, 6 (4), 573–588. [DOI] [PMC free article] [PubMed] [Google Scholar]
- (44).Zhou M; Lantz C; Brown KA; Ge Y; Paša-Tolić L; Loo JA; Lermyte F Higher-order structural characterisation of native proteins and complexes by top-down mass spectrometry. Chem. Sci 2020, 11 (48), 12918–12936. [DOI] [PMC free article] [PubMed] [Google Scholar]
- (45).Li H; Nguyen HH; Ogorzalek Loo RR; Campuzano IDG; Loo JA An integrated native mass spectrometry and top-down proteomics method that connects sequence to structure and function of macromolecular complexes. Nat. Chem 2018, 10, 139. [DOI] [PMC free article] [PubMed] [Google Scholar]
- (46).Wohlschlager T; Scheffler K; Forstenlehner IC; Skala W; Senn S; Damoc E; Holzmann J; Huber CG Native mass spectrometry combined with enzymatic dissection unravels glycoform heterogeneity of biopharmaceuticals. Nat. Commun 2018, 9 (1), 1713. [DOI] [PMC free article] [PubMed] [Google Scholar]
- (47).Rabuck-Gibbons JN; Keating JE; Ruotolo BT Collision induced unfolding and dissociation differentiates ATP-competitive from allosteric protein tyrosine kinase inhibitors. Int. J. Mass Spectrom 2018, 427, 151–156. [Google Scholar]
- (48).Leney AC; Heck AJR Native Mass Spectrometry: What is in the Name? J. Am. Soc. Mass Spectrom 2017, 28 (1), 5–13. [DOI] [PubMed] [Google Scholar]
- (49).Hernandez H; Robinson CV Determining the stoichiometry and interactions of macromolecular assemblies from mass spectrometry. Nat. Protoc 2007, 2 (3), 715–26. [DOI] [PubMed] [Google Scholar]
- (50).Liu FC; Cropley TC; Ridgeway ME; Park MA; Bleiholder C Structural Analysis of the Glycoprotein Complex Avidin by Tandem-Trapped Ion Mobility Spectrometry–Mass Spectrometry (Tandem-TIMS/MS). Anal. Chem 2020, 92 (6), 4459–4467. [DOI] [PMC free article] [PubMed] [Google Scholar]
- (51).Wei J; Tang Y; Ridgeway ME; Park MA; Costello CE; Lin C Accurate Identification of Isomeric Glycans by Trapped Ion Mobility Spectrometry-Electronic Excitation Dissociation Tandem Mass Spectrometry. Anal. Chem 2020, 92 (19), 13211–13220. [DOI] [PMC free article] [PubMed] [Google Scholar]
- (52).Michelmann K; Silveira JA; Ridgeway ME; Park MA Fundamentals of Trapped Ion Mobility Spectrometry. J. Am. Soc. Mass Spectrom 2015, 26 (1), 14–24. [DOI] [PubMed] [Google Scholar]
- (53).Jeanne Dit Fouque K; Garabedian A; Leng F; Tse-Dinh YC; Ridgeway ME; Park MA; Fernandez-Lima F Trapped Ion Mobility Spectrometry of Native Macromolecular Assemblies. Anal. Chem 2021, 93 (5), 2933–2941. [DOI] [PMC free article] [PubMed] [Google Scholar]
- (54).Dodds JN; Baker ES Ion Mobility Spectrometry: Fundamental Concepts, Instrumentation, Applications, and the Road Ahead. J. Am. Soc. Mass Spectrom 2019, 30 (11), 2185–2195. [DOI] [PMC free article] [PubMed] [Google Scholar]
- (55).Kirk SR; Liu FC; Cropley TC; Carlock HR; Bleiholder C On the Preservation of Non-covalent Peptide Assemblies in a Tandem-Trapped Ion Mobility Spectrometer-Mass Spectrometer (TIMS-TIMS-MS). J. Am. Soc. Mass Spectrom 2019, 30 (7), 1204–1212. [DOI] [PubMed] [Google Scholar]
- (56).Benigni P; Marin R; Molano-Arevalo JC; Garabedian A; Wolff JJ; Ridgeway ME; Park MA; Fernandez-Lima F Towards the analysis of high molecular weight proteins and protein complexes using TIMS-MS. Int. J. Ion Mobility Spectrom 2016, 19 (2), 95–104. [DOI] [PMC free article] [PubMed] [Google Scholar]
- (57).Ridgeway ME; Lubeck M; Jordens J; Mann M; Park MA Trapped ion mobility spectrometry: A short review. Int. J. Mass Spectrom 2018, 425, 22–35. [Google Scholar]
- (58).Brun J; Vasiljevic S; Gangadharan B; Hensen M; Chandran AV; Hill ML; Kiappes JL; Dwek RA; Alonzi DS; Struwe WB; Zitzmann N Assessing Antigen Structural Integrity through Glycosylation Analysis of the SARS-CoV-2 Viral Spike. ACS Cent. Sci 2021, 7 (4), 586–593. [DOI] [PMC free article] [PubMed] [Google Scholar]
- (59).Marklund EG; Degiacomi MT; Robinson CV; Baldwin AJ; Benesch JLP Collision Cross Sections for Structural Proteomics. Structure 2015, 23 (4), 791–799. [DOI] [PubMed] [Google Scholar]
- (60).Lan J; Ge J; Yu J; Shan S; Zhou H; Fan S; Zhang Q; Shi X; Wang Q; Zhang L; Wang X Structure of the SARS-CoV-2 spike receptor-binding domain bound to the ACE2 receptor. Nature 2020, 581 (7807), 215–220. [DOI] [PubMed] [Google Scholar]
- (61).Yen H-Y; Liko I; Gault J; Wu D; Struwe WB; Robinson CV Correlating Glycoforms of DC-SIGN with Stability Using a Combination of Enzymatic Digestion and Ion Mobility Mass Spectrometry. Angew. Chem., Int. Ed 2020, 59 (36), 15560–15564. [DOI] [PMC free article] [PubMed] [Google Scholar]
- (62).Wu Z; Roberts DS; Melby JA; Wenger K; Wetzel M; Gu Y; Ramanathan SG; Bayne EF; Liu X; Sun R; Ong IM; McIlwain SJ; Ge Y MASH Explorer: A Universal Software Environment for Top-Down Proteomics. J. Proteome Res 2020, 19 (9), 3867–3876. [DOI] [PMC free article] [PubMed] [Google Scholar]
- (63).Halim A; Rüetschi U; Larson G; Nilsson J LC–MS/MS Characterization of O-Glycosylation Sites and Glycan Structures of Human Cerebrospinal Fluid Glycoproteins. J. Proteome Res 2013, 12 (2), 573–584. [DOI] [PubMed] [Google Scholar]
- (64).Jin Y; Lin Z; Xu Q; Fu C; Zhang Z; Zhang Q; Pritts WA; Ge Y Comprehensive characterization of monoclonal antibody by Fourier transform ion cyclotron resonance mass spectrometry. mAbs 2019, 11 (1), 106–115. [DOI] [PMC free article] [PubMed] [Google Scholar]
- (65).Tucholski T; Knott SJ; Chen BF; Pistono P; Lin ZQ; Ge Y A Top-Down Proteomics Platform Coupling Serial Size Exclusion Chromatography and Fourier Transform Ion Cyclotron Resonance Mass Spectrometry. Anal. Chem 2019, 91 (6), 3835–3844. [DOI] [PMC free article] [PubMed] [Google Scholar]
- (66).McIlwain SJ; Wu Z; Wetzel M; Belongia D; Jin Y; Wenger K; Ong IM; Ge Y Enhancing Top-Down Proteomics Data Analysis by Combining Deconvolution Results through a Machine Learning Strategy. J. Am. Soc. Mass Spectrom 2020, 31 (5), 1104–1113. [DOI] [PMC free article] [PubMed] [Google Scholar]
- (67).Bagdonaite I; Wandall HH Global aspects of viral glycosylation. Glycobiology 2018, 28 (7), 443–467. [DOI] [PMC free article] [PubMed] [Google Scholar]
- (68).Yang J; Wang W; Chen Z; Lu S; Yang F; Bi Z; Bao L; Mo F; Li X; Huang Y; Hong W; Yang Y; Zhao Y; Ye F; Lin S; Deng W; Chen H; Lei H; Zhang Z; Luo M; Gao H; Zheng Y; Gong Y; Jiang X; Xu Y; Lv Q; Li D; Wang M; Li F; Wang S; Wang G; Yu P; Qu Y; Yang L; Deng H; Tong A; Li J; Wang Z; Yang J; Shen G; Zhao Z; Li Y; Luo J; Liu H; Yu W; Yang M; Xu J; Wang J; Li H; Wang H; Kuang D; Lin P; Hu Z; Guo W; Cheng W; He Y; Song X; Chen C; Xue Z; Yao S; Chen L; Ma X; Chen S; Gou M; Huang W; Wang Y; Fan C; Tian Z; Shi M; Wang F-S; Dai L; Wu M; Li G; Wang G; Peng Y; Qian Z; Huang C; Lau JY-N; Yang Z; Wei Y; Cen X; Peng X; Qin C; Zhang K; Lu G; Wei X A vaccine targeting the RBD of the S protein of SARS-CoV-2 induces protective immunity. Nature 2020, 586 (7830), 572–577. [DOI] [PubMed] [Google Scholar]
- (69).Shaan Lakshmanappa Y; Elizaldi SR; Roh JW; Schmidt BA; Carroll TD; Weaver KD; Smith JC; Verma A; Deere JD; Dutra J; et al. SARS-CoV-2 induces robust germinal center CD4 T follicular helper cell responses in rhesus macaques. Nat. Commun 2021, 12 (1), 541. [DOI] [PMC free article] [PubMed] [Google Scholar]
- (70).Revercomb HE; Mason EA Theory of plasma chromatography/gaseous electrophoresis. Review. Anal. Chem 1975, 47 (7), 970–983. [Google Scholar]
Associated Data
This section collects any data citations, data availability statements, or supplementary materials included in this article.