

Abstract
It is widely accepted that redox reprogramming participates in malignant transformation of lung adenocarcinoma (LUAD). However, the source of excessive reactive oxygen species (ROS) and the downstream signaling regulatory mechanism are complicated and unintelligible. In the current study, we newly identified the aquaporin 3 (AQP3) as a LUAD oncogenic factor with capacity to transport exogenous hydrogen peroxide (H2O2) and increase intracellular ROS levels. Subsequently, we demonstrated that AQP3 was necessary for the facilitated diffusion of exogenous H2O2 in LUAD cells and that the AQP3‐dependent transport of H2O2 accelerated cell growth and inhibited rapamycin‐induced autophagy. Mechanistically, AQP3‐mediated H2O2 uptake increased intracellular ROS levels to inactivate PTEN and activate the AKT/mTOR pathway to subsequently inhibit autophagy and promote proliferation in LUAD cells. Finally, we suggested that AQP3 depletion retarded subcutaneous tumorigenesis in vivo and simultaneously decreased ROS levels and promoted autophagy. These findings underscore the importance of AQP3‐induced oxidative stress in malignant transformation and suggest a therapeutic target for LUAD.
Keywords: AQP3, autophagy, hydrogen peroxide, LUAD, proliferation
Aquaporin 3 (AQP3) is a lung adenocarcinoma (LUAD) oncogene with the capacity to transport exogenous hydrogen peroxide (H2O2) and increase intracellular ROS levels. The devitalized oxidation of PTEN by AQP3‐transported H2O2 induces the hyperactivation of the PI3K/AKT/mTOR pathway to subsequently inhibit autophagy and promote proliferation in LUAD cells.

1. INTRODUCTION
Non–small cell lung cancer (NSCLC), the leading cause of cancer morbidity and mortality worldwide,1 mainly originates from malignant transformation of the bronchial epithelium and differs from other solid tumors due to its immediate contact with the atmosphere.2 Therefore, excessive reactive oxygen species (ROS) derived from air pollution or generated from NADPH oxidases (NOXs) activated by external stimuli are closely involved in NSCLC development.3, 4
In our previous study, we focused on the double‐edged roles of ROS in malignant transformation and demonstrated that abnormal ROS levels play paradoxical roles in cell growth and death during different stages of cancer formation.5 Hydrogen peroxide (H2O2), the main type of ROS, undergoes transmembrane transport and acts as a second messenger that regulates the downstream signaling network and thus participates in lung cancer progression.6, 7 In the current study, we proved that exogenous H2O2 plays paradoxical roles on lung adenocarcinoma (LUAD) growth in concentration‐dependent manners and identified 10‐20 μmol/L as “proliferative” concentration.
Simple diffusion was thought to be the primary approach of H2O2 transmembrane transport.8 However, recent findings challenged this commonly held view and established that the facilitated diffusion of H2O2 via specific types of aquaporin (AQP) channels plays a leading role in ROS uptake in mammalian cells.9 AQP3 and AQP8 have been proved to promote H2O2 uptake in HEK293T and breast cancer cells.10, 11 However, it is not clear whether AQP‐dependent transmembrane transport of H2O2 participates in LUAD progression and which isoform is responsible. Even though recent studies have shown AQP3 plays oncogenic roles in lung cancer,12, 13, 14 the underlying mechanism is still indistinct and needs further investigation.
In the current study, we described the AQP expression profiles of multiple human malignancies by bioinformatic analysis and found that compared with other AQP subtypes, AQP3 mRNA was more highly expressed in LUAD and implicated poor prognosis. Immunohistochemistry (IHC) and Western blotting also showed AQP3 protein levels were higher in LUAD tissues than normal tissues and negatively correlated with prognosis. To further explore the oncogenic mechanism of AQP3 in LUAD, we conducted Kyoto Encyclopedia of Genes and Genomes (KEGG) enrichment analysis to explore potential downstream pathways and found that AQP3 is closely related to peroxisome metabolism (catalase [CAT] and peroxidase) and the PI3K/AKT/mTOR pathway. Based on these findings, in subsequent experiments, we proved AQP3 could facilitate the uptake of exogenous H2O2 in LUAD cells and revealed that AQP3‐dependent H2O2 transmembrane transport inactivated phosphatase and tensin homolog deleted on chromosome 10 (PTEN), which subsequently activated the AKT/mTOR pathway. Meanwhile, in proliferative H2O2 concentration (20 μmol/L), AQP3 depletion eliminated the acceleration of H2O2 on LUAD cell growth.
Autophagy is inhibited by the hyperactivation of AKT/mTOR signaling.15, 16 Therefore, we investigated the influence of H2O2 on autophagy in LUAD cells and observed that H2O2 at a proliferative concentration suppressed rapamycin (Rapa)‐induced autophagy, which could be counteracted by AQP3 depletion. In a tissue Microarray (TMA) containing tissues from 74 LUAD patients, we tested the relationships between AQP3, 8‐hydroxy‐2′‐deoxyguanosine (8‐oxo, an oxidative stress biomarker) and p62 (SQSTM1, an autophagosome marker). Positive correlations were found between all pairs among these factors. In vivo experiments showed that AQP3 depletion not only inhibited the subcutaneous tumorigenicity of LUAD cells but also decreased intracellular ROS levels and promoted cancer cell autophagy.
Taken together, these results indicate that AQP3 is a LUAD oncogene that facilitates H2O2 uptake and demonstrate that the AQP3‐dependent transmembrane transport of H2O2 inactivates PTEN and activates the AKT/mTOR pathway to subsequently inhibit autophagy and promote proliferation in LUAD. The above molecular mechanism of AQP3 carcinogenesis in LUAD, which may serve as a candidate target for new therapies.
2. MATERIALS AND METHODS
2.1. Patient tissue samples and LUAD cell lines
TMAs and matched follow‐up data (10 years) were purchased from the biobank of the Outdo Biotech Company. Fresh paired LUAD samples were obtained from the Thoracic Surgery Department of the Cancer Hospital of China Medical University (Liaoning Cancer Hospital & Institute) between January 2019 and January 2020. Histological diagnoses and differentiation were evaluated independently by three pathologists using hematoxylin‐ and eosin‐stained slides according to the WHO classification system.17 The A549 and H1299 cell lines were purchased from the Shanghai Cell Bank and cultured in RPMI 1640 medium supplemented with 10% fetal bovine serum (FBS) and 1% penicillin/streptomycin in a humidified atmosphere containing 5% CO2 at 37°C.
2.2. Immunohistochemical analysis
Aquaporin 3, p62, and 8‐oxo expressions were analyzed in Tissue Microarrays (TMAs) by IHC analysis. The TMAs were deparaffinized in xylene and dehydrated three times before antigen retrieval for 5 minutes each with an autoclave. Hydrogen peroxide (0.3%) was used to block endogenous peroxidase activity; nonspecific immunoglobulin‐binding sites were blocked by incubation with normal goat serum for 30 minutes at 37°C. The TMAs were incubated with primary antibody overnight at 4°C or 2 hours at room temperature. Then, the sections were incubated with biotinylated goat anti‐rabbit IgG as a secondary antibody (Maixin Kit, China) for 1 hour at room temperature, followed by incubation with horseradish peroxidase–conjugated streptavidin‐biotin for 30 minutes at room temperature. The peroxidase reaction was developed with 3′‐diaminobenzidine tetrahydrochloride. Protein expression levels were semiquantitatively scored based on the percentage of positively stained cells combined with the staining intensity as described in our previous study.18
2.3. Western blotting
For reducing electrophoresis, total cell lysates were prepared in RIPA buffer consisting of 50 mmol/L Tris‐HCl, 150 mmol/L NaCl, 1% NP‐40, 0.25% deoxycholic acid, 10% glycerol, 1 mmol/L EDTA, and 1% Triton. After sonication and centrifugation (>15 000 g for 15 minutes at 4°C), protein concentrations were measured with a BCA Protein Quantitation Kit (Tiangen Biotech). LDS loading buffer containing dithiothreitol (Invitrogen) was added to the supernatant, which was boiled for 10 minutes. Then, the sample was subjected to polyacrylamide gel electrophoresis and electrotransferred to polyvinylidene difluoride membranes (Bio‐Rad). Each membrane was blocked for 2 hours at room temperature in milk (5%) and probed with primary antibodies overnight at 4°C, followed by incubation with secondary antibodies for 2 hours at room temperature. The immunoreactive bands were identified using an ECL system (Millipore).
For nonreducing condition electrophoresis, the cells were scraped into 300 μL of ice‐cold 50% trichloroacetic acid, briefly sonicated, and then centrifuged at 3000 g for 5 minutes at 4°C. The supernatants were removed, and the pellets were washed with acetone and then solubilized in 0.2 mL of 100 mmol/L Tris‐HCl buffer containing 2% SDS and 40 mmol/L N‐ethylmaleimide (NEM) (Sigma‐Aldrich). The same procedures used for reducing electrophoresis were conducted, except the samples were not boiled.
2.4. Cell transfection
For siAQP3 transfection, A549 or H1299 cells were plated in 6‐cm culture dishes and cultured until reaching 60% confluence. The transfection system consisted of 250 μL of Opti‐MEM, 5 μL of 20 µmol/L siAQP3 or si‐control, and 5 μL of Lipofectamine 3000 (Invitrogen). After mixing, the cells were incubated for 20 minutes at room temperature and added to 750 μL of complete medium. Forty‐eight hours later, the cells were collected to test the interference efficiency. For shAQP3 transfection, the FV055 vector containing the AmpR, GFP, and puromycin sequences was used to construct AQP3 shRNAs. Lentivirus was used to envelop AQP3 shRNA and transfected into A549 and H1299 cells for 24 hours. Subsequently, expression of the GFP gene was observed under a fluorescence microscope and screened with puromycin. The AQP3 siRNA and AQP3 shRNA sequences are presented in Table S1.
2.5. Intracellular H2O2 detection
A DCFH‐DA–tagged fluorescence (DCF) probe (KeyGEN) was used to test intracellular H2O2 levels according to the manufacturer's instructions. A fluorescence microplate reader or fluorescence confocal microscope (FCFM) was used to test DCF intensity. DCF (10 µmol/L) was added to cells in a culture dish, which were incubated for 20 minutes at 37°C and then washed three times with serum‐free cell culture medium to remove extracellular DCF. A fluorescence microplate reader was used to determine fluorescence with an excitation wavelength of 488 nm and emission wavelength of 525 nm. After Hoechst staining for 5 minutes, the cells were washed three times with serum‐free cell culture medium, and green fluorescence was observed with an FCFM.
2.6. CCK‐8 and colony formation assays
Approximately 1000 cells/well were plated in 96‐well plates for CCK‐8 assays and treated with H2O2 at 24 hours after adherence. Then, at 48 or 72 hours after adherence, 10 μL of CCK‐8 reagent (Solarbio) was added to each well and incubated for an additional 1 hour at 37°C, and the absorbance was measured at 450 nm. For colony formation assays, 500 cells/well in 6‐well plates or 1000 cells/well in 12‐well plates were cultured in medium containing 10% FBS and treated with H2O2 at 24 hours after adherence. Then, every 48 hours, the medium containing 10% FBS and the corresponding concentration of H2O2 was changed. After 10 days, the cells were washed with 1 mL of PBS, fixed, stained with a 0.1% crystal violet solution for 20 minutes, washed three times with PBS, and photographed after drying.
2.7. Exogenous LC3 fluorescence measurements
GFP‐LC3 (KeyGEN) and Ad‐mRFP‐GFP‐LC3 (Hanbio) were transfected into A549 and H1299 cells according to the manufacturers’ instructions. Twenty‐four hours after transfection, confocal microscopy was used to observe fluorescence. Forty‐eight hours after transfection, the cells used in subsequent experiment were treated with H2O2, Rapa, or CAT. DAPI (Sigma‐Aldrich) was used to stain the nuclei.
2.8. Tumorigenicity experiments in nude mice
A total of 18 male nude mice weighing 18‐20 g provided by Vital River (Beijing, China) were bred under aseptic conditions and housed under a constant humidity of 60%‐70% and room temperature of 18‐20°C. The mice were then randomly assigned into the following three groups: vector, shAQP3‐1, and shAQP3‐2 and were subcutaneously injected with shRNA‐transfected H1299 cells via the abdomen. Subsequently, the animals were examined every 3 days and sacrificed at 21 days after the initial injection, followed by resection and weighing of the tumors.
2.9. Statistical analysis
Statistical analyses were performed using SPSS 19.0 software. Parametric data are presented as the mean ± standard error of the mean (SEM), and differences between groups were analyzed using Student's t‐test. Correlations between IHC scores were calculated by Spearman analysis. All the reported P‐values were two‐sided, and significance was defined at P < .05.
3. RESULTS
3.1. The expression of AQP3 in LUAD
The AQP3 mRNA expression profiles in multiple malignancies based on data from the The Cancer Genome Atlas (TCGA) database showed that NSCLC specifically expressed AQP3 but not other AQP subtypes (Figure 1A). AQP3 mRNA was more highly expressed in LUAD tumor tissues than in normal tissues, and its expression levels were negatively correlated with prognosis (Figure 1B and C). Furthermore, AQP3 mRNA expression was not significantly different between LUSD tumor and normal tissues and was not related to prognosis (Figure 1B and D). Subsequent KEGG enrichment analysis showed that AQP3 mRNA expression was closely associated with peroxisome metabolism and the PI3K/AKT/mTOR pathway (Figure 1E and F).
FIGURE 1 AQUAPORIN 3.
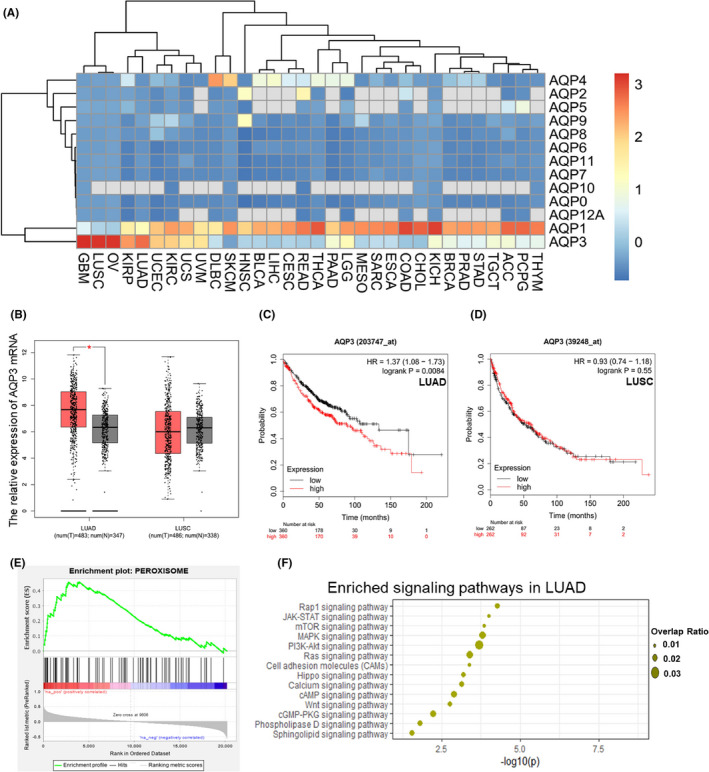
(AQP3) mRNA is highly expressed in lung adenocarcinoma (LUAD) patients and affects prognosis. A, AQP3 mRNA expression profiles in multiple malignancies based on data from the TCGA database showed that LUAD patients specifically express AQP3 and not the other AQP subtypes and that lung squamous carcinoma (LUSC) patients specifically expressed AQP3 and AQP1. B, AQP3 mRNA was more highly expressed in LUAD tumor tissues than in normal tissues (*P < .05). AQP3 mRNA expression was not significantly different between LUSC tumor tissues and normal tissues. C, LUAD patients with higher AQP3 mRNA levels had a relatively low survival probability (P = .0084). D, In LUSC patients, AQP3 mRNA expression showed no relation to survival probability (P =.55). E, F, KEGG enrichment showed AQP3 expression was correlated with peroxisome metabolism and the PI3K/AKT/mTOR pathway
AQP3 protein levels were tested in TMA containing 191 paired LUAD samples by IHC analysis (Figure 2A) and in 42 fresh paired tissue samples by Western blotting (Figure S1A). AQP3 was primarily located at the cytomembrane (Figure 2A) and more highly expressed in LUAD tumor tissues than in adjacent normal tissues (Figure 2B and C; Figure S1B and C). Next, we conducted prognostic and clinicopathologic analyses based on the results of IHC analysis of the TMA. Overall survival was significantly lower in patients with high AQP3 expression than in those with low AQP3 expression (Figure 2D). In addition, Cox multivariate analysis demonstrated that AQP3 protein levels, IASLC stage, and lymph metastasis are independent prognostic factors for LUAD (Figure 2E). The chi‐square test showed that AQP3 protein expression was significantly higher in LUAD patients with larger tumor sizes (≥5 cm) (Table S2).
FIGURE 2 AQUAPORIN 3.

(AQP3) protein is highly expressed in lung adenocarcinoma (LUAD) patients. A, AQP3 protein expression in TMA containing 191 paired LUAD samples was tested by immunohistochemistry (IHC) analysis. Each line in the microarray consisted of 18 spots (nine tumor tissues and nine adjacent normal tissues). Magnified images show the tumor tissues and normal tissues from two patients. The AQP3 IHC score for the upper tumor tissue was 12, while that for the lower tumor tissue was 6 (left). The AQP3 IHC score for the upper normal tissue was 1, while that for the lower normal tissue was 0 (right). B, The average AQP3 IHC scores in LUAD tumor tissues were higher than those in normal tissues (**P < .01). C, AQP3 expression in tumor tissues compared with normal tissues was increased in 108 cases (63.53%) and decreased in 42 cases (24.71%); no difference in AQP3 expression was found in 20 cases (11.76%). D, According to the AQP3 IHC scores for 191 LUAD tumor tissues, the overall survival rate in patients with high AQP3 expression was significantly lower than that in patients with low AQP3 expression (P = .005). E, Cox multivariate analysis demonstrated that AQP3 protein levels (P = .001), the IASLC stage (P < .001), and lymph metastasis (P = .006) are independent prognostic factors for LUAD patients. The use of bolding indicates statistical significance (P < .05)
3.2. AQP3 mediates the facilitated diffusion of H2O2 in LUAD
To explore the importance of AQP3 in LUAD progression, we focused on the ability of AQPs to transport H2O2. A DCF probe was used to test the transmembrane transport of exogenous H2O2 in the A549 and H1299 cell lines. The results showed that the DCF intensity peaked 30 minutes after H2O2 treatment and increased as the H2O2 concentration increased (Figure 3A and B). Then, we knocked down AQP3 with siAQP3 (Figure S2A) and compared the DCF intensity with that of the control groups at 30 minutes after treatment with H2O2 at different concentrations. We found that AQP3 knockdown (KD) significantly decreased H2O2 uptake in both A549 and H1299 cells (Figure 3C‐E). Therefore, we concluded that AQP3 mediates the facilitated diffusion of H2O2 in LUAD cells.
FIGURE 3 AQUAPORIN 3.
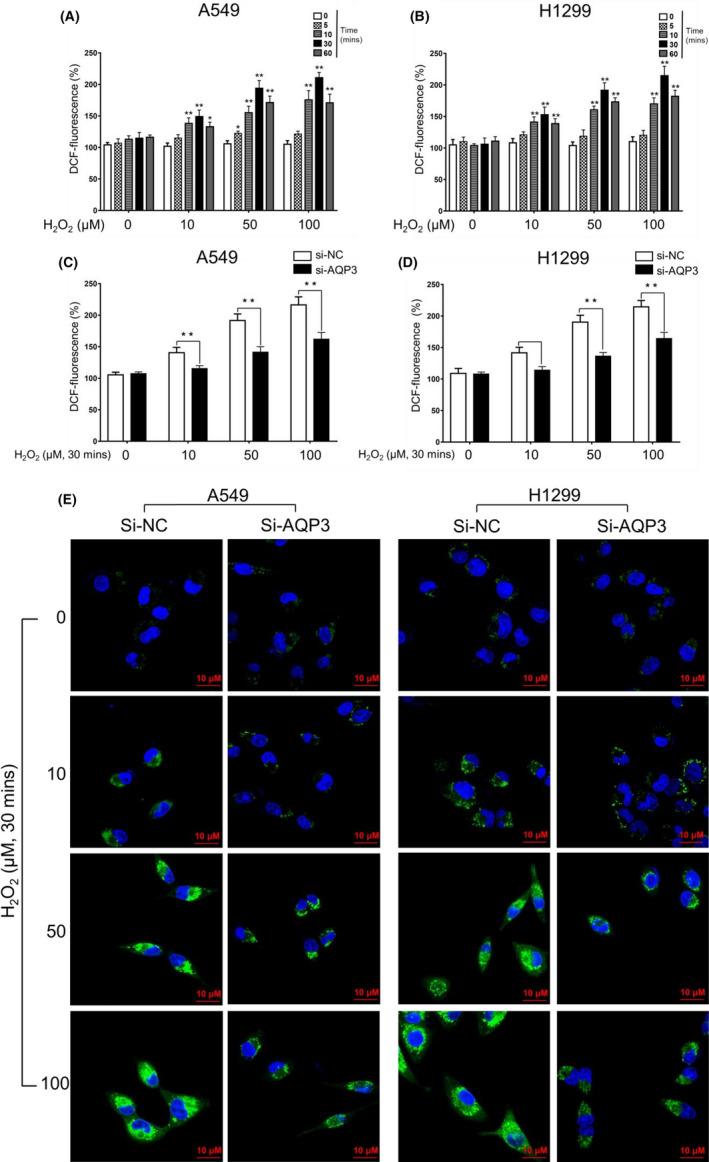
(AQP3) transport exogenous H2O2 in LUAD cells. A, B, Lung adenocarcinoma (LUAD) cells were incubated with the indicated concentration of H2O2 for the indicated duration. Intracellular H2O2 was detected with DA‐tagged fluorescence (DCF) by a fluorescence microplate reader. The results showed that the DCF intensity peaked 30 min after H2O2 treatment and increased as the H2O2 concentration increased (*P < .05, **P < .01). C, D, AQP3 KD by si‐AQP3 significantly decreased the intracellular DCF intensity 30 min after H2O2 treatment (**P < .01). E, DCF fluorescence was also observed by fluorescence confocal microscope (FCFM). Consistent with the results from the fluorescence microplate reader, AQP3 KD decreased the intracellular green fluorescence intensity
3.3. The double‐edged roles of H2O2 on LUAD cell growth
In our previous study, we showed the dual roles of ROS in cancer progression: abnormal ROS accumulation induces malignant transformation, while excessive ROS levels that exceed a threshold lead to cell death.5 We verified this point in LUAD cells and found that H2O2 at a low concentration (≤20 μmol/L) promoted cellular proliferation, but H2O2 at a high concentration (≥40 μmol/L) induced cell death (Figure 4A, C and E). Therefore, we defined 20 μmol/L as the proliferative concentration and focused on the biological functions of AQP3‐dependent H2O2 transport with H2O2 at this concentration in subsequent experiments.
FIGURE 4 AQUAPORIN 3.

(AQP3) depletion neutralizes the effect of H2O2 on proliferation, PTEN activity, and the AKT/mTOR pathway. A, Colony formation assays were used to test the dual effects of H2O2 on LUAD cell growth. H2O2 at 10‐20 μmol/L increased the colony number, and ≥40 μmol/L H2O2 sharply decreased the colony number and even led to cell death in H1299 cells (**P < .01). B, AQP3 depletion by shAQP3 alone had no effect on colony number but abrogated the effect of H2O2 (20 μmol/L) in promoting colony formation (**P < .01). C‐F, CCK‐8 assays showed that H2O2 (20 μmol/L) promoted lung adenocarcinoma (LUAD) cell growth and that ≥40 μmol/L H2O2 induced cell death. AQP3 depletion eliminated the effect of H2O2 on proliferation (*P < .05, **P < .01). G, After 30 min of treatment with H2O2 at the indicated concentration, PTEN activity was tested by nonreducing electrophoresis. PTEN was inactivated by ≥10 μmol/L H2O2, and the phosphorylation levels of AKT/mTOR were simultaneously increased. H, AQP3 depletion alone had no significant effect on PTEN activity or AKT/mTOR phosphorylation but counteracted the effects of H2O2 treatment
3.4. Depletion of AQP3 counteracted the proliferative effects of H2O2 in LUAD
Residue cysteine 124 in the purified PTEN protein was reported to specifically form disulfides with cysteine 71 upon oxidation by H2O2, subsequently inducing PTEN inactivation and causing the protein to migrate faster under nonreducing conditions.19 Using this method, we observed that exogenous H2O2 dissolved in the culture medium could inactivate PTEN in a concentration‐dependent manner (Figure 4G). Additionally, the phosphorylation levels of downstream AKT/mTOR were increased (Figure 4G). Depletion of AQP3 by shAQP3 (Figure S2B) not only eliminated the effect of H2O2 (20 μmol/L) in promoting proliferation (Figure 4B, D and F) but also restored PTEN activity and counteracted the activation of the AKT/mTOR pathway (Figure 4H). The addition of CAT, which specifically converts H2O2 into H2O and O2,20 added to the culture medium 30 minutes before H2O2 treatment also neutralized the effect of H2O2 on proliferation, PTEN activity, and the AKT/mTOR pathway (Figure S3A‐C). However, AQP3 depletion alone had no significant effect on proliferation (Figure 4B), PTEN activity, or AKT/mTOR phosphorylation (Figure 4H). Based on these findings, we inferred that the AQP3‐mediated facilitated diffusion of extracellular H2O2 activates the AKT/mTOR pathway by inactivating PTEN to subsequently promote LUAD proliferation.
3.5. H2O2 at its proliferative concentration inhibits autophagy in LUAD
Groundbreaking studies have demonstrated that the hyperactivation of AKT/mTOR inhibits autophagy.21, 22 Therefore, we assessed whether H2O2 affects autophagic activity in LUAD cells. The Western blot results showed that treatment with only H2O2 (20 μmol/L) had no effect on the LC3 I/II ratio or p62 expression (Figure 5A). However, upon initial treatment with Rapa for 4 hours followed by H2O2 treatment for 2 hours, the Rapa‐mediated induction of autophagy was remarkably inhibited by H2O2 (Figure 5A). We then examined autophagic activity by determining the subcellular redistribution of GFP‐LC3. Consistently, Rapa treatment for 6 hours increased the number of GFP‐LC3 puncta, but additional H2O2 treatment decreased the number of GFP‐LC3 puncta (Figure 5B and C). In addition, CAT treatment abrogated the effects of H2O2 on the LC3 I/II ratio and p62 expression (Figure S4A). These data suggest that H2O2 at its proliferative concentration negatively regulates autophagy in LUAD.
FIGURE 5 AQUAPORIN 3.

(H2O2 at its proliferative concentration inhibits autophagy in lung adenocarcinoma (LUAD) cells, which was neutralized by AQP3) depletion. A, Treatment with H2O2 alone had no effect on the LC3 I/II ratio or p62 expression. However, when Rapa treatment for 4 h was followed by H2O2 treatment for 2 h, the Rapa‐induced increase in autophagy was remarkably inhibited by H2O2. B, C, The exogenous GFP‐LC3 sequence was transfected, and autophagosome formation was monitored. H2O2 treatment alone had no effect on GFP‐LC3 puncta. Rapa treatment for 6 h increased the number of GFP‐LC3 puncta, and additional H2O2 treatment decreased the number of GFP‐LC3 puncta (**P < .01). D, Under conditions of Rapa‐induced autophagy, AQP3 depletion alone had no influence on the LC3 I/II ratio, p62 expression, or mTOR phosphorylation but counteracted the inhibitory effects of H2O2 on Rapa‐induced autophagy. E, F, To better assess autophagosome formation and autophagic flux, we transfected Ad‐mRFP‐GFP‐LC3 into LUAD cells in which AQP3 was depleted. Under conditions of Rapa‐induced autophagy, H2O2 treatment decreased the number of yellow/red puncta. AQP3 depletion alone had no effect on yellow/red puncta but counteracted the effects of H2O2 (**P < .01)
3.6. Depletion of AQP3 counteracted the inhibitory effects of H2O2 on autophagy
Regardless of whether Rapa treatment was applied, AQP3 depletion had no influence on the LC3 I/II ratio, p62 expression, or number of GFP‐LC3 puncta (Figure 5D; Figure S2C and D). Upon treatment with Rapa and H2O2, AQP3 depletion decreased the LC3 I/II ratio and p62 expression (Figure 5D). To better assess autophagosome formation and autophagic flux, we transfected AQP3‐depleted cells with Ad‐mRFP‐GFP‐LC3. In cells expressing mRFP‐GFP‐LC3 under low levels of autophagy, LC3 is revealed as green fluorescence. When autophagy is initiated, LC3 recruited to autophagosomes can be seen as yellow puncta (in merged images showing both red and green fluorescence); LC3 at autolysosomes is visualized as red puncta.23 The FCFM results showed that Rapa treatment caused the appearance of abundant yellow/red puncta (Figure S4B and C); when Rapa treatment was followed by H2O2 treatment, the number of yellow/red puncta was significantly reduced (Figure 5E and F; Figure S4B and C). Both AQP3 depletion and CAT treatment restored the yellow/red puncta (Figure 5E and F; Figure S4B and C). Taken together, these findings showed that the inhibitory effects of H2O2 on autophagy require AQP3.
3.7. AQP3 expression, ROS levels, and autophagy are intercorrelated in LUAD patients
In the above in vitro experiments, we established that AQP3‐dependent H2O2 uptake elevates intracellular ROS levels to inhibit autophagy in LUAD cells. To further validate this finding in clinical LUAD patients, we randomly selected 74 paired samples from 191 LUAD patients in the TMA and tested 8‐oxo and p62 expression by IHC analysis (Figure 6A and C). The results showed that tumor tissues had higher 8‐oxo and p62 expression levels than adjacent normal tissues (Figure 6E‐H). Moreover, the expression of both 8‐oxo and p62 was negatively correlated with the prognosis of LUAD patients (Figure 6B and D). Besides, a positive correlation between the levels of AQP3, 8‐oxo, and p62 was observed (Figure 6I‐K).
FIGURE 6 AQUAPORIN 3.

(AQP3) protein expression is positively correlated with the 8‐oxo and p62 protein expression. A, C, Seventy‐four pairs of samples were selected randomly from all 191 cases in the TMA. The 8‐oxo and p62 expressions were tested by immunohistochemistry (IHC) analysis. 8‐oxo was primarily observed in the nucleus, and p62 was primarily expressed in the cytoplasm. B, D, Based on IHC scores for the tumor samples, patients with higher 8‐oxo levels had a relatively low overall survival rate (P = .02); the same result was also observed in patients with higher p62 expression (P = .0044). E, The average 8‐oxo IHC scores in lung adenocarcinoma (LUAD) tumor tissues were higher than those in adjacent normal tissues (**P < .01). F, 8‐oxo levels in tumor tissues compared with normal tissues were increased in 52 cases (70.27%) and decreased in 21 cases (28.38%); no difference in the 8‐oxo level was found in one case (1.35%). G, The average p62 IHC scores in LUAD tumor tissues were higher than those in adjacent normal tissues (**P < .01). H, P62 expression in tumor tissues compared with normal tissues was increased in 51 cases (68.92%) and decreased in 20 cases (27.03%); no difference in p62 expression was found in three cases (4.05%). I‐K, Spearman analysis of the tumor sample IHC scores showed that the expression of AQP3, p62, and 8‐oxo are positively intercorrelated
3.8. Depletion of AQP3 inhibited LUAD cell growth in vivo
In general, the physiological concentrations of H2O2 in the normal extracellular microenvironment fall within the nanomolar range. In cancer cells, various growth factors and cytokines produced by the neovasculature stimulate NOX to generate excessive H2O2, the concentrations of which can reach the micromolar range.24 In an in vivo experiment, we used H1299 cells (A549 cells without tumorigenic xenografts) to test the influence of AQP3 on tumor growth. Subcutaneous tumorigenicity in nude mice was observed 21 days after cell injection, and a lower tumor weight and volume were observed in the shAQP3 groups than in the vector groups (Figure 7A‐C). In addition, compared with control cells, cancer cells depleted of AQP3 had relatively low ROS and phosphorylated AKT/mTOR levels and increased autophagy and PTEN activity (Figure 7D and E).
FIGURE 7 AQUAPORIN 3.

(AQP3) depletion inhibits subcutaneous tumor formation in nude mice. A‐C, Subcutaneous tumorigenicity experiments in nude mice showed that 21 d after H1299 cell injection, a lower tumor weight and volume were observed in the shAQP3 groups than in the vector groups (*P < .05, **P < .01). D, According to the immunohistochemistry (IHC) scores for serial sections of the xenograft tumors, the shAQP3 groups had lower 8‐oxo levels and p62 expression than the vector groups. E, According to Western blot analysis of the xenograft tumors, the shAQP3 groups had lower AKT/mTOR phosphorylation levels, LC3 I/II ratios, and p62 protein levels and higher PTEN activity than the vector groups
4. DISCUSSION
Recent advances have shown that compared with normal cells, both malignant cells and their microenvironment possess higher ROS levels.25, 26 Abnormal ROS accumulation is thought to have an oncogenic effect by contributing to the activation of proto‐oncogenes and inactivation of tumor suppressor genes, and ROS act as signaling molecules to induce malignant cell growth and metastasis.27, 28 Transmembrane NOXs are the only enzyme family with the sole role of generating extracellular ROS. Once activated, NOXs transfer electrons from NADPH in the cytosol to oxygen in the extracellular space to produce superoxide.29 Although superoxide is too strongly charged to readily cross the cytomembrane, its spontaneous dismutation to H2O2 by superoxide dismutase (SOD) permits transmembrane transport.30, 31 Before AQP‐mediated facilitated diffusion of H2O2 was identified,9 it was unintelligible why cancer cells had higher absorption rate of ROS. Thereafter, the roles of AQPs in malignant transformation began to receive increased attention.
AQPs, consisting of 13 subtypes (0‐12A), facilitate the transport of water (H2O) across cell membranes.32 Because H2O2 and H2O are structurally similar, a subset of AQPs also allow the transport of H2O2.33 AQP3 and AQP8 were first identified to specifically promote the uptake of H2O2 through membranes in human HEK293T cells.10 Next, in keratinocytes, AQP3‐mediated H2O2 transport was reported to be responsible for the development of psoriasis.34 In breast cancer, AQP3 controls migration by regulating H2O2 transport and its downstream PTEN/AKT signaling.11 In lung cancer, recent studies implicate AQP3 plays carcinogenic roles,12, 13 but its underlying mechanism is still indistinct.
Intracellular ROS accumulation is an initiating factor that induces the malignant transformation of bronchial epithelial cells.35 Therefore, investigating whether AQP‐dependent transmembrane transport of H2O2 participates in NSCLC progression and identifying which isoform is responsible are of great importance. In the current study, we determined AQP mRNA expression profiles in multiple cancers and found that NSCLC specifically expresses AQP3. In a subsequent experimental analysis, we proved that AQP3 mRNA and protein levels were higher in LUAD tissues than in normal tissues and correlated with poor prognosis. Moreover, AQP3 mRNA expression was found to be closely related to peroxisome metabolism, and AQP3 protein expression was positively correlated with ROS levels.
These findings suggest that AQP3 might facilitate the uptake of H2O2 in LUAD. Our speculation was confirmed by the finding that AQP3 KD notably inhibited the uptake of exogenous H2O2 in A549 and H1299 cells. Meanwhile, H2O2 at proliferative concentrations promoted LUAD cell proliferation, which was counteracted by AQP3 depletion. Collectively, these results identified the oncogenic effects of AQP3‐dependent H2O2 transport in LUAD. How does the AQP3‐dependent transmembrane transport of H2O2 participate in LUAD progression, and how is the downstream signaling pathway involved? The results from KEGG enrichment analysis indicated that AQP3 mRNA expression is related to the PI3K/AKT/mTOR pathway.
PTEN, an upstream inhibitor of the PI3K/AKT/mTOR pathway, is vulnerable to ROS accumulation due to the thiol‐disulfide transformation between cysteine 124 and cysteine 71.36 In LUAD cells, treatment with H2O2 at its proliferative concentration simultaneously oxidized PTEN and activated downstream AKT/mTOR signaling. AQP3 depletion not only inhibited the oncogenic effect of H2O2 on cell growth but also eliminated its influence on PTEN activity and AKT/mTOR phosphorylation levels. In addition to their roles as master regulators of mitosis,37 PTEN and the PI3K/AKT/mTOR axis are interconnected and integrated into an autophagy‐related cancer network that can ultimately affect the fate of cancer cells.38 Therefore, we were interested in detecting the effect of AQP3‐dependent H2O2 transmembrane transport on autophagy in LUAD cells.
Autophagy, an important stress‐responsive process, is widely involved in the pathogenesis of lung cancer.39, 40 The induction of dysregulated autophagy by oxidative stress is complicated and contradictory. On the one hand, excessive ROS levels promote the formation of autophagosomes via different signaling pathways, such as the ROS‐FOXO3‐LC3/BNIP3‐autophagy, ROS‐NRF2‐P62‐autophagy, ROS‐HIF1‐BNIP3/NIX‐autophagy, and ROS‐TIGAR‐autophagy pathways.41 On the other hand, ROS accumulation inhibits autophagy directly by activating AKT/mTOR or indirectly, as the transactivation of antioxidant gene responses to oxidative stress can also serve as a feedback loop to reduce autophagy.42 The paradoxical effects of ROS on autophagy depend on their distributions, concentrations, and durations in specific subcellular structures. In the current study, we proved that exogenous H2O2 at its proliferative concentration inhibited Rapa‐induced autophagy by activating the AKT/mTOR pathway in LUAD cells. AQP3 depletion eliminated the effect of H2O2 on autophagy. In LUAD patients, AQP3 protein levels were positively correlated with ROS levels and negatively correlated with autophagy levels. In vivo experiments showed that AQP3 depletion not only suppressed LUAD cell growth but also reduced ROS levels and enhanced autophagic activity. These findings suggest that AQP3‐dependent H2O2 transport inhibits autophagy by increasing intracellular ROS levels in LUAD.
Taken together, these findings identify AQP3 as a LUAD oncogenic factor that facilitates H2O2 uptake and demonstrate that the AQP3‐dependent transmembrane transport of H2O2 inactivates PTEN and activates the AKT/mTOR pathway to subsequently inhibit autophagy and promote proliferation in LUAD (Figure 8).
FIGURE 8 AQUAPORIN 3.

(In lung adenocarcinoma (LUAD) cells, AQP3) facilitates the transmembrane transport of extracellular H2O2, which inactivates PTEN and activates the AKT/mTOR pathway, subsequently inhibiting autophagy and promoting proliferation
ETHICS APPROVAL AND CONSENT TO PARTICIPATE
All patients in the current study have read and signed an informed consent. The project protocol was approved by the Institutional Ethics Committee of China Medical University (Shenyang, China). Animal experiments were performed in accordance with the rules of China Medical University for the Use of Experimental Animals and approved by the Medical Animal Care and Use Committee of China Medical University (Shenyang, China).
DISCLOSURE
All of the authors declare that they have no conflict of interest.
Supporting information
Figure S1
Figure S2
Figure S3
Figure S4
Tables S1‐S2
ACKNOWLEDGMENTS
This research was supported by National Natural Science Foundation of China (No. 82073286 and No.81972625); The Construction of Liaoning Cancer Research Center (Lung Cancer) (2019JH6/10200011); Technological Special Project of Liaoning Province of China (2019020176‐JH1/103); Central Financial Fund for Promoting Medical Service and Safeguarding Capability (Capability Construction of Medical and Health Organizations)—subsidy to the Construction of Provincial Key Specialty; Research Grant to Introduced Talents of Liaoning Cancer Hospital.
Wang Y, Chen D, Liu Y, et al. AQP3‐mediated H2O2 uptake inhibits LUAD autophagy by inactivating PTEN. Cancer Sci. 2021;112:3278–3292. 10.1111/cas.15008
Funding information
National Natural Science Foundation of China (Grant/Award Numbers: “81972625” and “82073286”).
Contributor Information
Hai‐long Piao, Email: hpiao@dicp.ac.cn.
Hong‐Xu Liu, Email: hxliu@cmu.edu.cn.
REFERENCES
- 1.Siegel RL, Miller KD, Jemal A. Cancer statistics, 2020. CA Cancer J Clin. 2020;70(1):7‐30. [DOI] [PubMed] [Google Scholar]
- 2.Yoshida K, Gowers KHC, Lee‐Six H, et al. Tobacco smoking and somatic mutations in human bronchial epithelium. Nature. 2020;578:266‐272. [DOI] [PMC free article] [PubMed] [Google Scholar]
- 3.Cruz‐Bermúdez A, Laza‐Briviesca R, Vicente‐Blanco RJ, et al. Cancer‐associated fibroblasts modify lung cancer metabolism involving ROS and TGF‐β signaling. Free Radic Biol Med. 2019;130:163‐173. [DOI] [PubMed] [Google Scholar]
- 4.Cáceres L, Paz ML, Garcés M, et al. NADPH oxidase and mitochondria are relevant sources of superoxide anion in the oxinflammatory response of macrophages exposed to airborne particulate matter. Ecotoxicol Environ Saf. 2020;205:111186. [DOI] [PubMed] [Google Scholar]
- 5.Wang Y, Qi H, Liu Y, et al. The double‐edged roles of ROS in cancer prevention and therapy. Theranostics. 2021;11:4839‐4857. [DOI] [PMC free article] [PubMed] [Google Scholar]
- 6.Park WH. MAPK inhibitors, particularly the JNK inhibitor, increase cell death effects in H2O2‐treated lung cancer cells via increased superoxide anion and glutathione depletion. Oncol Rep. 2018;39:860‐870. [DOI] [PubMed] [Google Scholar]
- 7.Schoenfeld JD, Sibenaller ZA, Mapuskar KA, et al. O(2)(⋅‐) and H(2)O(2)‐mediated disruption of Fe metabolism causes the differential susceptibility of NSCLC and GBM cancer cells to pharmacological ascorbate. Cancer Cell. 2017;31:487‐500.e488. [DOI] [PMC free article] [PubMed] [Google Scholar]
- 8.Lancaster JR Jr. Simulation of the diffusion and reaction of endogenously produced nitric oxide. Proc Natl Acad Sci USA. 1994;91:8137‐8141. [DOI] [PMC free article] [PubMed] [Google Scholar]
- 9.Bienert GP, Møller AL, Kristiansen KA, et al. Specific aquaporins facilitate the diffusion of hydrogen peroxide across membranes. J Biol Chem. 2007;282:1183‐1192. [DOI] [PubMed] [Google Scholar]
- 10.Miller EW, Dickinson BC, Chang CJ. Aquaporin‐3 mediates hydrogen peroxide uptake to regulate downstream intracellular signaling. Proc Natl Acad Sci USA. 2010;107:15681‐15686. [DOI] [PMC free article] [PubMed] [Google Scholar]
- 11.Satooka H, Hara‐Chikuma M. Aquaporin‐3 controls breast cancer cell migration by regulating hydrogen peroxide transport and its downstream cell signaling. Mol Cell Biol. 2016;36:1206‐1218. [DOI] [PMC free article] [PubMed] [Google Scholar]
- 12.Liu C, Liu L, Zhang Y, Jing H. Molecular mechanism of AQP3 in regulating differentiation and apoptosis of lung cancer stem cells through Wnt/GSK‐3β/β‐Catenin pathway. J BUON. 2020;25:1714‐1720. [PubMed] [Google Scholar]
- 13.Wang S, Wu Y, Yang S, et al. miR‐874 directly targets AQP3 to inhibit cell proliferation, mobility and EMT in non‐small cell lung cancer. Thorac Cancer. 2020;11:1550‐1558. [DOI] [PMC free article] [PubMed] [Google Scholar]
- 14.Chikuma MH, Watanabe S, Satooka H. Involvement of aquaporin‐3 in epidermal growth factor receptor signaling via hydrogen peroxide transport in cancer cells. Biochem Biophys Res Commun. 2016;471:603‐609. [DOI] [PubMed] [Google Scholar]
- 15.Dong X, Yang Y, Zou Z, et al. Sorting nexin 5 mediates virus‐induced autophagy and immunity. Nature. 2021;589(7842):456‐461. [DOI] [PMC free article] [PubMed] [Google Scholar]
- 16.Nowosad A, Jeannot P, Callot C, et al. p27 controls Ragulator and mTOR activity in amino acid‐deprived cells to regulate the autophagy‐lysosomal pathway and coordinate cell cycle and cell growth. Nat Cell Biol. 2020;22:1076‐1090. [DOI] [PubMed] [Google Scholar]
- 17.Travis WD, Brambilla E, Nicholson AG, et al. The 2015 World Health Organization classification of lung tumors: impact of genetic, clinical and radiologic advances since the 2004 classification. J Thorac Oncol. 2015;10:1243‐1260. [DOI] [PubMed] [Google Scholar]
- 18.Wu G, Liu H, He H, et al. miR‐372 down‐regulates the oncogene ATAD2 to influence hepatocellular carcinoma proliferation and metastasis. BMC Cancer. 2014;14:107. [DOI] [PMC free article] [PubMed] [Google Scholar]
- 19.Lee SR, Yang KS, Kwon J, Lee C, Jeong W, Rhee SG. Reversible inactivation of the tumor suppressor PTEN by H2O2. J Biol Chem. 2002;277:20336‐20342. [DOI] [PubMed] [Google Scholar]
- 20.Machuqueiro M, Victor B, Switala J, et al. The catalase activity of catalase‐peroxidases is modulated by changes in the pK(a) of the distal histidine. Biochemistry. 2017;56:2271‐2281. [DOI] [PubMed] [Google Scholar]
- 21.Jia J, Abudu YP, Claude‐Taupin A, et al. Galectins control MTOR and AMPK in response to lysosomal damage to induce autophagy. Autophagy. 2019;15:169‐171. [DOI] [PMC free article] [PubMed] [Google Scholar]
- 22.Wu YF, Li ZY, Dong LL, et al. Inactivation of MTOR promotes autophagy‐mediated epithelial injury in particulate matter‐induced airway inflammation. Autophagy. 2020;16:435‐450. [DOI] [PMC free article] [PubMed] [Google Scholar]
- 23.Zhai Y, Lin P, Feng Z, et al. TNFAIP3‐DEPTOR complex regulates inflammasome secretion through autophagy in ankylosing spondylitis monocytes. Autophagy. 2018;14:1629‐1643. [DOI] [PMC free article] [PubMed] [Google Scholar]
- 24.Sies H. Hydrogen peroxide as a central redox signaling molecule in physiological oxidative stress: oxidative eustress. Redox Biol. 2017;11:613‐619. [DOI] [PMC free article] [PubMed] [Google Scholar]
- 25.Moloney JN, Cotter TG. ROS signalling in the biology of cancer. Semin Cell Dev Biol. 2018;80:50‐64. [DOI] [PubMed] [Google Scholar]
- 26.Lee SY, Jeong EK, Ju MK, et al. Induction of metastasis, cancer stem cell phenotype, and oncogenic metabolism in cancer cells by ionizing radiation. Mol Cancer. 2017;16:10. [DOI] [PMC free article] [PubMed] [Google Scholar]
- 27.Liu Q, Gheorghiu L, Drumm M, et al. PARP‐1 inhibition with or without ionizing radiation confers reactive oxygen species‐mediated cytotoxicity preferentially to cancer cells with mutant TP53. Oncogene. 2018;37:2793‐2805. [DOI] [PMC free article] [PubMed] [Google Scholar]
- 28.Liao Z, Chua D, Tan NS. Reactive oxygen species: a volatile driver of field cancerization and metastasis. Mol Cancer. 2019;18:65. [DOI] [PMC free article] [PubMed] [Google Scholar]
- 29.Block K, Gorin Y. Aiding and abetting roles of NOX oxidases in cellular transformation. Nat Rev Cancer. 2012;12:627‐637. [DOI] [PMC free article] [PubMed] [Google Scholar]
- 30.Sakamoto T, Imai H. Hydrogen peroxide produced by superoxide dismutase SOD‐2 activates sperm in Caenorhabditis elegans . J Biol Chem. 2017;292:14804‐14813. [DOI] [PMC free article] [PubMed] [Google Scholar]
- 31.Augsburger F, Filippova A, Jaquet V. Methods for detection of NOX‐derived superoxide radical anion and hydrogen peroxide in cells. Methods Mol Biol. 2019;1982:233‐241. [DOI] [PubMed] [Google Scholar]
- 32.Su W, Cao R, Zhang XY, Guan Y. Aquaporins in the kidney: physiology and pathophysiology. Am J Physiol Renal Physiol. 2020;318:F193‐F203. [DOI] [PubMed] [Google Scholar]
- 33.Martinotti S, Laforenza U, Patrone M, Moccia F, Ranzato E. Honey‐mediated wound healing: H2O2 entry through AQP3 determines extracellular Ca(2+) influx. Int J Mol Sci. 2019;20:764. [DOI] [PMC free article] [PubMed] [Google Scholar]
- 34.Chikuma MH, Satooka H, Watanabe S, et al. Aquaporin‐3‐mediated hydrogen peroxide transport is required for NF‐κB signalling in keratinocytes and development of psoriasis. Nat Commun. 2015;6:7454. [DOI] [PMC free article] [PubMed] [Google Scholar]
- 35.Valavanidis A, Vlachogianni T, Fiotakis K, Loridas S. Pulmonary oxidative stress, inflammation and cancer: respirable particulate matter, fibrous dusts and ozone as major causes of lung carcinogenesis through reactive oxygen species mechanisms. Int J Environ Res Public Health. 2013;10:3886‐3907. [DOI] [PMC free article] [PubMed] [Google Scholar]
- 36.Kim JH, Choi TG, Park S, et al. Mitochondrial ROS‐derived PTEN oxidation activates PI3K pathway for mTOR‐induced myogenic autophagy. Cell Death Differ. 2018;25:1921‐1937. [DOI] [PMC free article] [PubMed] [Google Scholar]
- 37.Zhu X, Li Z, Li T, et al. Osthole inhibits the PI3K/AKT signaling pathway via activation of PTEN and induces cell cycle arrest and apoptosis in esophageal squamous cell carcinoma. Biomed Pharmacother. 2018;102:502‐509. [DOI] [PubMed] [Google Scholar]
- 38.Wani A, Gupta M, Ahmad M, et al. Alborixin clears amyloid‐β by inducing autophagy through PTEN‐mediated inhibition of the AKT pathway. Autophagy. 2019;15:1810‐1828. [DOI] [PMC free article] [PubMed] [Google Scholar]
- 39.Wang H, Zhang G. Endoplasmic reticulum stress‐mediated autophagy protects against β, β‐dimethylacrylshikonin‐induced apoptosis in lung adenocarcinoma cells. Cancer Sci. 2018;109:1889‐1901. [DOI] [PMC free article] [PubMed] [Google Scholar]
- 40.Ichikawa A, Fujita Y, Hosaka Y, et al. Chaperone‐mediated autophagy receptor modulates tumor growth and chemoresistance in non‐small cell lung cancer. Cancer Sci. 2020;111:4154‐4165. [DOI] [PMC free article] [PubMed] [Google Scholar]
- 41.Li L, Tan J, Miao Y, Lei P, Zhang Q. ROS and autophagy: interactions and molecular regulatory mechanisms. Cell Mol Neurobiol. 2015;35:615‐621. [DOI] [PMC free article] [PubMed] [Google Scholar]
- 42.Kaminskyy VO, Zhivotovsky B. Free radicals in cross talk between autophagy and apoptosis. Antioxid Redox Signal. 2014;21:86‐102. [DOI] [PubMed] [Google Scholar]
Associated Data
This section collects any data citations, data availability statements, or supplementary materials included in this article.
Supplementary Materials
Figure S1
Figure S2
Figure S3
Figure S4
Tables S1‐S2