Abstract
Alterations of glycosyltransferase expression are often associated with tumor occurrence and progression. Among the many glycosyltransferases, increased expression of fucosyltransferase 8 (FUT8) has been frequently observed to be involved in progression and metastasis of various types of cancer. The regulatory mechanisms of FUT8 expression remain unclear. FUT8 expression was shown, in this study, to be elevated in breast cancer. Systematic analysis revealed that transcription factor activator protein 2γ (AP‐2γ) is the target gene of microRNA‐10b (miR‐10b), which we previously identified as a positive regulator of FUT8. Overexpression of AP‐2γ inhibited FUT8 expression, with associated reduction of cell invasiveness and migration ability. AP‐2γ was capable of binding to transcription factor STAT3, and phosphorylation of STAT3 induced transcription of the FUT8 gene. On the basis of our findings, we propose that binding of AP‐2γ to STAT3 results in formation of the AP‐2γ/STAT3 complex and consequent inhibition of STAT3 phosphorylation, thereby preventing entry of p‐STAT3 into the nucleus to initiate FUT8 transcription. This study clarifies the molecular mechanisms whereby transcription factor AP‐2γ regulates FUT8 expression in breast cancer.
Keywords: AP‐2γ, breast cancer, fucosyltransferase 8, miR‐10b, STAT3
FUT8 promotes breast cancer cell proliferation, migration, and sensitivity of chemotherapy, and overexpression of AP‐2γ inhibits the expression of FUT8. The reason is that phosphorylation of STAT3 induces transcription of the FUT8 gene. We found that binding of AP‐2γ to STAT3 results in formation of the AP‐2γ/STAT3 complex and consequent inhibition of STAT3 phosphorylation, thereby preventing entry of p‐STAT3 into the nucleus to initiate FUT8 transcription.

Abbreviations
- AAL
Aleuria aurantia lectin
- AFP‐L3
core‐fucosylated α‐fetoprotein
- AP‐2γ
transcription factor activator protein 2γ
- BC
breast cancer
- BFGF
basic fibroblast growth factor
- ChIP
chromatin immunoprecipitation assay
- co‐IP
co‐immunoprecipitation
- DMEM
Dulbecco's modified Eagle's medium
- DOX
doxorubicin
- EMT
epithelial‐mesenchymal transition
- ERα
estrogen receptor‐alpha
- FBS
fetal bovine serum
- FUT8
fucosyltransferase 8
- FUTs
fucosyltransferases
- GEO
Gene Expression Omnibus
- GlcNAc
N‐acetylglucosamine
- LcH
Lens culinaris agglutinin
- miRs
microRNAs
- RT
room temperature
- TCGA
The Cancer Genome Atlas
- TMA
tissue microarray
1. INTRODUCTION
Glycosylation (attachment of glycans to proteins or other organic molecules), mediated by enzymatic activities of glycosyltransferases and glycosidases, is a common posttranslational modification in all organisms.1 Aberrant glycosylation is a characteristic phenomenon in carcinogenesis and plays essential roles in specific steps during tumor development.2 Alterations of glycosyltransferase expression are associated with both prometastatic and metastasis‐suppressing functions. Fucosyltransferase 8 (FUT8) is an α1,6‐fucosyltransferase responsible for the addition of fucose to asparagine‐linked N‐acetylglucosamine (GlcNAc) moieties, a common feature of core‐fucosylated N‐glycans.3 Increased expression and enzymatic activity of FUT8 have been observed in melanoma, prostate cancer, non–small cell lung cancer, and other types of cancer and are involved in tumor progression and metastasis.4, 5, 6 High expression of FUT8 protein is correlated with lymphatic metastasis and stage status, whereas reduced FUT8 expression is correlated with disease‐free survival and overall survival in breast cancer (BC) patients.7
MicroRNAs (miRNAs; miRs) are endogenous noncoding RNAs that regulate gene expression by degrading target mRNAs and/or suppressing protein synthesis through binding to complementary sites in 3′‐untranslated regions of target genes.8 There is increasing evidence that dysregulation of miRs contributes to aberrant gene expression during tumor initiation and progression.9 For example, miR‐10b, an oncogenic miR, is highly expressed in metastatic BC cells and positively regulates cell migration and invasion.10 We previously identified miR‐10b as a positive regulator of FUT8 and demonstrated its ability to enhance BC cell motility and proliferation.11 However, the mechanism whereby miR‐10b regulates FUT8 activity remains unclear.
We demonstrate here that the gene encoding transcription factor activator protein 2γ (AP‐2γ) is the target of miR‐10b. Suppressive effects of AP‐2γ on BC cell proliferation and apoptosis through inhibition of FUT8 were evaluated in vitro and in vivo. The mechanism underlying regulation of FUT8 expression by AP‐2γ was elucidated.
2. MATERIALS AND METHODS
2.1. Cell lines and culture
Immortalized human mammary epithelial cell line MCF10A and human BC cell lines MDA‐MB‐231, MCF7, MDA‐MB‐468, and MDA‐MB‐453 were from the American Type Culture Collection (Manassas). MCF10A cells were cultured in Dulbecco's modified Eagle's medium (DMEM)/F12 complete medium (Gibco; Thermo Fisher Scientific) containing epidermal growth factor (EGF; 20 ng/mL), hydrocortisone (0.5 mg/mL), cholera toxin (100 ng/mL; Sigma‐Aldrich), insulin (10 μg/mL), penicillin (100 units/mL), and streptomycin (100 μg/mL; Gibco), at 37℃ in 5% CO2 atmosphere. Human BC cell lines were cultured in DMEM (HyClone, GE Healthcare) at 37℃ in 5% CO2. All cell cultures were supplemented with 10% fetal bovine serum (FBS) (Biological Industries), 100 IU/mL penicillin, and 100 μg/mL streptomycin.
2.2. Total protein extraction
Total proteins were extracted with T‐PER Reagent (Thermo Fisher) as described previously.12 In brief, cells (∼1 × 10⁷) or tissue samples were detached with trypsin, washed twice with ice‐cold 1× PBS (0.01 M phosphate buffer containing 0.15 M NaCl, pH 7.4), lysed with 1 mL T‐PER Reagent containing protease inhibitor cocktail and phosphatase inhibitor cocktail (Sigma‐Aldrich), incubated 30 minutes on ice, homogenized, and centrifuged at 16 000 g for 15 minutes. Supernatant was collected and stored at −80°C. Protein concentration was determined by bicinchoninic acid assay (Beyotime).
2.3. Western blotting
Total proteins (30 μg) from samples were separated by 7.5% SDS‐PAGE. Gels were transferred onto PVDF membranes using Trans‐Blot Turbo Transfer System (Bio‐Rad Laboratories). Membranes were soaked in 5% skim milk in TBST (20 mM Tris‐HCl, 150 mM NaCl, 0.05% Tween 20, pH 8.0) for 2 hours at 37°C, probed with primary antibodies directed to FUT8 (1:500; cat # sc271244), AP‐2γ (1:500; cat # sc12762; Santa Cruz Biotechnology), N‐cadherin (1:5000; cat # ab18203), GAPDH (1:5000; cat # ab8245), fibronectin (1:1000; cat # ab2413; Abcam), E‐cadherin (1:10 000; cat # 610181; BD Biosciences), AKT (pan) (1:1000; cat # 4685), p‐AKT (Ser473) (1:2000; cat # 4060), STAT3 (1:1000; cat # 9139), and p‐STAT3 (Tyr705) (1:1000; cat # 9145; Cell Signaling Technology) overnight at 4°C, and incubated with appropriate HRP‐conjugated secondary antibody. Specific bands were visualized using Pro‐light HRP Kit (Tiangen). For lectin blotting, biotinylated lectins Lens culinaris agglutinin (LcH) and Aleuria aurantia lectin (AAL) were incubated after blocking by 3% (w/v) bovine serum albumin (BSA) in PBST (PBS with 0.5% [v/v] Tween 20), and bands were detected using VECTASTAIN ABC kits. Bands were visualized using enhanced chemiluminescence detection kit (Vazyme) and imaged with ChemiDoc XRS+ (Bio‐Rad).
2.4. Wound healing assay
This assay was performed as described previously.13 In brief, confluent monolayers of MDA‐MB‐231 cells in six‐well plate were treated with 12 μM mitomycin C for 2 hours and scratched with a pipette tip. Cells were rinsed with PBS and cultured in fresh DMEM medium. Cell migration into the wound was photographed, wound tracks were marked, and relative migration distance was calculated using Image‐Pro Plus software program (Media Cybernetics).
2.5. Cell proliferation assay
This assay was performed as described previously.14 Cells were plated in 96‐well plates and incubated 4 hours with CellTiter 96 AQueous One Solution Cell Proliferation Assay (MTS) solution (Promega). MTS products in supernatant were transferred into 96‐well microtiter plates, and absorbance at 490 nm was measured.
2.6. Immunofluorescence staining
Cells were cultured in 24‐well plates with sterilized coverslips to obtain monolayers (70%‐80% confluence). Cells were washed with ice‐cold PBS, immobilized with 2% fresh paraformaldehyde 15 minutes at room temperature (RT), permeabilized with 0.2% Triton X‐100 in PBS 10 minutes at RT, and blocked with 5% BSA in PBS 1 hour at 37°C. For lectin staining, fixed cells were incubated with 2‐20 μg/mL biotinylated LcH or AAL (Vector Laboratories) in 5% BSA overnight at 4°C, incubated with Avidin‐Alexa Fluor 647 or 488 in PBS 30 minutes, and stained with 20 μg/mL DAPI in PBS 15 minutes at RT. For antibody staining, cells were incubated with primary antibody at 4°C overnight, washed with PBS, incubated with FITC‐labeled secondary antibody 1 hour at RT in the dark, further stained with DAPI 10 minutes, and examined by fluorescence microscopy (model Eclipse E600; Nikon).
2.7. Invasion assay
Transwell assay chambers (diameter 24 mm, pore size 8 μm; Corning) were coated with 50 μL Matrigel (BD Biosciences) in 24‐well plates 4‐6 hours. Transfected cells (1 × 10⁴) were placed in the upper chamber, the lower chamber was added with 500 μL culture medium containing 10% FBS, and the chambers were fixed after 36 hours incubation. Cells were stained with crystal violet, images were taken, and cells in 10 representative images were counted and analyzed.
2.8. Immunohistochemical analysis
Tissues were dewaxed, and antigen retrieval was performed using citrate buffer (0.1 M citric acid, 0.1 M sodium citrate, pH 6.0). Slides were blocked by 0.1% BSA and 0.5% Tween 20 in 10% goat serum, incubated overnight with anti‐AP‐2γ (1:50) or anti‐FUT8 (1:100) antibodies, and incubated 1 hour with HRP‐conjugated secondary antibodies or ABC Kit. Endogenous peroxidase was removed by 30 minutes treatment with 0.1% hydrogen peroxidase. 3,3'‐diaminobenzidine substrate was used for antibody detection.
2.9. Tissue microarray analysis
BC tissue microarrays (TMAs) consisting of 26 cases of BC tissue with matched adjacent normal breast tissue were from Shanghai Outdo Biotech Co. Nonspecific protein on slides was blocked by overnight incubation with 5% BSA in PBS at 4°C. Specific antibodies were applied to slides and incubated 3 hours in the dark. Slides were scanned with confocal scanner and photographed under fluorescence microscopy. Staining intensity of TMAs was evaluated and scored using Image Pro Plus.
2.10. Quantitative real‐time PCR
Total RNA was extracted using TRIzol reagent (Thermo Fisher) as per the manufacturer's protocol. Concentration was determined using NanoDrop ND‐1000 (Thermo Fisher), and RNA sample (A260/A280 > 1.8) was reversed transcribed using ReverTra Ace‐α‐® kit (Toyobo) as per the manufacturer's protocol. Specific primers used for multiple genes were: FUT8 forward, 5′‐TCCATGACCCTA ATGGTCTTTT‐3′, reverse, 5′‐TGTCCTGTACTTCATGCGCT‐3′; AP‐2γ forward, 5′‐CGGGAGAAGTTGGACAAGAT‐3′, reverse, 5′‐GCAAAGTCCCTAGCCAAATG‐3′. Quantitative real‐time PCR (qRT‐PCR) was performed using UltraSYBR Mixture (Beijing CoWin Biotech) and run on CFX96 RT‐PCR detection system (Bio‐Rad). Relative expression levels of target genes were quantified by 2−ΔΔ C t method from triplicate experiments.15
2.11. Co‐immunoprecipitation (co‐IP)
Cells were washed three times with ice‐cold PBS and added with ice‐cold weak RIPA (Beyotime). Lysates were incubated on ice 30 minutes and centrifuged at 10 000 g 10 minutes at 4°C. 1 mL supernatant was transferred to a microcentrifuge tube, added with primary antibody, and incubated 1 hour at 4°C. The mixture was added with 20 μL resuspended Protein A/G PLUS‐Agarose (Santa Cruz), rotated at 4°C overnight, and centrifuged at 1000 g 5 minutes at 4°C. Supernatant was aspirated and discarded, and pellet was washed with PBS and resuspended in 40 μL sample buffer. Proteins were released by boiling for 10 minutes and collected by centrifugation.
2.12. Stable transfected cells
FUT8 and AP‐2γ were amplified by PCR and linked to lentiviral overexpression vector pLVX‐AcGFP1‐N1 (Takara).
Primers used in PCR:
AP‐2γ:sense: 5′‐CCGCTCGAGCGGGCCATGTTGTGGAAAATAACCG‐3′
antisense: 3′‐CGGGATCCCGGCAGTCCTGTTCCTTCCCTACTCT‐5′
FUT8:sense: 5′‐CCGCTCGAGCGGGCCACCATGCGGCCATGGACTG‐3′
antisense: 3′‐CGCGGATCCGCGGATCAGAGCCCTCTTCATCTACAG‐5′
Lentiviral shRNA vector was constructed based on pLVX‐shRNA2‐Puro (Takara). Lentiviral vectors were packed in HEK293T by a packaging system, together with pMD2.G and psPAX2 (Addgene).
siAP‐2γ‐1:sense: 5′‐GCACGATCAGACAGTCATT‐3′
antisense: 3′‐AATGACTGTCTGATCGTGC‐5′
siAP‐2γ‐2:sense: 5′‐CCTGATTGTCATAGACAAA‐3′
antisense: 3′‐TTTGTCTATGACAATCAGG‐5′
siFUT8‐1:sense: 5′‐GUGUCUCAGUUUGUCAAAUTT‐3′
antisense: 3′‐AUUUGACAAACUGAGACACTT‐5′
siFUT8‐2:sense: 5′‐GGUGUGUAAUAUCAACAAATT‐3′
antisense: 3′‐UUUGUUGAUAUUACACACCTT‐5′
Transfected cells were selected and enriched by addition of puromycin to culture medium.
2.13. Animal experiments
All mouse experiments were approved by the Animal Care and Use Committee of Northwest University. Effects of FUT8 on BC tumor proliferation, chemoresistance, and metastasis were studied using mouse subcutaneous (s.c.) xenograft models and trans‐splenic metastasis models.
For s.c. xenograft, 4‐ to 6‐week‐old BALB/c nude (BALB/c‐nu) mice were randomized blindly and s.c. injected in the right hind flank with 1 × 10⁷ cells. Tumor volume (calculated as π/6 × width2 × length) was measured every 4 days. After 4 weeks, mice were sacrificed and tumor tissues were excised, measured, and weighed.
For chemoresistance experiments, mice were s.c. injected in the right hind flank with 2 × 10⁶ cells. Starting at day 10, doxorubicin (DOX, 5 mg/kg) or normal saline was intraperitoneally (i.p.) injected once per week. Tumor volume was measured every 5 days. At day 35, mice were euthanized, and tumors were excised and weighed.
The role of FUT8 in BC via blood metastasis to liver was investigated by dividing tumors into small pieces, and s.c. injecting a standard volume (2 mm3) of tumor debris in spleens of healthy 4‐ to 6‐week‐old BALB/c‐nu mice as described previously.16 After 4 weeks, mice were euthanized, and tumors were excised and weighed.
Tumors, spleens, and livers dissected in all animal experiments were fixed and paraffin‐embedded for histopathological analysis.
2.14. Cell sphere formation
Cells (1000/well) were cultured and maintained as spheres in serum‐free DMEM/F12 (HyClone) supplemented with 10 ng/mL basic fibroblast growth factor (BFGF), 20 ng/mL EGF, 2% B‐27 Supplement (Gibco), 5 mg/mL insulin, and 10 000 IU/mL penicillin‐streptomycin, in ultralow‐attachment 12‐well plates (Corning). For long‐term maintenance of spheres, cells were collected by centrifugation (200 g, 5 minutes), and supernatant was aspirated. Cells were resuspended, aliquoted in culture medium, and placed on new plates, and cell spheres with diameter ≥100 μm were counted.
2.15. Flow cytometric analysis
Cells (2 × 10⁵) were incubated with phycoerythrin‐conjugated anti‐human CD24 (BioLegend) or Allophycocyanin‐conjugated anti‐human CD44 antibodies in binding buffer for 10 minutes, rinsed with PBS, and resuspended in binding buffer. Expression of stem cell markers was measured by flow cytometry (ACEA Biosciences) and analyzed using NovoExpress software program.
2.16. Patient samples
Tissues of normal subjects and BC patients were obtained from the Fifth People's Hospital of Qinghai Province. Written informed consent was obtained from all patients in accordance with the Declaration of Helsinki. Experiments using human tissues were approved by the Research Ethics Committee of Northwest University.
2.17. Statistical analysis
All experiments were replicated at least three times, and data are presented as mean ± SD. Two‐tailed Student's t‐test was used for comparison of datasets between two groups, and differences with P < .05 were considered statistically significant. Statistical analyses were performed using GraphPad Prism V. 7.0 software program. Notations in figures: *, P < .05; **, P < .01; ***, P < .001; ****, P < .0001; ns: not significant.
3. RESULTS
3.1. Altered expression of FUT8 in BC
FUT8 is the only enzyme that generates α1,6‐fucosyltransferase on N‐glycans, which is recognized by LcH. Terminal α‐1,2/3/4/6–fucosylated structures are recognized by AAL (Figure 1A).4, 17 Various types of cancer display aberrant expression of fucosylated structures.18 Accordingly, we initially investigated clinical relevance of fucosyltransferases (FUTs 1‐11) in some common cancer types. Most cancer types showed clear upregulation of FUT8 expression at mRNA level (Figure 1B). A heatmap generated from the Gene Expression Omnibus (GEO) dataset revealed that FUT8 expression in BC was considerably higher than that of other FUTs (Figure 1C). Immunofluorescence staining of TMAs (see M&M/Section 2.9: "TMA analysis") (Table S1) showed significantly higher FUT8 expression in cancer tissues than in adjacent tissues (Figure 1D). Similarly, examination of clinical samples (11 pairs of human breast ductal carcinoma tissues and matched adjacent normal breast tissues) revealed higher FUT8 expression in BC tissues (Figure 1E). In comparison with normal breast tissues, FUT8 showed higher expression in various tumor stages (Figure S1A), in differing nodal metastasis status (Figure S1B), at differing ages (Figure S1C), in differing menopause status (Figure S1D), and in differing tumor histology types (Figure S1E).
FIGURE 1.
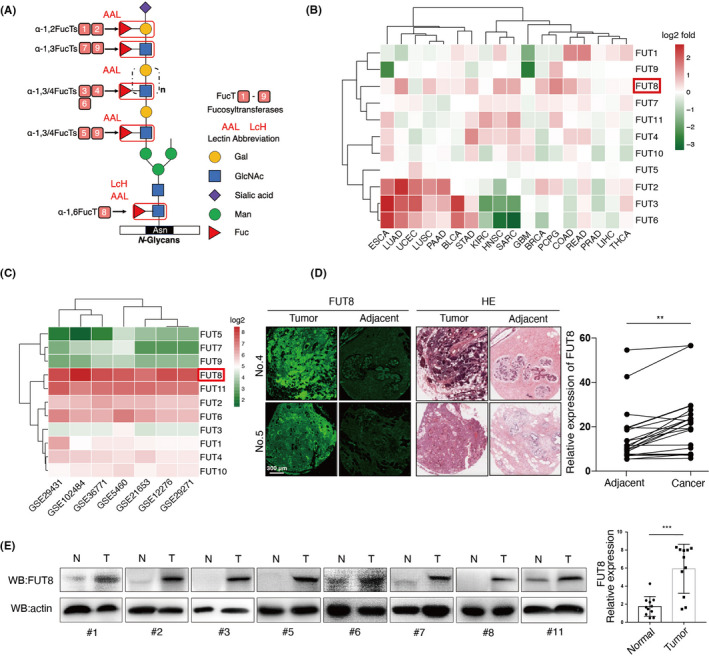
Expression of fucosyltransferase 8 (FUT8) in breast cancer (BC) clinical samples. A, Core α1,6–fucosylated N‐glycans catalyzed by FUT8 and terminal α‐1,2,3,4–fucosylated N‐glycans catalyzed by FUT1‐7,9 recognized, respectively, by Lens culinaris agglutinin (LcH) and Aleuria aurantia lectin (AAL) lectins. B, Fold changes of FUT1‐11 expression in 18 types of tumor tissues (T) versus corresponding normal tissues (N), based on mRNA microarray data extracted from The Cancer Genome Atlas (TCGA). Red: log2(T_median/N_median) > 0. Green: log2(T_median/N_median) < 0. C, Average expression of 11 different fucosyltransferases in 1659 total BC samples from six BC Gene Expression Omnibus (GEO) datasets (GSE29431, GSE102484, GSE36771, GSE5460, GSE21653, GSE12276, GSE29271). D, Representative FUT8 expression and hematoxylin and eosin (H&E) staining in BC nest‐like structures and adjacent noncancerous cells. E, FUT8 expression in 11 pairs of human breast ductal carcinoma tissues (T) and matched adjacent normal breast tissues (N)
3.2. Effect of FUT8 expression on cell proliferation and migration
BC cells, in comparison with normal breast epithelial cells, showed significantly higher FUT8 expression at protein and mRNA levels (Figure 2A,B) and enhanced core fucosylation (Figure S2A,B).
FIGURE 2.
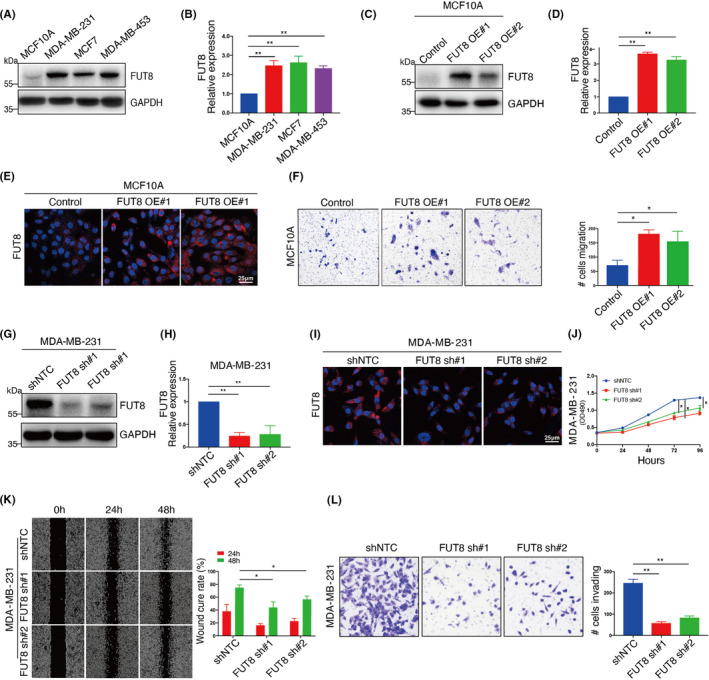
Effect of fucosyltransferase 8 (FUT8) expression on cell migration and proliferation. FUT8 expression in normal breast epithelial (MCF10A) and breast cancer (BC) cells (MCF7, MDA‐MB‐231, MDA‐MB453) assessed by Western blotting (A) and quantitative real‐time PCR (qRT‐PCR) (B). Two FUT8‐stable transfectants of MCF10A (FUT8 OE#1, FUT8 OE#2) and their vector blank (control) were established and assessed by Western blotting (C), qRT‐PCR (D), and immunofluorescence staining (E). F, Migration ability of FUT8‐overexpressing MCF10A and vector control assessed by transwell migration without Matrigel. Two FUT8‐knockdown MDA‐MB‐231 transfectants (FUT8 sh#1, FUT8 sh#2) and their vector blank (shNTC) were established and assessed by Western blotting (G), qRT‐PCR (H), and immunofluorescence staining (I). Cell proliferation (J), scratch‐wound assay (K), and transwell invasion assay (L) of FUT8‐knockdown MDA‐MB‐231
FUT8 was overexpressed in normal breast epithelial MCF10A cells (Figure 2C‐E) for evaluation of FUT8 function. FUT8 overexpression significantly increased core fucosylation (Figure S2C) and migration ability (Figure 2F) but had no effect on cell proliferation (Figure S2D). FUT8‐overexpressing cells showed reduced levels of E‐cadherin and increased levels of epithelial‐mesenchymal transition (EMT) markers p‐AKT, fibronectin, and N‐cadherin (Figure S2F).
Silencing (knockdown) of FUT8 expression in BC MDA‐MB‐231 cells (Figure 2G‐I) reduced core fucosylation (Figure S2E) and significantly reduced cell proliferation and migration ability (Figure 2J‐L). These findings indicate that FUT8 interferes with BC cell proliferation and invasiveness.
3.3. FUT8 enhances chemotherapy susceptibility of BC cells
Chemotherapy is commonly used in BC treatment. We examined chemotherapy susceptibility of FUT8‐modified cells. The expression of FUT8 in BC MDA‐MB‐231 cells was silenced (Figure S3A). DOX treatment reduced the viability of MDA‐MB‐231 in time‐dependent and dose‐dependent manners. Susceptibility to DOX was greater for FUT8‐knockdown MDA‐MB‐231 than for control cells (Figure 3A). In our xenograft model (Figure 3B), DOX treatment significantly reduced tumor volumes and weights of MDA‐MB‐231, and the FUT8‐knockdown group had much greater chemotherapy susceptibility than other groups (Figure 3C,D). Immunohistochemical analysis revealed that FUT8 knockdown and/or DOX treatment reduced proliferation and increased apoptosis (Figure 3E).
FIGURE 3.
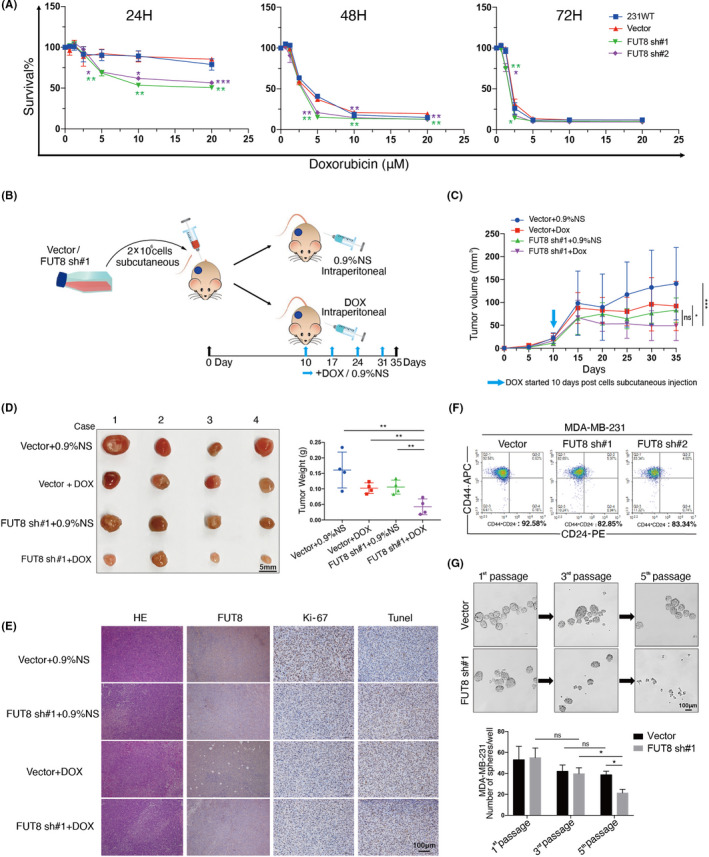
Fucosyltransferase 8 (FUT8) enhances doxorubicin (DOX) susceptibility (in vitro and in vivo) and stemness of MDA‐MB‐231. A, Survival ratio of two FUT8‐knockdown MDA‐MB‐231 lines, vector blank (vector), and wild‐type cells (231WT) following 24, 48, or 72 h treatment with 0, 5, 10, 15, or 20 μM DOX. B, In vivo xenograft experiment (schematic). C, Tumor growth curve for BALB/c‐nu mice injected with vector or FUT8 sh#1 cells, and treated with 0.9% normal saline (vector + 0.9%NS, FUT8 sh#1 + 0.9%NS) or with DOX (vector + DOX, FUT8 sh#1 + DOX). n = 4 for each group. D, Isolated tumors of xenograft models and tumor weights for various groups. E, Representative H&E and immunohistochemical (IHC) staining images of s.c. tumors of FUT8, Ki‐67, and TUNEL in various groups. F, Percentage of CD44+/CD24− cells, assayed by flow cytometry. G, Upper: representative image of spheres formed by vector or FUT8 sh#1 cells. Lower: number of spheres per well
Tumorigenic BC cells that express high CD44 and low CD24 levels are resistant to chemotherapy and therefore often responsible for cancer relapse.19 CD44+/CD24− population was reduced in our FUT8‐knockdown MDA‐MB‐231 (Figure 3F), indicating that FUT8 is required and sufficient for maintenance of stemness phenotype. Cell sphere formation assay, following multiple passages, showed fewer spheres in FUT8‐knockdown cells than in control cells (Figure 3G), indicating the involvement of FUT8 expression in cell self‐renewal ability.
3.4. MiR‐10b modulates FUT8 expression via AP‐2γ
We demonstrated previously that miR‐10b promotes BC cell motility and proliferation by increasing FUT8 level11; however, there is no evidence that miR‐10b directly modulates FUT8 expression. We searched for biological target genes of miR‐10b using three major web servers and screened out two genes: those encoding NR6A1 and AP‐2γ (Figure 4A). FUT8 levels were negatively correlated with NR6A1 and AP‐2γ expression in 1097 invasive BC samples in The Cancer Genome Atlas (TCGA) database, and the negative correlation was stronger for AP‐2γ (Figure 4B). We confirmed the reduction of FUT8 expression and the enhancement of AP‐2γ level in breast epithelial cells (Figure S4A).
FIGURE 4.
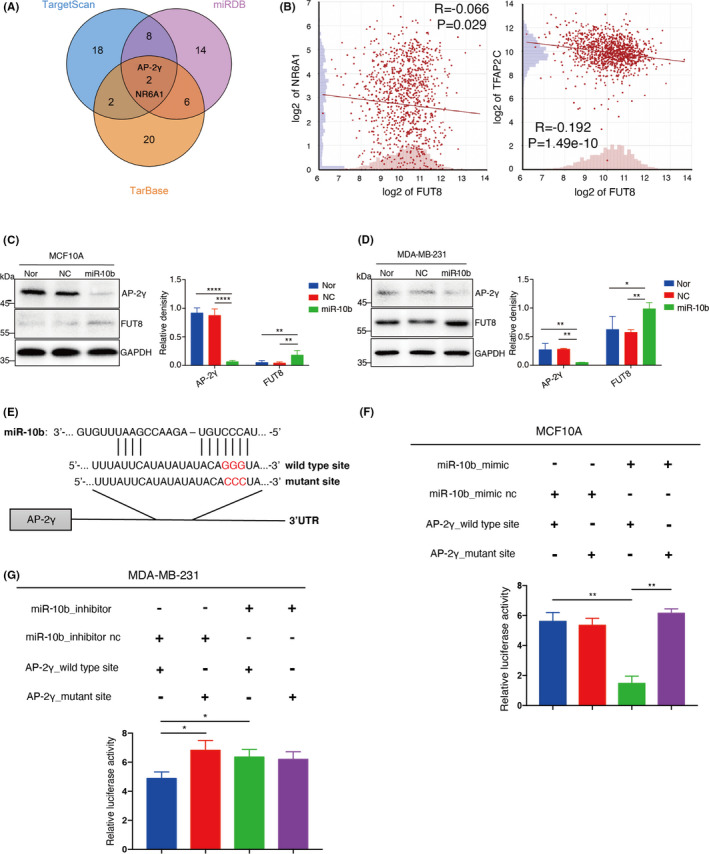
MiR‐10b modulates fucosyltransferase 8 (FUT8) expression via AP‐2γ. A, Venn diagram of miR‐10b target genes predicted by three web servers (TargetScan, miRDB, TarBase). B, Correlation of expression between FUT8 and NR6A1, or AP‐2γ. Data presented as log2 fold change. MCF10A (C) and MDA‐MB‐231 (D) were treated with miR‐10b mimic, and expression of FUT8 and AP‐2γ was assessed by Western blotting. Right panel shows quantitation of representative images. E, Putative miR‐10b binding sites on wild‐type sequence and mutant sequence of AP‐2γ 3'‐UTR. F, MCF10A cells were cotransfected with miR‐10b mimic or mimic‐nc and two reporter plasmids psiCHECK2 (wild‐type or mutant AP‐2γ 3'‐UTR sequence), and luciferase activities of transfectant cells were assayed. G, Same as panel F but with MDA‐MB‐231
miR‐10b mimics were transiently transfected into MCF10A and MDA‐MB‐231 for confirmation of AP‐2γ as a target gene of miR‐10b. The miR‐10b mimic–treated cells showed significant reduction of AP‐2γ expression and increase of FUT8 expression and core fucosylation (Figure 4C,D; Figure S4B,C). Potential binding capacity of miR‐10b to AP‐2γ was evaluated by inserting wild‐type or mutant 3'‐UTR sequence of AP‐2γ upstream of luciferase reporter gene (Figure 4E). Luciferase activity in either miR‐10b mimic or scrambled miR MCF10A or MDA‐MB‐231 was significantly reduced by miR‐10b coexpressed with wild‐type AP‐2γ sequence but unaffected by miR‐10b coexpressed with mutant 3'‐UTR AP‐2γ sequence (Figure 4F,G).
3.5. Correlation of AP‐2γ expression with FUT8 level
TCGA data showed that BC samples, in comparison with normal breast tissue samples, had higher FUT8 mRNA levels and lower AP‐2γ expression (Figure 5A). A total of 112 tumor sample pairs showed consistent upregulation of FUT8 expression and downregulation of AP‐2γ (Figure 5B). This trend was confirmed by TMA analysis (Figure 5C).
FIGURE 5.
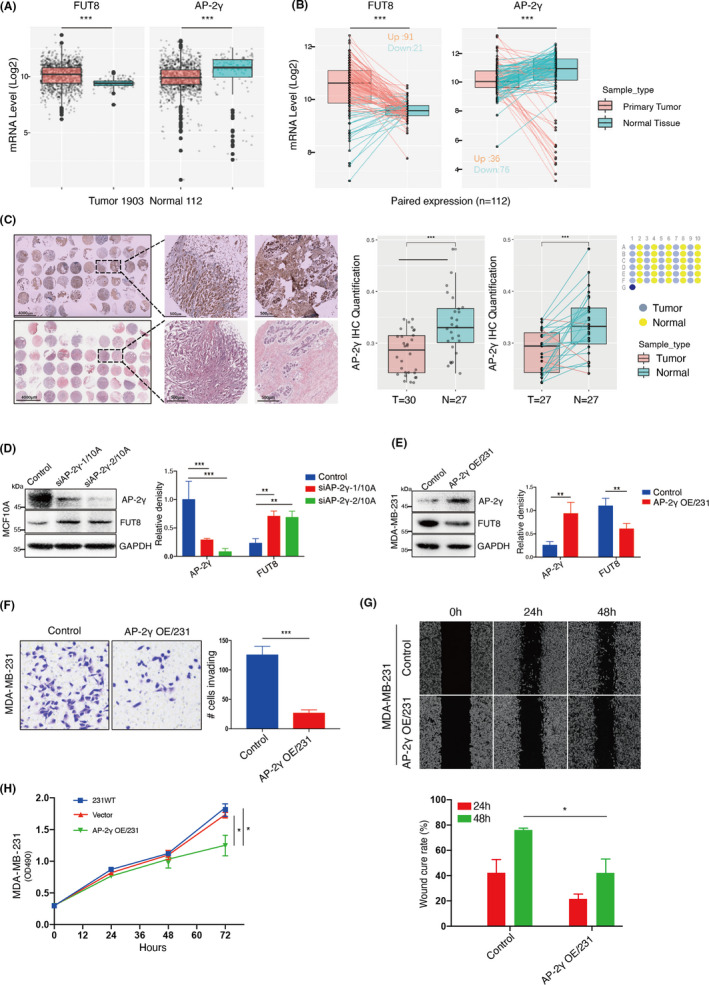
Correlation between AP‐2γ and fucosyltransferase 8 (FUT8) expression in BC. A, mRNA expression of FUT8 and AP‐2γ in normal breast tissues and breast cancer (BC) tissues in The Cancer Genome Atlas (TCGA) database. B, mRNA expression of FUT8 and AP‐2γ in 112 adjacent normal and paired BC tissues in TCGA database. C, Differential AP‐2γ expression of BC tissues in tissue microarray (TMA). D, MCF‐10A lines stably transfected with lentivirus carrying one of two independent short hairpin RNAs (shRNAs) targeting AP‐2γ (siAP‐2γ‐1/10A, siAP‐2γ‐2/10A), or nontargeting control (Control). AP‐2γ and FUT8 levels were assessed by Western blotting. Right panel shows quantitation. E, AP‐2γ and FUT8 levels in AP‐2γ–stable transfectant of MDA‐MB‐231 (AP‐2γ OE/231) and vector blank (control). Right panel shows quantitation. Transwell invasion assay (F), scratch‐wound assay (G), and proliferation (H) of AP‐2γ–overexpressing MDA‐MB‐231
AP‐2γ‐knockdown MCF‐10A showed increased FUT8 expression and core fucosylation (Figure 5D; Figure S5A). In contrast, AP‐2γ–overexpressing MDA‐MB‐231 showed reduced FUT8 expression and core fucosylation (Figure 5E; Figure S5B). AP‐2γ overexpression significantly decreased cell invasiveness, migration ability, and proliferation (Figure 5F‐H).
3.6. Regulatory effect of AP‐2γ on FUT8 mediated by STAT3
AP‐2γ expression was negatively correlated with FUT8 level, but the ability of AP‐2γ to regulate FUT8 was unclear. We ruled out the possibility that AP‐2γ directly modulates FUT8 expression. However, analysis using Pathway Commons webservice suggested that AP‐2γ may regulate FUT8 indirectly via STAT3/p‐STAT3. Opposite expression trends of AP‐2γ versus FUT8 and p‐STAT3 were observed in BC cell lines (Figure 6A). AP‐2γ–overexpressing MDA‐MB‐231 showed reduced FUT8 expression and significantly reduced p‐STAT3 expression (Figure 6B). Knockdown of AP‐2γ expression resulted in significant enhancement of FUT8 and p‐STAT3 expression (Figure 6C). FUT8 and p‐STAT3 levels were significantly reduced by addition of the STAT3/JAK inhibitor cucurbitacin I (JSI‐124) (Figure 6D).
FIGURE 6.
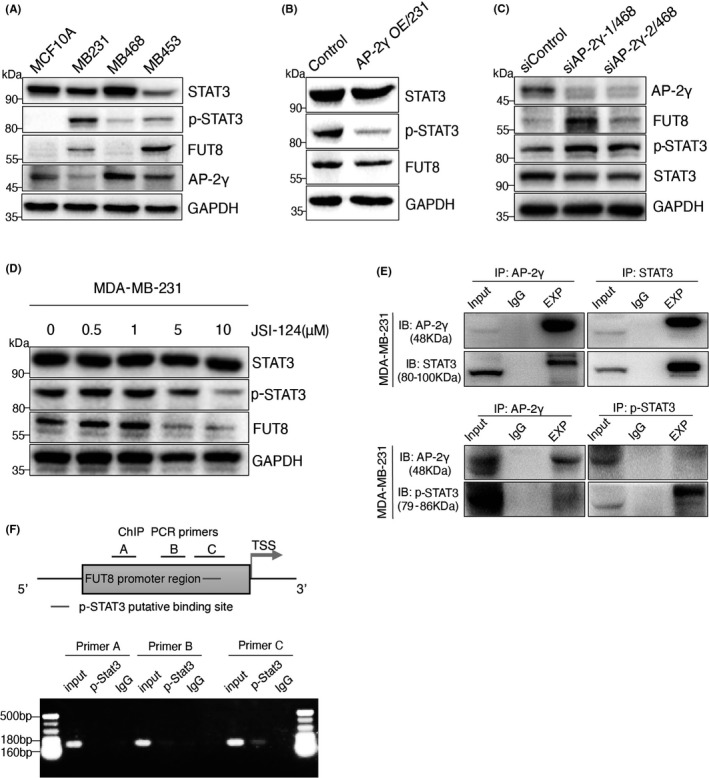
Fucosyltransferase 8 (FUT8) is regulated by AP‐2γ via STAT3. A, STAT3, p‐STAT3, AP‐2γ, and FUT8 expression in MCF10A, MDA‐MB‐231, MDA‐MB‐468, and MDA‐MB‐453. B, FUT8, STAT3, and p‐STAT3 expression in AP‐2γ OE/231. C, STAT3, p‐STAT3, AP‐2γ, and FUT8 expression in AP‐2γ–knockdown MDA‐MB‐468 (siAP‐2γ‐1/468, siAP‐2γ‐2/468). D, STAT3, p‐STAT3, and FUT8 expression in MDA‐MB‐231 treated for 48 h with various concentrations of JSI‐124 (see Results/Section 3.6: "Regulatory effect of AP‐2γ…"). E, MDA‐MB‐231 lysate was subjected to immunoprecipitation with antibodies directed to AP‐2γ, STAT3, and p‐STAT3. F, Upper: FUT8 promoter region (schematic) indicating Jaspar‐predicted binding site of p‐STAT3, promoter regions including ChIP PCR primers (A, B, C), and transcription start site (TSS). Lower: ChIP PCR results, using three sets of different primers
Co‐IP assays showed that AP‐2γ bound strongly to STAT3, but weakly to p‐STAT3 (Figure 6E), and ChIP assays revealed direct binding between p‐STAT3 and FUT8 promoter regions (Figure 6F). We propose, in view of these findings, that AP‐2γ is capable of binding to STAT3, thereby forming a complex that inhibits STAT3 phosphorylation and translocation of p‐STAT3 into the nucleus, with consequent suppression of FUT8 gene transcription.
3.7. AP‐2γ overexpression suppresses in vivo tumor growth
The effect of AP‐2γ on in vivo tumor formation was evaluated by using a xenograft model of tumor growth and metastasis (Figure 7A). Mice injected with AP‐2γ–overexpressing MDA‐MB‐231, in comparison with vector control group, showed much slower tumor growth (Figure 7B) and smaller total tumor mass (Figure 7C). Similar findings were obtained for mice injected with FUT8‐knockdown MDA‐MB‐231. Both AP‐2γ–overexpressing and FUT8‐knockdown cells also showed significant reduction of tumor metastasis to liver (Figure 7D,E), enhanced apoptosis, and reduced proliferation (Figure 7F,G). STAT3 phosphorylation was inhibited by AP‐2γ overexpression (Figure 7G). These in vivo results, consistently with findings from in vitro assays, indicate that AP‐2γ overexpression inhibits FUT8 expression by reducing p‐STAT3 expression, thereby suppressing BC growth and promoting tumor cell apoptosis.
FIGURE 7.
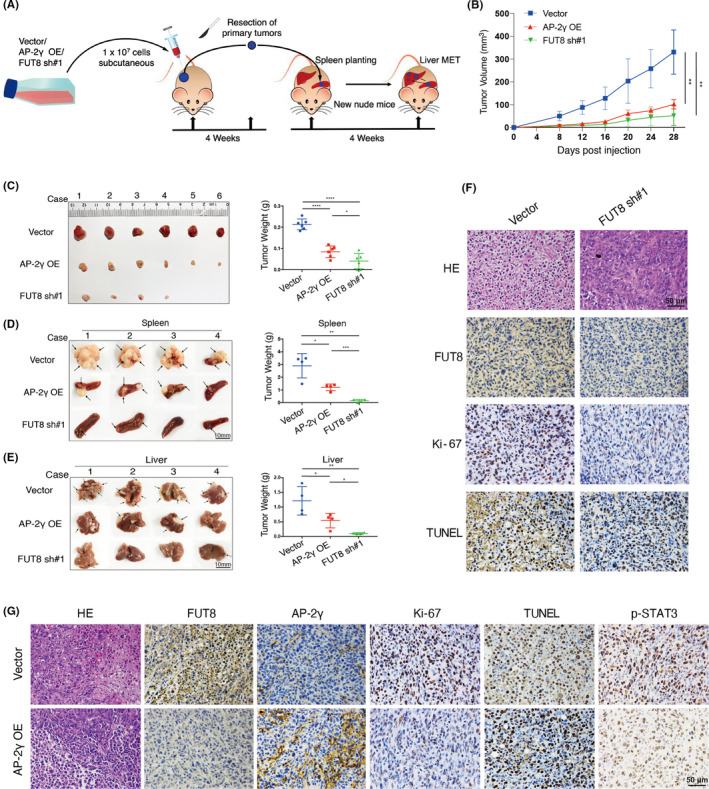
AP‐2γ overexpression or fucosyltransferase 8 (FUT8) knockdown suppresses tumor growth and metastasis in vivo. A, In vivo xenograft experiment (schematic). BALB/c‐nu mice were injected with AP‐2γ–overexpressing (AP‐2γ OE), FUT8‐knockdown (FUT8 sh#1), or vector blank (vector) MDA‐MB‐231. B, Subcutaneous (s.c.) tumor growth curves (n = 6). C, Isolated s.c. tumors of xenograft models and weights of tumors from various groups. D, E, Photographs of splenic tumors and liver metastatic tumors. Right: representative tumor weights for various groups (n = 4 for each group). F, G, Representative H&E and IHC staining images of s.c. tumors
4. DISCUSSION
Biosynthesis of fucosylated structures is a complex process, and the great variety of structures produced requires coordinated activity of numerous glycosyltransferases and glycosidases.20 Core fucosylation of many glycoproteins causes changes in their functions.21 FUT8 specifically catalyzes transfer of a single fucose residue to the innermost GlcNAc residue of N‐linked–type complex glycopeptides via α1,6‐linkage.22 High FUT8 expression occurs in numerous types of cancer, including hepatocellular,23 non–small cell lung,24 colon,25 prostate,26 and ovarian.27 FUT8 levels are related to clinicopathological characteristics of many malignant tumor types and to patient survival rates.28 In BC, the TGF‐β receptor complex is core‐fucosylated by FUT8 to facilitate TGF‐β binding, enhance downstream signal transduction, and thereby promote tumor metastasis.29 Our analysis of clinical transcriptomic datasets revealed higher FUT8 expression in BC than in normal breast tissues, in agreement with previous studies. FUT8 knockdown in highly metastatic BC cells reduced invasiveness and proliferation. FUT8 knockdown in non–small cell lung30 and hepatocellular carcinomas31 also had antiproliferative effect. In our in vivo experiments, FUT8 knockdown inhibited metastasis of BC cells to liver via bloodstream and suppressed growth of seeded primary tumor cells in spleen, suggesting core fucosylation is required for adaptation of disseminated tumor cells to a new environment. FUT8 inhibition caused MDA‐MB‐231 to become more susceptible to DOX, relative to control group.
Although our 2018 study demonstrated that miR‐10b acts as a positive regulator of FUT8 in BC cells,11 there was no evidence that it directly modulates FUT8 expression. AP‐2γ was identified as a potential target gene of miR‐10b in the present study. Luciferase assay confirmed that miR‐10b bound to 3'‐UTR of AP‐2γ gene and inhibited its expression. Previous studies have revealed differing AP‐2γ effects on differing molecular types of BC. Luminal BC subtypes are defined by expression of estrogen receptor‐alpha (ERα)‐associated genes, many of which respond directly to AP‐2γ.32 In regard to triple‐negative BC subtype, AP‐2γ overexpression in MDA‐MB‐231 resulted in reduced CD44 expression at mRNA and protein levels. In primary triple‐negative BC specimens, tumors with high AP‐2γ and low CD44 expression were more responsive to neoadjuvant chemotherapy.33 We observed, similarly, that AP‐2γ overexpression in MDA‐MB‐231 significantly reduced cell invasiveness, migration ability, and proliferation. Mice injected with AP‐2γ–overexpressing MDA‐MB‐231 showed significantly slower tumor growth and reduced metastasis to liver. AP‐2γ bound strongly to STAT3 but weakly to p‐STAT3, its activated form. p‐STAT3 directly regulated FUT8 expression. We propose, in view of these findings, that the AP‐2γ/STAT3 complex inhibits STAT3 phosphorylation, thereby preventing entry of p‐STAT3 into the nucleus to initiate FUT8 transcription (Figure 8).
FIGURE 8.
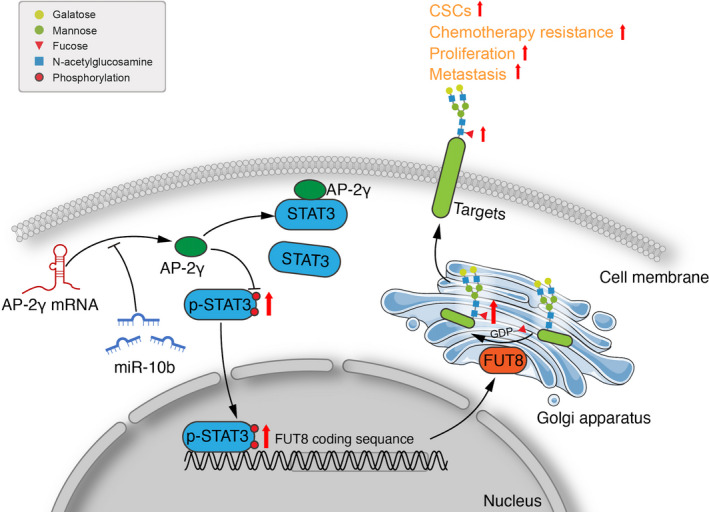
Proposed mechanism of fucosyltransferase 8 (FUT8) modulation by AP‐2γ (schematic)
A key finding of this study is that proliferation, invasiveness, and metastasis of BC cells were reduced by inhibition of FUT8 activity and FUT8‐mediated core fucosylation. There is increasing evidence that malignancy is suppressed by reduction of core fucosylation.34, 35 Core fucosylation occurs on proteins, and many proteins are modified by core fucosylation during cancer progression.36 Core‐fucosylated α‐fetoprotein (AFP‐L3) has been FDA‐approved for early diagnosis of hepatocellular carcinoma.37 Core fucosylation is required for EGF binding to its receptor.38 Liver cancer patients showed increased core fucosylation on alpha‐1‐antitrypsin.39 E‐cadherin was core‐fucosylated in highly metastatic lung cancer cells.40 In view of these and many similar findings, it is very important to identify fucosylated core proteins. Such identification is facilitated by ongoing advances in glycoproteomics technology. Cao et al, by combining segmentation fragmentation and a refined strategy of glycoprotein‐based diagnostic ion spectra, were able to identify core‐fucosylated glycoprotein groups by mass spectrometry.41 The same group subsequently developed a novel method for identification of core‐fucosylated glycoproteomes in human plasma.42 Functional roles and potential therapeutic applications in BC of specific core‐fucosylated proteins will be greatly clarified in the near future based on such advances in glycoproteomics technology and follow‐up glycobiological studies.
CONFLICT OF INTEREST
The authors declare no conflict of interest.
AUTHOR CONTRIBUTIONS
MM, DG, ZT, and JD performed experiments. MM, DG, ZT, and FG analyzed data and interpreted results. MM, FG, and XL designed and supervised the project and provided expertise. MM, XL, and FG wrote the manuscript. All authors read and approved the finalized manuscript.
ETHICAL STATEMENT
All procedures followed were in accordance with the ethical standards of the responsible committee on human experimentation (institutional and national) and with the Declaration of Helsinki 1964 and later versions. Informed consent to be included in the study, or the equivalent, was obtained from all patients.
Supporting information
Fig S1‐S5
Table S1
ACKNOWLEDGMENTS
The authors are grateful to Dr. S. Anderson for English editing of the manuscript. This study was supported by funding from the National Science Foundation of China (Nos. 31971211, 81802654), National Science and Technology Major Project of China (No. 2018ZX10302205), Natural Science Foundation of Shaanxi Province, China (2019JZ‐22), Youth Innovation Team of Shaanxi Universities, and Youth Science Fund of the Fifth People's Hospital of Qinghai province (No. 2017‐Y‐01).
Ma M, Guo D, Tan Z, et al. Fucosyltransferase 8 regulation and breast cancer suppression by transcription factor activator protein 2γ. Cancer Sci. 2021;112:3190–3204. 10.1111/cas.14987
Minxing Ma and Dong Guo equally contributed to this study
Contributor Information
Minxing Ma, Email: minxingma@whu.edu.cn.
Xiang Li, Email: xiangli@nwu.edu.cn.
DATA AVAILABILITY STATEMENT
The data sets used and analyzed during the current study are available from the corresponding author on reasonable request.
REFERENCES
- 1.Taniguchi N, Kizuka Y. Glycans and cancer: role of N‐glycans in cancer biomarker, progression and metastasis, and therapeutics. Adv Cancer Res. 2015;126:11‐51. [DOI] [PubMed] [Google Scholar]
- 2.Christiansen MN, Chik J, Lee L, Anugraham M, Abrahams JL, Packer NH. Cell surface protein glycosylation in cancer. Proteomics. 2014;14:525‐546. [DOI] [PubMed] [Google Scholar]
- 3.Ihara H, Ikeda Y, Toma S, et al. Crystal structure of mammalian alpha1,6‐fucosyltransferase, FUT8. Glycobiology. 2007;17:455‐466. [DOI] [PubMed] [Google Scholar]
- 4.Agrawal P, Fontanals‐Cirera B, Sokolova E, et al. A systems biology approach identifies FUT8 as a driver of melanoma metastasis. Cancer Cell. 2017;31(6):804‐819.e7. [DOI] [PMC free article] [PubMed] [Google Scholar]
- 5.Clark DJ, Schnaubelt M, Hoti N, et al. Impact of increased FUT8 expression on the extracellular vesicle proteome in prostate cancer cells. J Proteome Res. 2020;19:2195‐2205. [DOI] [PMC free article] [PubMed] [Google Scholar]
- 6.Chen CY, Jan YH, Juan YH, et al. Fucosyltransferase 8 as a functional regulator of nonsmall cell lung cancer. Proc Natl Acad Sci USA. 2013;110:630‐635. [DOI] [PMC free article] [PubMed] [Google Scholar]
- 7.Yue L, Han C, Li Z, et al. Fucosyltransferase 8 expression in breast cancer patients: A high throughput tissue microarray analysis. Histol Histopathol. 2016;31:547‐555. [DOI] [PubMed] [Google Scholar]
- 8.Jiang Q, Wang Y, Hao Y, et al. miR2Disease: a manually curated database for microRNA deregulation in human disease. Nucleic Acids Res. 2009;37:D98‐D104. [DOI] [PMC free article] [PubMed] [Google Scholar]
- 9.Bushati N, Cohen SM. microRNA functions. Annu Rev Cell Dev Biol. 2007;23:175‐205. [DOI] [PubMed] [Google Scholar]
- 10.Han X, Yan S, Weijie Z, et al. Critical role of miR‐10b in transforming growth factor‐beta1‐induced epithelial‐mesenchymal transition in breast cancer. Cancer Gene Ther. 2014;21:60‐67. [DOI] [PubMed] [Google Scholar]
- 11.Guo D, Guo J, Li X, Guan F. Enhanced motility and proliferation by miR‐10b/FUT8/p‐AKT axis in breast cancer cells. Oncol Lett. 2018;16:2097‐2104. [DOI] [PMC free article] [PubMed] [Google Scholar]
- 12.Tan Z, Lu W, Li X, et al. Altered N‐Glycan expression profile in epithelial‐to‐mesenchymal transition of NMuMG cells revealed by an integrated strategy using mass spectrometry and glycogene and lectin microarray analysis. J Proteome Res. 2014;13:2783‐2795. [DOI] [PubMed] [Google Scholar]
- 13.Tan Z, Wang C, Li X, Guan F. Bisecting N‐acetylglucosamine structures inhibit hypoxia‐induced epithelial‐mesenchymal transition in breast cancer cells. Front Physiol. 2018;9:210. [DOI] [PMC free article] [PubMed] [Google Scholar]
- 14.Yu M, Zhao Q, Shi L, et al. Cationic iridium(III) complexes for phosphorescence staining in the cytoplasm of living cells. Chem Commun (Camb). 2008;(18):2115‐2117. [DOI] [PubMed] [Google Scholar]
- 15.Livak KJ, Schmittgen TD. Analysis of relative gene expression data using real‐time quantitative PCR and the 2(‐Delta Delta C(T)) Method. Methods. 2001;25:402‐408. [DOI] [PubMed] [Google Scholar]
- 16.Sánchez‐Velázquez P, Castellví Q, Villanueva A, et al. Long‐term effectiveness of irreversible electroporation in a murine model of colorectal liver metastasis. Sci Rep. 2017;7(1):e44821. [DOI] [PMC free article] [PubMed] [Google Scholar]
- 17.Romano PR, Mackay A, Vong M, et al. Development of recombinant Aleuria aurantia lectins with altered binding specificities to fucosylated glycans. Biochem Biophys Res Commun. 2011;414:84‐89. [DOI] [PMC free article] [PubMed] [Google Scholar]
- 18.Takahashi S, Sugiyama T, Shimomura M, et al. Site‐specific and linkage analyses of fucosylated N‐glycans on haptoglobin in sera of patients with various types of cancer: possible implication for the differential diagnosis of cancer. Glycoconj J. 2016;33:471‐482. [DOI] [PubMed] [Google Scholar]
- 19.Smith AG, Macleod KF. Autophagy, cancer stem cells and drug resistance. J Pathol. 2019;247:708‐718. [DOI] [PMC free article] [PubMed] [Google Scholar]
- 20.Moremen KW, Tiemeyer M, Nairn AV. Vertebrate protein glycosylation: diversity, synthesis and function. Nat Rev Mol Cell Biol. 2012;13:448‐462. [DOI] [PMC free article] [PubMed] [Google Scholar]
- 21.Taniguchi N, Korekane H. Branched N‐glycans and their implications for cell adhesion, signaling and clinical applications for cancer biomarkers and in therapeutics. BMB Rep. 2011;44:772‐781. [DOI] [PubMed] [Google Scholar]
- 22.Brockhausen I, Narasimhan S, Schachter H. The biosynthesis of highly branched N‐glycans: studies on the sequential pathway and functional role of N‐acetylglucosaminyltransferases I, II, III, IV, V and VI. Biochimie. 1988;70:1521‐1533. [DOI] [PubMed] [Google Scholar]
- 23.Cheng L, Gao S, Song X, et al. Comprehensive N‐glycan profiles of hepatocellular carcinoma reveal association of fucosylation with tumor progression and regulation of FUT8 by microRNAs. Oncotarget. 2016;7:61199‐61214. [DOI] [PMC free article] [PubMed] [Google Scholar]
- 24.Li F, Zhao S, Cui Y, et al. alpha1,6‐Fucosyltransferase (FUT8) regulates the cancer‐promoting capacity of cancer‐associated fibroblasts (CAFs) by modifying EGFR core fucosylation (CF) in non‐small cell lung cancer (NSCLC). Am J Cancer Res. 2020;10:816‐837. [PMC free article] [PubMed] [Google Scholar]
- 25.Osumi D, Takahashi M, Miyoshi E, et al. Core fucosylation of E‐cadherin enhances cell‐cell adhesion in human colon carcinoma WiDr cells. Cancer Sci. 2009;100:888‐895. [DOI] [PMC free article] [PubMed] [Google Scholar]
- 26.Saldova R, Fan Y, Fitzpatrick JM, Watson RW, Rudd PM. Core fucosylation and alpha2‐3 sialylation in serum N‐glycome is significantly increased in prostate cancer comparing to benign prostate hyperplasia. Glycobiology. 2011;21:195‐205. [DOI] [PubMed] [Google Scholar]
- 27.Zhao R, Qin W, Qin R, et al. Lectin array and glycogene expression analyses of ovarian cancer cell line A2780 and its cisplatin‐resistant derivate cell line A2780‐cp. Clin Proteomics. 2017;14:20. [DOI] [PMC free article] [PubMed] [Google Scholar]
- 28.Ma M, Han G, Wang Y, Zhao Z, Guan F, Li X. Role of FUT8 expression in clinicopathology and patient survival for various malignant tumor types: a systematic review and meta‐analysis. Aging (Albany NY). 2021;13(2):2212‐2230. [DOI] [PMC free article] [PubMed] [Google Scholar]
- 29.Tu CF, Wu MY, Lin YC, Kannagi R, Yang RB. FUT8 promotes breast cancer cell invasiveness by remodeling TGF‐beta receptor core fucosylation. Breast Cancer Res. 2017;19:111. [DOI] [PMC free article] [PubMed] [Google Scholar]
- 30.Cheng C, Ru P, Geng F, et al. Glucose‐mediated N‐glycosylation of SCAP is essential for SREBP‐1 activation and tumor growth. Cancer Cell. 2015;28:569‐581. [DOI] [PMC free article] [PubMed] [Google Scholar]
- 31.Wang Y, Fukuda T, Isaji T, et al. Loss of alpha1,6‐fucosyltransferase inhibits chemical‐induced hepatocellular carcinoma and tumorigenesis by down‐regulating several cell signaling pathways. FASEB J. 2015;29:3217‐3227. [DOI] [PubMed] [Google Scholar]
- 32.Woodfield GW, Horan AD, Chen Y, Weigel RJ. TFAP2C controls hormone response in breast cancer cells through multiple pathways of estrogen signaling. Cancer Res. 2007;67:8439‐8443. [DOI] [PubMed] [Google Scholar]
- 33.Spanheimer PM, Askeland RW, Kulak MV, Wu T, Weigel RJ. High TFAP2C/low CD44 expression is associated with an increased rate of pathologic complete response following neoadjuvant chemotherapy in breast cancer. J Surg Res. 2013;184:519‐525. [DOI] [PMC free article] [PubMed] [Google Scholar]
- 34.Zhou Y, Fukuda T, Hang Q, et al. Inhibition of fucosylation by 2‐fluorofucose suppresses human liver cancer HepG2 cell proliferation and migration as well as tumor formation. Sci Rep. 2017;7:11563. [DOI] [PMC free article] [PubMed] [Google Scholar]
- 35.Zhang XF, Wang J, Jia HL, et al. Core fucosylated glycan‐dependent inhibitory effect of QSOX1‐S on invasion and metastasis of hepatocellular carcinoma. Cell Death Discov. 2019;5:84. [DOI] [PMC free article] [PubMed] [Google Scholar]
- 36.Thaysen‐Andersen M, Packer NH. Site‐specific glycoproteomics confirms that protein structure dictates formation of N‐glycan type, core fucosylation and branching. Glycobiology. 2012;22:1440‐1452. [DOI] [PubMed] [Google Scholar]
- 37.Aoyagi Y, Isemura M, Suzuki Y, et al. Fucosylated alpha‐fetoprotein as marker of early hepatocellular carcinoma. Lancet. 1985;2:1353‐1354. [DOI] [PubMed] [Google Scholar]
- 38.Wang X, Gu J, Ihara H, Miyoshi E, Honke K, Taniguchi N. Core fucosylation regulates epidermal growth factor receptor‐mediated intracellular signaling. J Biol Chem. 2006;281:2572‐2577. [DOI] [PubMed] [Google Scholar]
- 39.Comunale MA, Rodemich‐Betesh L, Hafner J, et al. Linkage specific fucosylation of alpha‐1‐antitrypsin in liver cirrhosis and cancer patients: implications for a biomarker of hepatocellular carcinoma. PLoS One. 2010;5.e12419 [DOI] [PMC free article] [PubMed] [Google Scholar]
- 40.Geng F, Shi BZ, Yuan YF, Wu XZ. The expression of core fucosylated E‐cadherin in cancer cells and lung cancer patients: prognostic implications. Cell Res. 2004;14:423‐433. [DOI] [PubMed] [Google Scholar]
- 41.Cao Q, Zhao X, Zhao Q, et al. Strategy integrating stepped fragmentation and glycan diagnostic ion‐based spectrum refinement for the identification of core fucosylated glycoproteome using mass spectrometry. Anal Chem. 2014;86:6804‐6811. [DOI] [PubMed] [Google Scholar]
- 42.Cao Q, Zhao Q, Qian X, Ying W. Identification of core‐fucosylated glycoproteome in human plasma. Methods Mol Biol. 2017;1619:127‐137. [DOI] [PubMed] [Google Scholar]
Associated Data
This section collects any data citations, data availability statements, or supplementary materials included in this article.
Supplementary Materials
Fig S1‐S5
Table S1
Data Availability Statement
The data sets used and analyzed during the current study are available from the corresponding author on reasonable request.


