Abstract
Epstein‐Barr virus (EBV) is associated with approximately 10% of gastric cancers (GCs). We previously showed that EBV infection of gastric epithelial cells induces aberrant DNA methylation in promoter regions, which causes silencing of critical tumor suppressor genes. Here, we analyzed gene expressions and active histone modifications (H3K4me3, H3K4me1, and H3K27ac) genome‐widely in EBV‐positive GC cell lines and in vitro EBV‐infected GC cell lines to elucidate the transcription factors contributing to tumorigenesis through enhancer activation. Genes associated with “signaling of WNT in cancer” were significantly enriched in EBV‐positive GC, showing increased active β‐catenin staining. Genes neighboring activated enhancers were significantly upregulated, and EHF motif was significantly enriched in these active enhancers. Higher expression of EHF in clinical EBV‐positive GC compared with normal tissue and EBV‐negative GC was confirmed by RNA‐seq using The Cancer Genome Atlas cohort, and by immunostaining using our cohort. EHF knockdown markedly inhibited cell proliferation. Moreover, there was significant enrichment of critical cancer pathway–related genes (eg, FZD5) in the downstream of EHF. EBV protein LMP2A caused upregulation of EHF via phosphorylation of STAT3. STAT3 knockdown was shown to inhibit cellular growth of EBV‐positive GC cells, and the inhibition was rescued by EHF overexpression. Our data highlighted the important role of EBV infection in gastric tumorigenesis via enhancer activation.
Keywords: histone modification, Epstein‐Barr virus, gastric cancer, enhancer, EHF
We here analyzed the global alteration of gene expressions and active histone modifications to identify activated enhancer regions after EBV infection and to predict the master transcription factors in EBV‐positive GC. We identified that EHF was a critical transcription factor at active enhancers, which promoted cell proliferation in EBV‐positive GC. In addition, we identified its downstream target gene, FZD5, which is a potential oncogene that regulates cell growth after EBV infection.
![]()
Abbreviations
- EBV
Epstein‐Barr virus
- FDR
false discovery rate
- FPKM
fragments per kilobase of exon per million mapped sequence reads
- GC
gastric cancer
- GSEA
gene set enrichment analysis
- MEM
minimum essential media
- NGS
next generation sequencer
- TCGA
The Cancer Genome Atlas
- TF
transcription factor
- UCSC
University of California Santa Cruz
1. INTRODUCTION
Gastric cancer (GC) is a deadly disease and it was the second leading cause of cancer mortality worldwide in 2018, responsible for 783 000 deaths.1 The bacterium Helicobacter pylori and Epstein‐Barr virus (EBV) still represent the majority of infectious agents causing GC.2, 3, 4, 5 As a human oncogenic virus, EBV has been identified in several malignant diseases, including Burkitt's lymphoma, nasopharyngeal carcinoma, approximately 50% of Hodgkin's disease, and approximately 10% of all GC.6 Since the EBV genome was sequenced in 1984, molecular analysis of EBV has revealed fundamental mechanisms of more general relevance through viral proteins, which contribute to tumorigenesis in EBV‐associated GC.7, 8
EBV belongs to the Herpesviruses family, and contains a ~172‐kb linear dsDNA genome.9 During de novo infection, latency infection occurs first, and then distinct latent gene expression patterns are established in vivo and in cultured cells (latency I‐III). Viral genomes exist as extrachromosomal episomes in the nucleus and only express some latent proteins (EBV‐determined nuclear antigen 1 [EBNA1], 2, 3A, 3B, 3C, and EBNA‐LP; latent membrane protein 1 [LMP1] and 2 [LMP2]; noncoding RNA [EBER1 and EBER2]; and viral miRNAs [BHRF1‐miRNA and BART‐miRNA]).10, 11 EBV‐associated GC belongs to latency I, and one of the critical factors, LMP2A, can be detected in approximately half of the cases. Expression of LMP2A induces STAT3 phosphorylation followed by DNMT1 transcriptional activation and PTEN promoter methylation, indicating that LMP2A plays an essential role in the development and maintenance of EBV‐associated GC.12
Previous genomic studies from our group and The Cancer Genome Atlas (TCGA) consortium in the United States have shown that EBV‐positive GC represents a unique molecular subtype of GC due to the genome‐wide burden of DNA hypermethylation.13, 14, 15 With multistep carcinogenesis, EBV‐positive GC is thought to be related to PIK3CA mutations and PD‐L1/2 overexpression.13, 16
Aberrant DNA methylation is one of the leading epigenomic alterations that causes silencing of multiple tumor suppressor genes. It has been proven to strongly contribute to cancer development, especially when it occurs on gene promoter regions.17, 18
In addition to DNA methylation, histone modification is also known as an epigenetic driver of many other types of cancer.19, 20 The dynamics of histone alterations usually cooperate with transcription programs to interact with genes through master transcription factors (TFs) by binding specific enhancer regions.21, 22 It has been reported that one of the master TFs, ATF3, induces aberrant enhancer activation after EBV infection in GC.23 Other studies have also implied that EBV infection can induce enhancer rewiring by chromatin structural aberrations, contributing to EBV‐positive GC tumorigenesis.24 However, other functional TFs and the regulatory mechanisms during EBV infection in GC are still largely unknown.
In this study, we analyzed the global alteration of active histone modifications to identify activated enhancer regions after EBV infection and to predict the master TFs in EBV‐associated GC. We identified that EHF was a critical factor in active enhancers, which promoted cell proliferation in EBV‐positive GC.25 In addition, we identified its downstream target gene, FZD5, which is a potential oncogene that regulates cell growth after EBV infection. These results provided new insights into epigenomic aberrations after EBV infection and might indicate a potential therapeutic opportunity for EBV‐positive GC treatment.
2. MATERIALS AND METHODS
2.1. Cell culture
The human GC cell line, MKN7, was purchased from the Riken BioResource Center Cell Bank (Ibaraki) and cultured in RPMI‐1640 medium. MKN7 cells were infected with EBV‐Akata recombinant virus carrying neomycin‐resistance gene, and selected by G418 (Roche Diagnostics) at 200 μg/mL, as previously reported.14 The study design was approved by the Institutional Review Board of Chiba University. SNU719 cells (Korean Cell Line Bank) and NCC24 cells (Creative Bioarray) were cultured in RPMI‐1640 medium. YCC10 cells (Yonsei Cancer Center) were cultured in minimum essential media (MEM) supplemented with 1% nonessential amino acid solution. GES1 is a normal fetal gastric epithelial cell line immortalized with SV40 (Beijing Institute for Cancer Research) (GES1_WT) and was cultured in RPMI‐1640 medium.
2.2. Chromatin immunoprecipitation and ChIP‐seq analysis
Chromatin immunoprecipitation (ChIP) assays were performed on approximately 107 cells, as previously reported.22 Libraries were constructed from ChIP‐ed DNA by using the KAPA Hyper Prep Kit (KAPA Biosystems) according to the manufacturer's instructions and sequenced using next generation sequencer (NGS) at a concentration of 6.5 pM on an Illumina Hiseq1500 or 1.5 pM on Nextseq500 platforms (Illumina). Spike‐in antibody (Active Motif) was added to target‐antibody–conjugated beads, and spike‐in chromatin (Active Motif) was added to the fixed sample chromatin according to the manufacturer's instructions for normalization strategy.
Sequenced reads were mapped to the University of California Santa Cruz (UCSC) human genome (hg19) using Bowtie. Peak calling and motif analyses were performed using HOMER software (http://homer.salk.edu/homer/index.html). For motif enrichment analysis, nucleosome‐free regions were predicted from H3K27ac ChIP‐seq data using the HOMER findPeaks program with the nucleosome‐free regions option. After obtaining nucleosome‐free regions, enriched motifs within 200 bp of nucleosome‐free regions at activated enhancers were calculated using the HOMER findMotifsGenome program. Enhancer annotation of the nearest genes was performed using GREAT (http://bejerano.stanford.edu/great/public/html/index.php). Peak heatmaps were produced using TreeView for enrichment calculations and visualization. Gene Ontology (GO) analysis was performed using Metascape (http://metascape.org/gp/index.html#/main/step1).
2.3. RNA sequencing
RNA was extracted using the Direct‐zol RNA MiniPrep Kit (Zymo Research Corporation). RNA sequencing (RNA‐seq) libraries were prepared using the TruSeq Stranded mRNA Sample Prep Kit (Illumina) and sequenced using NGS, on Illumina Hiseq1500 or Nextseq500 platforms (Illumina). Sequenced reads were aligned using HISAT2, and Cufflinks were used for transcript assembly. Gene expression levels were expressed as fragments per kilobase of exon per million mapped sequence reads (FPKM). Gene set enrichment analysis (GSEA) was performed using GSEA software (version 4.0.3; http://software.broadinstitute.org/gsea/index.jsp).
2.4. RNA extraction and quantitative reverse transcription–polymerase chain reaction (RT‐PCR)
Total RNA was extracted using TRIzol reagent (ThermoFisher). Quantitative RT‐PCR (RT‐qPCR) was carried out on a CFX96 Thermal Cycler DiceTM real‐time PCR system (Bio‐Rad Laboratories, Inc) using SYBR Premix Ex TaqTM (Takara). The mRNA expression of the indicated genes was normalized to that of GAPDH. The primer sequences are presented in the Table S1.
2.5. Knockdown by shRNA and siRNA
To knock down EHF, small hairpin RNA (shRNA) against EHF and control nontarget sequence (shEHF and shCTRL) were designed (Table S2), and viral packaging for shRNA retrovirus vectors was performed using 293T cells and FuGENE 6 (Promega). The supernatant medium containing the virus was collected 48 hours after transfection.
For siRNA, oligonucleotides of target‐specific and control siRNAs were obtained from ThermoFisher Scientific (Table S2). Cells were transfected at 70% confluence using Lipofectamine 2000 (Invitrogen), following the manufacturer's protocol.
2.6. Overexpression of latent EBV factors and EHF
Latent viral factors, BARF, EBER1, EBNA1, and LMP2A, were previously constructed in pcDNA3 vector14 and introduced in MKN7 cells using FuGene6. For EHF overexpression, EHF cDNA was cloned into pLEX305‐2xHA vector. Viral packaging for lentivirus vectors was performed using 293T cells, and the medium containing the lentivirus was collected 48 hours after transfection.
2.7. Immunoblotting analysis
Cell lysates were resolved using 12% SDS‐PAGE. Anti‐EHF (Abcom, ab167264), anti‐p‐STAT3 (SAB4300033‐100UG, rabbit polyclonal), anti‐STAT3 (SAB2102317‐100UL, rabbit polyclonal), and anti‐ACTB (ACTN05 [C4]) antibodies were used as primary antibodies. Protein‐blotted membranes were incubated with antibodies using Can Get Signal Immunoreaction Enhancer Solution (Toyobo) at 4℃ overnight for the primary antibodies and at room temperature for 1 hour for secondary antibodies, followed by visualization using the ECL Prime system (GE Healthcare). The protein signals were detected using LAS‐3000 (Fujifilm).
2.8. Apoptosis and cell cycle analysis
Apoptosis was evaluated using the Annexin V apoptosis detection kit (BD). For cell cycle analysis, cells were fixed in ice‐cold 70% ethanol at 4℃ overnight, stained with propidium iodide solution (50 μg/mL propidium iodide, 50 μg/mL RNase A,0.1% Triton‐X, 0.1 mM EDTA), and subjected to FACS analysis.
2.9. Quantification of active β‐catenin
Cells were fixed with 4% paraformaldehyde, permeabilized with cold methanol, and stained with 0.5 µg/mL of anti‐active‐β‐catenin antibody (05‐665, clone 8E7; Sigma). The cells were stained with Alexa Fluor 546–conjugated anti‐mouse IgG (Life Technologies) and suspended with 5% FBS/PBS. The mean fluorescence intensity for Alexa Fluor 546 was measured by CytoFLEX flow cytometer (Beckman Coulter) and analyzed with FlowJo software. For the gating strategy, a single‐cell population was gated in an FSC‐A versus SSC‐A plot and then was gated in an FSC‐H versus FSC‐W plot to exclude doublets.
2.10. Immunohistochemistry
Clinical GC tissue samples were obtained from patients undergoing gastrectomy at Tokyo University Hospital, with written informed consents. Formalin‐fixed, paraffin‐embedded tissue blocks of EBV(−) and EBV(+) GC were cut into 4‐μm‐thick sections. Three serial sections were prepared for each tissue block and used for hematoxylin and eosin (H&E) staining and immunohistochemistry (IHC) using anti‐EHF (Abcom, ab167264) and anti‐p‐STAT3 (SAB4300033‐100UG, rabbit polyclonal) antibodies. IHC was performed using Ventana BenchMark automated immunostainer (Ventana Medical Systems), and visualized with OptiView DAB IHC Detection Kit (760‐700; Roche) according to the manufacturer's instructions. Two independent experienced pathologists scored the staining as follows: 3 (strong), 2 (moderate), 1 (weak), and 0 (negative). The study design was approved by the Institutional Review Board of Chiba University and the University of Tokyo.
2.11. Cell growth assay
Cells were seeded into 96‐well plates at 2000 cells per well in 100 μL of medium. Cell proliferation was measured using WST‐8 assay, following the manufacturer's protocol.
2.12. Data availability statement
Next generation sequencer data have been deposited in the Gene Expression Omnibus under accession #GSE164225 (GSM5004244‐GSM5004253). ChIP‐seq #GSE164223 (GSM5004244‐GSM5004251) and RNA‐seq #GSE164224 (GSM5004252‐GSM5004253) were used in this study. The authors declare that all other data are available within the article, in associated [Link], [Link], or from the authors on request.
2.13. Statistical analyses
Error bars in all data represent standard deviation. For statistical comparison, we performed Student's t‐test, Welch's t‐test, or Wilcoxon signed‐rank test using R software. Data with statistical significance (*P < .05, **P < .01) are shown in figures.
3. RESULTS
3.1. Identification of active oncogenic pathways in EBV‐positive GC
To identify oncogenic pathways activated in EBV‐positive GC, we performed RNA‐seq using normal gastric cells (GES1) and EBV‐negative GC cell MKN7_WT, and compared them with three EBV‐positive GC cells (SNU719, NCC24, and YCC10). We identified significantly activated genes in the three EBV‐positive GC cells, compared with GES1 (Figure 1A) and MKN7_WT (Figure S1A). GO analysis showed that “signaling by WNT in cancer” was commonly enriched in active genes in three EBV‐positive GC cells (Figure 1B, Figure S1B, Tables S3 and S4). We next performed GSEA using RNA‐seq data of EBV‐positive GC and normal gastric tissues from TCGA consortium to confirm significant upregulation of WNT target genes (eg, FZD5) in clinical EBV‐positive GC tissues compared with normal tissues (Figure 1C, Table S5). To test the global WNT pathway activity, we performed active β‐catenin staining in the GES1 cell and three EBV‐positive GC cells. The active β‐catenin intensity was significantly increased in the EBV‐positive GC cells compared with the GES1 cell (Figure 1D,E).
FIGURE 1.
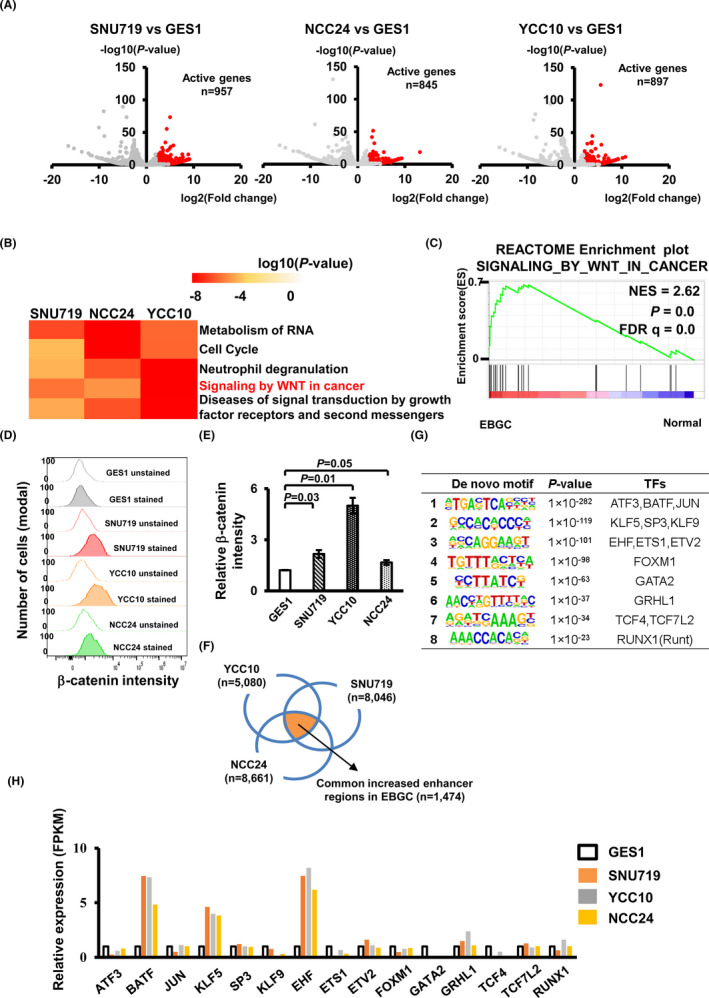
Gene activation in Epstein‐Barr virus (EBV)‐positive GC (gastric cancer). A, Differentially expressed genes in three EBV‐positive GC compared with normal GES1 cells. Significantly active genes in EBV‐positive GC (red plots) were selected by P‐value <.05 and expression level >2‐fold increase. B, Enriched pathways of active genes in three EBV‐positive GC. Enriched terms were selected by log10(P‐value)<−4. C, GSEA of the pathway termed “SIGNALING_BY_WNT_IN_CANCER” in EBV‐positive GC compared with normal tissue. FDR, false discovery rate. D, Quantification of active β‐catenin in GES1 and three EBV‐positive GC cells. The histogram shows the number of cells and intensity of active β‐catenin staining, to compare unstained and stained cells. Data were analyzed by Flowjo with three independent experiments. E, Relative intensity of active β‐catenin staining in GES1 and three EBV‐positive GC cells. It was calculated by dividing the average intensity of stained cells by the average intensity of unstained cells. The intensity of active β‐catenin was increased in three EBV‐positive GC cells compared with GES1. F, Overlap of differentially active H3K27ac peaks in three EBV‐positive GC cells compared with GES1. 1474 regions were overlapped by three EBV‐positive GC cells. G, Motif analysis of activated enhancers. Enriched de novo motif at nucleosome‐free regions predicted by the HOMER program from H3K27ac ChIP‐seq data. H, RNA expression levels of transcription factors (TFs) with significant enrichment. BATF, KLF5, and EHF were upregulated in three EBV‐positive GC
3.2. Predicting enhancer activation factors in EBV‐positive GC cell lines
To predict the master TFs of oncogenic pathways in EBV‐positive GC, we performed ChIP‐seq for H3K4me3, H3K4me1, and H3K27ac, using GES1 and three EBV‐positive GC cells as previously described.14 We comprehensively analyzed H3K27ac status and extracted regions with >2‐fold H3K27ac signal in each EBV‐positive GC cell compared with GES1, and then classified them into promoter and enhancer regions using H3K4 methylation status (Figure S2). A total of 1474 enhancer regions were overlapped in three EBV‐positive GC cells (Figure 1F). Next, to predict TFs that activate common enhancer regions, we performed motif analysis at commonly activated enhancers and identified eight de novo motifs (Figure 1G). Then, we checked the expression levels of candidate TFs that could bind to enriched motifs in three EBV‐positive GC cells and GES1, identifying that BATF, KLF5, and EHF were potential master regulators upregulated in EBV‐positive GC cells (Figure 1H).
3.3. Confirmation of enhancer activation factors using an in vitro EBV infection model
To validate whether EBV‐associated epigenetic features could be directly induced by a viral infection, we performed an EBV in vitro infection using MKN7 cells (MKN7_WT), establishing EBV‐infected MKN7 cells (MKN7_EB) as previously described.14 A total of 8310 activated regions and 7332 repressed regions were identified, using H3K27ac ChIP‐seq data (Figure 2A), and the activated 8310 regions included 5783 enhancer regions (Figure 2B).22 It was confirmed that the expression of the nearest gene to each activated enhancer was significantly higher in MKN7_EB compared with MKN7_WT (Figure 2C). Motif analysis on 5783 activated enhancers revealed eight de novo motifs (Figure 2D), and only the “AGGAA” motif overlapped with the previous de novo motif in EBV‐positive GC cells (Figure 1G). RNA‐seq analysis showed that its binding factor, EHF, was significantly upregulated after EBV infection (Figure 2E). According to TCGA RNA‐seq data, EHF was highly expressed in each GC subtype, including EBV‐positive GC, compared with normal tissue (Figure 2F). To confirm the expression of EHF protein in cancer tissue, we performed immunohistochemical staining with 57 clinical samples (Figure 2G) and showed that EHF protein was significantly more expressed in EBV‐positive GC tissue than in EBV‐negative GC and normal tissue samples (Figure 2H). From these data, we identified EHF as an oncogenic master regulator that could aberrantly activate enhancer regions after EBV infection.
FIGURE 2.
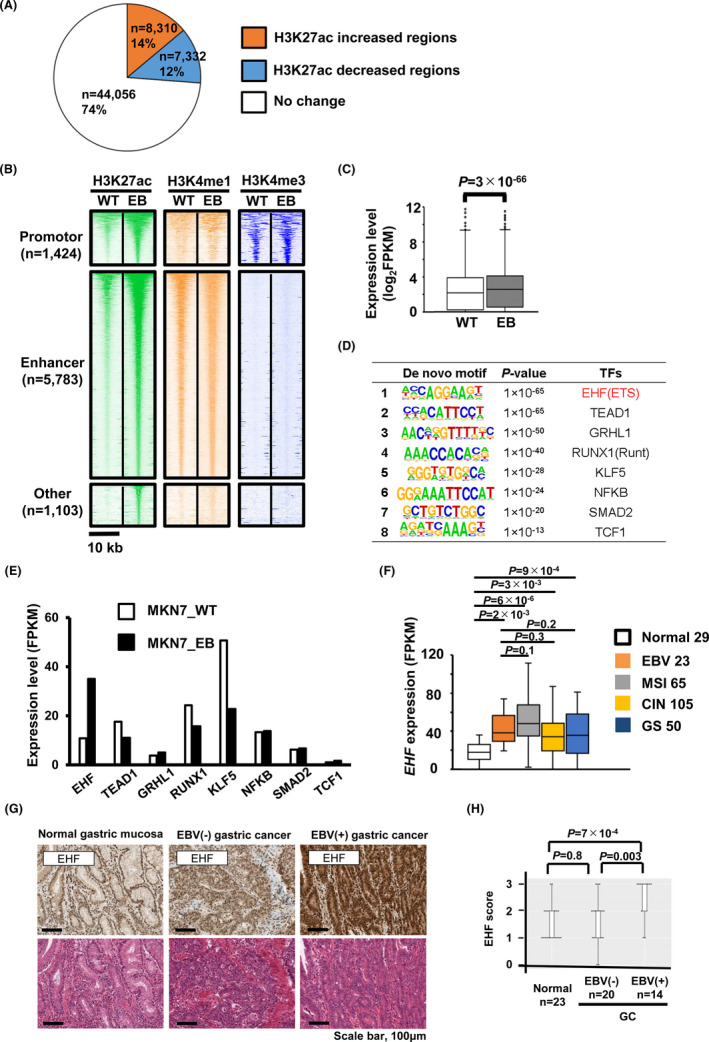
Epigenetic alteration of enhancers in MKN7 after Epstein‐Barr virus (EBV) infection. A, Peak finding analysis in MKN7_EB compared with MKN7_WT. Comparison of active mark H3K27ac; a total of 8310 regions with >2‐fold increase were extracted. B, Classification of H3K27ac increased peaks. WT, MKN7_WT; EB, MKN7_EB. H3K27ac increased peaks are classified using the promoter mark H3K4me3 and the enhancer mark H3K4me1. C, Expression of genes nearest to each activated enhancer was significantly upregulated in MKN7_EB. D, Enriched de novo motif at nuclear‐free regions predicted by HOMER from H3K27ac data. E, RNA expression levels in best‐matched transcription factors (TFs). EHF was strongly activated in MKN7_EB. F, RNA expression levels of EHF in The Cancer Genome Atlas (TCGA) data for different gastric cancer (GC) subtypes. G, IHC of EHF (top) and H&E staining (bottom). H, immunohistochemistry (IHC) scores of EHF were higher in EBV‐positive GC than EBV‐negative GC and normal tissues
3.4. Growth regulation by EHF
To elucidate the oncogenic role of EHF, we knocked down EHF by shRNA (Figure 3A) and tested its effect on cellular growth. Compared with shCTRL, MKN7_EB cell lines showed cell proliferation inhibition by shEHF significantly (Figure 3B). By EHF knockdown, the cell cycle was arrested in the G1 phase (Figure 3C), and the number of apoptotic cells was increased compared with shCTRL (Figure 3D). These suggested a growth‐promoting role of EHF in EBV‐positive GC cells.
FIGURE 3.
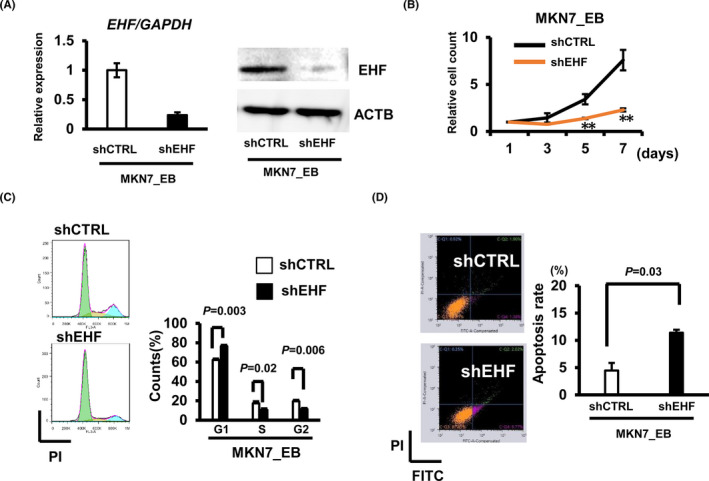
Induction of cell cycle arrest and apoptosis by EHF knockdown. A, Knockdown of EHF mRNA and protein by using shEHF in MKN7_EB was confirmed by RT‐qPCR and Western blot assays. GAPDH, normalized control for RT‐qPCR. ATCB, loading control for Western blot. B, Growth assay by EHF knockdown in MKN7_EB. C, Cell cycle analysis of EHF–knocked‐down MKN7_EB cells. Cell cycle fractions were measured by flow cytometry with transfection of shEHF in MKN7_EB. D, Apoptosis analysis of EHF‐knockdown MKN7_EB cells. Apoptotic cells, including early and late apoptotic cells, were measured after knockdown using shEHF by flow cytometry analysis of Annexin V‐FITC/PI double‐labeled cells. The data were collected by three independent experiments
3.5. Prediction of EHF downstream target genes
We performed RNA‐seq and ChIP‐seq after knockdown by shEHF in the MKN7_EB cell to identify downstream target genes of EHF and conducted GSEA. The genes in “signaling by WNT in cancer” were found to be significantly activated in shCTRL cells compared with shEHF cells (Figure 4A,B, Table S6). As “signaling by WNT in cancer” was significantly enriched in three EBV‐positive cell lines (Figure 1B) and clinical EBV‐positive GC tissues (Figure 1C), we focused on this pathway for further analysis. Among 28 genes in “signaling by WNT in cancer,” FZD5 was the most downregulated gene after EHF knockdown (Figure 4C). Enhancer region of FZD5 with EHF motif was activated with H3K27ac increase after EBV infection and H3K27ac decrease by EHF knockdown in MKN7_EB. This enhancer was activated in SNU719 and YCC10 cells compared with GES1, and Hi‐C analysis in SNU719 and YCC1024 showed an interaction between this enhancer and the FZD5 promoter region (Figure 4D). To confirm whether the EHF directly binds to FZD5 enhancer, we performed ChIP‐PCR against EHF and detected EHF binding to the FZD5 enhancer region in MKN7_EB (Figure 4E, Table S1). In the analysis of β‐catenin staining, the active β‐catenin intensity was significantly increased in MKN7_EB compared with MKN7_WT (Figure 4F,G). To further confirm FZD5 regulation by EHF, we performed EHF knockdown using two different siRNAs (siEHF#1 and #2) in MKN7_EB and three EBV‐positive GC cell lines and found downregulation of FZD5 (Figure 4H). We also determined the RNA expression levels of FZD5 in TCGA data using different GC subtypes. EBV‐positive GC showed significantly higher FZD5 expression compared with normal tissues (Figure 4I).
FIGURE 4.
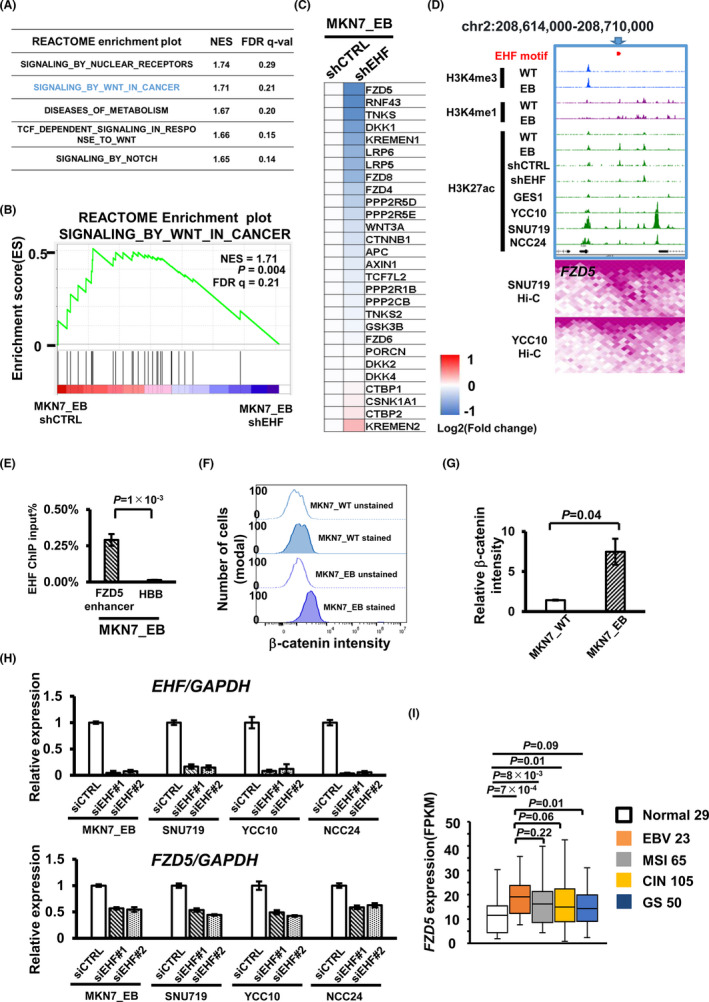
Identification of the EHF downstream target gene FZD5 in the WNT signal pathway. A, Gene set enrichment analysis (GSEA) in Epstein‐Barr virus (EBV)‐positive gastric cancer (GC) by EHF knockdown. The top five enrichment plots were shown with normalized enrichment score (NES) and false discovery rate (FDR) q‐value. B, Enrichment plot “signaling by WNT in cancer” was shown with FDR q‐value <0.25 in MKN7_EB_shEHF. C, Relative expression of potential target genes of the WNT signal pathway after EHF knockdown in MKN7_EB FZD5 was markedly downregulated among the 28 genes. D, Histone modification status and chromatin interaction around FZD5. Around the FZD5 gene, an active enhancer with EHF motif is observed in MKN7_EB and three EBV‐positive GC cell lines. The lower heatmap shows chromatin interaction detected by Hi‐C analysis of SNU719 and YCC10. The active enhancer with EHF motif interacts with the FZD5 promoter in EBV‐positive GC. E, EHF ChIP‐PCR at FZD5 enhancer. EHF binding was observed at the FZD5 enhancer region with EHF motif in MKN7_EB. F, Quantification of active β‐catenin. The histogram shows the number of cells and intensity of active β‐catenin staining, to compare unstained and stained cells. Data were analyzed by Flowjo with three independent experiments. G, Relative intensity of active β‐catenin staining in MKN7_WT and MKN7_EB. The intensity of active β‐catenin was increased in MKN7_EB compared with MKN7_WT. H, Downregulation of FZD5 after EHF knockdown. Knockdown experiments were performed using two different siRNAs (siEHF#1 and #2) in MKN7_EB, SNU719, YCC10, and NCC24. EHF and FZD5 expression levels were determined by RT‐qPCR and normalized by GAPDH. I, RNA expression levels of FZD5 in The Cancer Genome Atlas (TCGA) data for different GC subtypes
3.6. EHF activation by EBV factor LMP2A through the STAT3 pathway
To elucidate which EBV factors activate EHF, we stably induced each EBV factor in MKN7_WT cells. RNA‐seq in each overexpression cell line revealed that both EHF and FZD5 expression levels were increased >2‐fold by LMP2A overexpression compared with mock MKN7 cells (Figure 5A). It has been reported that LMP2A activates STAT3 through phosphorylation in EBV‐positive GC.12 We hypothesized that LMP2A activates EHF through STAT3, which is activated by phosphorylation. To validate STAT3 activation after EBV infection or LMP2A overexpression, we performed Western blotting to assess STAT3 and phosphorylated‐STAT3 (p‐STAT3) expression in MKN7_WT, MKN7_EB, and MKN7_LMP2A. The results showed that EBV infection and LMP2A overexpression induced STAT3 phosphorylation in MKN7 cells (Figure 5B). GSEA also showed significant enrichment of the cytokine‐mediated signaling pathway and Jak‐STAT3 signaling pathway (Figure S3A). Motif enrichment analysis also showed enrichment of the STAT motifs in active promoter regions in the three EBV‐positive GC cells (Figure S3B). To further confirm the expression levels of STAT3 and p‐STAT3 in EBV‐positive cancer tissues, we performed IHC with 57 samples (Figure S3C) and found higher expression of p‐STAT3 in EBV‐positive GC than in EBV‐negative GC and normal tissues (Figure S3D). To confirm whether STAT3 directly binds to EHF promoter/enhancer, we performed ChIP‐PCR against p‐STAT3 and STAT3 and confirmed binding of p‐STAT3 and STAT3 to the EHF promoter and enhancer regions in MKN7_EB (Figure 5C,D). STAT3 knockdown led to downregulation of EHF and FZD5 expression in LMP2A‐overexpressing cells and four EBV‐positive cells, suggesting at least some regulation of the EHF‐FZD5 axis by STAT3 (Figure 5E).
FIGURE 5.
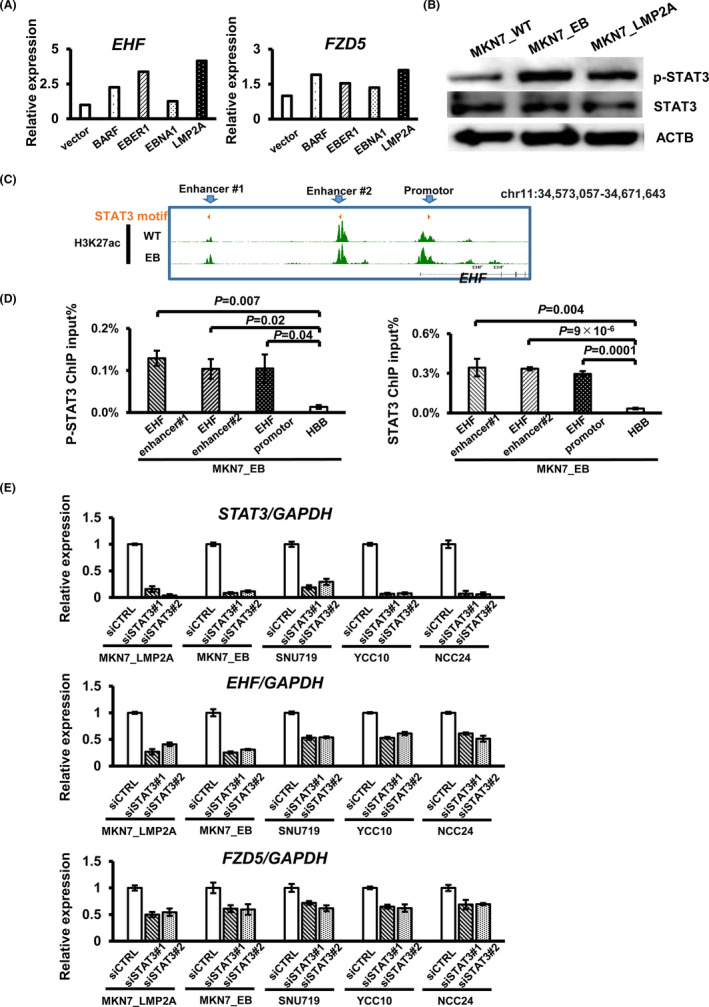
Epstein‐Barrvirus(EBV) factor LMP2A regulated EHF and FZD5 with STAT3 phosphorylation. A, RNA‐seq by EBV factor overexpression in MKN7_WT EHF and FZD5 was highest in LMP2A overexpression compared with the vector control. B, Western blot for p‐STAT3. The protein level of p‐STAT3 was higher in EBV‐positive gastric cancer (GC) than EBV‐negative GC. ATCB was used as a loading control. C, Histone modification states around the EHF promoter and enhancers. Active H3K27ac peaks with the STAT3 motif were observed around EHF in MKN7_WT and MKN7_EB. D, ChIP‐PCR of p‐STAT3 and STAT3 at EHF promoter and enhancers with STAT3 motif. STAT3 and p‐STAT3 are significantly enriched at EHF promoter and enhancer regions in MKN7_EB. E, Knockdown analysis of STAT3. STAT3 knockdown was performed using two different siRNAs (siSTAT3#1 and #2) in MKN7_LMP2A, MKN7_EB, SNU719, YCC10, and NCC24. STAT3, EHF, and FZD5 expression levels were determined by RT‐qPCR, respectively. GAPDH was used as a normalized control for the RT‐qPCR assay. STAT3 knockdown induced EHF and FZD5 downregulation in EBV‐positive GC
3.7. Growth regulation by the EHF‐FZD5 pathway through STAT3
To elucidate the functional role of FZD5, we performed an FZD5 knockdown experiment using two different siRNAs (siFZD5#1 and #2) in MKN7_EB and three other EBV‐positive GC cells (Figure 6A). Cellular growth analysis showed that FZD5 knockdown significantly inhibited cell proliferation in EBV‐positive GC and EBV‐infected MKN7_EB cells compared with siCTRL cells (Figure 6B). To confirm the regulation of the EHF‐FZD5 pathway by STAT3 activation, we performed cellular growth assays using STAT3 knockdown cells. STAT3 knockdown significantly inhibited cell proliferation in LMP2A‐overexpressing cells and in four EBV‐positive cell lines (Figure 6C).
FIGURE 6.
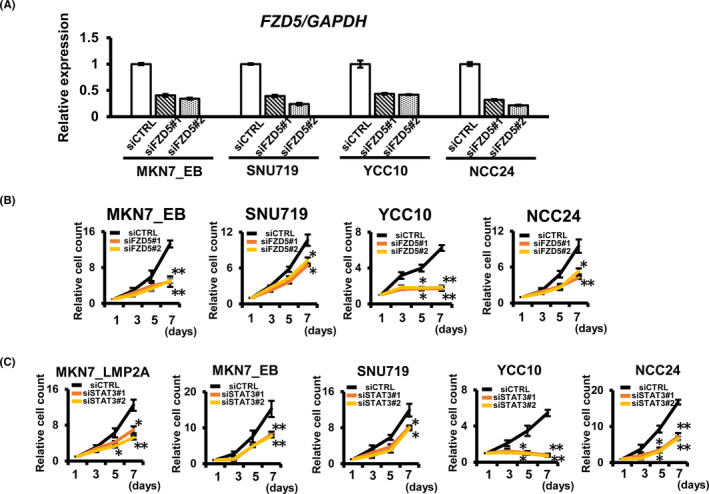
Regulation of cell proliferation by FZD5 in Epstein‐Barr virus (EBV)‐positive gastric cancer (GC). A, Knockdown experiments were performed using two different siRNAs (siFZD5#1 and #2) in MKN7_EB, SNU719, YCC10, and NCC24. The FZD5 expression level was determined by RT‐qPCR. GAPDH was used as a normalized control for the RT‐qPCR assay. B, Growth assays in FZD5 knockdown cells. FZD5 knockdown significantly inhibited cell proliferation in EBV‐positive GC. C, Growth assays in STAT3 knockdown cells. STAT3 knockdown significantly inhibited cell proliferation in EBV‐positive GC
To validate the pSTAT3‐EHF‐FZD5 axis, we performed the EHF rescue experiment in MKN7_EB. We produced two EHF overexpression subclones (EHF_OE#1, #2) and confirmed the expression level of EHF by Western blot (Figure 7A). Then, we knocked down STAT3 by siSTAT3 and confirmed that FZD5 expression level was rescued by EHF overexpression significantly (Figure 7B) and that EHF overexpression significantly rescued the growth suppression in STAT3–knocked‐down condition, at least partly (Figure 7C).
FIGURE 7.
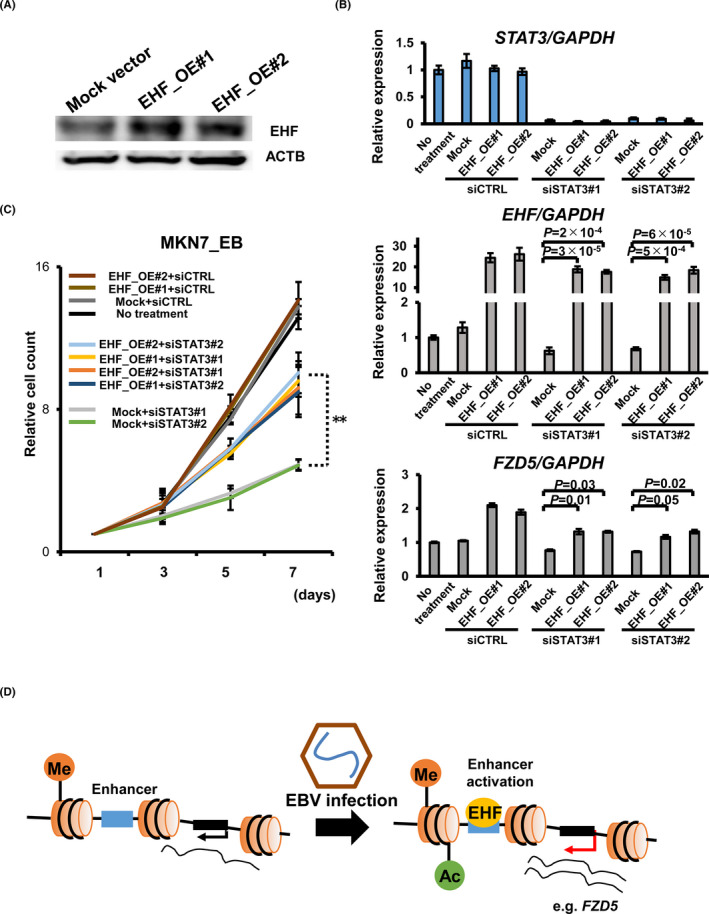
Validation of the pSTAT3‐EHF‐FZD5 axis. A, Western blot for EHF in EHF‐overexpressed MKN7_EB cells. EHF overexpression was confirmed in protein level. ATCB was used as a loading control. B, Knockdown experiments were performed using two different siRNAs (siSTAT3#1 and #2) in EHF‐overexpressed MKN7_EB or mock cells. STAT3, EHF, and FZD5 expression levels were determined by RT‐qPCR, respectively. GAPDH was used as a normalized control for the RT‐qPCR assay. EHF overexpression rescued the expression level of FZD5. C, The cell growth suppression by STAT3 knockdown was rescued by EHF overexpression in MKN7_EB. **Significant difference (P < .01) was observed when EHF_OE#1+siSTAT3#1 and EHF_OE#2+siSTAT3#1 were compared with Mock+siSTAT3#1, and when EHF_OE#1+siSTAT3#2 and EHF_OE#2+siSTAT3#2 were compared with Mock+siSTAT3#2. D, The potential mechanism through epigenetic alternation during Epstein‐Barr virus (EBV) infection in gastric cancer (GC) tumorigenesis
4. DISCUSSION
In this study, we performed ChIP‐seq to identify critical TFs that contribute to enhancer activation. We showed that the oncogenic activities of the TF EHF in EBV‐positive GC correlated with enhancer activation. EHF knockdown significantly inhibited cell proliferation. We identified FZD5, which belongs to the WNT signaling pathway, as a potential downstream target gene regulated by EHF binding enhancers (Figure 7D). In addition, LMP2A contributed to EHF overexpression in latent EBV infection, at least partly through STAT3 activation.
EHF belongs to the ETS TF family as the core GGAA/T motif.26, 27 Previous studies have shown that aberrant expression of EHF may contribute to cell proliferation in several cancer types.28, 29, 30, 31 It has also been reported that EHF overexpression is caused by copy number alteration and binding to the promoter region located in the HER family in GC.32 Regarding EBV‐positive GC, we found that EHF was highly expressed in GC tissues compared with normal tissues, according to TCGA data. IHC staining of our clinical samples confirmed that EHF was highly expressed in EBV‐positive GC. EBV infection induced EHF activation in the EBV‐negative GC cell line MKN7_WT. Meanwhile, EHF knockdown experiments showed a significant difference in cell proliferation, cycle arrest, and apoptosis. These results demonstrated that the EBV genome could be regarded as a trigger for EHF upregulation.
FZD5, one of the genes in the WNT signaling pathway, is activated by EBV infection through EHF binding enhancer activation. It has been reported that FZD5 expression is a unique requirement for Wnt signaling in pancreatic ductal adenocarcinoma (PDAC) cells.33 FZD5 knockdown experiments showed a significantly different cell proliferation in EBV‐positive GC cells. Enhancers with the EHF motif interacted with the FZD5 promoter region. These findings suggest that potential oncogene activation could be induced by enhancer activation in relation to tumorigenesis.
The impact of EBV infection on the development of GC may be a consequence of aberrant enhancer activation by virus latency with its specific domain. Members of the STAT family are intracellular TFs that mediate many mechanisms, such as cellular immunity, proliferation, apoptosis, and differentiation. Extracellular binding of cytokines or growth factors induces activation of receptor‐associated Janus kinases, which can phosphorylate STAT via their SH2 domains.9, 34 Our data showed that EBV latent genes, such as LMP2A, can activate EHF through STAT3 phosphorylation. Knockdown of STAT3 downregulated EHF and FZD5 expression and inhibited cell proliferation. These results suggested a potential mechanism for EBV‐associated GC.
In summary, we showed the EHF‐FZD5 pathway, which is activated by EBV infection or EBV factor LMP2A. We found that EHF revealed an oncogene function and enhancer regulator of downstream target FZD5 as a TF in EBV‐positive GC. Moreover, the EBV domain LMP2A plays a critical role by interacting with the host cell and promoting STAT3 activation. This evidence may elucidate the effective treatment of EBV‐associated cancer in the future.
CONFLICT OF INTEREST
The authors have no conflict of interest.
Supporting information
Figure S1‐S3
Table S1‐S6
ACKNOWLEDGMENTS
We thank E. Ikeda, H. Maruyama, and M. Matsumoto for technical assistance. This work was supported by P‐CREATE 19cm0106510h0004 (AK) and Practical Research for Innovative Cancer Control 19ck0106263h0003 (AK) from the Japan Agency for Medical Research and Development (AMED), Grants‐in‐Aid for Scientific Research (KAKENHI) 19H03726 (AK) and 19K16101 (AO), Global Prominent Research grant 2018‐Y9 (AK) and Therapeutics Research Initiative Grants 2018‐S6 (AO and NH) and 2019‐S6 (AO and NH) from Chiba University, and Specific Research grant 2018 from Takeda Science Foundation.
Li W, Okabe A, Usui G, et al. Activation of EHF via STAT3 phosphorylation by LMP2A in Epstein‐Barr virus–positive gastric cancer. Cancer Sci. 2021;112:3349–3362. 10.1111/cas.14978
REFERENCES
- 1.Ferlay J, Colombet M, Soerjomataram I, et al. Estimating the global cancer incidence and mortality in 2018: GLOBOCAN sources and methods. Int J Cancer. 2019;144:1941‐1953. 10.1002/ijc.31937 [DOI] [PubMed] [Google Scholar]
- 2.Uemura R, Okamoto NS, Yamamoto S, et al. Helicobacter pylori infection and the development of gastric cancer. N Engl J Med. 2001;345:784‐789. [DOI] [PubMed] [Google Scholar]
- 3.Amieva M, Peek RM. Pathobiology of Helicobacter pylori‐induced gastric cancer. Gastroenterology. 2016;150:64‐78. 10.1053/j.gastro.2015.09.004 [DOI] [PMC free article] [PubMed] [Google Scholar]
- 4.Burke AP, Yen TS, Shekitka KM, Sobin LH. Lymphoepithelial carcinoma of the stomach with Epstein‐Barr virus demonstrated by polymerase chain reaction. Mod Pathol. 1990;3:377‐380. [PubMed] [Google Scholar]
- 5.Danilova NV, Malkov PG, Oleynikova NA, Mikhailov IA. Epstein—barr virus‐associated gastric adenocarcinoma. Arkh Patol. 2019;81(3):74‐83. 10.17116/patol20198103174 [DOI] [PubMed] [Google Scholar]
- 6.Murphy G, Pfeiffer R, Camargo MC, Rabkin CS. Meta‐analysis shows that prevalence of Epstein‐Barr virus‐positive gastric cancer differs based on sex and anatomic location. Gastroenterology. 2009;137:824‐833. 10.1053/j.gastro.2009.05.001 [DOI] [PMC free article] [PubMed] [Google Scholar]
- 7.Young LS, Yap LF, Murray PG. Epstein‐Barr virus: more than 50 years old and still providing surprises. Nat Rev Cancer. 2016;16:789‐802. 10.1038/nrc.2016.92 [DOI] [PubMed] [Google Scholar]
- 8.Baer R, Bankier AT, Biggin MD, et al. DNA sequence and expression of the B95–8 Epstein ‐ Barr virus genome. Nature. 1984;310:207‐211. 10.1038/310207a0 [DOI] [PubMed] [Google Scholar]
- 9.Zhao Y, Zhang J, Cheng ASL, Yu J, To K, Kang W. Gastric cancer: genome damaged by bugs. Oncogene. 2020;39:3427‐3442. 10.1038/s41388-020-1241-4 [DOI] [PMC free article] [PubMed] [Google Scholar]
- 10.Iwakiri D, Eizuru Y, Tokunaga M, Takada K. Autocrine growth of Epstein‐Barr virus‐positive gastric carcinoma cells mediated by an Epstein‐Barr virus‐encoded small RNA. Cancer Res. 2003;63:7062‐7067. [PubMed] [Google Scholar]
- 11.Fukayama M, Hino R, Uozaki H. Epstein‐Barr virus and gastric carcinoma: virus‐host interactions leading to carcinoma. Cancer Sci. 2008;99:1726‐1733. 10.1111/j.1349-7006.2008.00888.x [DOI] [PMC free article] [PubMed] [Google Scholar]
- 12.Hino R, Uozaki H, Murakami N, et al. Activation of DNA methyltransferase 1 by EBV latent membrane protein 2A leads to promoter hypermethylation of PTEN gene in gastric carcinoma. Cancer Res. 2009;69:2766‐2774. 10.1158/0008-5472.CAN-08-3070 [DOI] [PubMed] [Google Scholar]
- 13.Bass AJ, Thorsson V, Shmulevich I, et al. Comprehensive molecular characterization of gastric adenocarcinoma. Nature. 2014;513:202‐209. 10.1038/nature13480 [DOI] [PMC free article] [PubMed] [Google Scholar]
- 14.Matsusaka K, Kaneda A, Nagae G, et al. Classification of Epstein‐Barr virus‐positive gastric cancers by definition of DNA methylation epigenotypes. Cancer Res. 2011;71:7187‐7197. 10.1158/0008-5472.CAN-11-1349 [DOI] [PubMed] [Google Scholar]
- 15.Namba‐Fukuyo H, Funata S, Matsusaka K, et al. TET2 functions as a resistance factor against DNA methylation acquisition during Epstein‐Barr virus infection. Oncotarget. 2016;7(49):81512‐81526. 10.18632/oncotarget.13130 [DOI] [PMC free article] [PubMed] [Google Scholar]
- 16.Kaneda A, Kaminishi M, Yanagihara K, Sugimura T, Ushijima T. Identification of silencing of nine genes in human gastric cancers. Cancer Res. 2002;62:6645‐6650. [PubMed] [Google Scholar]
- 17.Geddert H, Hausen AZ, Gabbert HE, Sarbia M. EBV‐infection in cardiac and non‐cardiac gastric adenocarcinomas is associated with promoter methylation of p16, p14 and APC, but not hMLH1. Cell Oncol. 2011;34:209‐214. 10.1007/s13402-011-0028-6 [DOI] [PubMed] [Google Scholar]
- 18.Matsusaka K, Funata S, Fukuyo M, et al. Epstein‐Barr virus infection induces genome‐wide de novo DNA methylation in non‐neoplastic gastric epithelial cells. J Pathol. 2017;242:391‐399. 10.1002/path.4909 [DOI] [PubMed] [Google Scholar]
- 19.Herz HM, Hu D, Shilatifard A. Enhancer malfunction in cancer. Mol Cell. 2014;53:859‐866. 10.1016/j.molcel.2014.02.033 [DOI] [PMC free article] [PubMed] [Google Scholar]
- 20.Bradner JE, Hnisz D, Young RA. Transcriptional addiction in cancer. Cell. 2017;168:629‐643. 10.1016/j.cell.2016.12.013 [DOI] [PMC free article] [PubMed] [Google Scholar]
- 21.Jones PA, Baylin SB. The epigenomics of cancer. Cell. 2007;128:683‐692. 10.1016/j.cell.2007.01.029 [DOI] [PMC free article] [PubMed] [Google Scholar]
- 22.Okabe A, Funata S, Matsusaka K, et al. Regulation of tumour related genes by dynamic epigenetic alteration at enhancer regions in gastric epithelial cells infected by Epstein‐Barr virus. Sci Rep. 2017;7:1‐13. 10.1038/s41598-017-08370-7 [DOI] [PMC free article] [PubMed] [Google Scholar]
- 23.Asakawa Y, Okabe A, Fukuyo M, et al. Epstein‐Barr virus‐positive gastric cancer involves enhancer activation through activating transcription factor 3. Cancer Sci. 2020;111:1818‐1828. 10.1111/cas.14370 [DOI] [PMC free article] [PubMed] [Google Scholar]
- 24.Okabe A, Huang KK, Matsusaka K, et al. Cross‐species chromatin interactions drive transcriptional rewiring in Epstein‐Barr virus–positive gastric adenocarcinoma. Nat Genet. 2020;52:919‐930. 10.1038/s41588-020-0665-7 [DOI] [PubMed] [Google Scholar]
- 25.Kumar S, Warrell J, Li S, et al. Passenger mutations in more than 2,500 cancer genomes: overall molecular functional impact and consequences. Cell. 2020;180:915‐927.e16. 10.1016/j.cell.2020.01.032 [DOI] [PMC free article] [PubMed] [Google Scholar]
- 26.Sharrocks AD. The ETS‐domain transcription factor family. Nat Rev Mol Cell Biol. 2001;2:827‐837. 10.1038/35099076 [DOI] [PubMed] [Google Scholar]
- 27.Sementchenko VI, Watson DK. Ets target genes: past, present and future. Oncogene. 2000;19:6533‐6548. 10.1038/sj.onc.1204034 [DOI] [PubMed] [Google Scholar]
- 28.Liu J, Jiang W, Zhao K, et al. Tumoral EHF predicts the efficacy of anti‐PD1 therapy in pancreatic ductal adenocarcinoma. J Exp Med. 2019;216:656‐673. 10.1084/jem.20180749 [DOI] [PMC free article] [PubMed] [Google Scholar]
- 29.Albino D, Civenni G, Rossi S, Mitra A, Catapano CV, Carbone GM. The ETS factor ESE3/EHF represses IL‐6 preventing STAT3 activation and expansion of the prostate cancer stem‐like compartment. Oncotarget. 2016;7(47):76756‐76768. 10.18632/oncotarget.12525 [DOI] [PMC free article] [PubMed] [Google Scholar]
- 30.Wang L, Ai M, Nie M, et al. EHF promotes colorectal carcinoma progression by activating TGF‐β1 transcription and canonical TGF‐β signaling. Cancer Sci. 2020;111:2310‐2324. 10.1111/cas.14444 [DOI] [PMC free article] [PubMed] [Google Scholar]
- 31.Cheng Z, Guo J, Chen L, Luo N, Yang W, Qu X. Knockdown of EHF inhibited the proliferation, invasion and tumorigenesis of ovarian cancer cells. Mol Carcinog. 2016;55:1048‐1059. 10.1002/mc.22349 [DOI] [PubMed] [Google Scholar]
- 32.Shi J, Qu Y, Li X, et al. Increased expression of EHF via gene amplification contributes to the activation of HER family signaling and associates with poor survival in gastric cancer. Cell Death Dis. 2016;7:2442. 10.1038/cddis.2016.346 [DOI] [PMC free article] [PubMed] [Google Scholar]
- 33.Steinhart Z, Pavlovic Z, Chandrashekhar M, et al. Genome‐wide CRISPR screens reveal a Wnt‐FZD5 signaling circuit as a druggable vulnerability of RNF43‐mutant pancreatic tumors. Nat Med. 2017;23:60‐68. 10.1038/nm.4219 [DOI] [PubMed] [Google Scholar]
- 34.Yuan L, Xu ZY, Ruan SM, Mo S, Qin JJ, Cheng XD. Long non‐coding RNAs towards precision medicine in gastric cancer: Early diagnosis, treatment, and drug resistance. Mol Cancer. 2020;19:1‐22. 10.1186/s12943-020-01219-0 [DOI] [PMC free article] [PubMed] [Google Scholar]
Associated Data
This section collects any data citations, data availability statements, or supplementary materials included in this article.
Supplementary Materials
Figure S1‐S3
Table S1‐S6
Data Availability Statement
Next generation sequencer data have been deposited in the Gene Expression Omnibus under accession #GSE164225 (GSM5004244‐GSM5004253). ChIP‐seq #GSE164223 (GSM5004244‐GSM5004251) and RNA‐seq #GSE164224 (GSM5004252‐GSM5004253) were used in this study. The authors declare that all other data are available within the article, in associated [Link], [Link], or from the authors on request.


