

Abstract
Microtubules are among the most successful targets for anticancer therapy because they play important roles in cell proliferation as they constitute the mitotic spindle, which is critical for chromosome segregation during mitosis. Hence, identifying new therapeutic targets encoding proteins that regulate microtubule assembly and function specifically in cancer cells is critical. In the present study, we identified a candidate gene that promotes tumor progression, ribonucleic acid export 1 (RAE1), a mitotic checkpoint regulator, on chromosome 20q through a bioinformatics approach using datasets of colorectal cancer (CRC), including The Cancer Genome Atlas (TCGA). RAE1 was ubiquitously amplified and overexpressed in tumor cells. High expression of RAE1 in tumor tissues was positively associated with distant metastasis and was an independent poor prognostic factor in CRC. In vitro and in vivo analysis showed that RAE1 promoted tumor growth, inhibited apoptosis, and promoted cell cycle progression, possibly with a decreased proportion of multipolar spindle cells in CRC. Furthermore, RAE1 induced chemoresistance through its anti–apoptotic effect. In addition, overexpression of RAE1 and significant effects on survival were observed in various types of cancer, including CRC. In conclusion, we identified RAE1 as a novel gene that facilitates tumor growth in part by inhibiting apoptosis and promoting cell cycle progression through stabilizing spindle bipolarity and facilitating tumor growth. We suggest that it is a potential therapeutic target to overcome therapeutic resistance of CRC.
Keywords: colorectal cancer, heterogeneity, mitosis, ribonucleic acid export 1 (RAE1), tumor growth
In vitro and in vivo analysis showed that RAE1 promoted tumor growth and inhibited apoptosis of tumor cells, possibly with a decreased proportion of multipolar spindle cells in CRC. Furthermore, RAE1 induced chemoresistance through its anti–apoptotic effect. In conclusion, we identified RAE1 as a novel driver gene that inhibits apoptosis by stabilizing spindle bipolarity and facilitating tumor growth.
1. INTRODUCTION
Microtubules are an important molecular target in the search for new treatments for cancer.1 These molecules are involved in different cellular processes, such as cell signaling, secretion, and motility, and they play an important role in cell proliferation because they constitute the mitotic spindle, an essential structure for chromosome segregation during mitosis. Agents acting on microtubule‐associated proteins interfere with their functions and, thus, can be highly effective in cancer treatment.1, 2, 3, 4 By interfering with microtubule dynamics during mitosis, these compounds induce mitotic dysfunction and apoptotic cell death.5 Hence, identifying new therapeutic molecular targets that regulate microtubule assembly and function specifically in cancer cells is critical.
Pan‐cancer genomic database analyses revealed that the arm‐level amplification frequency and driver gene density are positively correlated, suggesting that the amplification of chromosome arms is a hallmark and a driving force during the evolution of cancer.6 Moreover, we showed that amplification of the long arm of chromosome 20 (Ch.20q) exists in all regions of a single tumor. These data were based upon multiregional copy number analysis of tumor tissues in colorectal cancer (CRC), one of the most common types of cancer worldwide.7, 8 Those findings suggest that amplification of Ch.20q is a fundamental and predominant event and that this region harbors driver genes that affect the tumorigenesis of CRC. The harbored genes could be promising targets to overcome therapeutic resistance conferred by CRC tumor heterogeneity.6
We recently established a screening system using a bioinformatics approach with public datasets to identify candidate genes promoting tumor growth in CRC. Using this system, we identified eIF5‐mimic protein 1 (5MP1), CRMP5‐associated GTPase (CRAG), phosphoserine phosphatase (PSPH), and DEAD‐Box Helicase 56 (DDX56) on chromosome 7p, and general transcription factor 2I repeat domain‐containing protein 1 (GTF2IRD1) on chromosome 7q as potential genes that accelerate tumor development in CRC.9, 10, 11, 12, 13 This system enables us to comprehensively search specifically for potential therapeutic targets that are overexpressed via DNA copy number amplification in CRC cells.
In this report, we describe our use of the screening method and the identification of ribonucleic acid export 1 (RAE1) as a novel gene facilitating tumor growth and a potential therapeutic target on Ch.20q in CRC. RAE1 protein has been shown to bind microtubules14, 15 and play a crucial role as a mitotic checkpoint regulator.16 Furthermore, using in vitro and in vivo experiments, we explored the clinical and oncogenic features of RAE1 in CRC.
2. MATERIALS AND METHODS
2.1. Public datasets
We obtained 623 RNA sequencing data, DNA copy number data and clinical assessments of CRC patients in TCGA from the Broad Institute’s Firehose (http://gdac.broadinstitute.org). We also attained RAE1 mRNA expression and DNA copy number data for 57 CRC cell lines from the Cancer Cell Line Encyclopedia (https://portals.broadinstitute.org/ccle/home). We obtained mutation annotation data of 2547 CRC patients from the Catalogue of Somatic Mutations in Cancer (COSMIC) database (https://cancer.sanger.ac.uk/cosmic).
2.2. Patients with colorectal cancer and collection of clinical samples
All protocols used in this study were approved by the local ethics review board of Kyushu University. A total of 102 patients with CRC who underwent surgical resection of a primary tumor at Kyushu University Beppu Hospital (or the affiliated hospitals) were enrolled in this study. Clinicopathological factors and clinical stage were classified using the American Joint Committee on Cancer (AJCC) 8th edition TNM staging system. All patients were treated in accordance with the Japanese Society of Cancer of the Colon and Rectum Guidelines for the Treatment of Colorectal Cancer. Written informed consent was obtained from all patients. Resected tumor tissues, paired normal tissues, and formalin‐fixed paraffin‐embedded sections from CRC patients were obtained as previously described.9
2.3. Selection of candidate genes
We extracted candidate genes from 537 genes on Ch.20q from TCGA that satisfied the following three criteria, as described previously:10 (a) overexpressed (>2‐fold) in tumor tissues compared to normal tissues; (b) DNA copy number and mRNA expression levels were positively correlated (correlation coefficient cut‐off set at .7); and (c) high mRNA expression group is significantly associated with poor prognosis (P < .05). Genes selected using this strategy were found to be candidate genes that promote tumor progression in CRC, induced by Ch.20q amplification (Figure S1).
2.4. Pan‐cancer analysis
Raw counts and quantile normalized mRNA data for all cancer types were obtained from TCGA. Those cancer types that had fewer than 10 normal tissues for comparison were excluded from our analysis. mRNA expression in the following cancers was compared to mRNA expression in the respective non–cancerous tissues: bladder urothelial carcinoma (BLCA), breast invasive carcinoma (BRCA), colon adenocarcinoma and rectal adenocarcinoma (COADREAD), esophageal carcinoma (ESCA), head and neck squamous cell carcinoma (HNSC), kidney renal clear cell carcinoma (KIRC), kidney renal papillary cell carcinoma (KIRP), liver hepatocellular carcinoma (LIHC), lung adenocarcinoma (LUAD), lung squamous cell carcinoma (LUSC), ovarian serous cystadenocarcinoma (OV), pancreatic adenocarcinoma (PAAD), prostate adenocarcinoma (PRAD), stomach adenocarcinoma (STAD), thyroid carcinoma (THCA), and uterine corpus endometrial carcinoma (UCEC).
2.5. Cell lines and cell culture
The human CRC cell line SW480 was obtained from the JCRB cell bank; CACO2 cells were obtained from the RIKEN BioResource Research Center; and RKO cells were obtained from the ATCC. All cell lines were cultured in appropriate medium supplemented with 10% FBS at 37°C in an atmosphere containing 5% CO2.
2.6. RNA extraction and RT‐quantitative PCR
RNA was extracted from frozen tissue specimens and cell lines using ISOGEN‐II (Nippon Gene), and the RT‐quantitative (qPCR) was carried out as previously described.12 Gene expression was quantified using the following oligonucleotide primers: RAE1: 5ʹ‐AGAGAGGGGCCTGATTGTCT‐3ʹ (sense) and 5ʹ‐TTATCTTTGGCGGGGTTCGG‐3ʹ (antisense), GAPDH: 5ʹ‐AGCCACATCGCTCAGACAC‐3ʹ (sense) and 5ʹ‐GCCCAATACGACCAAATCC‐3ʹ (antisense). Gene expression was normalized to GAPDH expression as an internal control in each sample.
2.7. Immunohistochemical analysis
Immunohistochemistry of RAE1 in CRC tissue samples was carried out as previously described.17 A rabbit polyclonal anti–RAE1 antibody (20491‐1‐AP; ProteinTech) was used as the primary antibody, diluted 1:250 fold. Tumor histology was independently reviewed by two researchers, including an experienced pathologist (T.T.).
2.8. Small interfering RNA‐mediated knockdown experiments
Ribonucleic acid export 1‐specific siRNA (#s16106, #s16107, Thermo Fisher) and negative control siRNA were purchased from Thermo Fisher. Transfection of CRC cells with siRNA oligonucleotides was performed using Lipofectamine RNAiMAX (Thermo Fisher) according to the manufacturer’s instructions. Transfected cells were used for downstream analysis.
2.9. Generation of colorectal cancer cells in which RAE1 was stably knocked down or overexpressed
The target sequence of shRAE1 is 5ʹ‐CCTCAGCAGTAACCAAGCGAT‐3ʹ. Stable knockdown cells and CRC cells overexpressing RAE1 were generated according to standard protocols using pcDNA6.2‐GW/EmGFP‐shRAE1 vector and pcDNA3.3‐RAE1 vector. The shRAE1 of SW480 cells were selected with 10 μg/mL blasticidin treatment followed by sorting for GFP by flow cytometry (FACS). The pcDNA3.3‐RAE1‐expressing RKO cells were selected by exposure for 2 weeks to 1000 μg/mL Geneticin (Gibco). Control cells were generated by transfecting cells with each empty vector.
2.10. Murine xenograft model
All animal procedures were performed as described previously.10 Tumor sizes were calculated using the following formula: tumor volume = length × width2 × .5.
2.11. Western blot analysis
Western blot analysis was carried out as previously described.18 The blots were detected using the FUSION SOLO S (VILBER) to obtain the optimal image for protein band quantification. Antibodies against RAE1(20491‐1‐AP) were purchased from ProteinTech. Antibodies against minichromosome maintenance complex component 2 (MCM2), p21, and β‐actin were purchased from Santa Cruz Biotechnology, and Apoptosis Western Blot Cocktail (ab136812) was purchased from Abcam.
2.12. MTT assay, colony formation assay, and cytotoxicity assay
MTT assay, colony formation, and cytotoxicity assay were performed in vitro according to standard protocols, as described previously.9, 10, 11
2.13. Apoptosis assay
Apoptosis assays were performed in vitro according to standard protocols, as described previously,10 using the Annexin V‐FITC Apoptosis Detection Kit (Abcam) in triplicate.
2.14. Cell cycle assay
Cells were synchronized at the G1 phase of the cell cycle via serum starvation for 72 hours and re–stimulated by changing the medium to that containing 10% FBS as described previously.10 The cells were harvested, washed twice with PBS, and fixed in 70% ethanol at −20°C. The fixed cells were incubated with .25 mg/mL RNase for 10 minutes at 37°C. Subsequently, the cells were washed with PBS and stained with propidium iodide (Sigma Aldrich). The cell cycle distribution was determined using the SH800 cell sorter (Sony Biotechnology).
2.15. Immunofluorescence microscopy and quantification of mitotic defects
Cells were cultured on chamber slides. For knockdown studies, SW480 and CACO2 cells were transfected for 72 hours with RAE1‐specific siRNA or control siRNA. For overexpression studies, RKO cells stably overexpressing RAE1 and control cells were treated with DMSO or paclitaxel (2 nmol/L) for 6 hours. Cells were fixed as described previously.19, 20 Immunostaining was performed using the following antibodies at the indicated dilutions: rabbit anti–pericentrin at 1:2000 (Abcam) and mouse anti–α‐tubulin at 1:2000 (Sigma). Fluorescent image acquisition was performed using a fluorescence microscope (BZ‐X700; Keyence) with a 20× objective. Analysis of mitotic defects was performed as described previously.19 Defects in mitosis were analyzed in all mitotic cells based on five to six photographs, each containing 5‐20 cells, from three independent experiments. Mitotic cells containing more than two spindle poles (determined by tubulin and pericentrin staining) were defined as multipolar.
2.16. Gene set enrichment analysis
Associations between RAE1 expression and previously defined gene sets were analyzed by gene set enrichment analysis (GSEA) using RAE1 expression profiles from a dataset from TCGA.21 Biologically defined gene sets were obtained from the Molecular Signatures Database v5.2 (http://software.broadinstitute.org/gsea/msigdb/index.jsp).
2.17. Statistical analysis
Patient data from TCGA and our CRC dataset were divided into high RAE1 mRNA expression and low RAE1 mRNA expression groups using the minimum P‐value approach.22 Associations between variables were tested with the Mann Whitney U test, Student’s t test, or Fisher’s exact test. Overall survival (OS) curves were plotted according to the Kaplan‐Meier method and compared using the log‐rank test. Univariate and multivariate analyses were carried out using the Cox proportional hazards model to identify independent variables predictive of OS. Statistical analyses were performed using JMP Pro 14 software (SAS Institute) and R v3.6.3 (The R Foundation for Statistical Computing). Statistical significance was set at P < .05.
3. RESULTS
3.1. Ribonucleic acid export 1 potentially promotes tumor progression on Ch.20q in colorectal cancer
First, to identify a novel potential gene that facilitates tumor growth in CRC, we performed bioinformatics analysis using a dataset from TCGA. The copy numbers of certain chromosomal arms, such as 7p, 7q, 13p, 13q, and 20q, were frequently altered in CRC (Figure 1A). Furthermore, this event is spatiotemporally shared in CRC development as we have previously reported.7, 8 Thus, we attempted to identify novel potential genes that accelerate tumor development located on Ch.20q. We focused on RAE1 as a microtubule‐regulating gene using the dataset from TCGA through the screening parameters described in the Materials and Methods (Figure S1).
FIGURE 1.

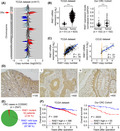
RAE1 is a gene that potentially promotes tumor progression. A, DNA copy number variations in chromosomal arms in 617 colorectal cancer (CRC) tissues using data from The Cancer Genome Atlas (TCGA). B, RAE1 mRNA expression in CRC tissues and normal colon tissues in TCGA dataset and our CRC cohort. ***P < .005. C, Correlation between DNA copy number and mRNA expression of RAE1 in TCGA dataset and Cancer Cell Line Encyclopedia (CCLE) dataset. R is the Pearson correlation coefficient. D, Immunohistochemical staining for RAE1 in CRC tissues and normal tissues. N, normal tissue; T, tumor tissue. E, Pie chart of RAE1 mutation distribution in CRC cases of the Catalogue of Somatic Mutations in Cancer (COSMIC) database (n = 2547). F, Kaplan‐Meier overall survival curves of CRC patients according to RAE1 mRNA expression in TCGA dataset (n = 597), our CRC cohort (n = 102)
Next, RT‐qPCR was used to compare RAE1 mRNA expression in tumor tissues and normal colon tissues in 102 CRC patients in our dataset. RAE1 mRNA expression was significantly higher in CRC tissues compared to normal colon tissues, as well as in the dataset from TCGA (P < .005) (Figure 1B). Increased DNA copy numbers of RAE1 (log2 copy number ratios > .1) were observed in 465/611 (76.1%) of the CRC tissues in the dataset from TCGA. Copy numbers of RAE1 were positively correlated with RAE1 mRNA expression in the dataset from TCGA (R = .78, P < .001) and the CRC cell line dataset (Cancer Cell Line Encyclopedia) (R = .77, P < .001) (Figure 1C). Immunohistochemical analysis showed staining for RAE1 in tumor cells and only weak to moderate staining in non–cancerous colon cells (Figure 1D). Magnified images showed that RAE1 immunostaining was localized within the cytoplasm and the cell membrane of tumor cells, and the cell membrane was highlighted more strongly in tumor cells than in normal cells. The frequency of mutations in RAE1 was only 2.0% in the COSMIC database (Figure 1E).
Collectively, these results suggest that RAE1 is a gene that potentially promotes tumor progression induced by genomic amplification. Furthermore, the data indicate that the amplification of RAE1 on Ch.20q is a fundamental and predominant event in CRC tumorigenesis and/or tumor progression.
3.2. Clinicopathological and prognostic significance of RAE1 mRNA expression in colorectal cancer patients
We examined the association between RAE1 mRNA expression and clinicopathological factors in CRC patients from our hospital, but there was no significant association between RAE1 mRNA expression and clinicopathological features, probably due to the limited sample size (Table 1A). In contrast, in the dataset from TCGA, increased RAE1 mRNA expression was correlated with distant metastasis (P < .05) in the pathological, malignant CRC phenotype (Table 1B).
TABLE 1.
Correlation between RAE1 mRNA expression of tumor tissues and clinicopathological factors
| (A) CRC patients in this study | |||
|---|---|---|---|
| Variable | High expression (n = 55) | Low expression (n = 47) | P‐value |
| Age (y) | |||
| Mean ± SD | 66.4 ± 10.7 | 66.8 ± 10.7 | .66 |
| Gender | |||
| Male | 37 | 26 | .30 |
| Female | 18 | 21 | |
| Tumor size (cm) | |||
| <3 | 13 | 11 | 1.00 |
| ≧3 | 42 | 36 | |
| Histology | |||
| Well/mod | 49 | 44 | .65 |
| Poorly | 6 | 3 | |
| T stage | |||
| 1,2 | 19 | 13 | .59 |
| 3,4 | 36 | 34 | |
| Lymphatic invasion | |||
| − | 34 | 25 | .50 |
| + | 21 | 22 | |
| Vascular invasion | |||
| − | 42 | 37 | .96 |
| + | 13 | 10 | |
| Lymph node metastasis | |||
| − | 26 | 28 | .29 |
| + | 29 | 19 | |
| Distant metastasis | |||
| − | 46 | 43 | .37 |
| + | 9 | 4 | |
| (B) CRC patients in TCGA dataset | |||
|---|---|---|---|
| Variable | High expression (n = 386) | Low expression (n = 211) | P‐value |
| Age (y) | |||
| Mean ± SD | 66.1 ± 12.1 | 66.0 ± 13.8 | .97 |
| Gender | |||
| Male | 215 | 107 | .26 |
| Female | 171 | 104 | |
| T stage | |||
| 1,2 | 302 | 170 | .60 |
| 3,4 | 83 | 41 | |
| Lymphatic invasion | |||
| − | 202 | 124 | .31 |
| + | 140 | 70 | |
| Vascular invasion | |||
| − | 252 | 141 | .28 |
| + | 87 | 38 | |
| Lymph node metastasis | |||
| − | 206 | 131 | .057 |
| + | 177 | 80 | |
| Distant metastasis | |||
| − | 282 | 161 | <.05 |
| + | 65 | 19 | |
Abbreviation: CRC, colorectal cancer.
Next, we assessed the prognostic and clinical significance of RAE1 mRNA expression in CRC. First, we evaluated the survival rates according to RAE1 mRNA expression in patients with CRC. The overall survival rate in patients in the high RAE1 mRNA expression group was significantly lower than that in patients in the low expression group, both in TCGA and our CRC dataset (Figure 1F). Furthermore, multivariate Cox regression analysis showed that high RAE1 mRNA expression was an independent poor prognostic factor in our CRC dataset (HR = 8.61, 95% CI = 2.41‐30.7, P < .001) (Table 2).
TABLE 2.
Univariate and multivariate analyses of clinicopathological factors affecting overall survival in our CRC patients
| Variables | HR | Univariate (95% CI) | P‐value | HR | Multivariate (95% CI) | P‐value |
|---|---|---|---|---|---|---|
| Age (≥65/<65 y) | 1.96 | .87‐4.45 | .10 | |||
| Gender (male/female) | 2.56 | .95‐6.91 | <.05 | |||
| Tumor size (cm) (≥3/<3) | 4.54 | 1.06‐19.42 | <.05 | 1.64 | .33‐8.12 | .99 |
| Histological type (por, muc/well, mod) | 4.36 | 1.47‐12.92 | <.01 | 1.95 | .48‐7.87 | .35 |
| T stage (3, 4/1, 2) | 6.20 | 1.45‐26.40 | <.05 | 3.48 | .69‐17.62 | .13 |
| Lymphatic invasion (±) | 4.01 | 1.69‐9.51 | <.01 | |||
| Vascular invasion (±) | 4.80 | 2.11‐10.93 | <.01 | |||
| Lymph node metastasis (±) | 3.99 | 1.57‐10.14 | <.01 | 1.38 | .49‐3.88 | .54 |
| Distant metastasis (±) | 21.01 | 8.31‐53.12 | <.01 | 13.29 | 4.39‐40.28 | <.01 |
| RAE1 expression (±) | 3.94 | 1.47‐10.58 | <.05 | 6.02 | 1.80‐20.11 | <.01 |
CI, confidential interval; CRC, colorectal carcinoma; HR, hazard ratio; mod, moderately differentiated adenocarcinoma; muc, mucinous adenocarcinoma; por, poorly differentiated adenocarcinoma; well, well‐differentiated adenocarcinoma.
3.3. RAE1 is a potential therapeutic target in colorectal cancer
To investigate whether RAE1 could be a therapeutic target, we performed a comprehensive analysis of 276 genes encoding microtubule‐regulating proteins19, 23, 24, 25, 26, 27, 28, 29, 30, 31 using TCGA data and evaluated their potential efficacy as a therapeutic target. We calculated the fold change in mRNA expression of each gene in tumor tissues compared to normal tissues, the correlation between mRNA expression and DNA copy number, and whether the high expression group was associated with poor prognosis. Notably, among the genes whose expression in tumor tissues was 2‐fold higher than in normal tissues, RAE1 was identified as the gene most strongly affected by copy number amplification and the only gene where high mRNA expression in tumor tissues was associated with poor prognosis (Figure 2A). In contrast, AURKA, AURKB, Kinesin Family Member 11 (KIF11), and Polo‐like kinase 1 (PLK1), which are currently being targeted with chemotherapeutic drugs,32, 33, 34 had lower correlations between mRNA expression and copy number than RAE1 and no significant effect on the survival of CRC patients in the dataset from TCGA (Figure 2B, C, D).
FIGURE 2.

RAE1 is a potential therapeutic target in colorectal cancer (CRC). A, Statistical evaluation of 276 genes coding microtubule‐associated proteins and mitotic kinases using The Cancer Genome Atlas (TCGA) dataset. Each gene is represented as a dot. The horizontal and vertical coordinates indicate the log2‐fold change in mRNA expression in tumor tissues compared to normal tissues and the Pearson correlation coefficient between the copy number and mRNA expression. Red plots indicate genes in which the high expression group is associated with poor prognosis (P < .05). B, mRNA expression of RAE1, AURKA, AURKB, PLK1, and KIF11 in paired CRC tissues and normal colon tissues in TCGA dataset. C, Correlation between DNA copy number and mRNA expression of AURKA, AURKB, PLK1, and KIF11 in TCGA dataset. D, Kaplan‐Meier overall survival curves for CRC patients according to mRNA expression of AURKA, AURKB, PLK1 and KIF11 in TCGA dataset (n = 597)
These observations provide evidence that RAE1 is a promising therapeutic target among microtubule‐regulating genes.
3.4. RAE1 expression is negatively correlated with the apoptosis pathway
To explore oncogenic pathways correlated with RAE1 expression in CRC, we performed GSEA using a dataset from TCGA. Notably, RAE1 expression was negatively correlated with the expression of gene sets involved in the apoptosis pathway (Figure 3A).
FIGURE 3.

RAE1 knockdown induces apoptosis and prevents cell cycle progression in colorectal cancer (CRC) cells. A, Gene set enrichment analysis (GSEA) using The Cancer Genome Atlas (TCGA) dataset. FDR, false discovery rate; NES, normalized enrichment score. B, Protein expression using western blot analysis for RAE1, cleaved PARP, and MCM2 in RAE1‐knockdown cells and control cells. β‐actin was used as the loading control for relative protein quantification. The normalized intensities of each protein are shown. C, Protein expression using western blot analysis for RAE1 and cleaved PARP in the rescued cells. D, Left, Apoptosis assays of CACO2 (upper) and SW480 (lower) cell lines transfected with the indicated siRNA. Right, Quantification of the cell distributions in apoptosis (Annexin V‐FITC+). **P < .01; ***P < .005. E, Cell cycle analysis by flow cytometry after re–supplementation with FBS in control cells and RAE1‐knockdown cells. *P < .05; **P < .01; ***P < .005. F, Western blot analysis of RAE1 and p21 in control and RAE1‐knockdown cells
3.5. Knockdown of RAE1 induced apoptosis in colorectal cancer cell lines
Next, we performed western blot experiments to investigate whether RAE1 knockdown could permit apoptosis. RAE1‐knockdown cells showed increased levels of cleaved poly (ADP‐ribose) polymerase (PARP), a molecular marker of apoptosis, compared with control cells (Figure 3B). Furthermore, the rescue of RAE1 expression decreased cleaved PARP levels (Figure 3C). MCM2 is a molecular marker of proliferation. RAE1‐knockdown cells showed increased levels of MSM2, possibly as a result of compensatory behavior. Next, an apoptosis assay with siRAE1 transfected SW480 and CACO2 cells using FACS was conducted. Knockdown of RAE1 resulted in an increased percentage in the incidence of apoptosis (Figure 3D). These findings indicated that knockdown of RAE1 could slightly induce apoptosis in CRC cell lines.
3.6. Knockdown of RAE1 prevented cell cycle progression from the G1 to S phase in colorectal cancer cell lines
To investigate whether RAE1 knockdown prevents cell cycle progression, we performed cell cycle analysis in SW480 cells with stable knockdown of RAE1. Compared with shControl, shRAE1 resulted in a lower proportion of cells in S phase at 6 and 12 hours after re–stimulation by changing the medium to that containing 10% FBS. These results indicated that RAE1 knockdown prevents G1/S transition. In addition, we performed western blot analysis to investigate whether RAE1 knockdown prevents G1/S transition in CRC cells. SW480 cells with stable knockdown of RAE1 showed increased expression of p21, which plays a crucial role in repairing DNA damage at the G1/S cell cycle checkpoint. Taken together, these results suggest that RAE1 knockdown halts cell cycle progression from the G1 to S phase.
3.7. RAE1 promotes colorectal cancer tumor growth in vitro and in vivo
Changes in the proliferation of CRC cell lines by RAE1 knockdown or overexpression were examined using MTT and colony formation assays. We used SW480 and CACO2 cell lines for knockdown analysis because of their high expression levels of RAE1. RKO cells were used for overexpression analysis because of their low expression levels of RAE1 (Figure S2A). Knockdown of RAE1 by both siRNA and shRNA treatment decreased the expression of RAE1 (Figures 4A, S2B). RAE1 knockdown suppressed cell proliferation (Figures 4B, C, S2C, D). Rescue experiments were performed to eliminate the possibility that the decrease in proliferation ability was due to shRNA‐mediated off‐target effects. RAE1 stable knockdown cells were transfected with a vector expressing RAE1 and western blot analysis confirmed that RAE1 expression was rescued in RAE1 knockdown cells (Figure 4D). Rescue of RAE1 expression also enhanced the proliferative capacity of these cells (Figure 4E). Next, we established RKO cells stably overexpressing RAE1 (Figure 4F). RAE1 overexpression increased cell proliferation (Figure 4G, H). MTT assays showed slight differences in cell proliferation compared to colony formation assays, as shown in Figure 4B, E and G. This may be because the proliferation ability was evaluated in a short time compared to colony formation assays.
FIGURE 4.
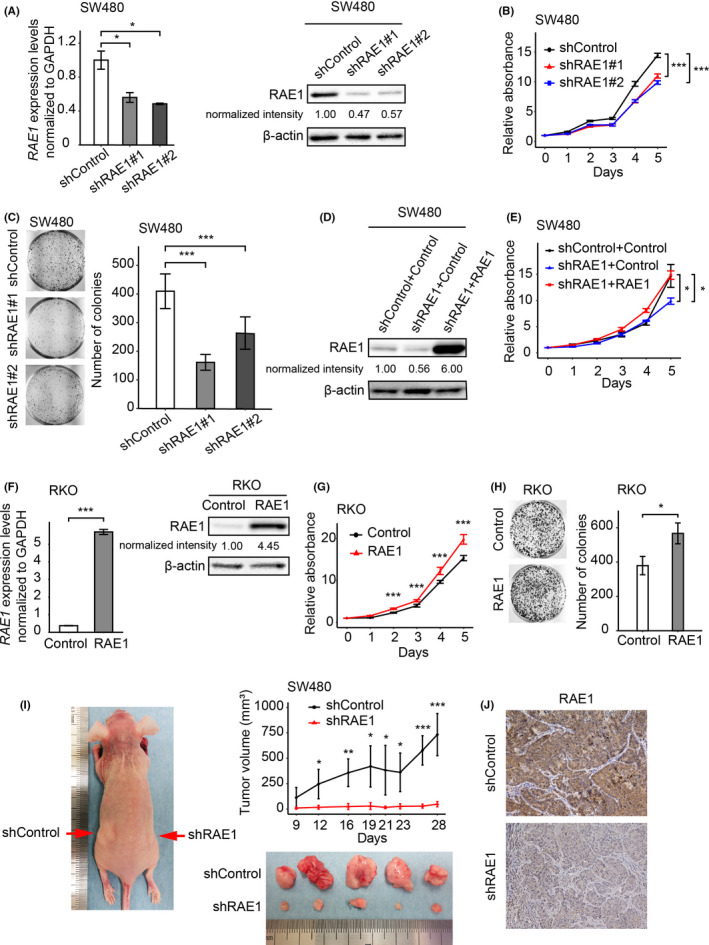
RAE1 expression is associated with cell growth of colorectal carcinoma. A, RAE1 mRNA expression using RT‐quantitative PCR (RT‐qPCR), and protein expression using western blot analysis in RAE1‐knockdown cells and control cells. *P < .05. B, MTT assays using RAE1‐knockdown cells. ***P < .005. C, Colony formation assays using RAE1‐knockdown cells. ***P < .005. D, RAE1 protein levels in indicated cells. RAE1 protein expression using western blot analysis of the rescued cells. E, MTT assay using indicated cells. *P < .05. F, RAE1 mRNA expression using RT‐qPCR and protein expression using western blot analysis in RAE1‐overexpressing cells and control cells. ***P < .005. G, MTT assay using RAE1‐overexpressing cells. ***P < .005. H, Colony formation assay using RAE1‐overexpressing cells. *P < .05 I, In vivo analysis using a xenograft model. Tumor size in RAE1‐knockdown cells and control cells. *P < .05; **P < .01; ***P < .005. J, Immunohistochemical staining for RAE1 in tumor tissues from control and RAE1‐knockdown cells. Original magnification, ×400
We conducted in vivo analysis using SW480 cells with stable knockdown of RAE1. RAE1 knockdown significantly decreased the volume of CRC tumors in xenograft mice models (Figure 4I). Immunohistochemical analysis of xenograft tumors showed that tumor tissues from SW480 cells with stable knockdown of RAE1 displayed weaker RAE1 staining than controls (Figure 4J).
Taken together, these results suggest that RAE1 promotes the growth of CRC tumors, in part by inhibiting apoptosis and promoting cell cycle progression.
3.8. RAE1 overexpression stabilized spindle bipolarity
RAE1 is a critical requirement for normal spindle formation in mitosis such that RAE1 depletion causes multipolar spindle cells.16 In addition, multipolar spindles in cancer cells lead to failure of mitosis and cell apoptosis.35 Thus, we hypothesized that RAE1 overexpression inhibits cell apoptosis by stabilizing bipolar spindles in CRC cells. We conducted immunofluorescent staining of spindles and centrosomes with anti–α‐tubulin and anti–pericentrin antibodies to investigate the impact of RAE1 expression on spindle formation (Figure 5A), quantifying the percentage of multipolar spindle cells. In line with previous studies,16 knockdown of RAE1 significantly increased multipolar spindle cells in CRC cells (Figure 5B).
FIGURE 5.

RAE1 is associated with spindle bipolarity in mitosis. A, Immunofluorescence photographs of CACO2 cells stained with anti–α‐tubulin (green) and anti–pericentrin (red) antibodies. Nuclei are stained with DAPI (blue). B, Quantification of mitotic‐defective cells with multipolar spindles in RAE1‐knockdown cells. *P < .05; **P < .01. C, Immunofluorescence photographs of control cells (left) or RAE1‐overexpressing cells (right) treated with 2 nmol/L paclitaxel before staining. D, Quantification of mitotic‐defective cells with multipolar spindles in indicated cells. **P < .01
Low concentrations of paclitaxel can arrest multipolar spindle cells in mitosis.36 Thus, we quantified the percentage of multipolar spindle cells formed upon paclitaxel treatment using RKO cells stably overexpressing RAE1. RAE1 overexpression slightly inhibited the formation of multipolar spindles (4%) and remarkably decreased the proportion of multipolar cells, from 28% to 9%, in the presence of low dose paclitaxel (Figure 5C, D). These results suggest that RAE1 overexpression can stabilize spindle bipolarity in CRC cells.
3.9. RAE1 overexpression induced chemoresistance
To determine whether RAE1 overexpression inhibited drug‑induced apoptosis, we performed apoptosis assays using CRC cells after treatment with anticancer drugs. RKO cells stably overexpressing RAE1 underwent significantly less apoptosis upon paclitaxel treatment, as well as actinomycin D treatment (Figure 6A, B). Next, we conducted western blot analysis using RKO cells stably overexpressing RAE1. We did not observe a significant difference in cleaved PARP levels between RAE1‐overexpressing RKO cells and control cells. In contrast, overexpression of RAE1 significantly decreased cleaved PARP levels after treatment with paclitaxel, which is likely explained by the inhibition of drug‐induced apoptosis (Figure 6C).
FIGURE 6.
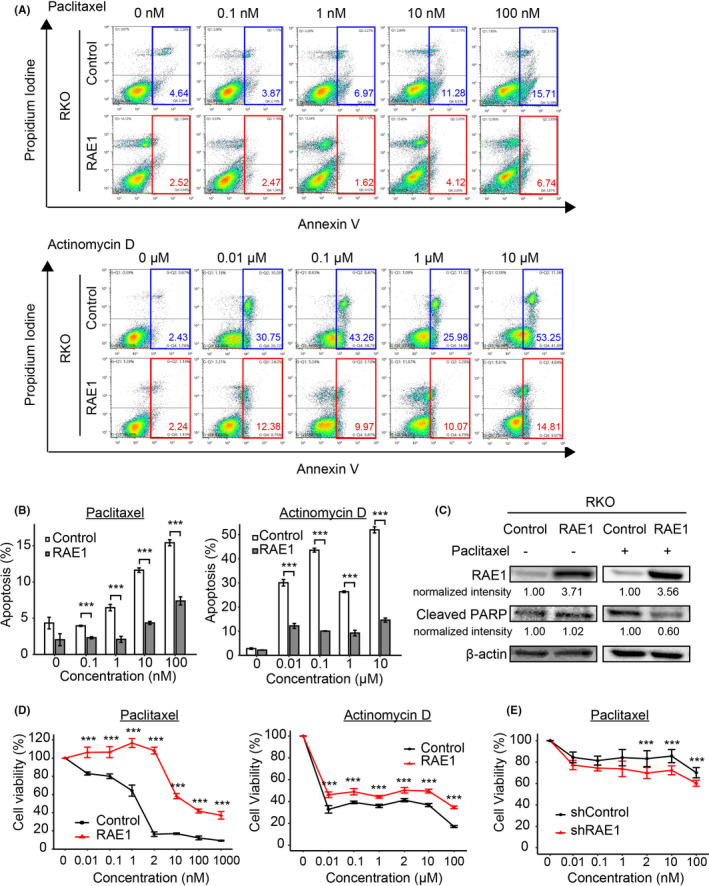
RAE1 induces chemoresistance. A, Apoptosis assays using RAE1‐overexpressing cells and control cells. Cells were cultured in paclitaxel (upper) or actinomycin D (lower) for 24 h with the indicated final concentration. B, Quantification of cell distribution in apoptosis in indicated cells (Annexin V‐FITC+). *P < .05; **P < .01; ***P < .005. C, Western blot analysis for RAE1 and cleaved PARP in control cells or RAE1‐overexpressing cells treated with 2 nmol/L drug (paclitaxel +) or no drug (paclitaxel −). D, Sensitivity of RAE1‐overexpressed cells to paclitaxel (left) or actinomycin D (right). Cell viability was measured by MTT assays in RAE1‐overexpressing cells and control cells treated with the indicated final concentrations of paclitaxel or actinomycin D for 24 h. ***P < .005. E, MTT assay was used to assess the viability of RAE1‐knockdown and control cells treated with the same final concentrations of paclitaxel for 24 h. ***P < .005
To examine the relationship between RAE1 expression and sensitivity to anticancer drugs, RKO cells stably overexpressing RAE1 were treated with different concentrations of paclitaxel or actinomycin D. As shown in Figure 6D, RKO cells stably overexpressing RAE1 were less sensitive to both paclitaxel and actinomycin D. Furthermore, knockdown of RAE1 significantly increased sensitivity to paclitaxel (Figure 6E). These results suggest that RAE1 overexpression could promote resistance to chemotherapy through inhibition of drug‐induced apoptosis of CRC cells.
3.10. RAE1 is overexpressed in various cancers
Expression of RAE1 mRNA in various cancer types and normal tissues was compared using the dataset from TCGA. RAE1 expression was higher in 13 different cancer tissues, as well as in CRC, compared to the expression levels in the respective non–cancerous tissues (Figure 7A, B). Furthermore, the high RAE1 expression group showed poor prognosis in various types of cancer (Figure 7C). These results indicate that RAE1 may be a common gene that facilitates tumor growth in various cancers.
FIGURE 7.

Pan‐cancer analysis of RAE1. A, Pan‐cancer analysis of RAE1 expression in The Cancer Genome Atlas (TCGA) dataset. The log2‐fold change in RAE1 mRNA expression in tumor tissues compared to that in normal tissues and the −log10 false discovery rate (FDR) in each tumor type are shown. B, The mRNA expression of RAE1 in various cancers. ***P < .005. C, Kaplan‐Meier overall survival curves showing that RAE1 is positively correlated with poor prognosis in the indicated TCGA datasets. BLCA, bladder urothelial carcinoma; BRCA, breast invasive carcinoma; COADREAD, colon adenocarcinoma and rectal adenocarcinoma; ESCA, esophageal carcinoma; HNSC, head and neck squamous cell carcinoma; KIRC, kidney renal clear cell carcinoma; KIRP, kidney renal papillary cell carcinoma; LIHC, liver hepatocellular carcinoma; LUAD, lung adenocarcinoma; LUSC, lung squamous cell carcinoma; OV, ovarian serous cystadenocarcinoma; PAAD, pancreatic adenocarcinoma; PRAD, prostate adenocarcinoma; STAD, stomach adenocarcinoma; THCA, thyroid carcinoma; UCEC, uterine corpus endometrial carcinoma
4. DISCUSSION
In this study, through a bioinformatic analysis, we identified RAE1 as a novel gene that accelerates tumor development in CRC. We demonstrated that high expression of RAE1 was associated with distant metastasis and constituted an independent poor prognostic factor. Moreover, we found that RAE1 promoted tumor growth and induced chemoresistance of CRC cells in part by inhibiting apoptosis and promoting cell cycle progression, presumably by stabilizing spindle bipolarity (Figure S3). To the best of our knowledge, this is the first study to explore the function of RAE1 as a gene that facilitates tumor growth and as a prognostic biomarker of CRC.
The overexpression of RAE1 due to copy number amplification of Ch.20q is a universal event present in all CRC cells, as we have reported previously.7, 8 In addition, overexpression of RAE1 and its consequent significant effect on survival has been observed in various types of cancers, including CRC. Therefore, RAE1 should be more intensely explored as a potential therapeutic target in various human cancers. This approach might overcome the therapeutic resistance conferred by tumor heterogeneity. In addition, amplification of RAE1 might be a feasible clinical molecular target for genomic medicines based on the precision medicine initiative.
New therapeutic agents that target spindle‐regulatory proteins, such as KIF11, AURKA, AURKB, and PLK1,32, 33, 34 are being developed to inhibit the function of the mitotic spindle without affecting microtubule function in non–dividing cells. These agents are believed to induce cancer‐specific antitumor activities without serious side effects. However, their efficacies have not been comparable to those of vinca alkaloids or paclitaxel in clinical studies.37 One possible explanation for this in vivo inefficiency is the complexity of human cancers attributable to intratumor heterogeneity.23, 38 Interestingly, our comprehensive analysis using a dataset from TCGA showed that RAE1 had a larger fold change of mRNA expression level between tumor tissues and normal tissues and a more significant effect on the survival of patients with CRC than these molecules. These findings suggest that RAE1 could be a more promising therapeutic target than these genes.
In mitosis, RAE1 binds to microtubules, structural maintenance of chromosomes subunit 1 (SMC1), and the nuclear mitotic apparatus protein (NuMA).39 RAE1 increases the microtubule crosslinking valency of NuMA and stabilizes microtubules at their minus ends by interacting with these molecules.16 In contrast, RAE1 depletion induces a mitotic defect, resulting in multipolar spindle cells16 and aberrant multinucleated cells that eventually undergo apoptotic death.40, 41 Moreover, CRC cells with multipolar spindles were arrested at G0/G1.42 Consistent with these data, our results, including cell cycle analysis, provide evidence that RAE1 knockdown leads to cells with multipolar spindles, and some of these cells enter apoptosis, whereas others survive but do not proceed from the G1 to S phase. We also demonstrated that RAE1 overexpression inhibited apoptosis by stabilizing spindle bipolarity in CRC cells. However, our results appeared to show small differences in apoptosis and cell cycle progression between RAE1 knockdown cells and control cells. Further study is required to clarify the other mechanisms for acceleration of tumor growth by RAE1.
We found that RAE1 contributed to the chemoresistance of CRC cells. Low concentrations of paclitaxel suppress the rate at which microtubules grow and shrink without substantially increasing the microtubule polymer mass, thereby arresting cells with multipolar spindles.36 We observed that RAE1 overexpression decreased paclitaxel‐induced mitotic defects. This result may explain why RAE1 can induce resistance to paclitaxel; that is, by increasing the stability of bipolar spindle cells. Furthermore, our results showed that RAE1 overexpression induced resistance to paclitaxel as well as actinomycin D, which does not target the mitotic spindle. These results suggest that RAE1 overexpression may inhibit non–specific apoptosis induced by other anticancer drugs and lead to chemoresistance. Taxanes are not generally used as the standard of care due to their low antitumor activity in CRC.43, 44 However, our findings suggest that focusing on RAE1 could expand the mitotic spindle as a potential therapeutic target and lead to new cancer chemotherapeutic strategies.
In conclusion, we have identified a novel gene that promotes tumor progression, RAE1, on Ch.20q in part by inhibiting apoptosis and promoting cell cycle progression, possibly by stabilizing spindle bipolarity and, consequently, facilitating CRC tumor growth. Furthermore, we provide clinical and biological evidence that the mitotic checkpoint regulator RAE1 could be a therapeutic target to overcome therapeutic resistance of CRC. Recently, as a component of the nuclear pore complex, RAE1 has been reported to control MAPK signaling45 and to interact with ORF6 in SARS‐COV‐2/COVID‐19.46, 47 As a component of the nuclear pore complex, RAE1 may play several important roles in mRNA export and signaling activation, not only in cancer cells but also in normal cells and viruses.
DISCLOSURE
The authors have no conflict of interest.
Supporting information
Figure S1
Figure S2
Figure S3
ACKNOWLEDGMENTS
This research used the super‐computing resource provided by the Human Genome Center, The Institute of Medical Science, The University of Tokyo (http://sc.hgc.jp/shirokane.html). We thank K. Oda, M. Kasagi, M. Sakuma, T. Fukuda, M. Murakami, N. Mishima, T. Kawano, M. Oshiumi, and M. Utou for their technical assistance and Dr Tyler Lahusen for helpful comments and English proofreading. This work was supported in part by the following grants and foundations: Japan Society for the Promotion of Science (JSPS) Grant‐in‐Aid for Science Research (grant numbers 19K09176, 19H03715, 20H05039, and 20K08930); OITA Cancer Research Foundation; AMED under Grant Number JP20cm0106475h0001; and Takeda Science Foundation.
Kobayashi Y, Masuda T, Fujii A, et al. Mitotic checkpoint regulator RAE1 promotes tumor growth in colorectal cancer. Cancer Sci. 2021;112:3173–3189. 10.1111/cas.14969
Funding information
OITA Cancer Research Foundation (grant number: JP20cm0106475h0001); Takeda Science Foundation; Japan Agency for Medical Research and Development (grant number: JP20cm0106475h0001); Japan Society for the Promotion of Science (grant number: 19H03715, 19K09176, 20H05039, 20K08930).
REFERENCES
- 1.Jordan MA, Wilson L. Microtubules as a target for anticancer drugs. Nat Rev Cancer. 2004;4:253‐265. [DOI] [PubMed] [Google Scholar]
- 2.Diao PC, Li Q, Hu MJ, et al. Synthesis and biological evaluation of novel indole‐pyrimidine hybrids bearing morpholine and thiomorpholine moieties. Eur J Med Chem. 2017;134:110‐118. [DOI] [PubMed] [Google Scholar]
- 3.Gordon MB, Howard L, Compton DA. Chromosome movement in mitosis requires microtubule anchorage at spindle poles. J Cell Biol. 2001;152:425‐434. [DOI] [PMC free article] [PubMed] [Google Scholar]
- 4.Spanò V, Barreca M, Rocca R, et al. Insight on [1,3]thiazolo[4,5‐e]isoindoles as tubulin polymerization inhibitors. Eur J Med Chem. 2020;212:113122. [DOI] [PubMed] [Google Scholar]
- 5.Subba Rao AV, Swapna K, Shaik SP, et al. Synthesis and biological evaluation of cis‐restricted triazole/tetrazole mimics of combretastatin‐benzothiazole hybrids as tubulin polymerization inhibitors and apoptosis inducers. Bioorg Med Chem. 2017;25:977‐999. [DOI] [PubMed] [Google Scholar]
- 6.Davoli T, Xu AW, Mengwasser KE, et al. Cumulative haploinsufficiency and triplosensitivity drive aneuploidy patterns and shape the cancer genome. Cell. 2013;155:948‐962. [DOI] [PMC free article] [PubMed] [Google Scholar]
- 7.Uchi R, Takahashi Y, Niida A, et al. Integrated multiregional analysis proposing a new model of colorectal cancer evolution. PLoS Genet. 2016;12:e1005778. [DOI] [PMC free article] [PubMed] [Google Scholar]
- 8.Saito T, Niida A, Uchi R, et al. A temporal shift of the evolutionary principle shaping intratumor heterogeneity in colorectal cancer. Nat Commun. 2018;9:2884. [DOI] [PMC free article] [PubMed] [Google Scholar]
- 9.Kouyama Y, Masuda T, Fujii A, et al. Oncogenic splicing abnormalities induced by DEAD‐Box Helicase 56 amplification in colorectal cancer. Cancer Sci. 2019;110:3132‐3144. [DOI] [PMC free article] [PubMed] [Google Scholar]
- 10.Sato K, Masuda T, Hu Q, et al. Novel oncogene 5MP1 reprograms c‐Myc translation initiation to drive malignant phenotypes in colorectal cancer. EBioMedicine. 2019;44:387‐402. [DOI] [PMC free article] [PubMed] [Google Scholar]
- 11.Nambara S, Masuda T, Kobayashi Y, et al. GTF2IRD1 on chromosome 7 is a novel oncogene regulating the tumor‐suppressor gene TGFβR2 in colorectal cancer. Cancer Sci. 2020;111:343‐355. [DOI] [PMC free article] [PubMed] [Google Scholar]
- 12.Sato K, Masuda T, Hu Q, et al. Phosphoserine phosphatase is a novel prognostic biomarker on chromosome 7 in colorectal cancer. Anticancer Res. 2017;37:2365‐2371. [DOI] [PubMed] [Google Scholar]
- 13.Shimizu D, Masuda T, Sato K, et al. CRMP5‐associated GTPase (CRAG) Ιs a candidate driver gene for colorectal cancer carcinogenesis. Anticancer Res. 2019;39:99‐106. [DOI] [PubMed] [Google Scholar]
- 14.Blower MD, Nachury M, Heald R, Weis K. A Rae1‐containing ribonucleoprotein complex is required for mitotic spindle assembly. Cell. 2005;121:223‐234. [DOI] [PubMed] [Google Scholar]
- 15.Kraemer D, Dresbach T, Drenckhahn D. Mrnp41 (Rae 1p) associates with microtubules in HeLa cells and in neurons. Eur J Cell Biol. 2001;80:733‐740. [DOI] [PubMed] [Google Scholar]
- 16.Wong RW, Blobel G, Coutavas E. Rae1 interaction with NuMA is required for bipolar spindle formation. Proc Natl Acad Sci USA. 2006;103:19783‐19787. [DOI] [PMC free article] [PubMed] [Google Scholar]
- 17.Ueda M, Iguchi T, Nambara S, et al. Overexpression of transcription termination factor 1 is associated with a poor prognosis in patients with colorectal cancer. Ann Surg Oncol. 2015;22(Suppl 3):S1490‐S1498. [DOI] [PubMed] [Google Scholar]
- 18.Kurashige J, Hasegawa T, Niida A, et al. Integrated molecular profiling of human gastric cancer identifies DDR2 as a potential regulator of peritoneal dissemination. Sci Rep. 2016;6:22371. [DOI] [PMC free article] [PubMed] [Google Scholar]
- 19.Rodrigues‐Ferreira S, Nehlig A, Moindjie H, et al. Improving breast cancer sensitivity to paclitaxel by increasing aneuploidy. Proc Natl Acad Sci USA. 2019;116:23691‐23697. [DOI] [PMC free article] [PubMed] [Google Scholar]
- 20.Otsu H, Iimori M, Ando K, et al. Gastric cancer patients with high PLK1 expression and DNA aneuploidy correlate with poor prognosis. Oncology. 2016;91:31‐40. [DOI] [PubMed] [Google Scholar]
- 21.Subramanian A, Tamayo P, Mootha VK, et al. Gene set enrichment analysis: a knowledge‐based approach for interpreting genome‐wide expression profiles. Proc Natl Acad Sci USA. 2005;102:15545‐15550. [DOI] [PMC free article] [PubMed] [Google Scholar]
- 22.Mizuno H, Kitada K, Nakai K, Sarai A. PrognoScan: a new database for meta‐analysis of the prognostic value of genes. BMC Med Genomics. 2009;2:18. [DOI] [PMC free article] [PubMed] [Google Scholar]
- 23.Yao R, Kondoh Y, Natsume Y, et al. A small compound targeting TACC3 revealed its different spatiotemporal contributions for spindle assembly in cancer cells. Oncogene. 2014;33:4242‐4252. [DOI] [PubMed] [Google Scholar]
- 24.Bandala‐Jacques A, Hernández‐Cruz IA, Castro‐Hernández C, et al. Prognostic significance of the MAD1L1 1673 G: a polymorphism in ovarian adenocarcinomas. Rev Invest Clin. 2020;72(6):372–379. [DOI] [PubMed] [Google Scholar]
- 25.Koyuncu D, Sharma U, Goka ET, Lippman ME. Spindle assembly checkpoint gene BUB1B is essential in breast cancer cell survival. Breast Cancer Res Treat. 2021;185:331‐341. [DOI] [PubMed] [Google Scholar]
- 26.Huang H, Yang Y, Zhang W, Liu X, Yang G. TTK regulates proliferation and apoptosis of gastric cancer cells through the Akt‐mTOR pathway. FEBS Open Bio. 2020;10:1542‐1549. [DOI] [PMC free article] [PubMed] [Google Scholar]
- 27.Lei H, Wang K, Jiang T, et al. KIAA0101 and UbcH10 interact to regulate non–small cell lung cancer cell proliferation by disrupting the function of the spindle assembly checkpoint. BMC Cancer. 2020;20:957. [DOI] [PMC free article] [PubMed] [Google Scholar]
- 28.Garrido D, Bourouh M, Bonneil É, Thibault P, Swan A, Archambault V. Cyclin B3 activates the anaphase‐promoting complex/cyclosome in meiosis and mitosis. PLoS Genet. 2020;16:e1009184. [DOI] [PMC free article] [PubMed] [Google Scholar]
- 29.Kuijt TEF, Lambers MLA, Weterings S, et al. A biosensor for the mitotic kinase MPS1 reveals spatiotemporal activity dynamics and regulation. Curr Biol. 2020;30:3862‐3870.e6. [DOI] [PubMed] [Google Scholar]
- 30.Fang CT, Kuo HH, Hsu SC, Yih LH. HSP70 regulates Eg5 distribution within the mitotic spindle and modulates the cytotoxicity of Eg5 inhibitors. Cell Death Dis. 2020;11:715. [DOI] [PMC free article] [PubMed] [Google Scholar]
- 31.Busacca S, O’Regan L, Singh A, et al. BRCA1/MAD2L1 deficiency disrupts the spindle assembly checkpoint to confer vinorelbine resistance in mesothelioma. Mol Cancer Ther. 2021;20:379‐388. [DOI] [PubMed] [Google Scholar]
- 32.Keen N, Taylor S. Aurora‐kinase inhibitors as anticancer agents. Nat Rev Cancer. 2004;4:927‐936. [DOI] [PubMed] [Google Scholar]
- 33.Strebhardt K, Ullrich A. Targeting polo‐like kinase 1 for cancer therapy. Nat Rev Cancer. 2006;6:321‐330. [DOI] [PubMed] [Google Scholar]
- 34.Jackson JR, Patrick DR, Dar MM, Huang PS. Targeted anti–mitotic therapies: can we improve on tubulin agents? Nat Rev Cancer. 2007;7:107‐117. [DOI] [PubMed] [Google Scholar]
- 35.Wang Y, Stear JH, Swain A, et al. Drug targeting the actin cytoskeleton potentiates the cytotoxicity of low dose vincristine by abrogating actin‐mediated repair of spindle defects. Mol Cancer Res. 2020;18:1074‐1087. [DOI] [PubMed] [Google Scholar]
- 36.White D, Honoré S, Hubert F. Exploring the effect of end‐binding proteins and microtubule targeting chemotherapy drugs on microtubule dynamic instability. J Theor Biol. 2017;429:18‐34. [DOI] [PubMed] [Google Scholar]
- 37.Harrison MR, Holen KD, Liu G. Beyond taxanes: a review of novel agents that target mitotic tubulin and microtubules, kinases, and kinesins. Clin Adv Hematol Oncol. 2009;7:54‐64. [PMC free article] [PubMed] [Google Scholar]
- 38.Yao R, Natsume Y, Saiki Y, et al. Disruption of Tacc3 function leads to in vivo tumor regression. Oncogene. 2012;31:135‐148. [DOI] [PubMed] [Google Scholar]
- 39.Wong RW, Blobel G. Cohesin subunit SMC1 associates with mitotic microtubules at the spindle pole. Proc Natl Acad Sci USA. 2008;105:15441‐15445. [DOI] [PMC free article] [PubMed] [Google Scholar]
- 40.Petry S. Mechanisms of mitotic spindle assembly. Annu Rev Biochem. 2016;85:659‐683. [DOI] [PMC free article] [PubMed] [Google Scholar]
- 41.Prosser SL, Pelletier L. Mitotic spindle assembly in animal cells: a fine balancing act. Nat Rev Mol Cell Biol. 2017;18:187‐201. [DOI] [PubMed] [Google Scholar]
- 42.Liu C, Wei J, Xu K, Sun X, Zhang H, Xiong C. CSE1L participates in regulating cell mitosis in human seminoma. Cell Prolif. 2019;52:e12549. [DOI] [PMC free article] [PubMed] [Google Scholar]
- 43.Ducreux M, Bennouna J, Adenis A, et al. Efficacy and safety of nab‐paclitaxel in patients with previously treated metastatic colorectal cancer: a phase II COLO‐001 trial. Cancer Chemother Pharmacol. 2017;79:9‐16. [DOI] [PubMed] [Google Scholar]
- 44.Pazdur R, Lassere Y, Soh LT, et al. Phase II trial of docetaxel (Taxotere) in metastatic colorectal carcinoma. Ann Oncol. 1994;5:468‐470. [DOI] [PubMed] [Google Scholar]
- 45.Satoh R, Hagihara K, Sugiura R. Rae1‐mediated nuclear export of Rnc1 is an important determinant in controlling MAPK signaling. Curr Genet. 2018;64:103‐108. [DOI] [PubMed] [Google Scholar]
- 46.Miorin L, Kehrer T, Sanchez‐Aparicio MT, et al. SARS‐CoV‐2 Orf6 hijacks Nup98 to block STAT nuclear import and antagonize interferon signaling. Proc Natl Acad Sci USA. 2020;117:28344‐28354. [DOI] [PMC free article] [PubMed] [Google Scholar]
- 47.Kato K, Ikliptikawati DK, Kobayashi A, et al. Overexpression of SARS‐CoV‐2 protein ORF6 dislocates RAE1 and NUP98 from the nuclear pore complex. Biochem Biophys Res Commun. 2021;536:59‐66. [DOI] [PMC free article] [PubMed] [Google Scholar]
Associated Data
This section collects any data citations, data availability statements, or supplementary materials included in this article.
Supplementary Materials
Figure S1
Figure S2
Figure S3