

Abstract
Moderate alcohol consumption is associated with increased plasma high-density lipoprotein (HDL)-cholesterol concentrations and reduced risk for cardiovascular disease. Plasma cholesteryl ester transfer activity (CETA) mediates the exchange of HDL-cholesteryl ester (CE) for the triacylglycerol (TAG) of very-low-density lipoproteins. We compared the effects of oral challenges of Alcohol, saturated fat (SAT), and (Alcohol + SAT) on plasma CETA, cholesterol, nonesterified fatty acids (NEFA), and TAG among normo-triglyceridemic (NTG) and mildly hypertriglyceridemic (HTG) volunteers having a range of plasma TAG concentrations. The major changes were (1) CETA increased more after ingestion of SAT and (Alcohol + SAT) in the HTG group versus the NTG group; (2) after all three challenges, elevation of plasma TAG concentration persisted longer in the HTG versus NTG group. Plasma cholesterol was not affected by the three dietary challenges, while Alcohol increased NEFA more in the HTG group than the NTG group. Plasma TAG best predicted plasma CETA, suggesting that intestinally derived lipoproteins are acceptors of HDL-CE. Unexpectedly, ingestion of (Alcohol + SAT) reduced the strength of the correlation between plasma TAG and CETA, that is the effects of (SAT and Alcohol) on plasma CETA are not synergistic nor additive but rather mutually suppressive. The alcohol-mediated inhibition of CE-transfer to chylomicrons maintains a higher plasma HDL-cholesterol concentration, which is athero-protective, although the suppressive metabolite underlying this correlation could be acetate, the terminal alcohol metabolite, other factors, including CETA inhibitors, are also likely important.
Keywords: Alcohol, Cholesteryl ester transfer, Dietary fat, Metabolism
Introduction
Increased plasma concentrations of high-density lipoprotein (HDL) cholesterol mediate about half the cardioprotective effects of alcohol (Gaziano et al., 1993; Pearson, 1996). However, alcohol elicits other lipid changes that are mechanistically linked to changes in plasma HDL and cardioprotection. Whereas plasma lecithin: cholesterol acyltransferase, cholesteryl ester transfer protein (CETP), and phospholipid transfer protein levels are not affected by regular alcohol consumption (Riemens et al., 1997), total turnover, and synthetic rates of very-low-density lipoprotein (VLDL)-triglyceride (TAG) are increased (Sane et al., 1984).
Alcohol ingestion before and during a meal increases plasma paraoxanase activity, which prevents low-density lipoprotein (LDL) oxidation, (van der Gaag et al., 1999) and decreases HDL-cholesteryl ester (CE) while increasing HDL-TAG and phospholipid (Hendriks et al., 1998). This effect is due, in part, to increased exchange of HDL-CE for TAG from apolipoprotein B (APOB)-containing lipoproteins (Van Tol et al., 1995). Acutely, alcohol increases plasma TAG concentration in normotriglyceridemic (NTG) (Pownall, 1994; Taskinen and Nikkila, 1977) but not hypertriglyceridemic (HTG) subjects (Pownall et al., 1999a), and the lipemic effect of fat ingestion is more profound among HTG versus NTG subjects (Patsch et al., 1992). Moreover, alcohol ingestion potentiates the lipemic response to a dietary fat challenge by inhibiting lipolysis in adipose tissue and in plasma (Pownall, 1994; Wilson et al., 1970).
HDL-cholesterol is a negative function of plasma TAG, occurring via CETP-mediated transfer of HDL-CE for VLDL-TAG (Pownall et al., 1999b). Whereas ingestion of either alcohol or fat increases plasma TAG, dietary alcohol, and fat elicit opposing effects on plasma nonesterified fatty acid (NEFA) levels. An acute dietary fat load increases plasma NEFA levels in a dose-dependent way, but an acute dose of alcohol reduces plasma NEFA by nearly 50%; the opposing effects of dietary alcohol and fat on plasma NEFA are also observed when consumed together; pre-prandial alcohol suppresses the postprandial increase in plasma NEFA (Pownall, 1994; Pownall et al., 1999a). Cholesteryl ester transfer activity (CETA) could be differentially affected by changes in TAG and/or NEFA that occur during co-ingestion of alcohol and fat. Whereas alcohol-associated decreases in plasma NEFA, an in vitro CETP activator (Morton and Greene, 1997), could lower CETA; increases in plasma TAG associated with dietary fat could increase CETA by providing more CE-acceptors. Here, we identify the effects of fat and alcohol co-ingestion on the plasma CETA and its lipid determinants in patients with a range of plasma TAG concentrations.
Materials and Methods
Study Population
Through advertisements, we obtained a study group with a range of plasma TAG concentrations—an NTG Group (n = 9) with a fasting TAG concentration of ≤2.8 mmol/L (250 mg/dL) and an HTG group with a fasting TAG of >2.8 mmol/L at screening. Men and non-pregnant non-nursing women in good health between the ages of 21–70 years were eligible. Exclusion criteria were Type 1 diabetes mellitus, a personal history of pancreatitis, hypertension, clinically significant disease as judged by the investigators, recent (<2 months) use of lipid-altering medication or foods containing ω-3 fatty acids, regular consumption of more than three alcoholic beverages daily, smoking, use of potentially addictive drugs, and a body mass index (BMI) ≥ 30.00. The entry level anthropomorphic and plasma lipid data for the NTG (plasma TAG = 1.19 ± 0.19 mmol/L) and HTG (plasma TAG = 4.93 ± 1.2 mmol/L) groups are given in Table 1. Along with TAG, plasma cholesterol was higher in the HTG group (p < 0.05). Other differences between the two groups were unremarkable; plasma HDL-C, as expected (Pownall et al., 1999b), trended lower in the HTG group (p < 0.09).
Table 1.
Entry level lipid levels and anthropomorphic profilesa
| NTG subjects |
HTG subjects |
p b | |
|---|---|---|---|
| (n = 9) | (n = 4) | ||
| Height (cm)c | 172 ± 2.8 | 162 ± 6.1 | .111 |
| (Inches) | 67.8 ± 1.1 | 63.8 ± 2.4 | |
| Weight (kg)c | 77.9 ± 4.8 | 70.6 ± 5.6 | .391 |
| (Pounds) | 171.3 ± 10.5 | 155.3 ± 12.4 | |
| BMIc | 26.4 ± 1.9 | 26.9 ± 1.5 | .873 |
| Age (years) | 32.7 ± 2.9 | 47.8 ± 5.4 | .021 |
| HDL-C (mmol/L) | 1.30 ± 0.11 | 0.98 ± 0.09 | .092 |
| (mg/dL) | 50.4 ± 4.2 | 37.8 ± 3.5 | |
| TAG (mmol/L) | 1.19 ± 0.19 | 4.93 ± 1.20 | .001 |
| (mg/dL) | 105.5 ± 16.7 | 436.5 ± 106.6 | |
| Total cholesterol (mmol/L) | 4.66 ± 0.28 | 6.44 ± 1.04 | .044 |
| (mg/dL) | 180.1 ± 11.1 | 249.3 ± 40.1 | |
| LDL-C (mmol/L)d | 2.81 ± 0.31 | 3.21 ± 0.56 | .517 |
| (mg/dL) | 108.8 ± 12.1 | 124.2 ± 21.5 | |
| NEFA (meq/L) | 0.55 ± 0.07 | 0.66 ± 0.09 | .384 |
| CETA | 46.7 ± 3.4 | 39.3 ± 2.9 | .212 |
| Gender (M/F) | 5/4 | 2/2 | |
| Ethnicity (White/Black/Hispanic/Asian/Native American) | 5/1/1/1/1 | 2/0/0/2 |
Mean ± SEM.
Student t test p value for NTG versus HTG.
Body mass index (BMI) = weight (kg)/[height (m)]2.
Calculated as LDL-C = Total cholesterol—HDL-C—TAG/5.24.
BMI, body mass index; CETA, cholesteryl ester transfer activity; HDL, high-density lipoproteins; NTG, normotriglyceridemic; LDL, low-density lipoproteins; TAG, triacylglycerol.
The investigations were conducted according to the rules of the Declaration of Helsinki of 1975 as revised in 2013. The protocol was approved by the Institutional Review Board of Baylor College of Medicine. Participants gave written informed consent for inclusion before participating, and received free parking and $100 for completing each test.
Fat/Alcohol Tolerance Tests
The general protocol is as described (Patsch et al., 1983; Pownall, 1994). Each subject was placed on the American Heart Association Step One diet one week prior to and throughout the test period. The participants kept food and beverage consumption records. Clinic visits were scheduled for mornings after ≥12-h fasting and > 24-h alcohol abstention. Patients were told not to modify their diets and physical activity between screening and the final test. Body weights were measured in normal clothing without shoes. During the oral tolerance tests, volunteers were allowed only low-intensity activities. After fitting with a venous catheter, initial and subsequent (every 2 h for 10 h) blood samples were collected into EDTA via the antecubital vein and placed on ice. Each volunteer consumed a standard saturated fat (SAT) load of 35 g/m2 body area and/or 16 g (20 mL) alcohol/m2 body area in nine-fold excess of water by volume. The SAT loads comprised 350 mL heavy whipping, dairy cream (40% fat), and 30 mL chocolate syrup, 12 g sugar, and 8 g non-fat dry milk as 2.8% protein, 14% carbohydrate, 86% SAT + 480 mg cholesterol as described(Patsch et al., 1983; Pownall, 1994). The fatty acid composition of the SAT load was myristate, 12.3%; palmitate, 36.5%; palmitoleate, 1.3%; stearate, 18.1%; and oleate, 26.9% and linoleate 4.9%. After the final collection, all blood was centrifuged at 4 °C to isolate the plasma; aliquots were stored at −70 °C for NEFA analysis. Other measurements were conducted ≤24 h after final blood collection. Clinic visits were separated by >1 week.
Quantification of Lipids and Proteins
Entry level plasma lipids were determined by the Lipid Laboratory of The Methodist Hospital and Baylor College of Medicine. Plasma TAG, NEFA, and cholesterol levels were determined by an enzymatic method using commercial kits and standards (Wako Diagnostics, USA).
Preparation of CE-Donors
Donors composed of radiolabeled CE in HDL were prepared as described (Gillard et al., 2007): Briefly, [3H]FC (0.5 mCi) in 500 μL 95% alcohol was slowly added with stirring to 100 mL of the d > 1.12 g/mL fraction of human plasma in Tris-buffered saline and incubated at 37 °C over-night. The incubation mixture was adjusted to d = 1.21 g/mL by the addition of KBr and [3H]CE-labeled HDL isolated by flotation at d = 1.21 g/mL. Labeled HDL was incubated with five-fold excess LDL (protein; w/w) for >3 h to exchange LDL-FC for HDL-FC after which the mixture was adjusted to d = 1.063 g/mL and the LDL removed by floatation. The bottom fraction (HDL) was again incubated with LDL, the LDL floated and the HDL collected. This was repeated until thin-layer chromatography showed >95% of HDL-radiolabel as CE.
Plasma CETA
Plasma CETA was based on [3H]CE transfer from HDL-[3H]CE to plasma APOB-containing proteins. According to a cryo-EM study,(Zhang et al., 2012) CETP contains regions that are specific to HDL and (LDL + VLDL) such that there is no transfer of added [3H[HDL tracer to endogenous HDL only to APOB-containing lipoproteins so that endogenous HDL concentrations do not affect the assay. At 4 °C, 5 μL 5,5׳-dithio-bis-[2-nitrobenzoic acid] (0.1 M), [3H]CE-HDL (0.2 μCi, 40 μg in 15 μL), and 200 μL NTG or HTG plasma were mixed in quadruplicate, one assay for each time point. The CETA was performed in triplicate with three of the tubes. One tube (control) remained on ice, the remaining three tubes were incubated with mild agitation at 37 °C for various times after which the tubes were transferred to an ice bath and 22 μL of an APOB-precipitating solution (2.5% dextran sulfate, 2 M MgCl2; pH 7.0) was added to each tube, which remained on ice for 15 min. The APOB-containing lipoproteins were sedimented from the reaction mixture by centrifugation (10 min, ~1100g; 4 °C) and washed (1.0 mL, 0.1 M NaCl). The pellet was resuspended in 0.5 mL 2% sodium dode-cylsulfate in 0.1 NaCl, incubated overnight at 37 °C, and β-counted, along with aliquots of the reaction mixture supernatant. CETA was expressed as radioactivity associated with the acceptor or donor at the end of the incubation; that is, %CETA = Acceptor (CPMt)/Donor (CPM0) × 100% where Acceptor (CPMt) and Donor (CPM0) are the radioactive counts associated with the pellet at time (t) > 0, and the supernatant at t = 0, or alternatively % CETA = [Donor (CPM0)—Donor (CPMt)]/Donor (CPM0) × 100%, where Donor (CPMt) are the radioactivity associated with the supernatant at t > 0. Reported CETA at each time was normalized to the baseline CETA (=100%) and plotted as %CETA = CETAt/CETA0 × 100%, where CETA0 and CETAt are the transfer activities at t = 0 and t > 0, respectively. The CETA assay was linear for up to 6 h irrespective of whether the supernatant (HDL-[3H]CE; r2 = 0.93) or the pellet (LDL-[3H]CE; r2 = 0.96) was β-counted (Fig. S1). CETA is reported as the averages of the two measurements.
Plasma analytes (A)—lipids and CETA—were determined at various times post-alcohol/SAT challenge. The time-dependent analyte responses (AR)—CETA, cholesterol, NEFA, and TAG—to each of the oral challenges were determined and plotted versus time; the total postprandial response of each analyte was calculated as areas-under-the-curve (AUC) for analyte versus time over 10 h; AUC = Σ(ARi – AR0), where AR0 = 100 and ARi is the value of AR at each time point (i = 2, 4, 6, 8, and 10 h).
Statistical Methods and Analysis
For each outcome, repeated measures analyses of variance with subjects nested within TAG levels and with appropriate interaction terms were used to compare the responses to the three challenges and the influence of TAG levels on responses to the challenges.
The strength of the association of %Change CETA with %Change TAG was compared with those for the association with %Change cholesterol, and %Change NEFA. Multilevel modeling methods were used to account for the correlations due to the clustering of bi-hourly observations within each of three trials nested within each subject. The outcome, %CETA, was adjusted for baseline TAG levels and for the effects of the Alcohol, SAT, and (Alcohol + SAT) by fitting to a three-level model. %TAG was added to the model and the deviance (improvement in −2 log likelihood) was compared to a chi-square distribution. The effects of %change cholesterol and NEFA on CETA were determined similarly. The relative importance of %change TAG, cholesterol, and NEFA in predicting the %change CETA was determined by comparing the three deviances as described above. Another assessment of the relative strength of the predictors (TAG, cholesterol, and NEFA) was made by adding a second predictor to the models described above and determining if additional variation was explained. Continuous data are reported as means ± standard errors. All tests were two-tailed and performed using Stata Release 7.0 (StataCorp, 2001, College Station, TX, USA) and MlwiN Version 2.1 (Multilevel Models Project, 2000, London, England). Statistical comparisons of linear regressions for %CETA versus absolute TAG concentrations were performed using GraphPad Prism 8.0.1.
Statistical analysis of the effect of each of dietary challenge on plasma CETA and lipids as a function of time (Figs. 1–4 and Figs. S2–S4) was done using GraphPad Prism 8.1.0 software, performing Repeated Measures one-way ANOVA, with the Geisser–Greenhouse correction. When the ANOVA statistics indicated a significant effect over time (p < 0.05), pairwise comparisons between time points were done with Student’s t-test. Mean values at baseline and at each time point were also compared for the NTG and HTG groups using Student’s t-test.
Fig. 1.

Changes in plasma CETA as a function of ingestion of (a) alcohol, (b) SAT, and (c) (alcohol + SAT) among NTG and HTG subjects as labeled. Curves are shown as a fit of the data to a cubic polynomial from which the peak CETA values were extracted. Points are mean ± SEM. Significant differences between NTG and HTG at various times are indicated by asterisks (p < 0.05). Significant changes from baseline for HTG are indicated by red hashtags, and for NTG by black hashtags. CETA, cholesteryl ester transfer activity; HTG, hypertriglyceridemic; NTG, normotriglyceridemic; SAT, saturated fat
Fig. 4.

Effect of standard doses of (a) alcohol, (b) SAT, and (c) (alcohol + SAT) on plasma TAG as labeled. Curves are shown as a fit of the data to a cubic polynomial from which the peak TAG values were extracted. Points are mean ± SEM. Significant differences between NTG and HTG at various times are indicated by asterisks (p < 0.05). Significant changes from baseline for HTG are indicated by red hashtags, and for NTG by black hashtags. HTG, hypertriglyceridemic; NTG, normotriglyceridemic; SAT, saturated fat
Results
CETA as a Function of Oral Challenge Composition
At each time point, CETA was expressed as %Baseline (Fig. 1) and in terms of its absolute value (CETA × HDL-C) for comparison (Fig. S2). According to individual time points (Fig. 1a) and the AUC (Table S1), the Alcohol challenge did not increase CETA among NTG subjects, whereas among HTG subjects, CETA peaked at 8 h (+13%) with a small, attendant increase in AUC. Following the SAT challenge, CETA increased to 6% over baseline at 3 h and 19% over baseline at 6 h respectively for the NTG and HTG group (Fig. 1b); the AUC values were similarly increased (Table S1). Addition of Alcohol to the SAT load increased the peak CETA time-to-maximum among both NTG and HTG subjects, respectively ~3 → 5 h and 6.3 → 7.6 h, but only slightly increased (not significant, ns) AUC compared to SAT only (Fig. 1b vs Fig. 1c; Table S1). Overall, the time and magnitude of the peak CETA increased as NTG < HTG and Alcohol < SAT ≤ (Alcohol + SAT. The percent change in CETA after the SAT and Alcohol challenges were different (p = 0.010), and between the Alcohol challenges and the combined challenges (p = 0.005). Changes in CETA after SAT versus (Alcohol + SAT) were similar (p = 0.798). Overall, the HTG subjects were slightly more responsive to the challenges than the NTG subjects (p = 0.023). However, the relative change in CETA to the challenges were similar in the two groups (p = 0.343).
Postprandial Changes in Plasma Lipids
Alcohol, SAT, and (Alcohol + SAT) ingestion did not significantly change plasma concentrations of cholesterol for either group when expressed as %Baseline (Fig. 2a–c: p = >0.60) or the absolute plasma cholesterol concentration (Fig. S3). The AUC for both groups after each challenge was nil (Table S1). Among both NTG and HTG groups, Alcohol ingestion induced an immediate reduction in plasma NEFA, which was followed by recovery to 100 and 150% of baseline concentrations in the NTG and HTG groups, respectively, at t > 6 h (Fig. 3a). SAT increased plasma NEFA concentrations in both groups at t ≥ 4 h after an apparent induction period of 2 h with the effect being more meaningful for the HTG group (Fig. 3b). Curves for changes in plasma NEFA concentration in response to (Alcohol + SAT) were qualitatively between those for each component consumed separately (Fig. 3c). Differences in the percent change in NEFA in response to the three challenges were different (p = 0.042); however, no comparisons between pairs of challenges were different: Changes were similar for Alcohol and SAT challenges (p = 0.324), Alcohol and combined challenges (p = 0.342) and for SAT and the combined challenges (p = 0.971). HTG and NTG subjects were similar in overall responsiveness to the challenges (p = 0.444), and the relative responses to the challenges in the two groups were similar (p = 0.661). The apparent inconsistency above is due to the lower power of individual versus combined tests. The responses of plasma NEFA concentrations to the various challenges were biphasic so that the AUC values for NEFA concentration versus time curves are not meaningful and are not given.
Fig. 2.
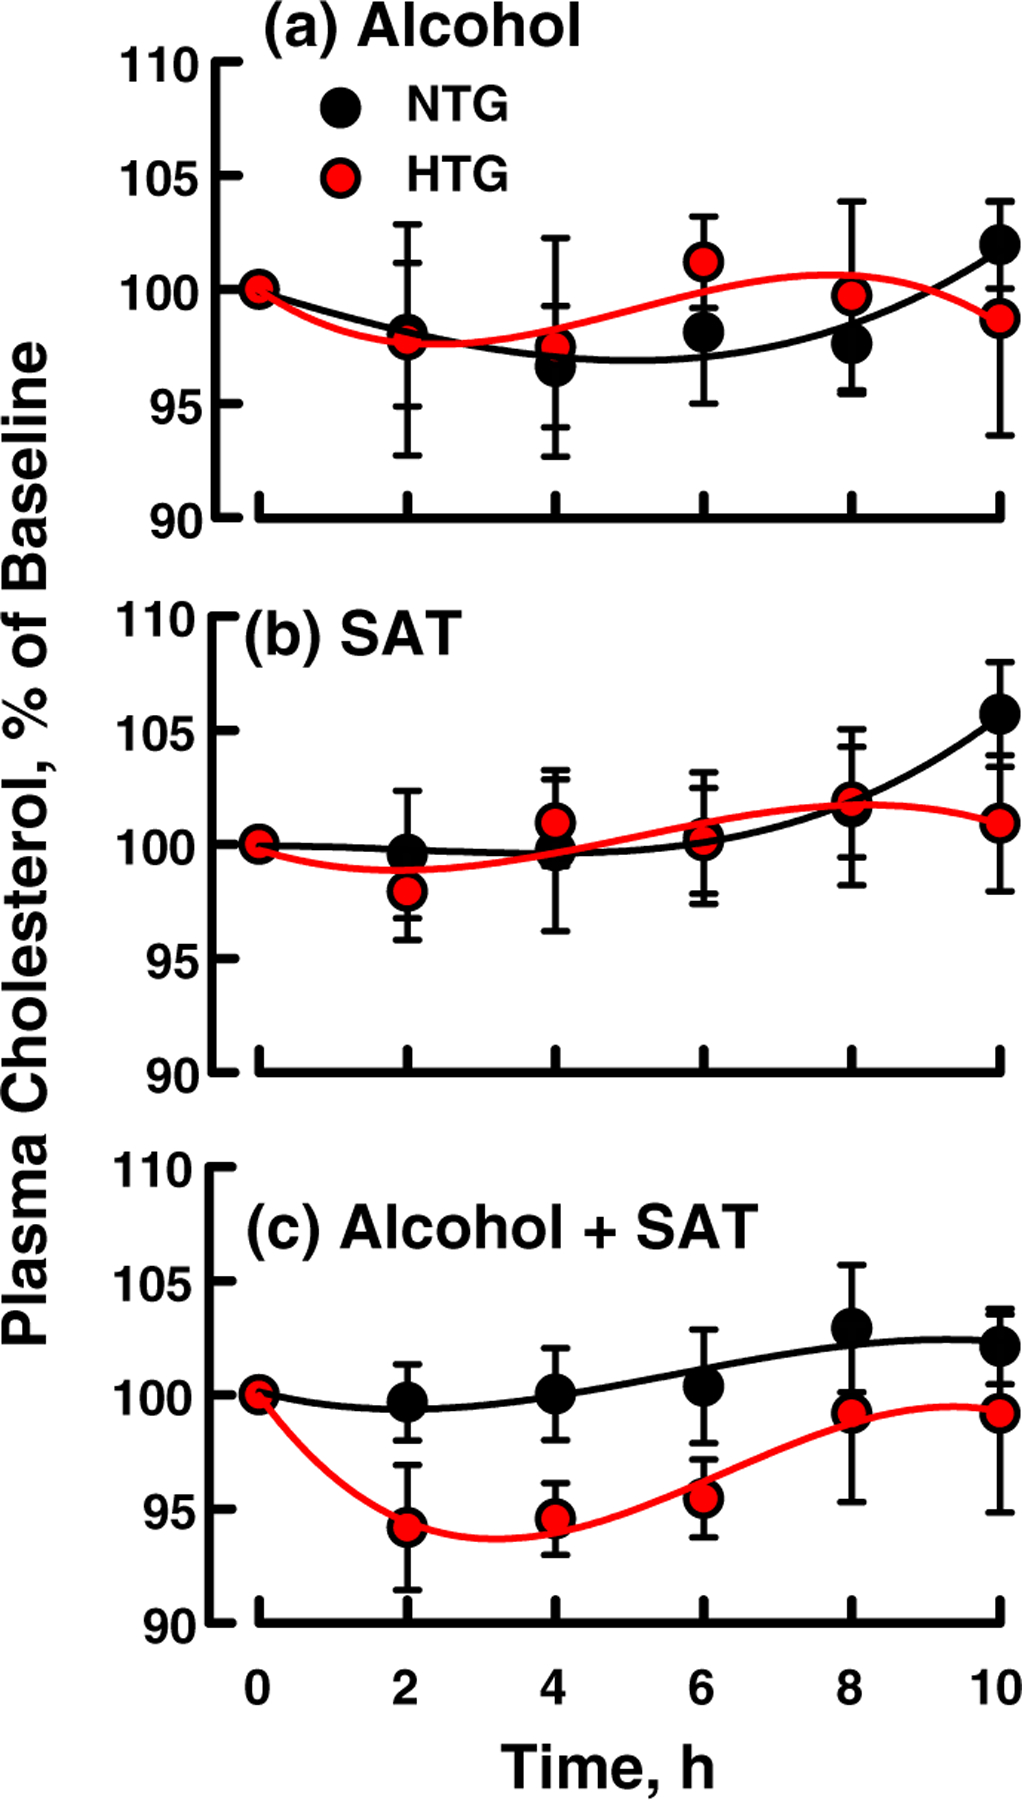
Effect of standard doses of (a) alcohol, (b) SAT, and (c) (alcohol + SAT) on plasma cholesterol as labeled. Curves are a fit of the data to a cubic polynomial. Points are mean ± SEM. There were no significant differences between HTG and NTG values nor between any time points compared to baseline values. HTG, hypertriglyceridemic; NTG, normotriglyceridemic; SAT, saturated fat
Fig. 3.
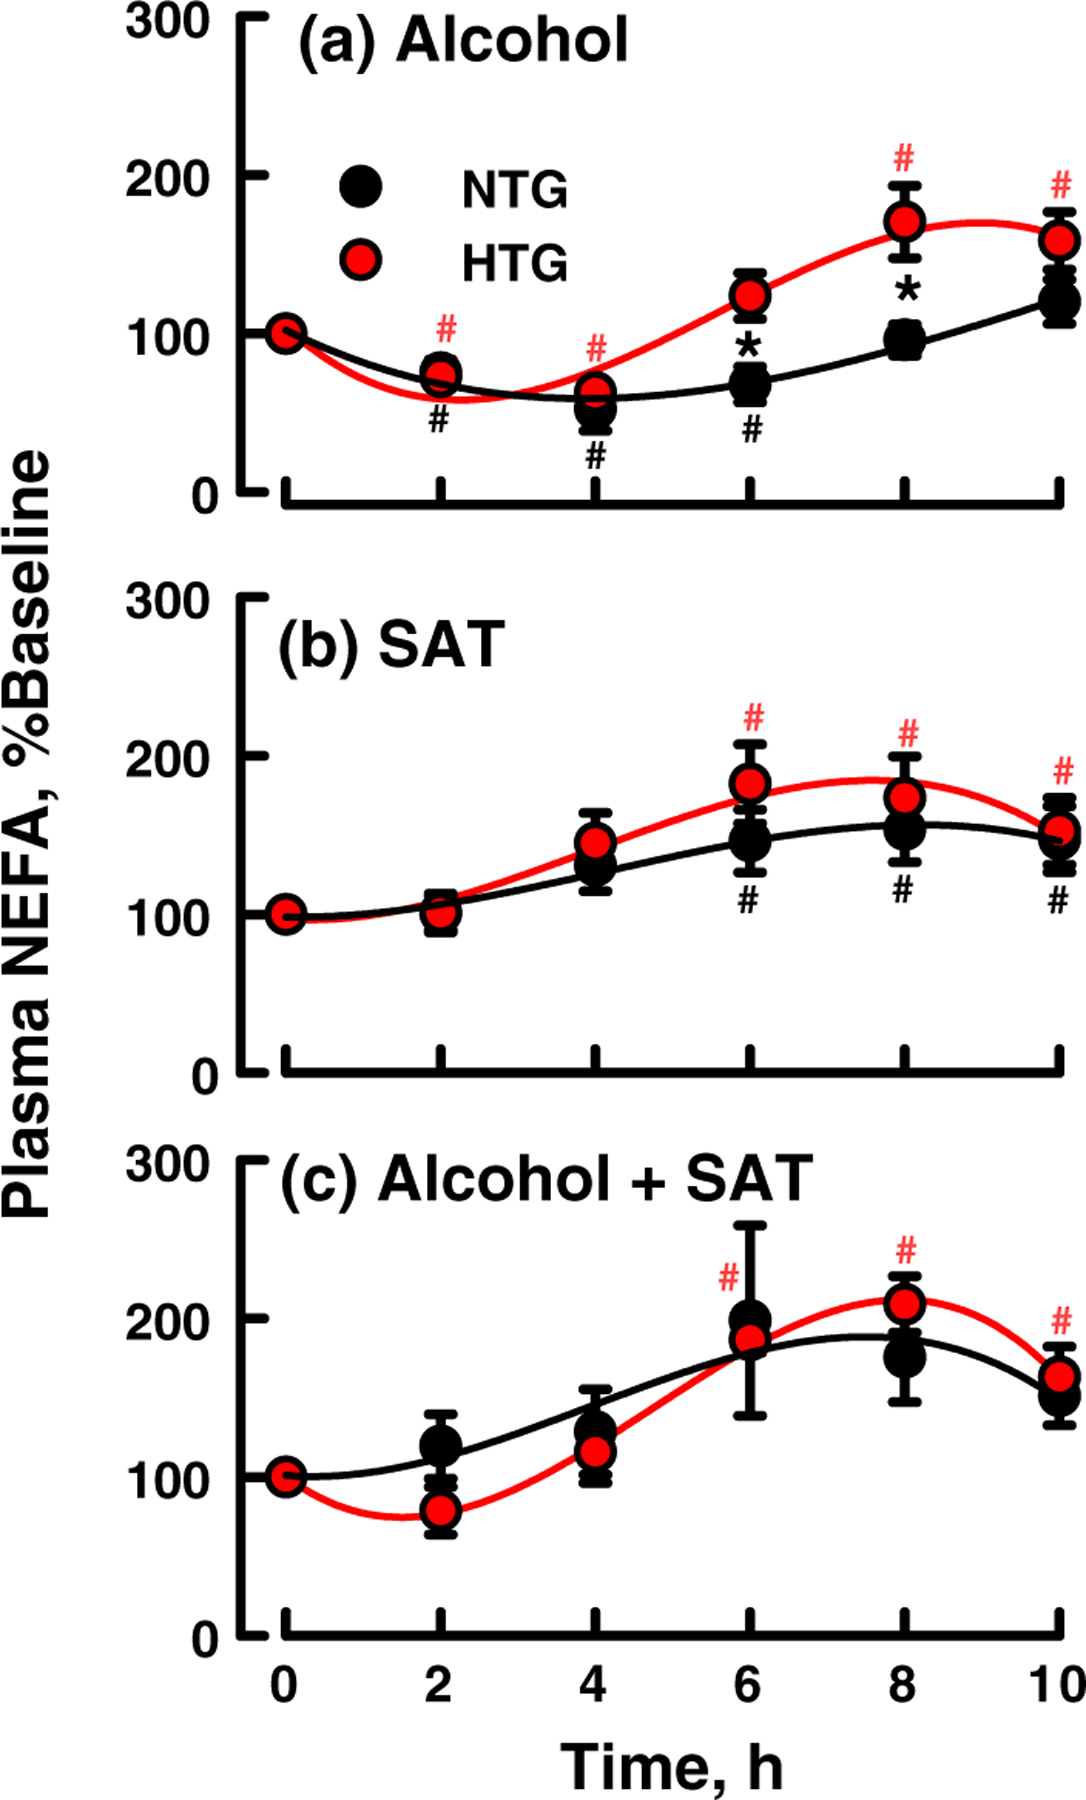
Effect of standard doses of (a) alcohol, (b) SAT, and (c) (alcohol + SAT) on plasma NEFA as labeled. Curves are shown as a fit of the data to a cubic polynomial; points are mean ± SEM. Significant differences between NTG and HTG at various times are indicated by asterisks (p < 0.05). Significant changes from baseline for HTG are indicated by red hashtags, and for NTG by black hashtags. HTG, hypertriglyceridemic; NTG, normotriglyceridemic; SAT, saturated fat
Whereas ingestion of alcohol induced similar, small increases in plasma TAG concentrations in both NTG and HTG subjects (p < 0.05 for HTG subjects at 6 and 8 h; Fig. 4a), ingestion of SAT induced a meaningful increase in both HTG and NTG groups that differed in duration (peak TAG = 5.7 and 2.9 h respectively) and intensity (+90% and + 50%; AUC = 255 and 107 respectively; Fig. 4b, Table S1). The lipemic effects of the combination (Alcohol + SAT) were synergistic, increasing both the duration and magnitude of lipemia— +114% (AUC = 383) at 5 h and +120% (AUC = 396) at 6.5 h in the NTG and HTG groups, respectively (Fig. 4c, Table S1). The changes in the percent change in TAG were significantly different between the Alcohol and SAT challenges (p = 0.034), and between the Alcohol and combined Alcohol and SAT challenge (p = 0.002); the SAT and the combined challenges were similar (p = 0.254). The HTG and NTG responded similarly to the challenges (p = 0.541). Differences in the response to the challenges in the HTG group were similar to that of the NTG group (p = 0.417). Fig. S4 shows the effects of the three oral challenges on absolute TAG concentrations. In absolute concentration, the increases in plasma TAG in HTG subjects in response to SAT and (Alcohol + SAT) are significantly greater and more pro-longed than those in NTG subjects.
The more meaningful changes in both plasma CETA and TAG concentrations relative to those for plasma cholesterol and NEFA concentrations and the similar shifts in the peaks for CETA and TAG concentration provoked a comparison of plasma CETA and TAG concentrations. When CETA-versus-TAG data corresponding to three dietary challenges and two groups from both NTG and HTG groups were compared, six distinct curves were obtained (Fig. S4). On the other hand, when compared on the basis of %CETA versus TAG (mM), all time points fit a single first-order line of regression (Fig. 5a). However, when the data for NTG and HTG for each dietary challenge were plotted separately (Fig. 5b–d), the slopes of the lines ranked as SAT > Alcohol > (Alcohol + SAT). The %CETA versus TAG slope for SAT was significantly greater than for (Alcohol + SAT), p < 0.001, and almost significant versus Alcohol, p = 0.08, while the slopes for Alcohol versus (Alcohol + SAT) were not different (p = 0.371). Thus, the strength of the response of %CETA versus plasma TAG concentration for the (Alcohol + SAT) challenges indicates that alcohol in addition to SAT suppresses the effect of SAT alone. There was no significant correlation between plasma %CETA and plasma cholesterol concentration for either group, and correlation with plasma NEFA was weak. According to multilevel statistical modeling, plasma TAG levels best predicted %CETA (p < 0.0001), and addition of other terms did not explain additional variance.
Fig. 5.

Comparison of plasma %CETA versus plasma TAG concentration. (a) Linear regression analysis of CETA (%baseline) versus plasma TAG concentration. The single line of regression (r2 = 0.23) is based on data from Figs. 1 and 4 for all subjects, alcohol and/or SAT loads, and time points. (b–d) Comparison of the %CETA versus absolute plasma TAG concentration following (b) alcohol, (c) SAT, and (d) (alcohol + SAT). The linear regression slope for (alcohol + SAT) is significantly lower than that for SAT-only (p < 0.001). The slope for SAT only is close to significance vs alcohol-only (p = 0.08), while the slopes for alcohol-only and (alcohol + SAT) are not different (p = 0.371). CETA, cholesteryl ester transfer activity; SAT, saturated fat; TAG, triacylglycerol
Discussion
The effects of diet on plasma lipids—cholesterol, TAG, NEFA—and their transfer proteins are relevant to the control of risk for various diseases including atherosclerosis, obesity-linked diabetes, and pancreatitis. Alcohol and fat, determinants of plasma lipid concentrations, are part of most adult diets and their interactions are important because they are frequently consumed together. Most plasma cholesterol, a major risk factor for cardiovascular disease, occurs as CE so that CETA is a key pathway that regulates the CE distribution among plasma lipoproteins. Here, we tested the effects of co-ingestion of Alcohol and/or SAT on plasma lipids and CETA.
Ingestion of Alcohol, SAT, and (Alcohol + SAT) increased CETA with the effect being most meaningful for HTG versus NTG subjects and increasing as Alcohol < SAT ~ (Alcohol + SAT). (Fig. 1). None of the three challenges significantly altered plasma cholesterol (Fig. 2). In contrast, an Alcohol challenge induced a biphasic response in plasma NEFA (Fig. 3a). Given that ingested Alcohol is metabolized to acetate, an inhibitor of lipolysis, we assign the first phase, decreased NEFA, to inhibition of LPL (Pownall, 1994) and peripheral tissue lipolysis (Abramson and Arky, 1968). During the late-phase after most acetate and its anti-lipolytic effects clear, NEFA increases with the resumption of lipolysis.(Pownall et al., 1999a) The NEFA response to a SAT-only challenge was monophasic with the increase in plasma NEFA concentrations due to dietary-fat lipolysis (Fig. 3b). Changes in NEFA were also biphasic for (Alcohol + SAT), a finding that reflects competing effects of the two dietary components; SAT increases plasma TAG while Alcohol inhibits lipolysis; thus, the effect of the (Alcohol + SAT) on plasma NEFA concentrations is qualitatively similar to the sum of the separate effects of SAT and Alcohol.
Ingestion of fats increases plasma TAG, an effect that is due to increased production of VLDL at low fat doses(Nakano et al., 2011) and chylomicrons (CM) plus VLDL at higher fat doses (Cohn et al., 1993; Pownall, 1994). Of the three plasma analytes, TAG concentrations were the most meaningfully changed by all three challenges, with the largest increases over baseline values (Fig. 4 and Fig. S3 and Table S1), and best predicted % CETA (Fig. 5), supporting the hypothesis that increased CM and VLDL provide more CETA acceptors for HDL-CE.(Hendriks et al., 1998) Co-ingestion of wine with an ad lib evening meal increased CETA via the production of greater numbers of CE-acceptors (Van Tol et al., 1995); here, we have conducted a more controlled study in which volunteers were maintained on a constant background diet before and during the tests, and received pure Alcohol with a fat-load having a defined fatty acid composition rather than ad lib consumption of wine and food during an evening meal.(Van Tol et al., 1995).
Although %CETP versus plasma TAG correlated for all data (Fig. 5a), the slopes of the curves differed when the data for each of the dietary challenges were plotted separately (Fig. 5b–d). The slope for the correlation between % CETA versus plasma TAG concentration was lower for Alcohol + SAT than for Alcohol and SAT alone, that is, slopes = 0.9, 1.4, and 2.5, respectively. Thus, despite the greater number of CETA acceptors, VLDL + chylomicrons, produced by Alcohol + SAT, CETA was less efficient, that is, the Alcohol + SAT ingestion had mutually suppressive effects on the relationship between %CETA and plasma TAG concentration (Fig. 5b–d). The underlying cause of the decrease in CETA response to the increased postprandial lipemia after challenge with (Alcohol +SAT) is not immediately clear. Plasma CETP mass does not increase postprandially, (Van Tol et al., 1995) so that the observed differences in CETA are likely due to other variables. In vitro CETA is increased by lipolysis, via increased concentrations of NEFA (Sammett and Tall, 1985), an in vitro CETA activator (Barter et al., 1990; Lagrost et al., 1995; Morton and Greene, 1997). Accordingly, CETA should track with plasma NEFA concentrations, an effect that was not confirmed by our data (Compare Figs. 1 and 3). Any testable hypothesis would have to consider that other variables such as apolipoprotein F (APOF), a specific CETP inhibitor, which reduces LDL-C levels,(Morton et al., 2019) might be involved. Alternatively, alcohol-derived acetate may play direct or indirect roles. Acetate, which rises to ~1 mM after Alcohol ingestion, could interact with CETP, or with APOF in an anti-inhibitory way. Indirectly, acetate could elicit CETA inhibition via its reduction in concentration of plasma NEFA (Abramson and Arky, 1968; Pownall et al., 1999a), to counteract NEFA-mediated CETA activation.(Arii et al., 1997).
One limitation of our study is that the groups were small. However, our results are consistent with other studies of postprandial lipemia (Cohn et al., 1993; Nakajima et al., 2011; Pownall, 1994; Pownall et al., 1999a) and the study was not powered to detect between-group differences but rather the inclusion of HTG patients was intended to extend the range of TAG concentration to be correlated with CETA. Lastly, the differences in the slopes of the curves for %CETA versus TAG are large and statistically supported and increasing the number of participants would not meaningfully alter the size-effect or our conclusions. The identity of the metabolite underlying the smaller effect of plasma TAG on CETA in the (Alcohol + SAT) group remains a mystery and challenge for future study.
Conclusions
There is indirect evidence that chylomicron remnants are atherogenic; NTG patients with coronary artery disease have higher plasma concentrations of chylomicron remnants (Weintraub et al., 1996) and a slower rate of clearance of postprandial lipoproteins (Groot et al., 1991) than NTG subjects with normal coronary vessels. On the other hand, in the presence of CETA, CM and/or their remnants could be anti-atherogenic and contribute to the terminal step in reverse cholesterol transport to the liver. Under fasting conditions, CETA transfers HDL-CE to the VLDL, which ultimately converts to LDL, which are removed by hepatic LDL-receptors. Postprandially, some CE transfers to the chylomicrons, which convert to remnants, which are also removed by hepatic receptors. Given that the plasma turnover time for chylomicron remnants is shorter (~5 min) than that for LDL (~3 days), CE-transfer to CM is a more rapid route for plasma CE reduction. Alcohol ingestion with fat enhances postprandial lipemia via impaired LPL-mediated clearance of CM (Pownall, 1994). Therefore, these CE-acceptors persist longer and can accept more CE via CETA. Thus, one component of the cardioprotective effect of alcohol may the transient elevation of CE acceptors, that is, intestinally derived lipoproteins, which are destined for rapid hepatic extraction following the recovery of normal LPL activity.
Supplementary Material
Acknowledgements
Supported by grants from the Alcoholic Beverage Medical Research Foundation and the National Institutes of Health (HL-30914 and HL-56865); clinical support was provided by the Baylor College of Medicine General Clinical Research Center (M01 RR00188). We thank Christie M. Ballantyne, MD for medical oversight, Lisa Wu for patient management and Kay T. Kimball, PhD for statistical support.
Abbreviations
- AUC
area under curve
- CE
cholesteryl esters
- CETA
cholesteryl ester transfer activity
- CETP
cholesteryl ester transfer protein
- CM
chylomicrons
- HDL
high-density lipoproteins
- HTG
hypertriglyceridemic
- LDL
low-density lipoproteins
- NEFA
nonesterified fatty acids
- NTG
normotriglyceridemic
- SAT
saturated fat
- TAG
triacylglycerol
- VLDL
very low density lipoproteins
Footnotes
Supporting information Additional supporting information may be found online in the Supporting Information section at the end of the article.
Conflict of interest The authors declare that they have no conflict of interest.
References
- Abramson EA, & Arky RA (1968) Acute antilipolytic effects of ethyl alcohol and acetate in man. The Journal of Laboratory and Clinical Medicine, 72:105–117. [PubMed] [Google Scholar]
- Arii K, Suehiro T, Yamamoto M, Ito H, & Hashimoto K (1997) Suppression of plasma cholesteryl ester transfer protein activity in acute hyperinsulinemia and effect of plasma nonesterified fatty acid. Metabolism, 46:1166–1170. [DOI] [PubMed] [Google Scholar]
- Barter PJ, Chang LB, & Rajaram OV (1990) Sodium oleate promotes a redistribution of cholesteryl esters from high to low density lipoproteins. Atherosclerosis, 84:13–24. [DOI] [PubMed] [Google Scholar]
- Cohn JS, Johnson EJ, Millar JS, Cohn SD, Milne RW, Marcel YL, … Schaefer EJ (1993) Contribution of apoB-48 and apoB-100 triglyceride-rich lipoproteins (TRL) to postprandial increases in the plasma concentration of TRL triglycerides and retinyl esters. Journal of Lipid Research, 34:2033–2040. [PubMed] [Google Scholar]
- van der Gaag MS, van Tol A, Scheek LM, James RW, Urgert R, Schaafsma G, & Hendriks HF (1999) Daily moderate alcohol consumption increases serum paraoxonase activity; a diet-controlled, randomised intervention study in middle-aged men. Atherosclerosis, 147:405–410. [DOI] [PubMed] [Google Scholar]
- Gaziano JM, Buring JE, Breslow JL, Goldhaber SZ, Rosner B, VanDenburgh M, … Hennekens CH (1993) Moderate alcohol intake, increased levels of high-density lipoprotein and its subfractions, and decreased risk of myocardial infarction. The New England Journal of Medicine, 329:1829–1834. [DOI] [PubMed] [Google Scholar]
- Gillard BK, Courtney HS, Massey JB, & Pownall HJ (2007) Serum opacity factor unmasks human plasma high-density lipoprotein instability via selective delipidation and apolipoprotein A-I desorption. Biochemistry, 46:12968–12978. [DOI] [PMC free article] [PubMed] [Google Scholar]
- Groot PH, van Stiphout WA, Krauss XH, Jansen H, van Tol A, van Ramshorst E, … Havekes L (1991) Postprandial lipoprotein metabolism in normolipidemic men with and without coronary artery disease. Arteriosclerosis and Thrombosis, 11: 653–662. [DOI] [PubMed] [Google Scholar]
- Hendriks HF, Veenstra J, van Tol A, Groener JE, & Schaafsma G (1998) Moderate doses of alcoholic beverages with dinner and postprandial high density lipoprotein composition. Alcohol and Alcoholism, 33:403–410. [DOI] [PubMed] [Google Scholar]
- Lagrost L, Florentin E, Guyard-Dangremont V, Athias A, Gandjini H, Lallemant C, & Gambert P (1995) Evidence for nonesterified fatty acids as modulators of neutral lipid transfers in normolipidemic human plasma. Arteriosclerosis, Thrombosis, and Vascular Biology, 15:1388–1396. [DOI] [PubMed] [Google Scholar]
- Morton RE, & Greene DJ (1997) Suppression of lipid transfer inhibitor protein activity by oleate. A novel mechanism of cholesteryl ester transfer protein regulation by plasma free fatty acids. Arteriosclerosis, Thrombosis, and Vascular Biology, 17: 3041–3048. [DOI] [PubMed] [Google Scholar]
- Morton RE, Liu Y, & Izem L (2019) ApoF knockdown increases cholesteryl ester transfer to LDL and impairs cholesterol clearance in fat-fed hamsters. Journal of Lipid Research, 60:1868–1879. [DOI] [PMC free article] [PubMed] [Google Scholar]
- Nakajima K, Nakano T, Tokita Y, Nagamine T, Inazu A, Kobayashi J, … Tanaka A (2011) Postprandial lipoprotein metabolism: VLDL vs chylomicrons. Clinica Chimica Acta, 412: 1306–1318. [DOI] [PMC free article] [PubMed] [Google Scholar]
- Nakano T, Tanaka A, Okazaki M, Tokita Y, Nagamine T, & Nakajima K (2011) Particle size of apoB-48 carrying lipoproteins in remnant lipoproteins isolated from postprandial plasma. Annals of Clinical Biochemistry, 48:57–64. [DOI] [PubMed] [Google Scholar]
- Patsch JR, Karlin JB, Scott LW, Smith LC, & Gotto AM Jr. (1983) Inverse relationship between blood levels of high density lipoprotein subfraction 2 and magnitude of postprandial lipemia. Proceedings of the National Academy of Sciences of the United States of America, 80:1449–1453. [DOI] [PMC free article] [PubMed] [Google Scholar]
- Patsch JR, Miesenbock G, Hopferwieser T, Muhlberger V, Knapp E, Dunn JK, … Patsch W (1992) Relation of triglyceride metabolism and coronary artery disease. Studies in the postprandial state. Arteriosclerosis and Thrombosis, 12:1336–1345. [DOI] [PubMed] [Google Scholar]
- Pearson TA (1996) Alcohol and heart disease. Circulation, 94: 3023–3025. [DOI] [PubMed] [Google Scholar]
- Pownall HJ (1994) Dietary ethanol is associated with reduced lipolysis of intestinally derived lipoproteins. Journal of Lipid Research, 35:2105–2113. [PubMed] [Google Scholar]
- Pownall HJ, Ballantyne CM, Kimball KT, Simpson SL, Yeshurun D, & Gotto AM Jr. (1999a) Effect of moderate alcohol consumption on hypertriglyceridemia: A study in the fasting state. Archives of Internal Medicine, 159:981–987. [DOI] [PubMed] [Google Scholar]
- Pownall HJ, Brauchi D, Kilinc C, Osmundsen K, Pao Q, Payton-Ross C, … Ballantyne CM (1999b) Correlation of serum triglyceride and its reduction by omega-3 fatty acids with lipid transfer activity and the neutral lipid compositions of high-density and low-density lipoproteins. Atherosclerosis, 143: 285–297. [DOI] [PubMed] [Google Scholar]
- Riemens SC, van Tol A, Hoogenberg K, van Gent T, Scheek LM, Sluiter WJ, & Dullaart RP (1997) Higher high density lipoprotein cholesterol associated with moderate alcohol consumption is not related to altered plasma lecithin:Cholesterol acyltransferase and lipid transfer protein activity levels. Clinica Chimica Acta, 258:105–115. [DOI] [PubMed] [Google Scholar]
- Sammett D, & Tall AR (1985) Mechanisms of enhancement of cholesteryl ester transfer protein activity by lipolysis. The Journal of Biological Chemistry, 260:6687–6697. [PubMed] [Google Scholar]
- Sane T, Nikkila EA, Taskinen MR, Valimaki M, & Ylikahri R (1984) Accelerated turnover of very low density lipoprotein triglycerides in chronic alcohol users. A possible mechanism for the up-regulation of high density lipoprotein by ethanol. Atherosclerosis, 53:185–193. [DOI] [PubMed] [Google Scholar]
- Taskinen MR, & Nikkila EA (1977) Nocturnal hypertriglyceridemia and hyperinsulinemia following moderate evening intake of alcohol. Acta Medica Scandinavica, 202:173–177. [DOI] [PubMed] [Google Scholar]
- Van Tol A, Groener JE, Scheek LM, Van Gent T, Veenstra J, Van de Pol H, … Schaafsma G (1995) Induction of net mass lipid transfer reactions in plasma by wine consumption with dinner. European Journal of Clinical Investigation, 25:390–395. [DOI] [PubMed] [Google Scholar]
- Weintraub MS, Grosskopf I, Rassin T, Miller H, Charach G, Rotmensch HH, … Iaina A (1996) Clearance of chylomicron remnants in normolipidaemic patients with coronary artery disease: Case control study over three years. BMJ, 312:935–939. [DOI] [PMC free article] [PubMed] [Google Scholar]
- Wilson DE, Schreibman PH, Brewster AC, & Arky RA (1970) The enhancement of alimentary lipemia by ethanol in man. The Journal of Laboratory and Clinical Medicine, 75:264–274. [PubMed] [Google Scholar]
- Zhang L, Yan F, Zhang S, Lei D, Charles MA, Cavigiolio G, … Ren G (2012) Structural basis of transfer between lipoproteins by cholesteryl ester transfer protein. Nature Chemical Biology, 8: 342–349. [DOI] [PMC free article] [PubMed] [Google Scholar]
Associated Data
This section collects any data citations, data availability statements, or supplementary materials included in this article.