Abstract
We aimed to determine mortality risk in underweight patients with diabetic nephropathy for microalbuminuria or macroalbuminuria. We analyzed mortality and death‐cause data from BioBank Japan, with baseline years 2003–2007. We analyzed mortality rates from all causes and ischemic heart disease, according to body mass index (<18.5, 18.5–21.9, 22–24.9 and ≥25 kg/m2). The mean (standard deviation) of patient age, body mass index, and glycated hemoglobin at enrollment was 61.6 years (11.7 years), 25.0 kg/m2 (4.4 kg/m2) and 7.7% (1.5%), respectively. Hazard ratios of all‐cause and ischemic heart disease mortality were highest (1.79 [P = 0.0001] and 2.95 [P = 0.027], respectively) in patients with body mass index <18.5 kg/m2, as compared with body mass index 22–24.9 kg/m2. All‐cause mortality risk for body mass index <18.5 kg/m2 was similar to that for current smokers (hazard ratio 1.70, P < 0.0001). Underweight could be a predictor of mortality risk in patients with diabetic nephropathy for microalbuminuria or macroalbuminuria.
Keywords: Diabetic nephropathy, Mortality, Underweight
Comparison of mortality by body mass index categories among Japanese patients with diabetic nephropathy for microalbuminuria and macroalbuminuria. Body mass index for <18.5 kg/m2 had the highest, and body mass index for 18.5–21.9 kg/m2 had the second highest mortality.

Introduction
Renal dysfunction directly affects the life expectancy of patients with diabetes1. In diabetic nephropathy with microalbuminuria or macroalbuminuria, the mortality risk as a result of cardiovascular disease can potentially be reduced by modifying risk factors.
Studies have reported that underweight in older people can increase the risks of geriatric diseases and shorter life expectancy2, 3, 4; furthermore, underweight might be an indicator of frailty in older adults. However, analyses of diabetic nephropathy according to body mass index (BMI) are scarce. In the present cohort study, we aimed to determine the mortality risk of underweight in patients with diabetic nephropathy for microalbuminuria or macroalbuminuria. In the analyses, we focused on deaths from all causes and cardiovascular disease.
Materials and Methods
Between fiscal years 2003 and 2007, the BioBank Japan Project registered patients with type 2 diabetes at 66 hospitals across Japan. The study details have been published elsewhere5, 6. In brief, we followed participants with one of 47 targeted diseases in these hospitals from June 2003. We observed survival and death causes among patients. The cohort achieved a 97% follow‐up rate7. This study included patients with type 2 diabetes and diabetic nephropathy at registration. We excluded patients with other diabetes types and secondary diabetes8, 9.
We collected clinical information of patients at baseline in patient interviews and reviewed the medical records5. Glycated hemoglobin A1c levels, measured between 2003 and 2007 using the Japanese Diabetes Society scale, were converted to National Glycohemoglobin Standardization Program units10. The duration of diabetes was calculated from the date of onset or diagnosis of diabetes to the time of enrollment. Cause of death was identified according to the International Statistical Classification of Diseases and Related Health Problems, 10th Revision (ICD‐10)7. Although the cause of death was recorded for most patients, a subset of the data was missing. Deaths owing to ischemic heart disease comprised ICD‐10 codes I21–I25, and deaths owing to cerebrovascular disease comprised ICD‐10 codes I60–I69. To explore mortality risks in diabetic nephropathy, we analyzed patients with microalbuminuria or macroalbuminuria, according to the guideline11. BMI was categorized as follows: <18.5 kg/m2, underweight; 18.5–21.9 kg/m2, low–normal; 22–24.9 kg/m2, high–normal; and ≥25 kg/m2, obese.
The ethics committee of the School of Medicine, University of Yamanashi approved this study (approval number: R1‐2040), which was carried out in accordance with the ethical guidelines and principles of the Declaration of Helsinki of 1995 (as revised in Fortaleza, Brazil, October 2013). All participants provided their written informed consent to participate in the project and patient anonymity has been preserved.
We described the characteristics of participants at baseline and the follow‐up duration. We calculated Kaplan–Meier estimates of mortality, according to BMI categories. The log‐rank test was used to assess the statistical significance of differences in the estimates. To compare the mortality risks among factors in diabetic nephropathy stages 2 and 3, we calculated adjusted hazard ratios and 95% confidence intervals using multivariate analysis in a Cox model. Statistical analyses were carried out using SAS version 9.4 (SAS Institute, Cary, NC, USA). R version 3.6.1 (R Project for Statistical Computing, Vienna, Austria) was used to generate Kaplan–Meier estimates. All reported P‐values were two‐sided, and P < 0.05 showed statistical significance.
Results
In total, 2,381 patients with diabetic nephropathy were registered in our cohort. The median (interquartile range) follow‐up duration from registration was 8.45 years (6.59–9.87 years). The number (proportion) of men, current smokers and current alcohol drinkers was 1,504 (63.2%), 687 (28.9%) and 930 (40.1%), respectively. The mean (standard deviation) of age, BMI, glycated hemoglobin A1c and systolic/diastolic blood pressure at enrollment was 61.6 years (11.7 years), 25.0 kg/m2 (4.4 kg/m2), 7.7% (1.5%) or 61 mmol/mol (16 mmol/mol) and 135 (17)/77 mmHg (11 mmHg), respectively. The mean (standard deviation; interquartile range) BMI in the underweight, low‐normal, high‐normal and obese groups was 17.0 (1.1; 16.4–17.9), 20.6 (1.0; 19.8–21.5), 23.5 (0.8; 22.8–24.2) and 28.8 (3.4; 26.2–30.3), respectively.
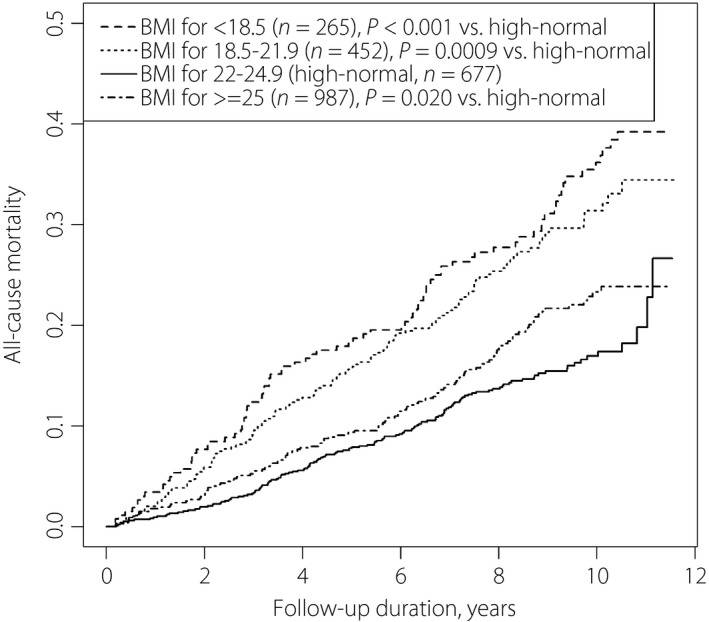
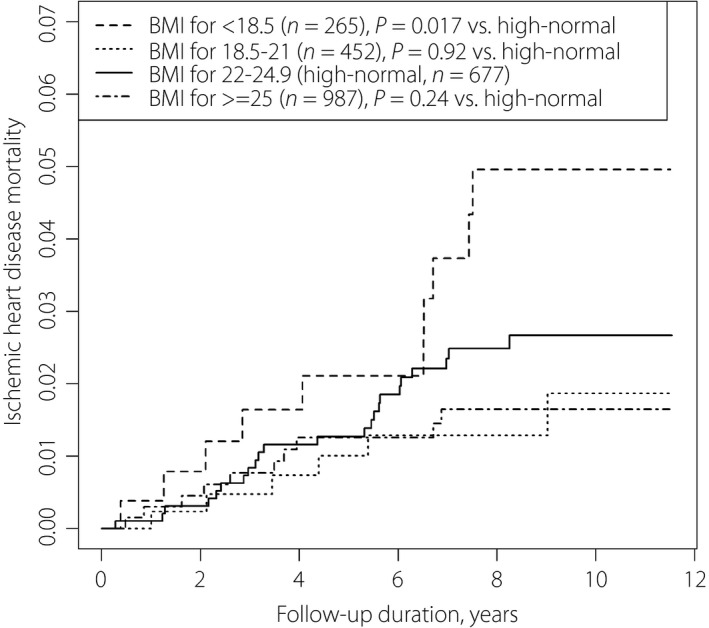
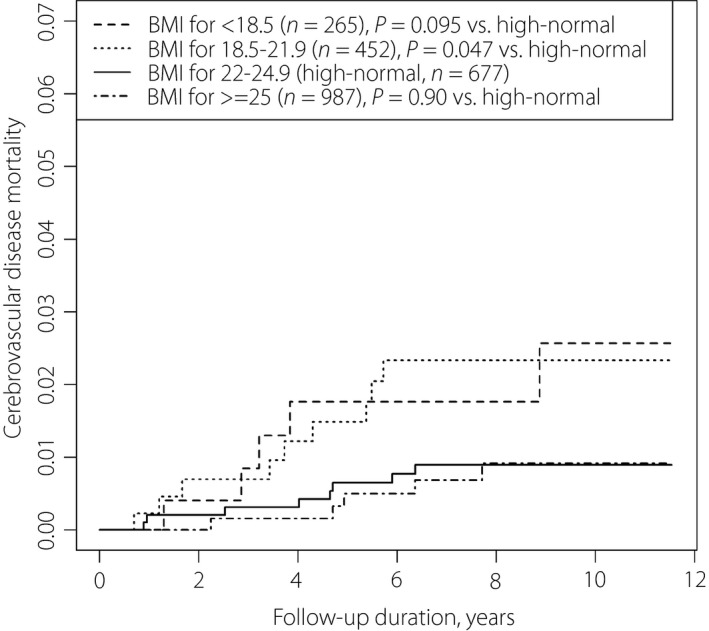
Figure 1 shows survival curves of all‐cause mortality. The mortality rate was highest in the order BMI <18.5, 18.5–21.9, ≥25 and 22–24.9 kg/m2. Figures 2 and 3 show the survival curves for ischemic heart disease and cerebrovascular disease mortality. BMI <18.5 kg/m2 showed the highest mortality rate from ischemic heart disease; BMI ≤21.9 kg/m2 was associated with the highest mortality rate from cerebrovascular disease. Adjusted hazard ratios (95% confidence intervals) of all‐cause mortality were 1.79 (1.33–2.41) for BMI <18.5 kg/m2; 1.50 (1.17–1.93) for BMI 18.5–22.9 kg/m2; 2.03 (1.84–2.24) for age per 10 years; and 1.70 (1.33–2.18) for current smokers (Table 1).
Figure 1.

All‐cause mortality among Japanese patients with diabetic nephropathy (microalbuminuria and macroalbuminuria) according to body mass index levels.
Figure 2.

Mortality as a result of ischemic heart disease among Japanese patients with diabetic nephropathy (microalbuminuria and macroalbuminuria) according to body mass index levels.
Figure 3.

Mortality as a result of cerebrovascular diseases among Japanese patients with diabetic nephropathy (microalbuminuria and macroalbuminuria) according to body mass index levels.
Table 1.
Adjusted hazard ratios (95% confidence intervals) of all‐cause, ischemic heart disease and cerebrovascular disease mortality among Japanese patients with diabetic nephropathy for microalbuminuria and macroalbuminuria
| Risk factor | All causes | P‐value | Ischemic heart disease | P‐value | Cerebrovascular disease | P‐value |
|---|---|---|---|---|---|---|
| Macroalbuminuria vs microalbuminuria | 1.28 (1.06–1.54) | 0.0086 | 2.08 (1.11–3.91) | 0.023 | 1.28 (0.60–2.76) | 0.52 |
| Men vs women | 1.17 (0.92–1.49) | 0.21 | 1.70 (0.81–3.54) | 0.160 | 0.92 (0.34–2.48) | 0.870 |
| Age per 10 years | 2.03 (1.84–2.24) | <0.0001 | 1.92 (1.31–2.83) | <0.0001 | 2.26 (1.50–3.40) | <0.0001 |
| HbA1c ≥7% vs <7% | 0.69 (0.57–0.84) | 0.0002 | 0.95 (0.53–1.70) | 0.85 | 0.37 (0.15–0.93) | 0.034 |
| LDL cholesterol ≥140 mg/dL vs <140 mg/dL | 1.07 (0.64–1.80) | 0.80 | 1.31 (0.31–5.49) | 0.71 | –† | – |
| Blood pressure, ≥140/90 mmHg | 1.01 (0.79–1.30) | 0.92 | 1.99 (0.85–4.66) | 0.12 | 0.68 (0.27–1.71) | 0.41 |
| Blood pressure, ≥120/80 mmHg | 0.86 (0.67–1.10) | 0.22 | 1.33 (0.55–3.22) | 0.53 | 0.40 (0.15–1.10) | 0.075 |
| Blood pressure, <120/80 mmHg | Ref | – | Ref | – | Ref | |
| Current smoker | 1.70 (1.33–2.18) | <0.0001 | 1.30 (0.63–2.71) | 0.48 | 1.59 (0.58–4.41) | 0.37 |
| Ex‐smoker | 1.26 (0.97–1.62) | 0.078 | 0.52 (0.21–1.29) | 0.16 | 1.01 (0.33–3.05) | 0.99 |
| Never smoker | Ref | – | Ref | – | Ref | – |
| Alcohol drinker | 1.02 (0.83–1.26) | 0.49 | 0.79 (0.40–1.55) | 0.49 | 1.10 (0.45–2.67) | 0.83 |
| Non‐drinker | Ref | – | Ref | – | Ref | – |
| BMI, <18.5 kg/m2 | 1.79 (1.33–2.41) | 0.0001 | 2.95 (1.14–7.69) | 0.027 | 2.01 (0.54–7.48) | 0.30 |
| BMI, 18.5–21.9 kg/m2 | 1.50 (1.17–1.93) | 0.0016 | 0.82 (0.28–2.40) | 0.71 | 2.71 (0.90–8.16) | 0.076 |
| BMI, 22–24.9 kg/m2 | Ref | – | Ref | – | Ref | – |
| BMI, ≥25 kg/m2 | 0.99 (0.77–1.26) | 0.91 | 1.83 (0.86–3.90) | 0.12 | 1.33 (0.43–4.12) | 0.63 |
BMI, body mass index; HDL, high‐density lipoprotein; Ref, reference.
Total n = 2,381.
Risk for serum low‐density lipoprotein (LDL) cholesterol level could not be analyzed for this outcome.
Discussion
In the present study, Kaplan–Meier curves showed that underweight patients died earlier from all causes and ischemic heart disease (Figures 1, 2). Patients with low‐normal BMI also presented higher mortality from all causes and cerebrovascular disease (Figure 3; Table 1). Obesity was not associated with a significant mortality risk. It is notable that the all‐cause mortality risk for underweight was as high as that of current smoking among patients.
Significant mortality risk owing to ischemic heart disease was present primarily among underweight patients, followed by those with diabetic nephropathy stage increased from microalbuminuria to macroalbuminuria and older patients (Table 1). Previous reports detected no correlation or an inverse correlation between BMI and atherosclerosis among Japanese people12, 13. The phenomena of metabolic syndrome with lean body mass14 or sarcopenic obesity are present in the Japanese population15. The reason for the presence of metabolic syndrome among lean Japanese people could be owing to genetically low insulin secretion,16 leading to impaired ability to gain weight17. Several researchers have warned that underweight to low‐normal BMI could increase the disease risk among East Asian people4. In Japanese older people in the general population, BMI <20 kg/m2 is associated with shorter life expectancy, suggesting poor physical, mental and nutritional conditions18. The present results showed a high mortality risk owing to ischemic heart disease in diabetic nephropathy.
In contrast with the aforementioned findings, the mortality risk of cerebrovascular disease for underweight patients was relatively low. BMI levels might not greatly affect the incidence of cerebrovascular events, because aneurysm (the main cause of subarachnoid hemorrhage) is considered to have congenital and not environmental origins, and the incidence of stroke caused by atrial fibrillation has been increasing19, 20. Additionally, compared with Western people, stroke in Japanese people is not largely as a result of high serum glucose or cholesterol levels, but rather high blood pressure20. In older adults with diabetes, disease duration and a medication history for hypertension might be more critical with respect to stroke incidence.
At older ages, low rather than high serum cholesterol levels indicate undernutrition and increased risk of death21. Recently, serum glucose and blood pressure levels have been better controlled in Japanese patients9. Clinicians can more easily recognize low BMI in patients taking medication, who might already have several risk factors for shorter life expectancy. According to a patient’s status, clinicians can reconsider the treatment strategy by determining the causes of undernutrition, examining disease control methods and also patients’ environments. With better disease control, managing a patient’s environmental factors could become a primary focus of intervention.
The present study had several limitations. First, the included patients were recruited from hospital inpatient and outpatient departments, and not from clinics; however, we consider that the results for comparisons of mortality risk would not be affected. Second, the cause of underweight was not investigated; that is, body composition and historical change in BMI were not studied.
In conclusion, the present data in Japanese patients with early‐stage diabetic nephropathy showed that underweight could be a risk factor of mortality as a result of all causes and ischemic heart disease. Clinicians should assess this risk according to the patient’s condition. Underweight might be an indicator of undernutrition and sarcopenia in older patients.
Disclosure
The authors declare no conflict of interest.
Acknowledgments
We express our gratitude to all participants in the BioBank Japan Project. We thank all of the medical coordinators in the cooperating hospitals for collecting samples and clinical information, as well as Dr Yasushi Yamashita and staff members of the BioBank Japan Project for administrative support. We also thank Dr Kumao Toyoshima, Professor Yuji Yamanashi, Professor Yoshinori Murakami, Professor Takayuki Morisaki, Professor Yoichiro Kamatani and Professor Koichi Matsuda for overall supervision of the BioBank Japan Project. Finally, we thank Analisa Avila, ELS, for editing a draft of this manuscript. This work was supported by funds from Tailor‐Made Medical Treatment with the BioBank Japan Project from the Japan Agency for Medical Research and Development (AMED), and the Ministry of Education, Culture, Sports, Science, and Technology (MEXT) (KAKENHI grant numbers: JP18K17376 and JP19K10658).
J Diabetes Investig. 2021
References
- 1.Rossing P, Hougaard P, Borch‐Johnsen K, et al. Predictors of mortality in insulin dependent diabetes: 10 year observational follow up study. Br Med J 1996; 313: 779–784. [DOI] [PMC free article] [PubMed] [Google Scholar]
- 2.Wassertheil‐Smoller S, Fann C, Allman RM, et al. Relation of low body mass to death and stroke in the systolic hypertension in the elderly program. Arch Intern Med 2000; 160: 494–500. [DOI] [PubMed] [Google Scholar]
- 3.Tamakoshi A, Yatsuya H, Lin Y, et al. BMI and all‐cause mortality among Japanese older adults: findings from the Japan collaborative cohort study. Obesity 2010; 18: 362–369. [DOI] [PubMed] [Google Scholar]
- 4.Yokomichi H, Kondo K, Nagamine Y, et al. Dementia risk by combinations of metabolic diseases and body mass index: Japan Gerontological Evaluation Study Cohort Study. J Diabetes Investig 2020; 11: 206–215. [DOI] [PMC free article] [PubMed] [Google Scholar]
- 5.Nagai A, Hirata M, Kamatani Y, et al. Overview of the BioBank Japan Project: study design and profiles. J Epidemiol 2017; 27: S2–S8. [DOI] [PMC free article] [PubMed] [Google Scholar]
- 6.Hirata M, Kamatani Y, Nagai A, et al. Cross‐sectional analysis of BioBank Japan clinical data: a large cohort of 200,000 patients with 47 common diseases. J Epidemiol 2017; 27: S9–S21. [DOI] [PMC free article] [PubMed] [Google Scholar]
- 7.Hirata M, Nagai A, Kamatani Y, et al. Overview of BioBank Japan follow‐up data in 32 diseases. J Epidemiol 2017; 27: S22–S28. [DOI] [PMC free article] [PubMed] [Google Scholar]
- 8.Yokomichi H, Nagai A, Hirata M, et al. Survival of macrovascular disease, chronic kidney disease, chronic respiratory disease, cancer and smoking in patients with type 2 diabetes: BioBank Japan cohort. J Epidemiol 2017; 27: S98–S106. [DOI] [PMC free article] [PubMed] [Google Scholar]
- 9.Yokomichi H, Nagai A, Hirata M, et al. Serum glucose, cholesterol and blood pressure levels in Japanese type 1 and 2 diabetic patients: BioBank Japan. J Epidemiol 2017; 27: S92–S97. [DOI] [PMC free article] [PubMed] [Google Scholar]
- 10.Tajima N, Noda M, Origasa H, et al. Evidence‐based practice guideline for the treatment for diabetes in Japan 2013. Diabetol Int 2015; 6: 151–187. [Google Scholar]
- 11.Haneda M, Utsunomiya K, Koya D, et al. A new classification of diabetic nephropathy 2014: a report from Joint Committee on Diabetic Nephropathy. J Diabet Investig 2015; 6: 242–246. [DOI] [PMC free article] [PubMed] [Google Scholar]
- 12.Kawamoto R, Ohtsuka N, Ninomiya D, et al. Association of obesity and visceral fat distribution with intima‐media thickness of carotid arteries in middle‐aged and older persons. Int Med 2008; 47: 143–149. [DOI] [PubMed] [Google Scholar]
- 13.Thomas DR. Loss of skeletal muscle mass in aging: examining the relationship of starvation, sarcopenia and cachexia. Clin Nutr 2007; 26: 389–399. [DOI] [PubMed] [Google Scholar]
- 14.Okauchi Y, Nishizawa H, Funahashi T, et al. Reduction of visceral fat is associated with decrease in the number of metabolic risk factors in Japanese men. Diabetes Care 2007; 30: 2392–2394. [DOI] [PubMed] [Google Scholar]
- 15.Stenholm S, Harris TB, Rantanen T, et al. Sarcopenic obesity‐definition, etiology and consequences. Curr Opin Clin Nutr Metab Care 2008; 11: 693. [DOI] [PMC free article] [PubMed] [Google Scholar]
- 16.Kodama K, Tojjar D, Yamada S, et al. Ethnic differences in the relationship between insulin sensitivity and insulin response: a systematic review and meta‐analysis. Diabetes Care 2013; 36: 1789–1796. [DOI] [PMC free article] [PubMed] [Google Scholar]
- 17.Butler AE, Janson J, Bonner‐Weir S, et al. β‐cell deficit and increased β‐cell apoptosis in humans with type 2 diabetes. Diabetes 2003; 52: 102–110. [DOI] [PubMed] [Google Scholar]
- 18.Minagawa Y, Saito Y. The role of underweight in active life expectancy among older adults in Japan. J Gerontol B 2020. 10.1093/geronb/gbaa013 [DOI] [PubMed] [Google Scholar]
- 19.Kimura K, Kazui S, Minematsu K, et al. Analysis of 16,922 patients with acute ischemic stroke and transient ischemic attack in Japan. Cerebrovasc Dis 2004; 18: 47–56. [DOI] [PubMed] [Google Scholar]
- 20.Suzuki S, Yamashita T, Okumura K, et al. Incidence of ischemic stroke in Japanese patients with atrial fibrillation not receiving anticoagulation therapy. Circ J 2015; 79: 432–438. [DOI] [PubMed] [Google Scholar]
- 21.Brescianini S, Maggi S, Farchi G, et al. Low total cholesterol and increased risk of dying: Are low levels clinical warning signs in the elderly? Results from the Italian Longitudinal Study on Aging. J Am Geriatr Soc 2003; 51: 991–996. [DOI] [PubMed] [Google Scholar]


