

Abstract
Hippocampal circuit alterations that differentially affect hippocampal subfields are associated with age-related memory decline. Additionally, functional organization along the longitudinal axis of the hippocampus has revealed distinctions between anterior and posterior (A-P) connectivity. Here, we examined the functional connectivity (FC) differences between young and older adults at high-resolution within the medial temporal lobe network (entorhinal, perirhinal, and parahippocampal cortices), allowing us to explore how hippocampal subfield connectivity across the longitudinal axis of the hippocampus changes with age. Overall, we found reliably greater connectivity for younger adults than older adults between the hippocampus and parahippocampal cortex (PHC) and perirhinal cortex (PRC). This drop in functional connectivity was more pronounced in the anterior regions of the hippocampus than the posterior ones, consistent for each of the hippocampal subfields. Further, intra-hippocampal connectivity also reflected an age-related decrease in functional connectivity within the anterior hippocampus in older adults that was offset by an increase in posterior hippocampal functional connectivity. Interestingly, the anterior-posterior dysfunction in older adults between hippocampus and PHC was predictive of lure discrimination performance on the Mnemonic Similarity Task (MST), suggesting a role in memory performance. While age-related dysfunction within the hippocampal subfields has been well-documented, these results suggest that the age-related dysfunction in hippocampal connectivity across the longitudinal axis may also contribute significantly to memory decline in older adults.
Keywords: hippocampus, functional connectivity, aging, anterior, posterior
1. Introduction
The hippocampus and surrounding medial temporal lobe regions are critically involved in episodic memory (Squire, 1992), with rich anatomical projections to other cortical and subcortical structures that serve to guide memory behavior (Ranganath and Ritchey, 2012). The hippocampus itself is comprised of a network of subregions, including CA1, CA3, dentate gyrus (DG), and subiculum that are organized in a functional circuit. Projections into the hippocampus from the medial temporal lobe fall into two parallel pathways: the perirhinal cortex (PRC), which receives input from cortical areas concerned with object identity (often called the “what” pathway) and the parahippocampal cortex (PHC; homologous to the rodent postrhinal cortex), which receives input from cortical areas concerned with the spatial context (often called the “where” pathway) (Suzuki and Amaral, 1994; Burwell and Amaral, 1998). These pathways are interconnected ((Burwell and Amaral, 1998; Lavenex et al., 2004) and then converge on the entorhinal cortex (ERC), which then relays it to the hippocampus via two alternative pathways: the monosynaptic pathway, connecting the ERC and CA1 directly, and the trisynaptic pathway, with projections from ERC to DG (via the perforant path) into CA3 and then into CA1 and subiculum (Witter and Amaral, 2004). The subiculum, along with CA1, then provides the dominant outflow from the hippocampus through deep layers of the entorhinal cortex and then the parahippocampal gyrus (Lavenex and Amaral, 2000; Van Strien et al., 2009).
This anatomical connectivity has important implications for memory function, such as pattern separation processes resulting from the sparse coding in the dentate gyrus and pattern completion processes derived from the recurrent collaterals in the CA3, proposed by computational models of the hippocampus (Treves and Rolls, 1994; Rolls, 2013) and supported by evidence from single-unit recordings in rodents (Neunuebel and Knierim, 2014). However, functional organization along the longitudinal axis of the hippocampus has been a growing interest in recent years (Strange et al., 2014), which may interact with both the hippocampal subfields and their external connectivity. Organization along the long axis of the hippocampus has been demonstrated in studies of gene expression (Thompson et al., 2008; Fanselow and Dong, 2010; Bienkowski et al., 2018), functional neuroimaging in humans (Small et al., 2001), electrophysiological studies (Izaki et al., 2000; Papatheodoropoulos and Kostopoulos, 2000a; b) and place field activity (Jung et al., 1994; Kjelstrup et al., 2008). Projections from CA1 to subiculum are organized along both the transverse axis and the septo-temporal axis of the hippocampus (Amaral et al., 1991), while the DG and CA3 are connected along the entire extent of the transverse axis (Gaarskjaer, 1986). The projection from CA3 to CA1 includes a dispersion of connections in the septo-temporal axis through the Shaffer collaterals (Li et al., 1994). These anatomical connectivity differences along the longitudinal axis may contribute to distinct functions in subfield processing (Amaral and Witter, 1989; Manns and Eichenbaum, 2006).
Outsides of the hippocampus, the input from the entorhinal cortex is also organized in an anterior-to-posterior (A-P) gradient, which is largely preserved in its connections to the hippocampus (Maass et al., 2015). For example, the amygdala projects to the anterior entorhinal cortex, which then connects with the anterior hippocampus, while visual information is funneled through perirhinal and parahippocampal cortices into the posterior entorhinal cortex and then to the posterior aspects of the hippocampus. Based on these observations, the theory has been proposed that the posterior extent of the hippocampus (corresponding to the dorsal hippocampus in rodents) is more likely to be involved in memory retrieval, spatial memory and navigation, while the anterior extent may be more involved in stress, emotion, goal-directed activity, and memory encoding (Moser and Moser, 1998; Bast and Feldon, 2003; Bast et al., 2009; Fanselow and Dong, 2010; Lau et al., 2010; Poppenk et al., 2013; Bienkowski et al., 2018; Grady, 2020). Moreover, the anterior-posterior axis of the hippocampus may interact with two larger cortical systems to support memory-guided behavior: an anterior temporal system that includes the PRC, lateral orbitofrontal cortex, amygdala, and ventral temporopolar cortex, and a posterior medial system that includes the PHC, retrosplenial cortex, and other “default network” regions (Ranganath and Ritchey, 2012).
Functional connectivity analysis of functional magnetic resonance imaging (fMRI) provides a popular method to evaluate correlated brain activity across structures (Raichle et al., 2001; Biswal et al., 2010). In functional connectivity analyses, correlations of activity across regions over time results in maps of intrinsic functional connectivity, both across vast cortical regions (Power et al., 2011) and within the medial temporal lobe memory system (Lacy and Stark, 2012; Shah et al., 2018). Previously, across 10 independent datasets, we found a striking pattern of sub-networks within the MTL: 1) high connectivity between the hippocampal subfields bilaterally, 2) high connectivity between entorhinal-perirhinal cortices bilaterally, and 3) high connectivity within the parahippocampal cortex bilaterally (Lacy and Stark, 2012). We were struck by the difference between the functional connectivity (consistent across task-based and resting state fMRI) and the connectivity predicted by the anatomical structure. While these data emphasize connectivity within the hippocampal circuit between subfields, they do not address potential interactions with segregation along the longitudinal axis of the hippocampus. However, Libby et al. (Libby et al., 2012) showed greater connectivity between PRC and the anterior hippocampus, whereas there was greater connectivity between PHC and posterior hippocampus in young adults. As for the subfields, CA1 and subiculum mirrored this A-P pattern with PRC and PHC, but this connectivity gradient with DG/CA3 was less robust.
Hippocampal subfields undergo age-related changes in specific ways that impact memory decline in older age and may also impact functional connectivity (Stark and Stark, 2017a). Age-related volumetric declines have been observed, cross-sectionally, in the DG/CA3 and CA1 (Mueller and Weiner, 2009; Shing et al., 2011; Stark and Stark, 2017b). Age-related changes within this hippocampal circuit may significantly contribute to memory decline and connectivity to other cortical regions (Wilson et al., 2004). Specifically, the dentate gyrus receives reduced inputs from the entorhinal cortex (Geinisman et al., 1992) and is coupled with a decrease in modulation by inhibitory neurons (Vela et al., 2003) leading to a hypoactive DG (Small et al., 2002, 2004). In contrast, a decrease in cholinergic modulation in normal aging (Perry et al., 1992) may contribute to hyperactivity in CA3 in animals (Wilson et al., 2005; Thomé et al., 2016; Haam and Yakel, 2017). Hippocampal hyperactivity has been observed in high firing rates in animals (Hasselmo and Eichenbaum, 2005) and elevated fMRI signal in humans (Miller et al., 2008; Yassa et al., 2011b). Finally, dopaminergic projections to CA1 are reduced in aging (Stemmelin et al., 2000), which may contribute to a shift in the balance of projections from CA3 to the entorhinal cortex leading into CA1. We were interested in how these age-related changes to the hippocampal circuit may be differentially impacted along the longitudinal axis of the hippocampus.
Here, we sought to examine the functional connectivity differences between young and older adults at high resolution within the MTL network, allowing us to explore how hippocampal subfield connectivity across the longitudinal axis of the hippocampus changes with age. We assessed functional connectivity primarily during an incidental encoding task (two other task-related datasets are included for comparison), providing an opportunity for hippocampal engagement in both young and older adults. Resting state scans suffer from the potential confound that young and older adults may typically engage in different tasks or thought patterns while resting, potentially introducing enough variance to obscure true differences and clouding interpretation of any differences that do come through. Consistent with this observation, in our previous work, we did not observe an age-related difference in the functional connectivity matrix for resting state data, but we did when considering functional connectivity from task-related activity (Lacy and Stark, 2012). By constraining task demands, we can eliminate this potential source of variability, which may significantly contribute to age-related differences in the default mode network (Ward et al., 2015).
Specifically, we first sought to evaluate task-based functional connectivity along the longitudinal axis of the hippocampus to the ERC, PRC, and PHC in both young and older adults. We anticipated replicating earlier findings, showing greater connectivity in older adults between anterior hippocampus and PHC than PRC (Blum et al., 2014). Next, we evaluated hippocampal subfield connectivity to the MTL network in both young and older adults, hypothesizing reduced connectivity of DG/CA3 in older adults given age-related functional activity dysfunction in this region (Yassa et al., 2011a). Finally, we explored functional connectivity along the longitudinal axis of the hippocampus for each of the subfields, taking into account the disproportionate representation of these regions along the A-P axis.
2. Materials & Methods
2.1. Participants
A total of 31 young (18F/13M; mean age = 29 years (20–39); mean education = 16.1 years) and 31 older (16F/15M; mean age = 76 years (70–86); mean education = 17 years) adults were recruited from the University of California, Irvine and surrounding area(s). They provided written consent in compliance with the UCI Institutional Review Board and were compensated for their participation. All participants were screened for history of neurological disease or psychiatric illness, spoke fluent English, were right-handed, had normal or corrected-to-normal vision, and no contraindications for MRI. To determine cognitive status, all participants also completed the Mini Mental State Exam (Folstein et al., 1975). Young participants scored 29–30 (mean = 29.4) and older adults scored 27 or above (mean = 28.7), all in the normal range for their age, with lower scores for older adults than younger adults (t(60) = 2.56, p <.02).
2.2. Mnemonic Similarity Task (MST)
During a behavioral testing session separate from the scan date, participants completed the MST (publicly available here: https://faculty.sites.uci.edu/starklab/mnemonic-similarity-task-mst/) using sets C & D. In the first phase, participants engaged in an incidental encoding task consisting of an indoor/outdoor judgment for each object (based on their opinion with no right or wrong answer) via a button press (128 items total, 2s object presentation and 3s scene presentation time, 0.5s ISI). Immediately following the encoding task, participants were shown video instructions describing the test phase to ensure consistent delivery of the instructions. In the test phase, they engaged in a modified recognition memory test in which they identified each item as “Old”, “Similar”, or “New” via button press (192 items total – 64 repeated items, 64 lure items, and 64 foil items; 2.5s/3s each, ≥0.5s ISI). The image disappeared from the screen after 2.5s (or 3s in the case of scenes), replaced by a white screen until participants responded. This enables participants to respond at whatever pace they feel comfortable with but does not allow for variable time in inspecting the image. One-third of the images in the test phase were exact repetitions of images presented in the encoding phase (targets or repeats); one-third of the images were new images not previously seen (foils); and one-third of the images were similar to those seen during the encoding phase, but not identical (lures). These trial types were randomly intermixed during the test.
As in our prior work (Stark et al., 2013, 2015; Stark and Stark, 2017b), the Lure Discrimination Index (LDI) was calculated as the difference between the rate of “Similar” responses given to the lure items minus “Similar” responses given to the foils (to correct for any response biases). Recognition (REC) for repeat items was calculated as the difference between the rate of “Old” responses given to repeat items minus “Old” responses given to foils (aka “corrected recognition memory scores”). These scores correct for any response bias on a per-subject basis.
2.3. fMRI task
Each of 8 fMRI runs consisted of 96 objects presented in a continuous incidental encoding paradigm that mirrors the MST but does not have an explicit memory demand. This task is virtually identical to the task we have used several times previously (Bakker et al., 2008; Lacy et al., 2011). These items were different from those viewed in the behavioral MST. Each item was presented for 2.4 seconds, followed by an inter-trial interval of 0.29 seconds. Participants were instructed to indicate if each item was an “indoor” or an “outdoor” item, with an emphasis that there was no correct answer and to simply respond with their best guess. 384 of these items were novel foils that were never repeated while 96 items were later repeated (repeats) and 96 additional items were repeated with items that were similar, but not exactly the same (lures). In total, there were 768 trials divided into 8 runs of 96 trials each. The data that supports the findings of this study are available from the corresponding authors upon reasonable request.
2.4. Imaging Parameters
All scanning was performed on a Phillips 3.0 Tesla Scanner (Best, the Netherlands), using a 32-channel sensitivity encoding (SENSE) (Pruessmann et al., 1999) head coil at the Research Imaging Center at UC Irvine. We employed a high-resolution fMRI sequence in order to explore hippocampal subfield activity, limiting our field-of-view on this scanner and restricting our data collection to the hippocampus and surrounding medial temporal lobe. During each of 8 scanning runs, 173 T2*-weighted, single-shot echo-planar volumes were acquired angled parallel to the long axis of the hippocampus and covering most of the MTL in 22 slices. Each slice was 1.3 mm thick separated by a 0.2 mm gap. Functional pulse sequences had a repetition time (TR) of 1500 ms, an echo time (TE) of 26 ms, a flip angle of 70°, an acquisition matrix size of 128 × 128 mm, a field of view (FOV) of 180 × 180 mm, and a SENSE factor of 2.5, resulting in an in-plane resolution of 1.5 × 1.5 mm (scan resolution is 120×120). The first four functional volumes were discarded to accommodate for T1 equalization. Additionally, T1-weighted whole-brain anatomical images were acquired using a sagittal magnetization-prepared rapid gradient echo (MP-RAGE) scan (TR 11ms; TE 4.6 ms; flip angle 18°; matrix size 320 × 320 mm; FOV 240 × 240 × 150 mm; resolution 0.75 mm isotropic; 200 slices). Finally, we collected high-resolution T2-weighted scans (TR 3000ms; TE 80ms; flip angle 18°; matrix size 360 × 360 mm; FOV 108 × 108 × 180 mm; voxel size of 0.469 × 0.469 × 2mm; 54 slices) that were aligned as oblique coronals perpendicular to the long-axis of the hippocampus and positioned to cover the entire structure.
2.5. fMRI Pre-processing
We used Analysis of Functional Neuroimages (AFNI; version 17.1.09)(Cox, 1996) software to perform most of the imaging data analyses. Functional data for these analyses were slice-time and motion corrected using six rigid-body transformation parameters using the function align_epi_anat.py (Saad et al., 2009). In order to reduce the effects of physiological noise in the BOLD signal, we passed the filtered data through ANATICOR (Jo et al., 2010) using the white matter and CSF maps created from Freesurfer. We used AFNI’s 3dTproject function to apply a temporal bandpass filter of 0.009 to .08, to censor TRs that had excessive motion (0.5mm and/or 0.5 degrees) and the following TR, and to regress out the global mean signal for each run. We calculated the percentage of TRs removed for younger (mean = .005) and older (mean = .011) adults and found that there was no reliable difference between groups (t(60) = −1.6, p = .11). While there is considerable debate regarding the removal of the global signal (Liu et al., 2017; Murphy and Fox, 2017; Power et al., 2017), we reasoned that removing the global mean signal would better address spurious and inflated correlations due to motion. Further, we are focusing here on relative differences in connectivity between groups rather than the degree of connectivity per se, which should be preserved here even if negative correlations were induced by the removal of the global mean signal. In addition, we used non-whitened time courses because we thought it unlikely to induce these effects, but we do acknowledge the potential biases in coefficient estimates that have been reported from such autocorrelations (Arbabshirani et al., 2014). Each subject’s anatomical image was segmented into grey matter, white matter, and cerebral spinal fluid probability (CSF) maps using Freesurfer (Dale et al., 1999; Fischl et al., 2002). Each run was then concatenated into a single time series for each participant.
Both the whole-brain and high-resolution functional data were aligned to the participant’s MP-RAGE using the script align_epi_anat.py (Saad et al., 2009) from AFNI (Cox, 1996). Each participant’s structural scan and functional data (statistical maps) were aligned to a model template using ANTs (Advanced Normalization Tools; Avants et al., 2008), which normalizes each participant’s T1-weighted MP-RAGE to a template space based on MNI coordinates but derived from previous work in our lab (Lacy et al., 2011). Briefly, it is based on a central tendency of 20 healthy adults (including younger and older adults) previously aligned to MNI space. ANTS combines a 12-parameter affine registration with a diffeomorphic 3D vector field mapping (Syn) to perform invertible, smooth mappings between the original participant space and the model template space.
To segment the MTL and calculate MTL volumes for individuals in the current study, we used previously-created multi-atlas models, created using ASHS (Yushkevich et al., 2010) and 19 independent hand-segmented brains (both the T1 MP-RAGE and high-resolution T2 images). One model’s segmentations included both segmentations of the parahippocampal gyrus into perirhinal (PRC), parahippocampal (PHC), and entorhinal (ERC) cortices described previously (Insausti et al., 1998; Stark and Okado, 2003). The second model included segmentations of the hippocampus into 3 regions (see Supplemental Figure S1): a combined dentate gyrus and CA3 (DG/CA3), CA1, and subiculum, based on our previous work (Stark and Stark, 2017b). Briefly, these prior hand segmentations treated the Duvernoy subfield segmentations (Duvernoy et al., 2005) as templates for eight coronal slices along the anterior-posterior axis of the hippocampus. Representative slices in each hippocampus that best (closest) resembled the template slices from Duvernoy were chosen and segmented according to the atlas description. The segmentation then proceeded from these slices in both directions slice by slice to ensure a smooth transition across slices. We should note that, along with other recent work of ours using this approach (Stark and Stark, 2017b), our precise definition of the CA1/subiculum boundary was updated to reflect the efforts of the HS3 Group presented at the 5th Annual Hippocampal Subfield Segmentation Summit (November 11, 2016). Each subject’s T1 and T2 scan were then fed into ASHS using both the PHG and subfield multi-atlas. Briefly, ASHS performs a non-linear registration between a new participant’s structural scan and each of the scans in the multi-subject atlas using ANTS (Avants et al., 2008). A voting procedure was then enacted to determine an initial segmentation based on the degree of deformation needed to warp the new participant onto each atlas (less deformation needed implies a higher degree of match and therefore a greater weight of that individual atlas to the segmentation).
Finally, an AdaBoost technique was used to detect and remove segmentation biases. ASHS has been well-validated by comparison to gold-standard hand segmentations and found to be nearly as reliable as inter-rater reliability across expert hand segmenters in both the hippocampal subfields (Yushkevich et al., 2010) and in the PHG structures (Yushkevich et al., 2015), with Dice coefficients ~0.8. Following segmentation from each model, labels were combined across hemispheres and models (preference given to hippocampal over PHG labels) and the result was visually inspected for gross errors. As hand tuning of segmentations can introduce biases unless highly stringent procedures are in place, hand tuning would only be done in the case of gross errors. None were found in the present dataset and the output of ASHS, unadjusted, was therefore used here.
To examine the long-axis, we split the hippocampal segmentations into six regions (Figure 1A). First, we divided the template-space brain into equally spaced slices along a roughly 30 degrees forward-facing angle (aligned with the angle of the hippocampus), resulting in 6 segments with roughly the same number of voxels, separated by small gaps to reduce partial volume effects. The first three segments corresponding the anterior hippocampus and the last three segments corresponding to the posterior hippocampus were consistent with the A-P divide employed by other groups (Blum et al., 2014; Langnes et al., 2020). Then we warped this template into subject-specific space and multiplied it by the subject-specific segmentations, creating even segmentations along the longitudinal axis of the hippocampus.
Figure 1.
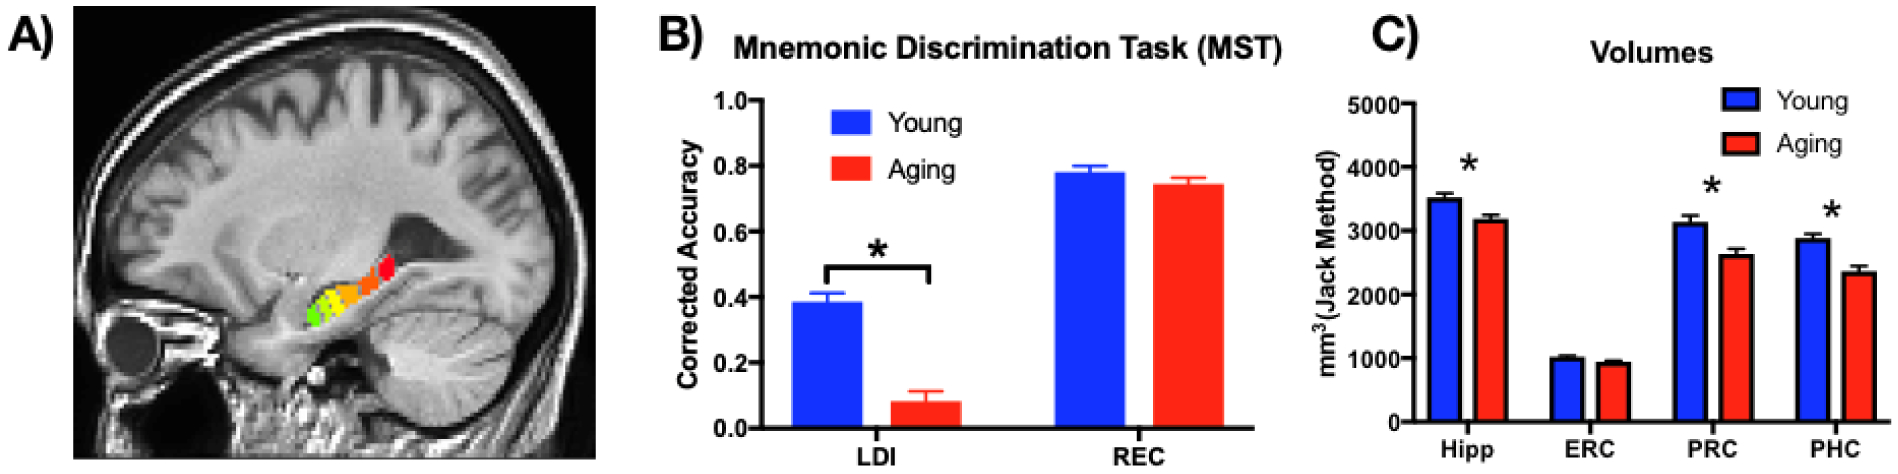
A) Segmentation of the hippocampus into 6 roughly equivalent regions along the anterior-posterior axis. B) Behavioral performance on the MST demonstrating impaired lure discrimination performance in older adults, but intact recognition performance. LDI – lure discrimination index; REC – recognition memory index C) Younger adults had greater volume than older adults in the hippocampus, PRC, and PHC. Hipp – hippocampus, ERC – entorhinal cortex, PRC – perirhinal cortex, PHC – parahippocampal cortex. * p < .05
Finally, intracranial volume was calculated by a Freesurfer (Fischl et al., 2002) segmentation of the MP-RAGE based on a combination of white matter, gray matter, and cerebral spinal fluid. To adjust for head size and age, we calculated an adjusted volume for each structure in cubic millimeters (mm3), such that the adjusted Volume = raw volume − b × (ICV − mean ICV), where b is the slope of the regression of an ROI volume on ICV (Jack et al., 1989). We calculated the slope of the regression for each ROI and the mean ICV based on a larger lifespan dataset (n= ~160, ages 20–89 years old) that we have published on previously (Bennett and Stark, 2015; Bennett et al., 2015). The adjusted volumes were calculated for the left and right ROIs separately and then averaged.
2.6. Functional Connectivity Analyses
To assess functional connectivity between the hippocampus and medial temporal lobe, we employed ROI-to-ROI correlation analyses. Functional connectivity refers to the temporal correlations of the time series between spatially separated brain regions. Using 3dTproject (AFNI), we extracted the average residual time-series across the entire scan, irrespective of task condition (removing effects of motion and noise – see above), for each ROI. Pearson’s r correlation coefficients were then calculated between regions and then Fisher’s r-to-z transformed. All further statistical analyses were performed using Prism 7.0d (www.graphpad.com) and custom Python scripts. Data and code will be made available upon request and comply with the requirements of the funding body and institutional ethics.
We chose to report bivariate correlations for their simplicity, as opposed to partial correlations, which are more vulnerable to detecting false connections (Smith et al., 2011; Epskamp and Fried, 2018; Zhu and Cribben, 2018). In particular, the observed correlation between two regions might be the result of a lack of any true connectivity between them and shared correlation with an un-observed third region. However, as it was not our goal to determine the source driving the difference in connectivity along the longitudinal axis of the hippocampus, or to place any particular value on any one of the hippocampal segments, we chose to utilize bivariate correlations for their simplicity and their relative lack of statistical assumptions. Thus, we make no claims about the direction of influence or the directness of influence in any of our results. Similarly, we did not control for multiple comparisons across all of the statistical tests reported in this paper, setting a threshold of p <.05 for statistical significance and correcting for multiple comparisons within each individual analysis. For confidence in the reliability of the results, we have first turned to examining the same question and looking for consistency across alternate analysis paths. Importantly, we have included replications of our results in two additional datasets, emphasizing the reliability of these results.
3. Results
3.1. MST behavioral results
We tested for a replication of our earlier findings in each measure from the MST independently: namely, matched recognition performance between older and younger adults, with an age-related decrease in LDI performance. Therefore, LDI and REC scores for younger and older adults were entered into a 2×2 ANOVA (Prism 7.0d), with factors of Age and Test Type (Figure 1B). We observed a main effect of Age (F(1,60) = 52.1, p<.0001), a main effect of Test Type (F(1,60) = 462.1, p<.0001), and an interaction (F(1,60) = 29.38, p<.0001). Bonferroni-corrected multiple comparisons showed no difference in REC (Young=0.78 vs Aging=0.74), but a significant reduction in LDI for older (0.08) compared to younger (0.38) adults (t(120) = 8.9, p<.0001). Thus, consistent with our previous findings (Stark et al., 2013, 2015; Stark and Stark, 2017b), older adults reliably demonstrate greatly reduced lure discrimination performance for related lure items, while recognition memory for repeated items remained intact.
3.2. Functional connectivity along the longitudinal axis of the hippocampus
To evaluate whether connectivity along the long axis of the hippocampus differed for young and older adults, we calculated functional connectivity along the 6 hippocampal (Hx) segmentations to three separate medial temporal lobe regions: ERC, PRC, and PHC. We chose to average across left and right hemispheres here to reduce the number of comparisons and because we had no a priori predictions based on hemisphere. These data were entered into a 2×6 repeated-measures ANOVA with age (young or aging) and region (1,2,3,4,5,6) as variables for each region. All three regions (ERC, PRC, and PHC) showed a main effect across the six hippocampal subdivisions (main effect of region: ERC: F(5,300) = 3.1, p<.01; PRC: F(5,300) = 6.8, p<.0001; PHC: F(5,300) = 7.8, p<.0001). While ERC showed no main effect of age or interaction (Supplemental Figure 2D), we observed (Figure 2A–B) greater connectivity between the Hx and PHC (F(1,60) = 11.1, p <.01) for younger than older adults and a similar effect of age in the PRC (F(1,60) = 3.4, p = .07), although it did not quite pass our statistical threshold. In addition, FC with PHC changed across the six hippocampal subdivisions with a significant interaction (F(5, 300) = 3.0, p<.014). Šidák’s multiple comparisons tests on each of the 6 regions revealed greater FC in young than older adults for the three most anterior regions (1: t(360) = 2.9, p<.02; 2: t(360) = 4.7, p<.0001; 3: (t(360) = 2.7, p <.05), but not the three most posterior regions (4: t(360) = 2.3, p=.13; 5: t(360) = 1.9, p=.31; 6: t(360) = 1.5, p=.54).
Figure 2.
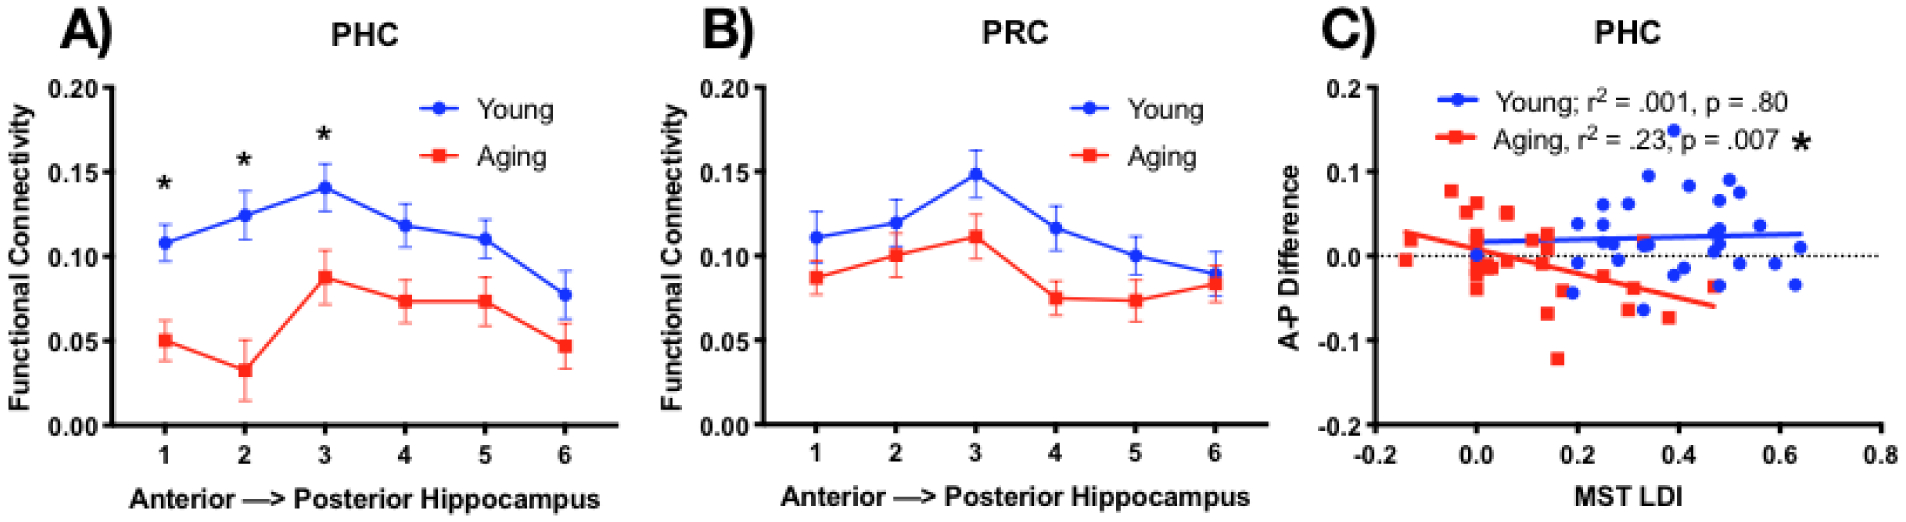
A) Functional connectivity between the hippocampus and PHC is greater for young than aging adults in the anterior portions of the hippocampus. B) Similar age-related decrease in FC between Hx-PRC, but no difference across the longitudinal axis of the hippocampus. C) The Hx-PHC FC connectivity slope along the longitudinal axis of the hippocampus predicts lure discrimination performance (LDI) in older adults, but not in younger adults. * p < .05
To assess whether the age-related decline in anterior FC was selective for PHC, we averaged the correlation coefficients for the first three segments (anterior) and last three segments (posterior) of the hippocampus and entered these data into a 2×2×2 repeated-measures ANOVA with age (young or aging), region (PRC or PHC), and hippocampal segment (anterior or posterior) as variables. Importantly, we found a 3-way interaction demonstrated the differing patterns for PRC and PHC (F(1,60) = 3.94, p =.05), emphasizing the greater drop in FC in the anterior hippocampus to PHC that is not present with PRC. Thus, these data support greater functional connectivity dysfunction associated with age along the longitudinal axis of Hx-PHC than in Hx-PRC.
To determine the reliability of these findings, we applied the same analyses to two additional datasets (see Supplemental Materials): another incidental encoding task (using scenes in this case) and a continuous recognition memory test. Both tested similar age ranges and in both cases, we found stronger age-related reductions in Hx-PHC FC in the anterior regions of the hippocampus than in the posterior regions (Supplemental Figure 2). In addition, consistent with our main analysis, we did not observe strong evidence for similar effects in the PRC. Thus, we have replicated these basic findings twice. In addition, we explored these findings without the global signal regression, given the controversies surrounding this step in the processing. We replicated these results, emphasizing the stability of these findings (see Supplemental Materials S3). While the mean number of TRs removed for motion was not different between groups, the mean framewise displacement was greater in the aging than the young group. We evaluated these results after removing participants from each group to match mean framewise displacement between groups and again, replicated these findings, demonstrating that any issues regarding motion have not induced these effects (see Supplemental Materials S4). Finally, we explored whether there was hemispheric asymmetry in these findings by examining each FC relationship within hemisphere (see Supplemental Materials S5). We found some evidence for hemispheric asymmetry, with larger effects present in the right than left hemisphere, but both hemispheres showed a consistent age-related decrease in Hx-PHC functional connectivity. Perhaps the use of visual stimuli, more predominately represented in the right hemisphere, contributed to the greater effects observed there.
We were concerned that age-related reductions in volume might alter the FC between regions. Indeed, when we entered the corrected volumes into a 2×4 ANOVA, we found greater volumes for the young than older adults (main effect of age: F(1,60) = 57.4, p<.0001), differences in overall regional volumes (main effect of region: F(3,180) = 691.5, p<.0001) and an interaction (F(3,180) = 6.7, p<.001). Post-hoc Šidák’s multiple comparisons revealed greater volumes for young than aged adults for the hippocampus (t(240) = 3.5, p<.01), PRC (t(240) = 5.3, p<.001), and PHC (t(240) = 5.5, p<.001) (Figure 1C). Therefore, we examined FC for Hx-PHC, regressing out volume on an individual basis for both the hippocampus and parahippocampal cortex. Even when controlling for differences in volume, we found that FC changed across the six hippocampal subdivisions (main effect of region: F(5,300) = 7.8, p<.0001) and an interaction (F(5,300) = 2.9, p<.05), largely driven by greater FC in young adults for hippocampal segment 2 (t(360) = 3.2, p<.01). Thus, volume decreases associated with aging are not artificially altering the observation of a larger reduction in functional connectivity between the Hx-PHC in the anterior regions of the hippocampus than the posterior regions.
To address whether there is an age-related decrease in signal to noise, perhaps from a change in vasculature (D’Esposito et al., 2003; Ances et al., 2009) in the MTL that might have induced our observed age-related declines, we calculated the signal-to-noise ratio (SNR) in each of our ROIs as ratio of the mean signal divided by the standard deviation across samples for each voxel (AFNI’s cvarinv metric in 3dTstat). Table 1 shows the mean SNR and standard deviation of this SNR measure for each ROI for both younger and older adults (see Supplemental Table 1 for the mean signal, SNR, and SD). There were no significant age-related differences in SNR in any of these regions, but the SNR is reduced in ERC compared to the other ROIs for both younger and older adults. The high-resolution imaging protocol used here exacerbates signal drop-out in ERC and may account for the lack of age-related deficits in functional connectivity between Hx-ERC.
Table 1:
Mean SNR and standard deviation for each ROI for Young and Aging adults.
| ERC | PRC | PHC | DGCA3 | CA1 | Subiculum | |
|---|---|---|---|---|---|---|
| Young | 9.76 (1.75) | 12.06 (1.65) | 13.48 (2.32) | 14.52 (1.34) | 14.76 (1.34) | 13.17 (1.36) |
| Aging | 9.75 (1.46) | 12.42 (1.59) | 13.71 (2.62) | 13.98 (1.41) | 14.23 (1.33) | 12.84 (1.40) |
Finally, we were interested in the relationship between Hx-PHC functional connectivity and lure discrimination performance on the MST. We already observed that older adults are impaired on lure discrimination relative to younger adults, which has been linked to reductions in hippocampal volume (Stark and Stark, 2017b) and functional activity in the hippocampus (Yassa et al., 2011a; b). Thus, functional connectivity along the long axis of the hippocampus-PHC in older adults is predictive of memory performance on a hippocampal-dependent task.
3.3. Functional connectivity in hippocampal subfields
Connectivity along the longitudinal axis of the hippocampus does not take into account the subfield circuit known to be critical for hippocampal computations. Therefore, we sought to explore functional connectivity of the hippocampal subfields: DG/CA3 (combined due to resolution constraints), CA1, and the Subiculum with the medial temporal lobe cortices. In our previous work, we have shown a clear pattern of three subnetworks of functional connectivity: 1) within the hippocampal subfields, 2) entorhinal-perirhinal cortices, and 3) parahippocampal cortex (Lacy and Stark, 2012). This pattern was reliable and likely represents a pattern of intrinsic connectivity within the MTL (Shah et al., 2018), much like similar patterns observed at the whole brain level (Cole et al., 2014). From these findings, we created a model of functional connectivity within the MTL (Figure 3A) that we correlated with the functional connectivity from the current dataset. Consistent with our previous findings. Both the Young (Figure 3B) and Aging (Figure 3C) matrices fit the same pattern: relatively high correlation coefficients amongst the hippocampal subfields, between bilateral ERC-PRC, and between bilateral PHC. Akin to our prior work, we calculated z-transformed correlation coefficients between this intrinsic connectivity model and each subject’s matrix (lower-triangle only) and between the anatomically-based model outlined above and each subject’s matrix. Both young and aged subjects correlated reliably with the prior model (young z=0.54, t(30)=15.2, p<0.0001; aged z=0.53, t(30)=16.5, p<0.0001) and not the anatomically-based model (young t(30)=1.0, p=0.31; aged t(30)=0.72, p=0.48). There was no evidence for an age-related difference in the correlation with either the intrinsic connectivity model (t(60)=0.22, p=0.83) or the anatomically-based model (t(60)=1.23, p=0.22).
Figure 3.
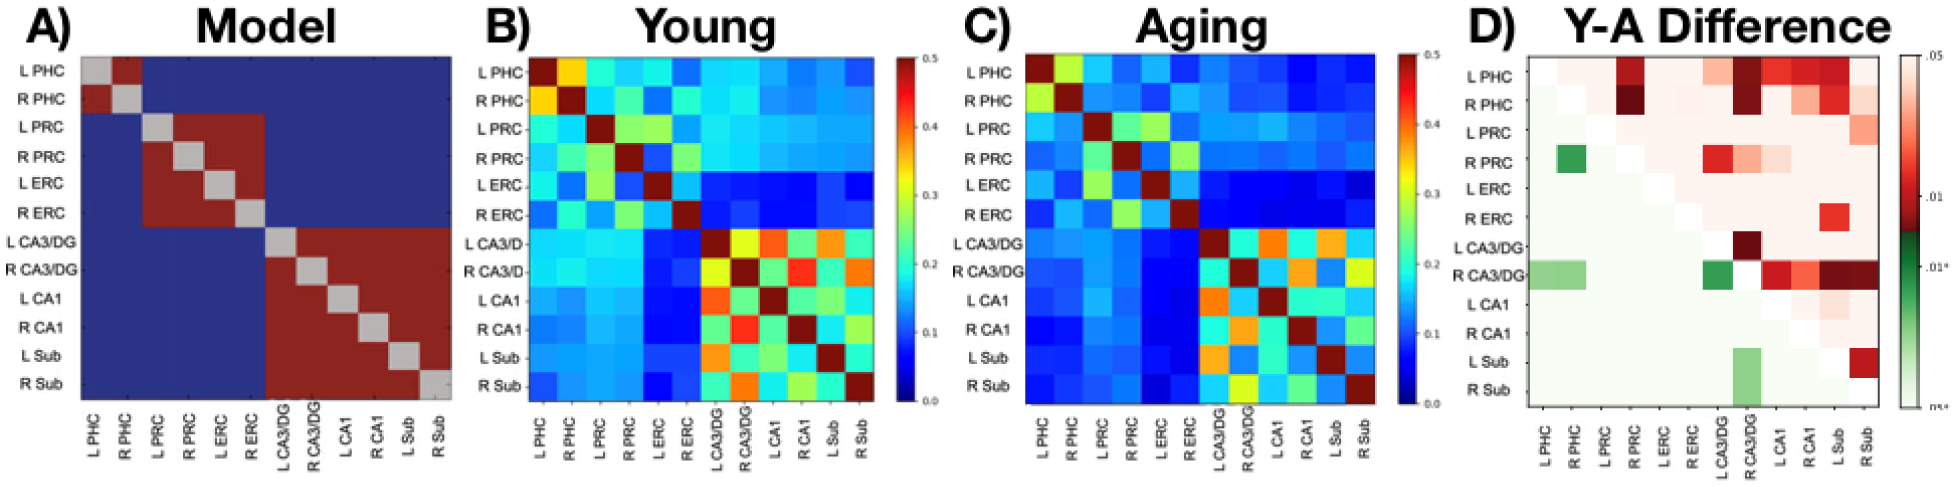
A) Model of functional connectivity based on Lacy et al. (2011). B) Functional connectivity matrix for young adults and C) older adults. D) Difference matrix testing whether regions showed greater connectivity in young than old. Values above the diagonal (reds) are uncorrected p-values while values below the diagonal (greens) reflect corrections for multiple comparisons.
Directly contrasting the young and old matrices, we identified several regions of greater FC for young adults compared to older adults by contrasting the z-transformed correlation coefficient matrices across groups using unpaired t-tests both without and with FDR-based corrections for the 66 comparisons (Figure 3D). Adjusting for multiple comparisons with a false-discovery rate (FDR) of Q = .05, younger adults had significantly greater FC in the following regions (see Table 2):
Table 2.
Younger adults had significantly greater FC between these regions than older adults.
| Region | Young FC | Aging FC | t-value | p-value, uncorrected | q-value |
|---|---|---|---|---|---|
| right DG/CA3 ↔ left DG/CA3 | .312 | .191 | t(31) = 3.43 | p=.00055 | q=0.016 |
| right DG/CA3 ↔ left Subiculum | .210 | .130 | t(31) = 3.06 | p=.0016 | q=.029 |
| right DG/CA3 ↔ right Subiculum | .390 | .308 | t(31) = 2.96 | p=.0022 | q=.029 |
| right DG/CA3 ↔ left PHC | .173 | .104 | t(31) = 2.86 | p=.0029 | q=.029 |
| right DG/CA3 ↔ right PHC | .180 | .100 | t(31) = 2.93 | p=.0024 | q=.029 |
| right PHC ↔ right PRC | .219 | .128 | t(31) = 3.55 | p=.00038 | q=0.016 |
| left PHC ↔ right PRC | .167 | .112 | t(31) = 2.48 | p=.008 | q=0.069 |
Again, we found supporting evidence for these findings in two additional datasets (Supplemental Figure 3), emphasizing an age-related decrease in functional connectivity for DG/CA3 and PHC, and to a lesser degree, CA1 and subiculum. There is also some laterality asymmetry (notably, right DG/CA3), but it was not reliable enough across datasets to draw strong conclusions. Importantly, these results demonstrate that age-related modulation of the functional connectivity can be characterized by a general decline in hippocampal functional connectivity that appears most robust in the DG/CA3. However, it is worth noting that regressing volume out of these regions reduces, but does not eliminate, the age-related deficits in functional connectivity in this matrix (see Supplemental Figure 4). We next explore how these two approaches intersect: how does connectivity along the longitudinal axis of the hippocampus vary across individual subfields?
3.4. Relationship between hippocampal subfields and MTL along the longitudinal axis of the hippocampus
In section 3.2, we established that there is an age-related decrease in Hx-PHC FC, particularly in the anterior hippocampus. Then, in section 3.3, we found an age-related decrease in FC between DG/CA3-PHC. Here, we explored the connectivity within each subfield (DG/CA3, CA1, and Subiculum) to PHC and PRC along the longitudinal axis of the hippocampus. We applied the 6-segmentation mask to the hippocampal segmentation mask and correlated activity in each region to the PHC and PRC, collapsing across hemispheres to increase signal-to-noise and power (Figure 4A–F). These data were entered into a 2×6 repeated-measures ANOVA with age (young or aging) and region (1–6) as variables for each subfield. For PHC, all three subfields showed greater connectivity for younger than older adults (main effect of age: DG/CA3: F(1,60) = 8.3, p <.01; CA1: F(1,60) = 7.5, p<.01; Sub: F(1,60) = 4.8, p<.05) and a main effect across the six regions for DG/CA3 (main effect of region: DG/CA3: F(5,300) = 10.10, p<.0001; Sub: F(5,300) = 4.3, p<.001). In addition, there was an interaction in CA1 (F(5, 300) = 3.5, p<.01). For PRC, only DG/CA3 showed a greater connectivity for younger than older adults (main effect of age: DG/CA3: F(1,60) = 6.9, p <.05), but all three subregions showed a main effect across the six regions (main effect of region: DG/CA3: F(5,300) = 7.0, p<.0001; CA1: F(5,300) = 7.2, p<.0001; Sub: F(5,300) = 4.4, p<.01), and no interactions. To assess whether the age-related decline in anterior FC was selective for PHC, we averaged the functional connectivity for the first three segments (anterior) and last three segments (posterior) of the hippocampus and entered these data into a 2×2×2 repeated-measures ANOVA with age (young or aging), region (PRC or PHC), and hippocampal segment (anterior or posterior) as variables. While this analysis on the whole hippocampus demonstrated a 3-way interaction (Section 3.2), none of the subfields crossed the p<.05 threshold, despite showing the same pattern of results as the whole hippocampus and as each other. Quite likely, the reduction in SNR resulting from dividing the A-P regions even further accounts for this. Regardless, the most parsimonious account of these data is that the greater drop in anterior hippocampal FC with the PHC is consistent across each of the hippocampal subfields and not strongly driven by any particular subfield.
Figure 4.
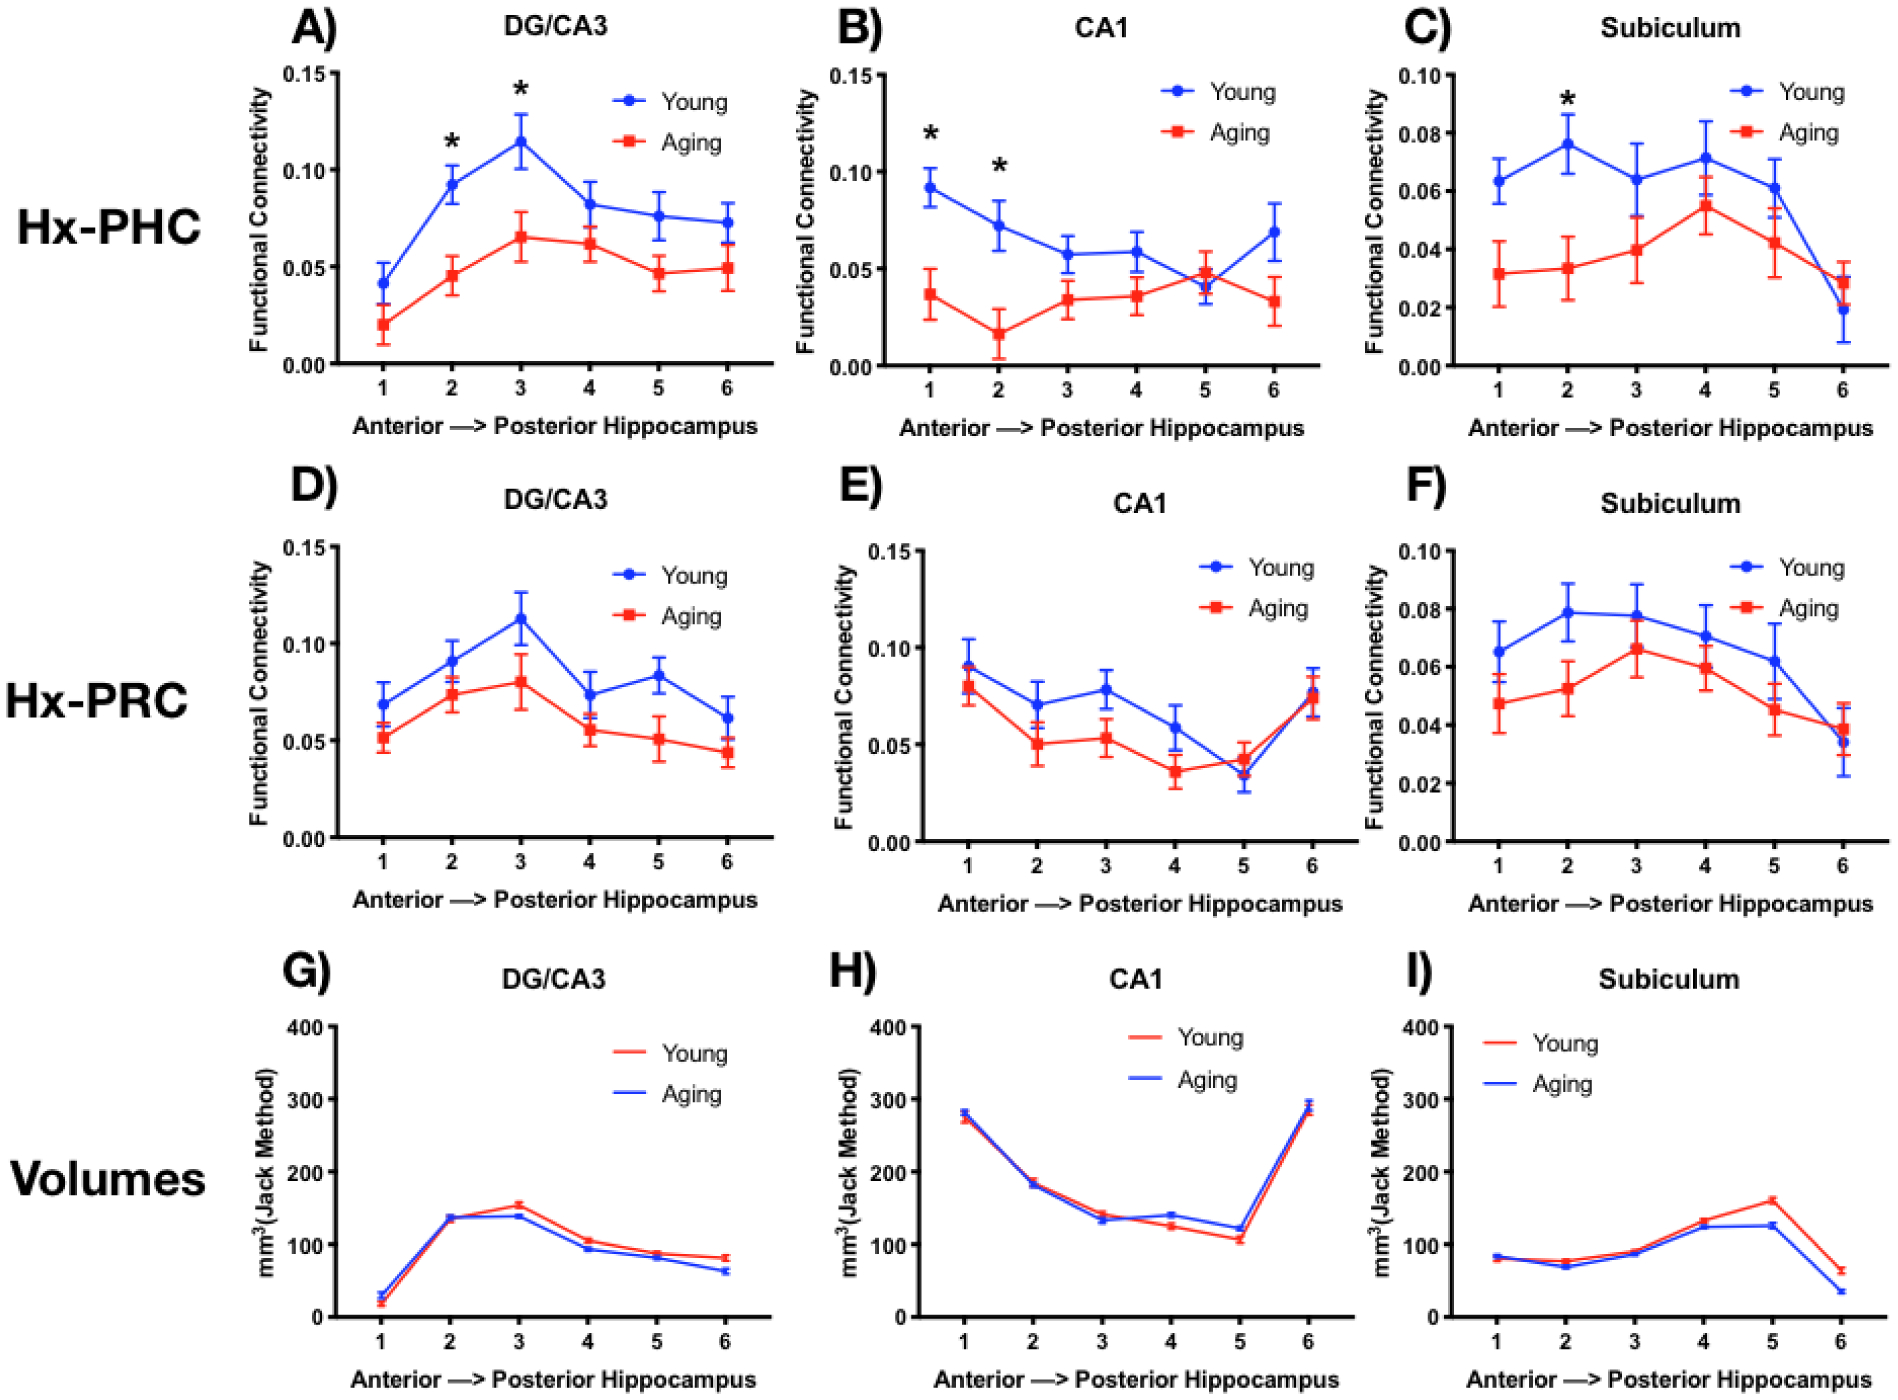
Functional connectivity was greater in young than older adults between each hippocampal subfield and PHC: DG/CA3 (A), CA1 (B), and Subiculum (C): and PRC: DG/CA3 (D), CA1 (E), and Subiculum (F). While there were fewer voxels in DG/CA3 and Subiculum in older adults, the distribution of representation across the longitudinal axis revealed more voxels in the anterior than posterior region for DG/CA3 (G), while CA1 showed a u-shaped distribution (H), and the Subiculum had a greater number of voxels in the posterior regions (I).
We next investigated the possibility that our earlier observation of functional connectivity modulation along the longitudinal axis arose not from the longitudinal axis per se, but from the fact that the subfields are not distributed evenly across the long axis (Figure 4G–I). Could differential changes in subfield volume with age or interactions along the long axis induce our previously-observed age-related changes in functional connectivity? For each subject, we calculated subfield volumes in each of our six long-axis segments and entered these data into a 2×6 repeated-measures ANOVA with age (young or aging) and segmentation along the longitudinal axis (1–6) as variables for each subfield (CA1, DG/CA3, subiculum) separately. Overall, a main effect of region was found for all three subfields, demonstrating a non-uniform distributions across the long axis (DG/CA3: F(5,300) = 493.3, p<.0001; CA1: F(5,300) = 635.8, p<.0001; Subiculum: F(5,300) = 420.2, p<.0001). Younger adults had greater volume in DG/CA3 than older adults (main effect of age: F(1,60) = 6.0, p<.02), with this effect being more pronounced in the posterior hippocampus (age × region interaction F(5,300) = 7.9, p<.0001). Similar results were observed in subiculum, with an age-related reduction in volume (main effect of age: F(1,60) = 31.4, p<.0001) that was more pronounced in posterior regions (age × region interaction (F(5,300) = 18.9, p<.0001). Interestingly, there was no age-related decrease in CA1(main effect of age: F(1,60) = 1.8, p=.18).
These volumetric differences emphasize three critical points: 1) the distribution of subfields is not even across the longitudinal axis of the hippocampus, with greater representation of DG/CA3 in anterior regions (segments 2 and 3) and the opposite pattern in the Subiculum (segments 4 and 5), while CA1 shows a more U-shaped distribution with the greatest representation at the head and tail. 2) age-related volume changes are not uniform across the hippocampus, but appear to be more specific to the DG/CA3 and subiculum, particularly in the more posterior regions of hippocampus; and 3) while age-related volume changes are greater in posterior portions of the hippocampus, our functional connectivity changes were greater in more anterior portions of the hippocampus, making this a highly unlikely account for the observed functional connectivity results. Finally, it is worth noting that the first subregion in DG/CA3 and the last subregion in the subiculum both contain very few voxels, so FC from those regions should be interpreted with caution. However, removal of these regions did not change any of the main findings, so we included them to remain consistent across each of the analyses.
3.5. Functional connectivity within the longitudinal axis of the hippocampus
Having established the FC profiles along the longitudinal axis of the hippocampus with the MTL, we sought to explore FC within the hippocampus itself. A recent investigation in young adults showed greater inter-voxel similarity for the anterior than the posterior hippocampus, indicating greater FC within the anterior portion (Brunec et al., 2018). Inter-voxel similarity captures the correlation in activity across separate voxels in an ROI, reflecting the similarity in signal from spatial separable voxels with an ROI. In this way, the coherence of activity within a region can be assessed. Similarly, we were interested in how age-related change along the longitudinal axis of the hippocampus may influence the connectivity among these regions. To mirror this prior inter-voxel similarity analysis, we first calculated the z-transformed correlation coefficients for every pair of voxels within each subject’s hippocampus and averaged these according to segment to create average segment to segment correlation scores (e.g., average of all segment 1 to segment 1 correlations, average of all segment 1 to segment 2 correlations, etc. leading to 6×6 correlation matrices). We then compared the Young and Aged groups for the left and right hemispheres (Figure 5). In particular, as a direct test of this hypothesis, we examined the diagonals of the matrices by first regressing out the average pattern along the long axis (regardless of age) and then examining how inter-voxel similarity varied by age along the long axis. We found a striking apparent pattern consistent with the age-related pattern observed by Brunec et al. (Brunec et al., 2018). In both the left and right hemisphere, younger adults showed a pattern of decreasing inter-voxel similarity moving from anterior to posterior while older adults showed the reverse (Figure 5 B&D). Using a simple linear regression, we determined that a single slope value did not adequately model the young and older datasets and therefore, their slopes differed (extra sum of squares left: F(1,368) = 4.1, p<.05; right: F(1,368) = 11.04, p<.01).
Figure 5.
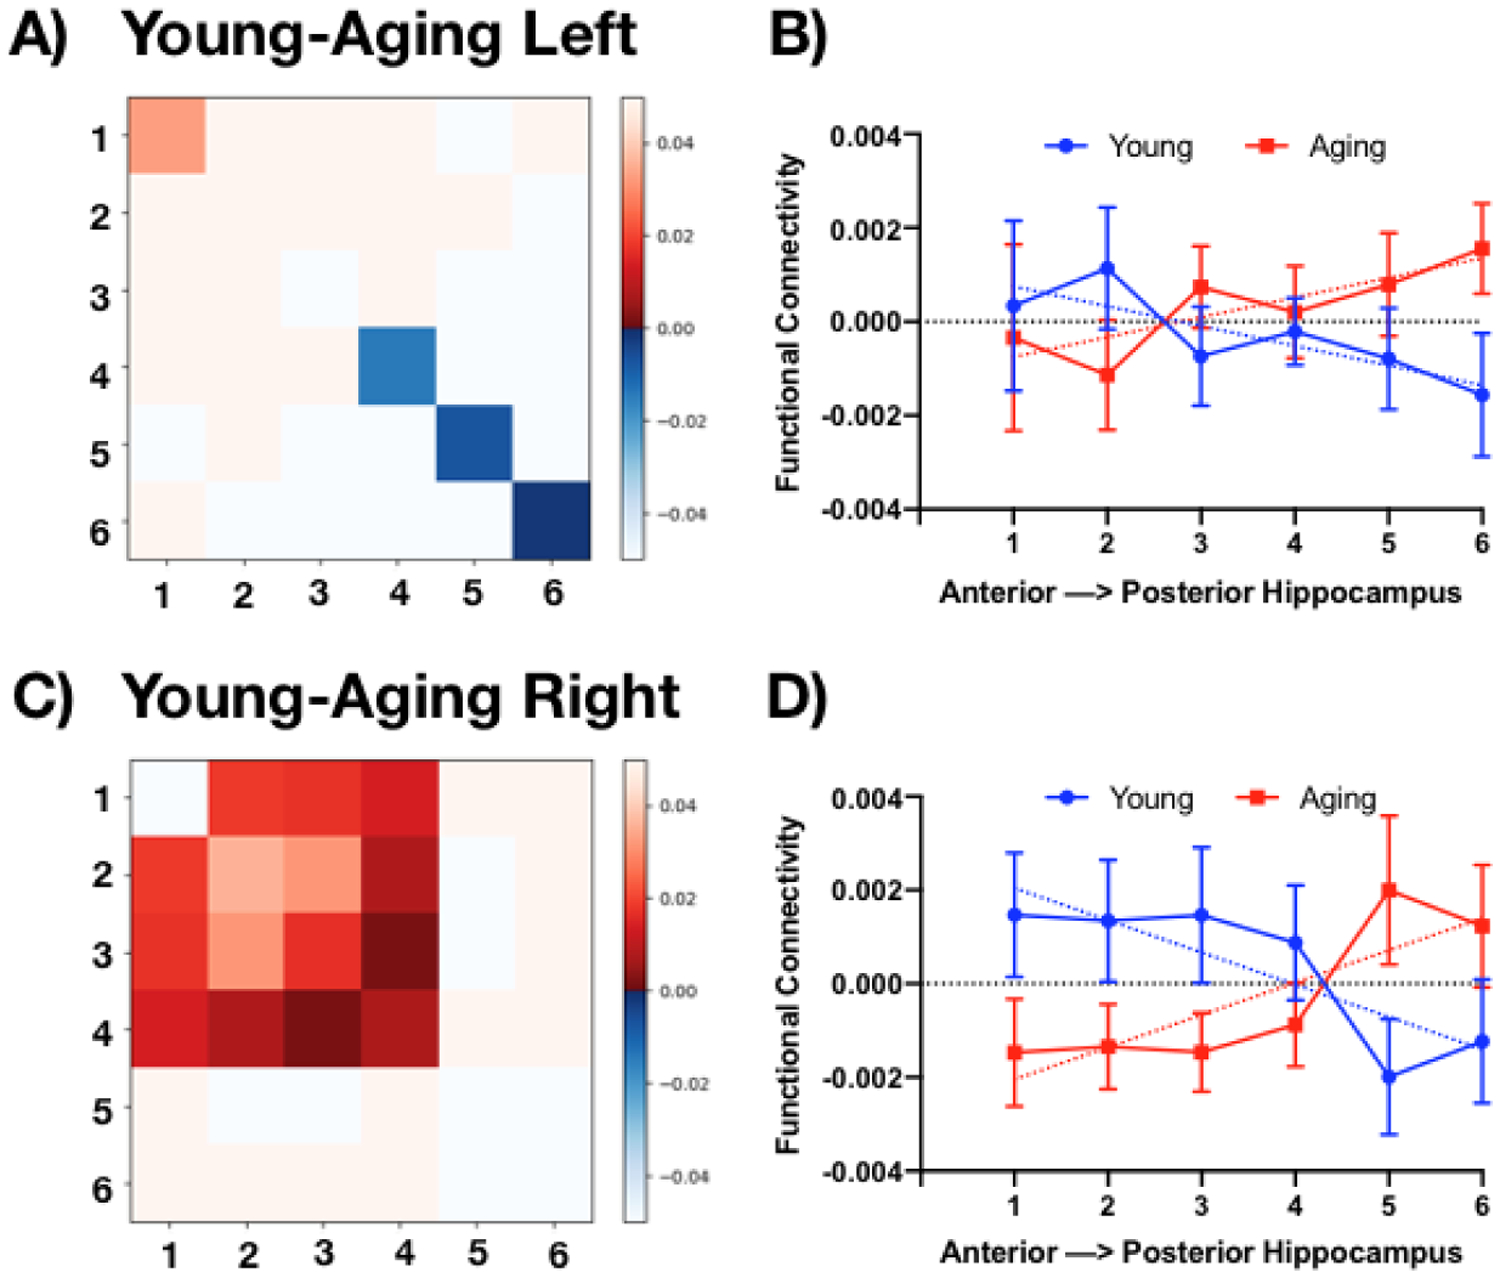
Young-Aged (Y-A) differences in the functional correlation matrices among the 6 segmentations of the hippocampus along the longitudinal axis, reflecting uncorrected p-values with a threshold of p<.05. There is a striking pattern of greater anterior FC in young adults and greater posterior FC in older adults in both the left (A) and right hippocampus (C).
We should note that the true pattern is likely somewhat more complex. Along the diagonal of both hemispheres, the gradient may not truly be linear and the left and right may have different inflection points if it is non-linear. In addition, it is likely not the case that the diagonal is the ideal representation as it appears as if longer-range structure may exist that form separate anterior and posterior sections (e.g., region 1–2, 1–3, etc.). We cannot speak to this explicitly as the off-diagonal pattern is purely a post hoc, exploratory analysis. In addition, we should also note that this pattern did not appear subfield-specific as we observed a similar pattern of results across the three hippocampal subfields (CA1, DG/CA3, and Subiculum), with an age-related decrease in FC for anterior regions and an age-related increase in posterior regions (Supplemental Figure 5). In these exploratory analyses, we chose to simply set our alpha threshold at p<.05 for each comparison, recognizing that many of them would not survive corrections for multiple comparisons. However, we would be remiss to ignore these findings, particularly given the prior findings in young individuals, the remarkable regularity of this pattern across the subfields, and in our additional two datasets.
4. Discussion
In this targeted exploration of age-related changes in task-based functional connectivity along the longitudinal axis of the hippocampus to the ERC, PRC, and PHC, we found reliably greater connectivity for younger adults than older ones between the hippocampus and PHC and PRC (Figure 2A&B). The drop in PHC FC was more pronounced in the anterior regions of the hippocampus than the posterior ones for older adults and was predictive of lure discrimination performance on the MST, suggesting that this pattern may contribute to memory performance in older adults (Figure 2C). Each of the hippocampal subfields exhibited reduced FC in anterior regions of the hippocampus in older adults (Figure 4A–C), while the more modest (sometimes marginal) age-related reductions in FC for PRC were more global and not specific to the anterior hippocampus (Figure 4D–F). Finally, we observed reduced inter-hippocampal functional connectivity in older adults in the anterior hippocampus, but greater connectivity in the posterior hippocampus (Figure 5). Importantly, we replicated these findings in two additional datasets (see Supplemental Materials), emphasizing the reliability of these results. While age-related dysfunction within the hippocampal subfields has been well-documented, these results suggest that the age-related dysfunction in hippocampal connectivity may also contribute significantly to memory decline in older adults.
4.1. A-P hippocampal connectivity: Anterior hippocampal dysfunction
Based on prior reports of age-related changes in anterior hippocampus, we predicted greater anterior than posterior age-related connectivity changes with the PHC. A similar pattern appeared in a brain-wide investigation of FC along the A-P axis of the hippocampus, with reduced connectivity for anterior regions than posterior ones in older adults (Blum et al., 2014). Indeed, we found reduced connectivity between anterior hippocampus and PHC in older adults (Figure 2B). A-P connectivity within the hippocampus has been shown to be modulated by APOE status, a genetic risk factor for Alzheimer’s disease, with reduced anterior hippocampal connectivity to cortical regions involved in a memory encoding and retrieval task for APOE positive carriers, with reductions in posterior hippocampal connectivity only during retrieval (Harrison et al., 2016). Likewise, across a longitudinal sample, anterior MTL (primarily hippocampal) functional connectivity declined with age, while posterior MTL connectivity remained largely constant (Salami et al., 2016). There is also evidence for reduced activation in the anterior hippocampus for older adults during an associative recognition memory task (Dalton et al., 2013) and a significant association between volume and memory decline in the anterior hippocampus (Hackert et al., 2002). Thus, reduced anterior hippocampal connectivity to PHC in aging is consistent with declines in anterior hippocampal functioning.
We also observed a decrease in FC within the anterior hippocampus in older adults (Figure 5) that is also consistent with an age-related alteration in anterior hippocampal functioning. Interestingly, we also found some evidence for greater posterior within-hippocampal connectivity. We should note that this pattern could be viewed as either enhanced posterior connectivity in the older sample or as reflecting a de-differentiation of connectivity in the older adults. Regardless, oddly, these competing patterns were asymmetrical, with greater age-related anterior dysfunction in the right hemisphere and greater posterior engagement in the left hemisphere. The reason for this discrepancy is not clear, though it is possible that task demands (here, incidental encoding of everyday objects) biased these activity profiles. Again, this age-related anterior hippocampal dysfunction is consistent with reduced volumes in the anterior hippocampus with age reflecting neural deterioration in this region (Ta et al., 2012).
While there was some evidence for an age-related decline in functional connectivity between the hippocampus and PRC, there was not an anterior-posterior difference along the longitudinal axis and the main effect was less reliable. While these findings are consistent with the A-P invariant drop in functional connectivity to default mode network regions in older adults (Damoiseaux et al., 2016), they do not parallel our PHC findings. Before speculating too deeply on this dissociation though, we will review the A-P functional connectivity within the hippocampal subfields.
4.2. Age-related dysfunction in A-P functional connectivity for the hippocampal subfields
We had predicted reduced connectivity of DG/CA3 given age-related functional activity dysfunction in this region, which we observed in connectivity to both PHC and PRC. While functional connectivity to PHC was significantly reduced only in the anterior regions for older adults, there was a strong trend for a reduction in posterior hippocampus as well (Figure 4A), suggesting it is not necessarily so selective. This pattern was mirrored in the functional connectivity to PRC (Figure 4D), offering support for global DG/CA3 dysfunction across the longitudinal axis of the hippocampus. Similarly, functional connectivity between the subiculum (Figure 4C&F) and CA1 (Figure 4B&E) with PHC exhibited anterior-specific declines in older adults, consistent with anterior hippocampal dysfunction noted earlier. Notably, age-related declines in FC with PRC were not anterior-specific for any of the hippocampal subfields.
An earlier investigation of hippocampal subfield connectivity along the longitudinal axis with PRC and PHC in young adults revealed greater anterior FC with PRC and greater posterior FC with PHC, which was relatively consistent across the three hippocampal subfields (Libby et al., 2012). Here, we found that FC with both PHC and PRC was greater for the anterior hippocampal regions in young adults, approximately following a skewed inverted U-shape function, with generally greater connectivity in the body than either the head or the tail (Figure 2 A&B). This discrepancy, and the lack of age-related anterior specificity in FC to the PRC, may be due, at least in part, to our use of task-based fMRI versus the resting-state fMRI used by Libby et al. (2012). While we demonstrated our pattern of results across three datasets, they all involved the encoding of visual objects or scenes, which are known to modulate activity in the hippocampus, PRC, and PHC. Whereas resting-state fMRI suffers from potential pitfalls of being unconstrained, particularly when comparing groups that may engage in different types of rest activities, our task may have biased these functional connectivity relationships due to the active engagement of these regions. Indeed, an investigation of hippocampal subfield functional connectivity using resting state data revealed an age-related decrease between the anterior subiculum and PRC, but not with other hippocampal subfields or with the PHC or ERC (Dalton et al., 2019).
Consistent with prior histological (Insausti and Amaral, 2003) and structural imaging studies (Yushkevich et al., 2009; Malykhin et al., 2010, 2017), we found an uneven distribution of the hippocampal subfields across the longitudinal axis (Figure 4G–I). We should note that there is significant variability in how these regions are segmented across labs, which will induce variance in findings until a validated, standardized protocol to minimize this variability is in place (Wisse et al., 2017). As subfield representation varies across the long axis, differences in segmentation protocols can influence long-axis findings. Accepting this caveat, we found that age-related volume loss was not consistent across the longitudinal axis of the hippocampus. We found significant volume decline in the posterior regions for both DG/CA3 and the subiculum, but no volumetric decline in anterior regions (but see Ta et al., 2012). While the tail of the hippocampus can be notoriously difficult to segment, these volume differences were not limited to the final tail region but begin in the mid-body of the hippocampus. However, despite these posterior volumetric declines, FC was weaker in the anterior portions of the hippocampus. This disparity emphasizes two key points: 1) anatomical volume and connectivity does not exclusively dictate hippocampal function and coordination with other regions, and 2) disparities in function across the longitudinal axis of the hippocampus remain consistent despite differences in the inherent properties of the various hippocampal subfields. The differences in hippocampal functional connectivity are not driven by one subfield alone or due to the disparity in subfield volume across the longitudinal axis but are likely driven by task-based coordination of activity across regions.
4.3. MTL network dysfunction in aging
While there is clear age-related dysfunction along the longitudinal axis of the hippocampus and neurobiological changes specific to the hippocampal subfields, there is also substantial evidence for age-related change in the surrounding medial temporal lobe cortices. Ranganath & Ritchey (2012) have proposed two cortical systems for memory-guided behavior: an anterior temporal (AT) system that includes the PRC and a posterior medial (PM) system that includes the PHC. There is evidence for age-related decline in both systems, with lower firing rates in aged PRC neurons (Burke et al., 2014), lower glutamate levels, reflecting reduced excitatory activity in the aged PRC (Liu et al., 2009), and reduced BOLD activity in the PRC of older adults (Ryan et al., 2012; Berron et al., 2018) in the AT system. Aged animals (Burke et al., 2011) and humans (Ryan et al., 2012) have difficulty discriminating between complex stimuli, consistent with the false recognition of novel stimuli in animals with PRC lesions (Burke et al., 2010). There is less existing evidence for age-related neurobiological alterations in the PM system and the PHC, but there has been documented volumetric decline (Insausti et al., 1998; Stark and Stark, 2017b) and decreases in white matter integrity (Rogalski et al., 2012). In addition, there is anatomical, neurophysiological, and behavioral data suggesting that these two regions interact heavily (Bucci et al., 2000, 2002; Furtak et al., 2012; Zhuo et al., 2016; Bos et al., 2017), suggesting that age-related alterations in one system may influence activity in the other. Together, the literature indicates some form of age-related dysfunction in both the AT and PM systems (Burke et al., 2018), consistent with our findings of age-related reduced FC between Hx-PRC and Hx-PHC.
Despite clear differences in the functioning of PHC and PRC and the corresponding pathways that they are integrated with (Ranganath and Ritchey, 2012), both suffer from age-related declines in functional connectivity. These findings are consistent with the model proposed by Burke et al. (2018), which argues for distinctions between these pathways, but showing age-related alterations along both as well. Interestingly, we found age-related impairment in functional connectivity between the hippocampus and these regions, but also between PRC and PHC themselves (Figure 3D). Notably, during a continuous recognition paradigm, the decreased FC between PRC and PHC disappears, suggesting a role for task demands on this relationship (Supplemental Figure 3C). The interaction among these regions may account, at least in part, for interactions between age and functional connectivity along the longitudinal axis of the hippocampus and the PHC in all three of our datasets, using images of simple objects and more complex scenes, despite the specificity of the PHC for processing of scenes while the PRC is typically more involved in recognition of simple objects. Future studies should probe this relationship in functional connectivity during encoding, retrieval, and non-mnemonic processing. Taken together, these results provide evidence for age-related dysfunction in both the AT and PM systems that may be differentially revealed based on task demands.
Despite possible predictions for comparable ERC functional connectivity declines in aging, possibly even dissociating lateral ERC and medial ERC (Burke et al., 2018; Reagh et al., 2018), we did not observe anything notable here in any of our datasets. ERC is particularly vulnerable to distortions and signal drop-out in functional MRI due to its proximity to the nasal cavity, which may be exacerbated by our high-resolution imaging protocol. Indeed, we found decreased SNR for the ERC compared to our other ROIs that may have impeded our ability to detect age-related differences in FC here. Further, our use of task-based fMRI may not have promoted differential connectivity between the hippocampus and ERC to allow us to detect age-related differences. Likewise, we did not find age-related volume differences in ERC, which have been inconsistent in the literature (Thomann et al., 2013; Stark and Stark, 2017b). However, ERC volume loss is associated with early pathological change associated with Alzheimer’s disease (Devanand et al., 2007), so the variability in ERC volume loss in any healthy aging sample may be due to the inclusion of individuals at risk for future AD pathology.
4.4. Concerns and limitations
We exclusively analyzed task-based datasets, reasoning that resting-state functional connectivity suffers from more uncontrolled sources of variability that may or may not be consistent within groups. The possibility that different groups may systematically engage in different rest behaviors is a potential confound for all resting-state FC studies. Even when a cognitive task is regressed out and only the residuals are considered, “state” effects may remain. Here, we only considered task-based functional connectivity but have the following caveat: all of our datasets involved encoding of objects or scenes, which we know can be negatively influenced by age (Ramsøy et al., 2012; Ryan et al., 2012; Berron et al., 2018). In addition, BOLD effects may be exacerbated by non-neural differences, such as changes in neurovascular coupling that occur with age (Wright and Wise, 2018). Further studies should future to explore the A-P differentiation of the hippocampus and its subfields during rest and other non-mnemonic tasks to evaluate the role of task demands on these findings and control for non-neural factors in the BOLD signal. Finally, our high-resolution scan parameters did not allow for whole-brain imaging, restricting our analyses to the medial temporal lobe network, but newer scan sequences will now allow for whole-brain connectivity analyses at high-resolution to further explore the A-P differentiation of the hippocampus and its subfields.
Finally, the impact of volume on functional connectivity is potentially a complex one, particularly in the context of age-related volume decline. Overall, a loss of volume in a region would lead to fewer voxels in that region, typically associated with greater noise which will, on average, reduce the observed connectivity (regression coefficients). Even without this volume loss, aging could lead to alterations in function that could result in reduced connectivity (alterations of network connectivity, alterations of neuronal firing patterns, etc). Here, our factor of interest – age – was correlated with volume. By regressing the volume out of the functional connectivity values, we may have removed an important component accounting for the decline in FC between these regions. Thus, while the age-related decreases in FC were somewhat mitigated by regressing out volume, it may be more accurate to account for alterations related to the aging hippocampal circuit without regressing out volume.
5. Conclusions
We sought to investigate the age-related changes in functional connectivity along the longitudinal axis of the hippocampus to the ERC, PRC, and PHC. We found reliably greater connectivity for younger compared to older adults with the PHC and, to a lesser degree, with the PRC. This drop in functional connectivity was more pronounced in the anterior regions of the hippocampus than the posterior ones for PHC, which was predictive of lure discrimination performance on the MST, suggesting a role in memory performance. Each of the hippocampal subfields reflected reduced FC anterior regions of the hippocampus in older adults with some evidence for a posterior decline as well, particularly in DG/CA3. Finally, we observed reduced inter-hippocampal functional connectivity in older adults in the anterior hippocampus, but greater connectivity in the posterior hippocampus. While age-related dysfunction within the hippocampal subfields has been well-documented, these results suggest that the age-related dysfunction in hippocampal connectivity along the longitudinal axis may also contribute significantly to memory decline in older adults.
Supplementary Material
Significance Statement.
We examined functional connectivity differences between young and older adults at high-resolution within the medial temporal lobe network allowing us to explore how hippocampal subfield connectivity across the longitudinal axis of the hippocampus changes with age. This drop in functional connectivity was more pronounced in the anterior regions of the hippocampus than the posterior ones, consistent for each of the hippocampal subfields. Further, intra-hippocampal connectivity also reflected an age-related decrease in functional connectivity within the anterior hippocampus in older adults that was offset by an increase in posterior hippocampal functional connectivity. While age-related dysfunction within the hippocampal subfields has been well-documented, these results suggest that the age-related dysfunction in hippocampal connectivity along the longitudinal axis may contribute to memory decline in older adults.
Acknowledgements:
This research was supported in part by a grant from the National Institutes of Aging: AG034613 and P50 AG016573 (subaward). We thank Samantha Rutledge for assistance in data collection and Branden Kolarik for helpful comments.
Footnotes
Conflict of Interest Statement: The authors declare no competing interests.
References
- Amaral DG, Dolorfo C, Alvarez-Royo P. 1991. Organization of CA1 projections to the subiculum: a PHA-L analysis in the rat. Hippocampus 1:415–435. [DOI] [PubMed] [Google Scholar]
- Amaral DG, Witter MP. 1989. The three-dimensional organization of the hippocampal formation: A review of anatomical data. Neuroscience 31:571–591. [DOI] [PubMed] [Google Scholar]
- Ances BM, Liang CL, Leontiev O, Perthen JE, Fleisher AS, Lansing AE, Buxton RB. 2009. Effects of aging on cerebral blood flow, oxygen metabolism, and blood oxygenation level dependent responses to visual stimulation. Hum Brain Mapp 30:1120–1132. [DOI] [PMC free article] [PubMed] [Google Scholar]
- Arbabshirani MR, Damaraju E, Phlypo R, Plis S, Allen E, Ma S, Mathalon D, Preda A, Vaidya JG, Adali T, Calhoun VD. 2014. Impact of Autocorrelation on Functional Connectivity. NeuroImage 102:294–308. [DOI] [PMC free article] [PubMed] [Google Scholar]
- Avants BB, Epstein CL, Grossman M, Gee JC. 2008. Symmetric diffeomorphic image registration with cross-correlation: evaluating automated labeling of elderly and neurodegenerative brain. Med Image Anal 12:26–41. [DOI] [PMC free article] [PubMed] [Google Scholar]
- Bakker A, Kirwan CB, Miller NI, Stark CEL. 2008. Pattern separation in the human hippocampal CA3 and dentate gyrus. Science 319:1640–1642. [DOI] [PMC free article] [PubMed] [Google Scholar]
- Bast T, Feldon J. 2003. Hippocampal modulation of sensorimotor processes. Prog Neurobiol 70:319–345. [DOI] [PubMed] [Google Scholar]
- Bast T, Wilson IA, Witter MP, Morris RGM. 2009. From rapid place learning to behavioral performance: a key role for the intermediate hippocampus. PLoS Biol 7:e1000089. [DOI] [PMC free article] [PubMed] [Google Scholar]
- Bennett IJ, Huffman DJ, Stark CEL. 2015. Limbic Tract Integrity Contributes to Pattern Separation Performance Across the Lifespan. Cereb Cortex N Y N 1991 25:2988–2999. [DOI] [PMC free article] [PubMed] [Google Scholar]
- Bennett IJ, Stark CEL. 2015. Mnemonic Discrimination Relates to Perforant Path Integrity: An Ultra-High Resolution Diffusion Tensor Imaging Study. Neurobiol Learn Mem 129:107–112. [DOI] [PMC free article] [PubMed] [Google Scholar]
- Berron D, Neumann K, Maass A, Schütze H, Fliessbach K, Kiven V, Jessen F, Sauvage M, Kumaran D, Düzel E. 2018. Age-related functional changes in domain-specific medial temporal lobe pathways. Neurobiol Aging 65:86–97. [DOI] [PubMed] [Google Scholar]
- Bienkowski MS, Bowman I, Song MY, Gou L, Ard T, Cotter K, Zhu M, Benavidez NL, Yamashita S, Abu-Jaber J, Azam S, Lo D, Foster NN, Hintiryan H, Dong H-W. 2018. Integration of gene expression and brain-wide connectivity reveals the multiscale organization of mouse hippocampal networks. Nat Neurosci 21:1628–1643. [DOI] [PMC free article] [PubMed] [Google Scholar]
- Biswal BB, Mennes M, Zuo XN, Gohel S, Kelly C, Smith SM, Beckmann CF, Adelstein JS, Buckner RL, Colcombe S, Dogonowski AM, Ernst M, Fair D, Hampson M, Hoptman MJ, Hyde JS, Kiviniemi VJ, Kotter R, Li SJ, Lin CP, Lowe MJ, Mackay C, Madden DJ, Madsen KH, Margulies DS, Mayberg HS, McMahon K, Monk CS, Mostofsky SH, Nagel BJ, Pekar JJ, Peltier SJ, Petersen SE, Riedl V, Rombouts SA, Rypma B, Schlaggar BL, Schmidt S, Seidler RD, Siegle GJ, Sorg C, Teng GJ, Veijola J, Villringer A, Walter M, Wang L, Weng XC, Whitfield-Gabrieli S, Williamson P, Windischberger C, Zang YF, Zhang HY, Castellanos FX, Milham MP. 2010. Toward discovery science of human brain function. Proc Natl Acad Sci U A 107:4734–9. [DOI] [PMC free article] [PubMed] [Google Scholar]
- Blum S, Habeck C, Steffener J, Razlighi Q, Stern Y. 2014. Functional connectivity of the posterior hippocampus is more dominant as we age. Cogn Neurosci 5:150–159. [DOI] [PMC free article] [PubMed] [Google Scholar]
- Bos JJ, Vinck M, van Mourik-Donga LA, Jackson JC, Witter MP, Pennartz CMA. 2017. Perirhinal firing patterns are sustained across large spatial segments of the task environment. Nat Commun 8:15602. [DOI] [PMC free article] [PubMed] [Google Scholar]
- Brunec IK, Bellana B, Ozubko JD, Man V, Robin J, Liu Z-X, Grady C, Rosenbaum RS, Winocur G, Barense MD, Moscovitch M. 2018. Multiple Scales of Representation along the Hippocampal Anteroposterior Axis in Humans. Curr Biol CB 28:2129–2135.e6. [DOI] [PubMed] [Google Scholar]
- Bucci DJ, Phillips RG, Burwell RD. 2000. Contributions of postrhinal and perirhinal cortex to contextual information processing. Behav Neurosci 114:882–894. [DOI] [PubMed] [Google Scholar]
- Bucci DJ, Saddoris MP, Burwell RD. 2002. Contextual fear discrimination is impaired by damage to the postrhinal or perirhinal cortex. Behav Neurosci 116:479–488. [PubMed] [Google Scholar]
- Burke SN, Gaynor LS, Barnes CA, Bauer RM, Bizon JL, Roberson ED, Ryan L. 2018. Shared Functions of Perirhinal and Parahippocampal Cortices: Implications for Cognitive Aging. Trends Neurosci 41:349–359. [DOI] [PMC free article] [PubMed] [Google Scholar]
- Burke SN, Maurer AP, Nematollahi S, Uprety A, Wallace JL, Barnes CA. 2014. Advanced age dissociates dual functions of the perirhinal cortex. J Neurosci Off J Soc Neurosci 34:467–480. [DOI] [PMC free article] [PubMed] [Google Scholar]
- Burke SN, Wallace JL, Hartzell AL, Nematollahi S, Plange K, Barnes CA. 2011. Age-associated deficits in pattern separation functions of the perirhinal cortex: a cross-species consensus. Behav Neurosci 125:836–47. [DOI] [PMC free article] [PubMed] [Google Scholar]
- Burke SN, Wallace JL, Nematollahi S, Uprety AR, Barnes CA. 2010. Pattern separation deficits may contribute to age-associated recognition impairments. Behav Neurosci 124:559–73. [DOI] [PMC free article] [PubMed] [Google Scholar]
- Burwell RD, Amaral DG. 1998. Cortical afferents of the perirhinal, postrhinal, and entorhinal cortices of the rat. J Comp Neurol 398:179–205. [DOI] [PubMed] [Google Scholar]
- Cole MW, Bassett DS, Power JD, Braver TS, Petersen SE. 2014. Intrinsic and task-evoked network architectures of the human brain. Neuron 83:238–251. [DOI] [PMC free article] [PubMed] [Google Scholar]
- Cox RW. 1996. AFNI: software for analysis and visualization of functional magnetic resonance neuroimages. Comput Biomed Res 29:162–173. [DOI] [PubMed] [Google Scholar]
- Dale AM, Fischl B, Sereno MI. 1999. Cortical surface-based analysis. I. Segmentation and surface reconstruction. NeuroImage 9:179–194. [DOI] [PubMed] [Google Scholar]
- Dalton MA, McCormick C, De Luca F, Clark IA, Maguire EA. 2019. Functional connectivity along the anterior-posterior axis of hippocampal subfields in the ageing human brain. Hippocampus. [DOI] [PMC free article] [PubMed] [Google Scholar]
- Dalton MA, Tu S, Hornberger M, Hodges JR, Piguet O. 2013. Medial temporal lobe contributions to intra-item associative recognition memory in the aging brain. Front Behav Neurosci 7:222. [DOI] [PMC free article] [PubMed] [Google Scholar]
- Damoiseaux JS, Viviano RP, Yuan P, Raz N. 2016. Differential effect of age on posterior and anterior hippocampal functional connectivity. NeuroImage 133:468–476. [DOI] [PMC free article] [PubMed] [Google Scholar]
- D’Esposito M, Deouell LY, Gazzaley A. 2003. Alterations in the BOLD fMRI signal with ageing and disease: a challenge for neuroimaging. Nat Rev Neurosci 4:863–72. [DOI] [PubMed] [Google Scholar]
- Devanand DP, Pradhaban G, Liu X, Khandji A, De Santi S, Segal S, Rusinek H, Pelton GH, Honig LS, Mayeux R, Stern Y, Tabert MH, de Leon MJ. 2007. Hippocampal and entorhinal atrophy in mild cognitive impairment: prediction of Alzheimer disease. Neurology 68:828–836. [DOI] [PubMed] [Google Scholar]
- Duvernoy H, Cattin F, Naidich TP, Raybaud CR, Salvolini U, Scarabino U, Vannson JL. 2005. The Human Hippocampus: Functional Anatomy, Vascularization and Serial Sections with MRI. New York: Springer. [Google Scholar]
- Epskamp S, Fried EI. 2018. A tutorial on regularized partial correlation networks. Psychol Methods 23:617–634. [DOI] [PubMed] [Google Scholar]
- Fanselow MS, Dong H-W. 2010. Are the dorsal and ventral hippocampus functionally distinct structures? Neuron 65:7–19. [DOI] [PMC free article] [PubMed] [Google Scholar]
- Fischl B, Salat DH, Busa E, Albert M, Dieterich M, Haselgrove C, van der Kouwe A, Killiany R, Kennedy D, Klaveness S, Montillo A, Makris N, Rosen B, Dale AM. 2002. Whole brain segmentation: automated labeling of neuroanatomical structures in the human brain. Neuron 33:341–355. [DOI] [PubMed] [Google Scholar]
- Folstein MF, Folstein SE, McHugh PR. 1975. “Mini-mental state”. A practical method for grading the cognitive state of patients for the clinician. J Psychiatr Res 12:189–198. [DOI] [PubMed] [Google Scholar]
- Furtak SC, Ahmed OJ, Burwell RD. 2012. Single neuron activity and theta modulation in postrhinal cortex during visual object discrimination. Neuron 76:976–988. [DOI] [PMC free article] [PubMed] [Google Scholar]
- Gaarskjaer FB. 1986. The organization and development of the hippocampal mossy fiber system. Brain Res 396:335–357. [DOI] [PubMed] [Google Scholar]
- Geinisman Y, deToledo-Morrell L, Morrell F, Persina IS, Rossi M. 1992. Age-related loss of axospinous synapses formed by two afferent systems in the rat dentate gyrus as revealed by the unbiased stereological dissector technique. Hippocampus 2:437–444. [DOI] [PubMed] [Google Scholar]
- Grady CL. 2020. Meta-analytic and functional connectivity evidence from functional magnetic resonance imaging for an anterior to posterior gradient of function along the hippocampal axis. Hippocampus 30:456–471. [DOI] [PubMed] [Google Scholar]
- Haam J, Yakel JL. 2017. Cholinergic modulation of the hippocampal region and memory function. J Neurochem 142:111–121. [DOI] [PMC free article] [PubMed] [Google Scholar]
- Hackert VH, den Heijer T, Oudkerk M, Koudstaal PJ, Hofman A, Breteler MMB. 2002. Hippocampal head size associated with verbal memory performance in nondemented elderly. NeuroImage 17:1365–1372. [DOI] [PubMed] [Google Scholar]
- Harrison TM, Burggren AC, Small GW, Bookheimer SY. 2016. Altered memory-related functional connectivity of the anterior and posterior hippocampus in older adults at increased genetic risk for Alzheimer’s disease. Hum Brain Mapp 37:366–380. [DOI] [PMC free article] [PubMed] [Google Scholar]
- Hasselmo ME, Eichenbaum H. 2005. Hippocampal mechanisms for the context-dependent retrieval of episodes. Neural Netw Off J Int Neural Netw Soc 18:1172–1190. [DOI] [PMC free article] [PubMed] [Google Scholar]
- Insausti R, Amaral DG. 2003. Hippocampal Formation. Hum Nerv Syst Second Ed:871–914. [Google Scholar]
- Insausti R, Juottonen K, Soininen H, Insausti AM, Partanen K, Vainio P, Laakso MP, Pitkanen A. 1998. MR volumetric analysis of the human entorhinal, perirhinal, and temporopolar cortices. AJNRAmerican J Neuroradiol 19:659–671. [PMC free article] [PubMed] [Google Scholar]
- Izaki Y, Takita M, Nomura M. 2000. Comparative induction of long-term depression between dorsal and ventral hippocampal CA1 in the anesthetized rat. Neurosci Lett 294:171–174. [DOI] [PubMed] [Google Scholar]
- Jack CR, Twomey CK, Zinsmeister AR, Sharbrough FW, Petersen RC, Cascino GD. 1989. Anterior temporal lobes and hippocampal formations: normative volumetric measurements from MR images in young adults. Radiology 172:549–554. [DOI] [PubMed] [Google Scholar]
- Jo HJ, Saad ZS, Simmons WK, Milbury LA, Cox RW. 2010. Mapping Sources of Correlation in Resting State FMRI, with Artifact Detection and Removal. NeuroImage 52:571–582. [DOI] [PMC free article] [PubMed] [Google Scholar]
- Jung MW, Wiener SI, McNaughton BL. 1994. Comparison of spatial firing characteristics of units in dorsal and ventral hippocampus of the rat. J Neurosci Off J Soc Neurosci 14:7347–7356. [DOI] [PMC free article] [PubMed] [Google Scholar]
- Kjelstrup KB, Solstad T, Brun VH, Hafting T, Leutgeb S, Witter MP, Moser EI, Moser M-B. 2008. Finite scale of spatial representation in the hippocampus. Science 321:140–143. [DOI] [PubMed] [Google Scholar]
- Lacy JW, Stark CE. 2012. Intrinsic functional connectivity of the human medial temporal lobe suggests a distinction between adjacent MTL cortices and hippocampus. Hippocampus 22:2290–302. [DOI] [PMC free article] [PubMed] [Google Scholar]
- Lacy JW, Yassa MA, Stark SM, Muftuler LT, Stark CE. 2011. Distinct pattern separation related transfer functions in human CA3/dentate and CA1 revealed using high-resolution fMRI and variable mnemonic similarity. Learn Mem 18:15–8. [DOI] [PMC free article] [PubMed] [Google Scholar]
- Langnes E, Sneve MH, Sederevicius D, Amlien IK, Walhovd KB, Fjell AM. 2020. Anterior and posterior hippocampus macro- and microstructure across the lifespan in relation to memory—A longitudinal study. Hippocampus [Internet]. Available from: https://onlinelibrary.wiley.com/doi/abs/10.1002/hipo.23189 [DOI] [PubMed] [Google Scholar]
- Lau JYF, Goldman D, Buzas B, Hodgkinson C, Leibenluft E, Nelson E, Sankin L, Pine DS, Ernst M. 2010. BDNF gene polymorphism (Val66Met) predicts amygdala and anterior hippocampus responses to emotional faces in anxious and depressed adolescents. NeuroImage 53:952–961. [DOI] [PMC free article] [PubMed] [Google Scholar]
- Lavenex P, Amaral DG. 2000. Hippocampal-neocortical interaction: a hierarchy of associativity. Hippocampus 10:420–430. [DOI] [PubMed] [Google Scholar]
- Lavenex P, Suzuki WA, Amaral DG. 2004. Perirhinal and parahippocampal cortices of the macaque monkey: Intrinsic projections and interconnections. J Comp Neurol 472:371–394. [DOI] [PubMed] [Google Scholar]
- Li XG, Somogyi P, Ylinen A, Buzsáki G. 1994. The hippocampal CA3 network: an in vivo intracellular labeling study. J Comp Neurol 339:181–208. [DOI] [PubMed] [Google Scholar]
- Libby LA, Ekstrom AD, Ragland JD, Ranganath C. 2012. Differential connectivity of perirhinal and parahippocampal cortices within human hippocampal subregions revealed by high-resolution functional imaging. J Neurosci Off J Soc Neurosci 32:6550–6560. [DOI] [PMC free article] [PubMed] [Google Scholar]
- Liu P, Jing Y, Zhang H. 2009. Age-related changes in arginine and its metabolites in memory-associated brain structures. Neuroscience 164:611–628. [DOI] [PubMed] [Google Scholar]
- Liu TT, Nalci A, Falahpour M. 2017. The global signal in fMRI: Nuisance or Information? NeuroImage 150:213–229. [DOI] [PMC free article] [PubMed] [Google Scholar]
- Maass A, Berron D, Libby LA, Ranganath C, Düzel E. 2015. Functional subregions of the human entorhinal cortex. eLife 4. [DOI] [PMC free article] [PubMed] [Google Scholar]
- Malykhin NV, Huang Y, Hrybouski S, Olsen F. 2017. Differential vulnerability of hippocampal subfields and anteroposterior hippocampal subregions in healthy cognitive aging. Neurobiol Aging 59:121–134. [DOI] [PubMed] [Google Scholar]
- Malykhin NV, Lebel RM, Coupland NJ, Wilman AH, Carter R. 2010. In vivo quantification of hippocampal subfields using 4.7 T fast spin echo imaging. NeuroImage 49:1224–1230. [DOI] [PubMed] [Google Scholar]
- Manns JR, Eichenbaum H. 2006. Evolution of declarative memory. Hippocampus 16:795–808. [DOI] [PubMed] [Google Scholar]
- Miller SL, Fenstermacher E, Bates J, Blacker D, Sperling RA, Dickerson BC. 2008. Hippocampal activation in adults with mild cognitive impairment predicts subsequent cognitive decline. J Neurol Neurosurg Psychiatry 79:630–635. [DOI] [PMC free article] [PubMed] [Google Scholar]
- Moser MB, Moser EI. 1998. Functional differentiation in the hippocampus. Hippocampus 8:608–619. [DOI] [PubMed] [Google Scholar]
- Mueller SG, Weiner MW. 2009. Selective effect of age, Apo e4, and Alzheimer’s disease on hippocampal subfields. Hippocampus 19:558–564. [DOI] [PMC free article] [PubMed] [Google Scholar]
- Murphy K, Fox MD. 2017. Towards a consensus regarding global signal regression for resting state functional connectivity MRI. NeuroImage 154:169–173. [DOI] [PMC free article] [PubMed] [Google Scholar]
- Neunuebel JP, Knierim JJ. 2014. CA3 Retrieves Coherent Representations from Degraded Input: Direct Evidence for CA3 Pattern Completion and Dentate Gyrus Pattern Separation. Neuron 81:416–427. [DOI] [PMC free article] [PubMed] [Google Scholar]
- Papatheodoropoulos C, Kostopoulos G. 2000a. Decreased ability of rat temporal hippocampal CA1 region to produce long-term potentiation. Neurosci Lett 279:177–180. [DOI] [PubMed] [Google Scholar]
- Papatheodoropoulos C, Kostopoulos G. 2000b. Dorsal-ventral differentiation of short-term synaptic plasticity in rat CA1 hippocampal region. Neurosci Lett 286:57–60. [DOI] [PubMed] [Google Scholar]
- Perry EK, Johnson M, Kerwin JM, Piggott MA, Court JA, Shaw PJ, Ince PG, Brown A, Perry RH. 1992. Convergent cholinergic activities in aging and Alzheimer’s disease. Neurobiol Aging 13:393–400. [DOI] [PubMed] [Google Scholar]
- Poppenk J, Evensmoen HR, Moscovitch M, Nadel L. 2013. Long-axis specialization of the human hippocampus. Trends Cogn Sci 17:230–240. [DOI] [PubMed] [Google Scholar]
- Power JD, Cohen AL, Nelson SM, Wig GS, Barnes KA, Church JA, Vogel AC, Laumann TO, Miezin FM, Schlaggar BL, Petersen SE. 2011. Functional network organization of the human brain. Neuron 72:665–678. [DOI] [PMC free article] [PubMed] [Google Scholar]
- Power JD, Laumann TO, Plitt M, Martin A, Petersen SE. 2017. On Global fMRI Signals and Simulations. Trends Cogn Sci 21:911–913. [DOI] [PubMed] [Google Scholar]
- Pruessmann KP, Weiger M, Scheidegger MB, Boesiger P. 1999. SENSE: Sensitivity Encoding for Fast MRI. Magn Reson Med 42:952–962. [PubMed] [Google Scholar]
- Raichle ME, MacLeod AM, Snyder AZ, Powers WJ, Gusnard DA, Shulman GL. 2001. A default mode of brain function. Proc Natl Acad Sci U S A 98:676–682. [DOI] [PMC free article] [PubMed] [Google Scholar]
- Ramsøy TZ, Liptrot MG, Skimminge A, Lund TE, Sidaros K, Christensen MS, Baaré W, Paulson OB, Jernigan TL, Siebner HR. 2012. Healthy aging attenuates task-related specialization in the human medial temporal lobe. Neurobiol Aging 33:1874–1889. [DOI] [PubMed] [Google Scholar]
- Ranganath C, Ritchey M. 2012. Two cortical systems for memory-guided behaviour. Nat Rev Neurosci 13:713–26. [DOI] [PubMed] [Google Scholar]
- Reagh ZM, Noche JA, Tustison NJ, Delisle D, Murray EA, Yassa MA. 2018. Functional Imbalance of Anterolateral Entorhinal Cortex and Hippocampal Dentate/CA3 Underlies Age-Related Object Pattern Separation Deficits. Neuron 97:1187–1198.e4. [DOI] [PMC free article] [PubMed] [Google Scholar]
- Rogalski E, Stebbins GT, Barnes CA, Murphy CM, Stoub TR, George S, Ferrari C, Shah RC, deToledo-Morrell L. 2012. Age-related changes in parahippocampal white matter integrity: a diffusion tensor imaging study. Neuropsychologia 50:1759–1765. [DOI] [PMC free article] [PubMed] [Google Scholar]
- Rolls ET. 2013. The mechanisms for pattern completion and pattern separation in the hippocampus. Front Syst Neurosci 7:doi: 10.3389/fnsys.2013.00074. [DOI] [PMC free article] [PubMed] [Google Scholar]
- Ryan L, Cardoza JA, Barense MD, Kawa KH, Wallentin-Flores J, Arnold WT, Alexander GE. 2012. Age-related impairment in a complex object discrimination task that engages perirhinal cortex. Hippocampus 22:1978–1989. [DOI] [PMC free article] [PubMed] [Google Scholar]
- Saad ZS, Glen DR, Chen G, Beauchamp MS, Desai R, Cox RW. 2009. A new method for improving functional-to-structural MRI alignment using local Pearson correlation. Neuroimage 44:839–48. [DOI] [PMC free article] [PubMed] [Google Scholar]
- Salami A, Wåhlin A, Kaboodvand N, Lundquist A, Nyberg L. 2016. Longitudinal Evidence for Dissociation of Anterior and Posterior MTL Resting-State Connectivity in Aging: Links to Perfusion and Memory. Cereb Cortex N Y N 1991 26:3953–3963. [DOI] [PMC free article] [PubMed] [Google Scholar]
- Shah P, Bassett DS, Wisse LEM, Detre JA, Stein JM, Yushkevich PA, Shinohara RT, Pluta JB, Valenciano E, Daffner M, Wolk DA, Elliott MA, Litt B, Davis KA, Das SR. 2018. Mapping the structural and functional network architecture of the medial temporal lobe using 7T MRI. Hum Brain Mapp 39:851–865. [DOI] [PMC free article] [PubMed] [Google Scholar]
- Shing YL, Rodrigue KM, Kennedy KM, Fandakova Y, Bodammer N, Werkle-Bergner M, Lindenberger U, Raz N. 2011. Hippocampal subfield volumes: age, vascular risk, and correlation with associative memory. Front Aging Neurosci 3:2. [DOI] [PMC free article] [PubMed] [Google Scholar]
- Small SA, Chawla MK, Buonocore M, Rapp PR, Barnes CA. 2004. Imaging correlates of brain function in monkeys and rats isolates a hippocampal subregion differentially vulnerable to aging. Proc Natl Acad Sci U S A 101:7181–7186. [DOI] [PMC free article] [PubMed] [Google Scholar]
- Small SA, Nava AS, Perera GM, DeLaPaz R, Mayeux R, Stern Y. 2001. Circuit mechanisms underlying memory encoding and retrieval in the long axis of the hippocampal formation. Nat Neurosci 4:442–449. [DOI] [PubMed] [Google Scholar]
- Small SA, Tsai WY, DeLaPaz R, Mayeux R, Stern Y. 2002. Imaging hippocampal function across the human life span: is memory decline normal or not? Ann Neurol 51:290–295. [DOI] [PubMed] [Google Scholar]
- Smith SM, Miller KL, Salimi-Khorshidi G, Webster M, Beckmann CF, Nichols TE, Ramsey JD, Woolrich MW. 2011. Network modelling methods for FMRI. NeuroImage 54:875–891. [DOI] [PubMed] [Google Scholar]
- Squire LR. 1992. Memory and the hippocampus: A synthesis from findings with rats, monkeys, and humans. Psychol Rev 99:195–231. [DOI] [PubMed] [Google Scholar]
- Stark CEL, Okado Y. 2003. Making memories without trying: Medial temporal lobe activity associated with incidental memory formation during recognition. J Neurosci 23:6748–6753. [DOI] [PMC free article] [PubMed] [Google Scholar]
- Stark SM, Stark CEL. 2017a. The Aging Hippocampus: Linking Animal and Human Research. In: Cognitive Neuroscience of Aging. 2nd ed. Oxford University Press. p 273–300. [Google Scholar]
- Stark SM, Stark CEL. 2017b. Age-related deficits in the mnemonic similarity task for objects and scenes. Behav Brain Res 333:109–117. [DOI] [PMC free article] [PubMed] [Google Scholar]
- Stark SM, Stevenson R, Wu C, Rutledge S, Stark CEL. 2015. Stability of age-related deficits in the mnemonic similarity task across task variations. Behav Neurosci 129:257–268. [DOI] [PMC free article] [PubMed] [Google Scholar]
- Stark SM, Yassa MA, Lacy JW, Stark CE. 2013. A task to assess behavioral pattern separation (BPS) in humans: Data from healthy aging and mild cognitive impairment. Neuropsychologia 51:2442–9. [DOI] [PMC free article] [PubMed] [Google Scholar]
- Stemmelin J, Lazarus C, Cassel S, Kelche C, Cassel JC. 2000. Immunohistochemical and neurochemical correlates of learning deficits in aged rats. Neuroscience 24:275–289. [DOI] [PubMed] [Google Scholar]
- Strange BA, Witter MP, Lein ES, Moser EI. 2014. Functional organization of the hippocampal longitudinal axis. Nat Rev Neurosci 15:655–669. [DOI] [PubMed] [Google Scholar]
- Suzuki WA, Amaral DG. 1994. Perirhinal and parahippocampal cortices of the macaque monkey: Cortical afferents. J Comp Neurol 14:1856–1877. [DOI] [PubMed] [Google Scholar]
- Ta AT, Huang S-E, Chiu M-J, Hua M-S, Tseng W-YI, Chen S-HA, Qiu A. 2012. Age-related vulnerabilities along the hippocampal longitudinal axis. Hum Brain Mapp 33:2415–2427. [DOI] [PMC free article] [PubMed] [Google Scholar]
- Thomann PA, Wüstenberg T, Nolte HM, Menzel PB, Wolf RC, Essig M, Schröder J. 2013. Hippocampal and entorhinal cortex volume decline in cognitively intact elderly. Psychiatry Res 211:31–36. [DOI] [PubMed] [Google Scholar]
- Thomé A, Gray DT, Erickson CA, Lipa P, Barnes CA. 2016. Memory impairment in aged primates is associated with region-specific network dysfunction. Mol Psychiatry 21:1257–1262. [DOI] [PMC free article] [PubMed] [Google Scholar]
- Thompson CL, Pathak SD, Jeromin A, Ng LL, MacPherson CR, Mortrud MT, Cusick A, Riley ZL, Sunkin SM, Bernard A, Puchalski RB, Gage FH, Jones AR, Bajic VB, Hawrylycz MJ, Lein ES. 2008. Genomic anatomy of the hippocampus. Neuron 60:1010–1021. [DOI] [PubMed] [Google Scholar]
- Treves A, Rolls ET. 1994. Computational analysis of the role of the hippocampus in memory. Hippocampus 4:374–391. [DOI] [PubMed] [Google Scholar]
- Van Strien NM, Cappaert NL, Witter MP. 2009. The anatomy of memory: an interactive overview of the parahippocampal-hippocampal network. Nat Rev Neurosci 10:272–282. [DOI] [PubMed] [Google Scholar]
- Vela J, Gutierrez A, Vitorica J, Ruano D. 2003. Rat hippocampal GABAergic molecular markers are differentially affected by ageing. J Neurochem 85:368–377. [DOI] [PubMed] [Google Scholar]
- Ward AM, Mormino EC, Huijbers W, Schultz AP, Hedden T, Sperling RA. 2015. Relationships between default-mode network connectivity, medial temporal lobe structure, and age-related memory deficits. Neurobiol Aging 36:265–272. [DOI] [PMC free article] [PubMed] [Google Scholar]
- Wilson IA, Ikonen S, Gallagher M, Eichenbaum H, Tanila H. 2005. Age-associated alterations of hippocampal place cells are subregion specific. J Neurosci 25:6877–6886. [DOI] [PMC free article] [PubMed] [Google Scholar]
- Wilson IA, Ikonen S, Gureviciene I, McMahan RW, Gallagher M, Eichenbaum H, Tanila H. 2004. Cognitive aging and the hippocampus: how old rats represent new environments. J Neurosci Off J Soc Neurosci 24:3870–3878. [DOI] [PMC free article] [PubMed] [Google Scholar]
- Wisse LEM, Daugherty AM, Olsen RK, Berron D, Carr VA, Stark CEL, Amaral RSC, Amunts K, Augustinack JC, Bender AR, Bernstein JD, Boccardi M, Bocchetta M, Burggren A, Chakravarty MM, Chupin M, Ekstrom A, de Flores R, Insausti R, Kanel P, Kedo O, Kennedy KM, Kerchner GA, LaRocque KF, Liu X, Maass A, Malykhin N, Mueller SG, Ofen N, Palombo DJ, Parekh MB, Pluta JB, Pruessner JC, Raz N, Rodrigue KM, Schoemaker D, Shafer AT, Steve TA, Suthana N, Wang L, Winterburn JL, Yassa MA, Yushkevich PA, la Joie R, Hippocampal Subfields Group. 2017. A harmonized segmentation protocol for hippocampal and parahippocampal subregions: Why do we need one and what are the key goals? Hippocampus 27:3–11. [DOI] [PMC free article] [PubMed] [Google Scholar]
- Witter MP, Amaral DG. 2004. Hippocampal formation. In: The rat nervous system. Vol. 3rd. San Diego: Academic Press. p 637–703. [Google Scholar]
- Wright ME, Wise RG. 2018. Can Blood Oxygenation Level Dependent Functional Magnetic Resonance Imaging Be Used Accurately to Compare Older and Younger Populations? A Mini Literature Review. Front Aging Neurosci [Internet] 10. Available from: https://www.frontiersin.org/articles/10.3389/fnagi.2018.00371/full [DOI] [PMC free article] [PubMed] [Google Scholar]
- Yassa MA, Lacy JW, Stark SM, Albert MS, Gallagher M, Stark CEL. 2011a. Pattern separation deficits associated with increased hippocampal CA3 and dentate gyrus activity in nondemented older adults. Hippocampus 21:968–79. [DOI] [PMC free article] [PubMed] [Google Scholar]
- Yassa MA, Mattfeld AT, Stark SM, Stark CEL. 2011b. Age-related memory deficits linked to circuit-specific disruptions in the hippocampus. Proc Natl Acad Sci 108:8873–8878. [DOI] [PMC free article] [PubMed] [Google Scholar]
- Yushkevich PA, Avants BB, Pluta J, Das S, Minkoff D, Mechanic-Hamilton D, Glynn S, Pickup S, Liu W, Gee JC, Grossman M, Detre JA. 2009. A high-resolution computational atlas of the human hippocampus from postmortem magnetic resonance imaging at 9.4 T. NeuroImage 44:385–398. [DOI] [PMC free article] [PubMed] [Google Scholar]
- Yushkevich PA, Pluta JB, Wang H, Xie L, Ding S-L, Gertje EC, Mancuso L, Kliot D, Das SR, Wolk DA. 2015. Automated volumetry and regional thickness analysis of hippocampal subfields and medial temporal cortical structures in mild cognitive impairment. Hum Brain Mapp 36:258–287. [DOI] [PMC free article] [PubMed] [Google Scholar]
- Yushkevich PA, Wang H, Pluta J, Das SR, Craige C, Avants BB, Weiner MW, Mueller S. 2010. Nearly Automatic Segmentation of Hippocampal Subfields in In Vivo Focal T2-Weighted MRI. NeuroImage 53:1208–1224. [DOI] [PMC free article] [PubMed] [Google Scholar]
- Zhu Y, Cribben I. 2018. Sparse Graphical Models for Functional Connectivity Networks: Best Methods and the Autocorrelation Issue. Brain Connect 8:139–165. [DOI] [PubMed] [Google Scholar]
- Zhuo J, Fan L, Liu Y, Zhang Y, Yu C, Jiang T. 2016. Connectivity Profiles Reveal a Transition Subarea in the Parahippocampal Region That Integrates the Anterior Temporal-Posterior Medial Systems. J Neurosci Off J Soc Neurosci 36:2782–2795. [DOI] [PMC free article] [PubMed] [Google Scholar]
Associated Data
This section collects any data citations, data availability statements, or supplementary materials included in this article.