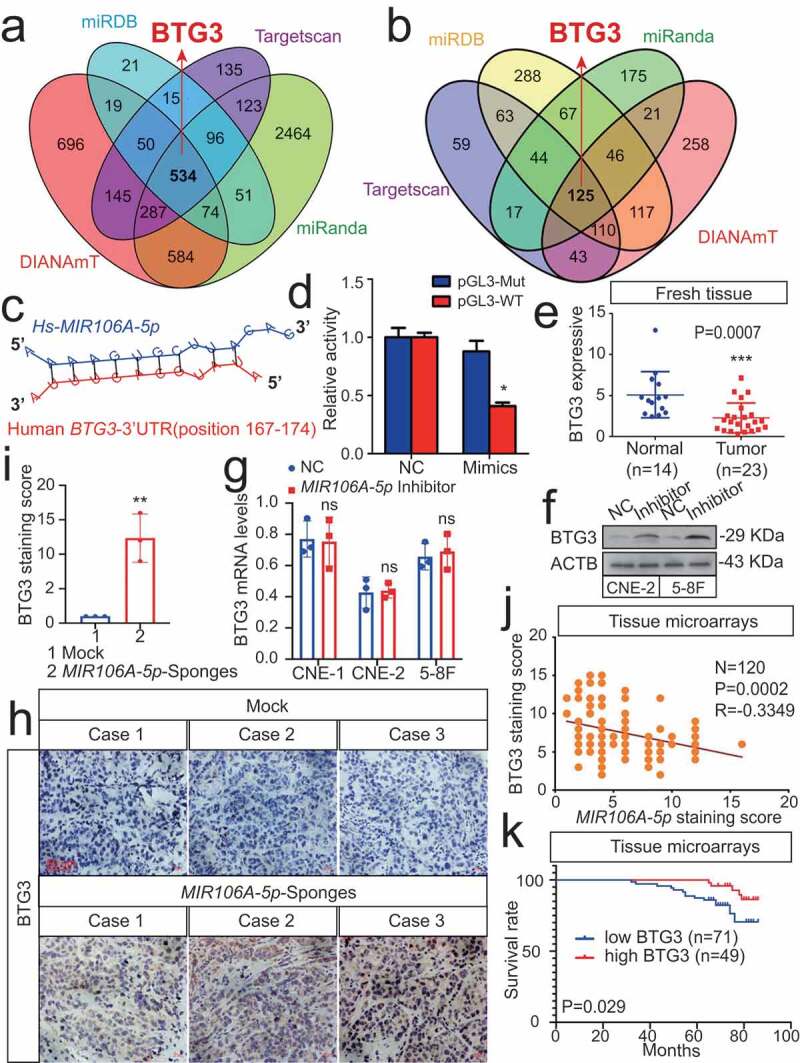
Figure 5.

MIR106A-5p directly targets BTG3. (A) Venn diagram depicting predicted MIR106A-5p targets. (B) Venn diagram depicting MIR106A-5p targets with high target scores. (C) Schematic of predicted MIR106A-5p binding sequences in the 3′-UTR of BTG3. (D) MIR106A-5p overexpression reduced wild-type BTG3 3′-UTR luciferase activity but not mutant BTG3 3′-UTR luciferase activity (analyzed using Student’s t-test). (E) BTG3 levels in fresh NPC and non-cancerous nasopharyngeal samples detected by qRT-PCR. P-values were calculated using two-tailed Student’s t-tests. (F) WB analysis of changes in BTG3 levels induced by MIR106A-5p silencing. (G) qRT-PCR analysis of changes in BTG3 levels induced by MIR106A-5p silencing. (H) Representative IHC images of BTG3 staining in tissues collected from two groups of NPC xenografts. Scale bar: 50 μm. (I) Quantification of IHC staining for MAP1LC3B expression using Student’s t-test (**P < 0.01). (J) IHC staining of BTG3 expression in NPC tissue microarrays. Pearson correlation between BTG3 and MIR106A-5p expression was analyzed. (K) The ISH staining score of BTG3 in NPC tissue microarrays was defined as low expression (scores of 0–7) or high expression (scores of 8–16) by the X-tile Software. Kaplan-Meier analysis was used to compare overall survival using the log-rank test. All experiments were conducted with three independent replicates. All graphs show mean ± SEM of at least three independent experiments. Unprocessed original scans of three independent blots for F are shown in Fig. S9
