. 2021 Jul 5;10:e66481. doi: 10.7554/eLife.66481

Figure 1. Human Bladder-chip model of UTI recapitulates the physiology of bladder filling and voiding.

(A) Schematic of the human bladder-chip with co-culture of the 5637 human bladder epithelial cell line (epithelium, top) and primary human bladder microvascular endothelial cells (endothelial, bottom) on either side of the stretchable and porous membrane. Pooled human urine diluted in PBS and endothelial cell medium were perfused in the apical and vascular channels respectively to mimic bladder physiology. A negative pressure in the ‘vacuum’ channels (magenta) on either side of the main channel was applied to stretch the porous membrane to mimic stretching of the bladder. (B, C) Immunofluorescence staining of confluent epithelial and endothelial cell monolayers (anti-EpCAM (magenta) and anti-CK7 (yellow) for the epithelial cells and anti-PECAM-1 (green) for the endothelial cells) in an uninfected control chip. Some endothelial cells also stained positive for CK7. Cell nuclei were labeled with DAPI (azure). (D) Schematic of the reconstitution of the bladder filling and voiding cycle via stretching of the membrane with a duty cycle of 6 hr. The cycle consisted of a linear increase in strain through stretching of the membrane (filling bladder, 0–2 hr), maintenance of the membrane under stretch (filled bladder, 2–4 hr), a quick relaxation of applied strain over 2 min (voiding bladder, 4:02 hr) and maintenance without applied strain (voided bladder, 4:02 hr to 6 hr). (E) An overview of the timeline of the experimental protocol including infection, addition of neutrophils via the vascular channel, and two cycles of antibiotic treatment interspersed by two bacterial growth cycles. The consecutive bladder duty cycles are indicated.

Figure 1.

Figure 1—figure supplement 1. Characterization of co-cultures of bladder epithelial cells and bladder endothelial cells in bladder-chip.

Figure 1—figure supplement 1.

Immunofluorescence characterization of 5637 bladder epithelial cells in bladder-chip for Epithelial Cell Adhesion Molecule (EpCAM) (A), cytokeratin 7 (CK7) (B), and cytokeratin 8 (CK8), a marker for differentiated uroepithelial cells (F). Immunofluorescence characterization of primary human bladder microvascular endothelial cells in bladder-chip for tight junction markers such as Platelet Endothelial Cell Adhesion Molecule-1 (PECAM-1) (C) and vascular endothelial cadherin (VE-cadherin) (G). Some endothelial cells also express CK7 (D). Filamentous actin staining for epithelial (E) and endothelial (H) cells. Cell nuclei were labeled with DAPI (azure) in all panels. Scale bars, 50 μm in all panels.
Figure 1—figure supplement 2. Characterization of monocultures of 5637 bladder epithelial cells and HMVEC-Bd bladder microvascular endothelial cells.

Figure 1—figure supplement 2.

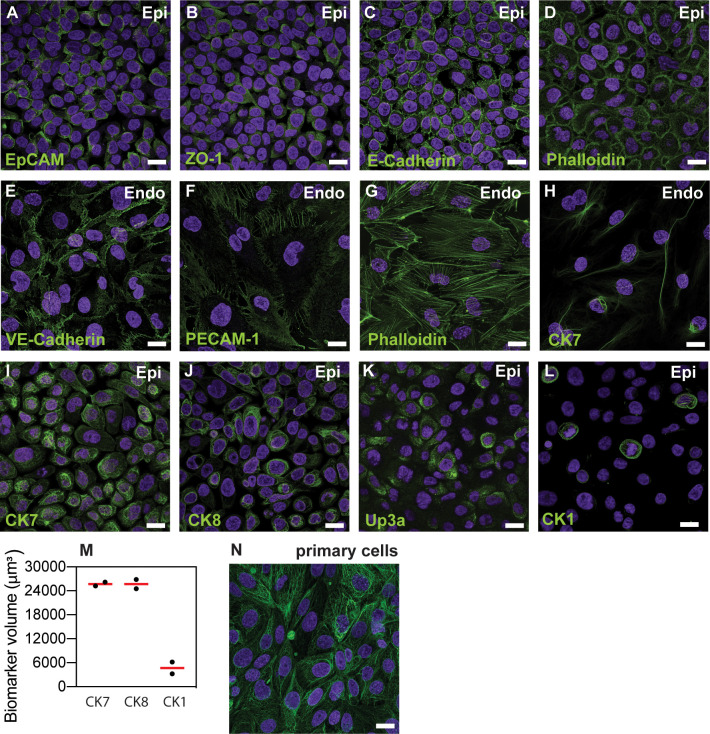
Characterization of the 5637 bladder epithelial cells for epithelial tight junction markers such as Epithelial Cell Adhesion Molecule (EpCAM) (A), Zonula Occludens-1 (ZO-1) (B), epithelial cadherins (E-cadherin) (C), and filamentous actin (Phalloidin) (D). Bladder endothelial cells express tight junction markers such as vascular, Platelet Endothelial Cell Adhesion Molecule-1 (PECAM-1) (E), endothelial cadherin (VE-cadherin) (F) and filamentous actin (Phalloidin) (G). Some endothelial cells also showed staining for CK7 (H). Characterization of the 5637 cells for the uroepithelial cell marker cytokeratin 7 (CK7) (I), for umbrella cell specific markers cytokeratin 8 (CK8) (J) and uroplakin 3a (Up3a) (K), and the basal cell marker cytokeratin 1 (CK1) (L). CK1 expression was sparse and lower than CK7 and CK8, data obtained from two fields of view in an ibidi μ-Slide eight well (M). Red lines represent the median value. Epithelial and endothelial cells were grown to ca. 75–90% confluence in ibidi 8-wells. Cell nuclei were labeled with DAPI (cyan). (N) Characterization of primary bladder epithelial cells for CK8 expression. Cell nuclei were labeled with DAPI (cyan). Scale bars, 10 μm in (A-L, N). Scale bars, 10 μm in (A-L, N).
Figure 1—figure supplement 3. Quantification of the linear strain in the PDMS membrane as a function of applied negative pressure in the vacuum channels of the bladder-chip.
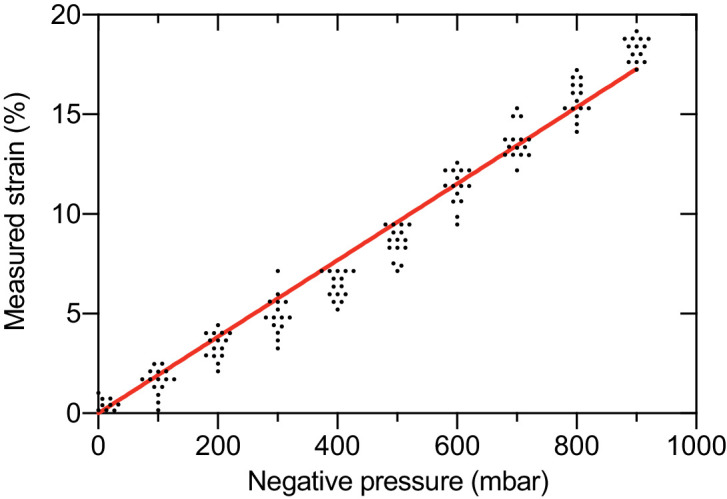
Figure 1—figure supplement 3.

Pore-to-pore distance was measured in the PDMS membrane (n=14) on human bladder chip under different values of applied pressure and used to calculate the linear strain (l=ls-lrlr). ls and lr refer to the pore-to-pore distance in the stretched (ls) and relaxed state (lr).