Abstract
Covid-19 is an emerging infectious disease caused by coronavirus SARS-CoV-2. Due to the rapid rise in deaths resulted from this infection all around the world, the identification of drugs against this new coronavirus is an important requirement. Among the drugs that can fight this type of infection; natural products are substances that serve as sources of beneficial chemical molecules for the development of effective therapies. In this study, Camphor, Artemisinin and 14 Sumac phytochemicals were docked in the active site of SARS-CoV-2 main protease (PDB code: 6LU7). We have also performed molecular dynamic simulation at 100 ns with MM-GBSA/PBSA analysis for the structures with the best affinity in the binding site of the studied enzyme (Hinokiflavone and Myricetin) after docking calculations to consider parameters like RMSD, covariance, PCA, radius of gyration, potential energy, temperature and pressure. The result indicates that Hinokiflavone and Myricetin are the structures with best affinity and stability in the binding site of the studied enzyme and they respect the conditions mentioned in Lipinski's rule and have acceptable ADMET proprieties; so, these compounds have important pharmacokinetic properties and bioavailability, and they could have more potent antiviral treatment of COVID-19 than the other studied compounds.
Keywords: Coronavirus, SARS-CoV-2, COVID-19, Hinokiflavone, Myricetin, Sumac, Molecular docking
1. Introduction
First reported case of SARS-CoV-2 infection was in Wuhan, China, on November 17, 2019. A month later, on December 15, the number of cases increased to 27. On December 20, it was 60, including several people who, working at the wholesale seafood market in Huanan, were hospitalized at the Huanan hospital, in the Hubei region, for pneumonia. On December 21, a diagnostic kit targeting twenty-two respiratory pathogens (eighteen viruses and four bacteria) giving a negative result, the doctors realized that they were in the presence of a new respiratory pathogen [[1], [2], [3], [4]].
Camphor is a solid bicyclic organic compound derived from the camphor laurel, a tree scientifically known as Cinnamomum camphora. It is a ketone of formula C10H16O. Camphor is a commonly available, nontoxic aromatic compound that is widely used for its anti-inflammatory and analgesic properties [5].
Artemisinin and its derivatives are a family of drugs that have the quickest action of all common falciparum malaria drugs. Therapies that combine artemisinin with another antimalarial drug are the preferred treatments not only for their effectiveness, but also for their patient tolerance. Artemisinin is also known as treatment against other diseases, including viral infections, cancer and parasitic and infections [6].
Sumac is an oriental spice, this spice is found everywhere in oriental cuisine. Although used in powder form, its natural state is a fruit [7], Sumac is the spicy product of the plant Rhus coriaria [8]. Rhus coriaria has importance due to its increasing use in pharmaceutical industries, food colorations and cosmetic [9]. According to the literature, Sumac possesses a multitude of biological activities, including anti-inflammatory activities [10].
Discovery of medications in the existing drugs and/or natural compounds may be the only response to the epidemic of unexpected infectious diseases, due to the long time of producing new medicines. Among the drugs proposed as antiviral agents of COVID-19; natural molecules are the most promising source for the development of drugs [11,12]. Currently, there are no proper antiviral therapies to treat patients with Sars-CoV-2 infections. Therefore, the search for active and safe antiviral agents with broad spectrum activity against this emerging and potentially fatal infection is urgent. Based on this effect the study of interactions between Camphor, Artemisinin and 14 Sumac Phytochemicals against SARS-CoV-2 main protease are recommended.
In this paper, molecular docking of Camphor, Artemisinin and 14 Sumac Phytochemicals were docked into the active site of SARS-CoV-2 main protease (Code PDB: 6LU7) to predict the mode of binding between these molecules and their potential target, also to determine the affinity of these molecules in the site active of SARS-CoV-2 main protease; following by evaluation of their Lipinski's rule violations, their ADMET proprieties prediction and Molecular Dynamic simulation.
2. Material and methods
2.1. Data set
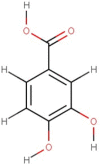
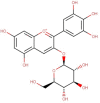
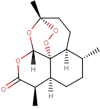
The natural molecules reported in Table 1 (Camphor, Artemisinin and 14 Sumac Phytochemicals) are tested as SARS-CoV-2 main protease potential inhibitors. 14 Sumac Phytochemicals are extracted from the literature [7]. The studied target protein is SARS-CoV-2 main protease, The crystal structure of this enzyme in complex with an inhibitor N3 (pdb code 6LU7) [13] is presented in Fig. 1 . Analysis of physicochemical parameters revealed that the SARS-CoV-2 main protease polypeptide is 306 amino acids long with a molecular weight of 33,796.64 Da and a GRAVY score of −0.019, categorising the protein as a stable, hydrophilic molecule capable of establishing hydrogen bonds, as indicated in the literature [14].
Table 1.
Chemical structures, ChemSpider URL link, and the ChemSpider ID for Camphor, Artemisinin and 14 Sumac Phytochemicals.
Fig. 1.
Crystal structure of SARS CoV-2 main protease (PDB ID: 6lu7) with the co-crystallized ligand (inhibitor N3).
2.2. Molecular docking
All studied molecules were obtained from chemical structure databases ChemSpider [15]. After collection of molecule structures, we have carried out a docking study of studied compounds in the binding pocket of SARS-CoV-2 main protease (pdb code 6LU7) [13] using Autodock vina [16] and Autodock tools 1.5.6 [17] packages. The crystallographic structure is imported into Discovery Studio 2016 visualized program [18] to detect binding site coordination (center of the active site; x = −10.782, y = 15.787 and z = 71.277) [19,20]. The grid size was set at 20 × 34 × 20 xyz points with a grid spacing of 1 Å [19,20].
2.3. Lipinski's rule and ADMET prediction
Lipinski's rule and ADMET [21] parameters of studied molecules were calculated using Swissadmet [22] and preADMET [23] web servers, respectively. Lipinski's rule including; molecular weight, number of rotatable bonds, number of hydrogen bonds acceptor, number hydrogen bonds donor and logP were determinate. Molecules violating more than one of these parameters may have problems with bioavailability and a high probability of failure to display drug-likeness [24].
We used preADMET server to predict the Absorption, Distribution, Metabolism, Excretion and Toxicity (ADMET) properties of the studied molecules. We predicted BBB: in vivo blood-brain barrier penetration (C.brain/C.blood), Buffer_solubility: Water solubility in buffer system (SK atomic types, mg/L), HIA: Human intestinal absorption (HIA, %); Pgp_inhibition: in vitro P-glecoprotein inhibition, SK logD in pH 7.4 (SK atomic types), SK logP (SK atomic types). We also predicted the metabolism of these molecules by certain CYP such as CYP450_2C19, CYP450_2C9, CYP_2D6, CYP450_3A4. The toxicity profiling includes testing of acute algae, daphnia and fish toxicity, Ames test for mutagenicity testing of several Salmonella typhimurium strains. Carcinogenicity testing is also included through 2 years carcinogenicity bioassay in rats and mice in addition to in vitro human ether-a-go-go related gene channel (hERG) inhibition testing.
2.4. Molecular dynamics
GROMACS simulation package (GROMACS 2020.4) was used to perform molecular dynamics simulations. MD simulation of both complexes were carried out for 100 ns in water using CHARMM36 m forcefield; trajectory and energy files were written every 10 ps.
The system was solvated in a truncated octahedral box, containing TIP3P water molecules. The protein was centered in the simulation box within minimum distance to the box edge of 1 nm to efficiently satisfy the minimum image convention. 4 Potassium ions were added to Hinokiflavone and Myricetin protein complexes to neutralize the overall system, each containing 66856 and 66909 atoms, respectively.
Minimization was carried out for 5000 steps using Steepest Descent Method and the convergence was achieved within the maximum force <1000 (KJ mol-1 nm-1), to remove any steric clashes. All three systems were equilibrated at NVT and NPT ensembles for 100ps (50,000 steps) and 1000ps (1,000,000 steps), respectively, using time steps 0.2 and 0.1 fs, respectively, at 300 K to ensure a fully converged system for production run.
Production run for simulation was carried out at a constant temperature of 300 K and a pressure of 1 atm or bar (NPT) using weak coupling velocity-rescaling (modified Berendsen thermostat) and Parrinello-Rahman algorithms, respectively. Relaxation times were set to τ T = 0.1 ps and τ P = 2.0 ps. All bond lengths involving hydrogen atom were kept rigid at ideal bond lengths using the Linear Constraint Solver (lincs) algorithm, allowing for a time step of 2 fs. Verlet scheme was used for the calculation of non-bonded interactions. Periodic Boundary Conditions (PBC) were used in all x, y, z directions. Interactions within a short-range cutoff of 1.2 nm were calculated in each time step. Particle Mesh Ewald (PME) was used to calculate the electrostatic interactions and forces to account for a homogeneous medium outside the long-range cutoff. The production was run for 100ns for both complexes.
3. Results and discussions
3.1. Docking results
Molecular docking was carried out to find the types of interactions and the binding affinity of studied molecules in the studied enzyme. 16 different molecules have been evaluated for their affinity against the SARS-CoV-2 main protease. The results are presented in Table 2 .
Table 2.
Docking results: Affinity of the best conformation in the binding pocket of SARS-CoV-2 main protease.
| N° | Name of molecules | Affinity (Kcal/mol) | N° | Name of molecules | Affinity (Kcal/mol) |
|---|---|---|---|---|---|
| 1 | Gallic acid | −5.4 | 9 | Myrtillin | −8.2 |
| 2 | Methyl gallate | −5.6 | 10 | Isoquercetin | −8.9 |
| 3 | Agathisflavone | −9.0 | 11 | Kaempferol | −7.5 |
| 4 | Sumaflavone | −10.7 | 12 | Myricetin | −7.7 |
| 5 | Pentagalloylglucose | −9.2 | 13 | Butein | −7.2 |
| 6 | Protocatechuic acid | −5.4 | 14 | β-caryophyllene | −6.4 |
| 7 | Hinokiflavone | −7.8 | 15 | Artemisinin | −7.7 |
| 8 | Chrysanthemin | −8.8 | 16 | Camphor | −5.5 |
The best energies of interaction with SARS-CoV-2 main protease are observed for Sumaflavone, Pentagalloylglucose, Agathisflavone, Chrysanthemin, Isoquercetin, Myrtillin, Hinokiflavone, Myricetin Sumac Phytochemicals and Artemisinin (Table 2); so, these compounds could have more inhibitory potential SARS-CoV-2 main protease than the other studied compounds. The inhibition of this protein will induce the inhibition of viral replication; these results show that these molecules could be interesting in the clinical management of COVID-19.
3.2. Lipinski's rule and ADMET prediction
The Lipinski's rule including molecular weight, number of rotatable bonds, number of hydrogen bonds acceptor, number hydrogen bonds donor and logP were shown in Table 3 .
Table 3.
Lipinski's role of studied compounds.
| Compound | Property |
Lipinski violations |
|||||
|---|---|---|---|---|---|---|---|
| Log P |
H-bond Acceptor |
H-bond Donor |
Rotatable bonds |
Molecular weight g/mol |
|||
| Rule | <4.15 | ≤10 | <5 | <10 | ≤500 | ≤1 | |
| N° | Name | ||||||
| 1 | Gallic acid | −0.16 | 5 | 4 | 1 | 170.12 | 0 |
| 2 | Methyl gallate | 0.18 | 5 | 3 | 2 | 184.15 | 0 |
| 3 | Agathisflavone | 0.25 | 10 | 6 | 3 | 538.46 | 2 |
| 4 | Sumaflavone | −0.25 | 11 | 7 | 3 | 554.46 | 3 |
| 5 | Pentagalloylglucose | −2.83 | 26 | 15 | 16 | 940.68 | 3 |
| 6 | Protocatechuic acid | 0.40 | 4 | 3 | 1 | 154.12 | 0 |
| 7 | Hinokiflavone | 0.52 | 10 | 5 | 4 | 538.46 | 1 |
| 8 | Chrysanthemin | −1.76 | 11 | 8 | 4 | 449.38 | 2 |
| 9 | Myrtillin | −2.25 | 12 | 9 | 4 | 465.38 | 2 |
| 10 | Isoquercetin | −2.59 | 12 | 8 | 4 | 464.38 | 2 |
| 11 | Kaempferol | −0.03 | 6 | 4 | 1 | 286.24 | 0 |
| 12 | Myricetin | −1.08 | 8 | 6 | 1 | 318.24 | 1 |
| 13 | Butein | 1.02 | 5 | 4 | 3 | 272.25 | 0 |
| 14 | β-caryophyllene | 4.63 | 0 | 0 | 0 | 204.35 | 1 |
| 15 | Artemisinin | 2.21 | 5 | 0 | 0 | 282.33 | 0 |
| 16 | Camphor | 2.30 | 1 | 0 | 0 | 152.23 | 0 |
All compounds respect the conditions mentioned in Lipinski's rule, except compounds Agathisflavone, Chrysanthemin, Myrtillin and Isoquercetin with two Lipinski violations, and Sumaflavone and Pentagalloylglucose with three Lipinski violations. The ADMET prediction was used in this study to calculate the pharmacokinetics parameters of others studied compounds that respect the conditions mentioned in Lipinski's rule (Table 4, Table 5 ).
Table 4.
In silico ADME properties of selected compounds.
| N° | Name | Bbb | Buffer_Solubility _mg_l | CYP450_2c19 Inhibition | CYP450_2c9 Inhibition | CYP_2d6 Inhibition | CYP_2d6 Substrate | CYP450_3a4 Inhibition | CYP450_3a4 Substrate | HIA % | Pgp Inhibition | Sklogd | Sklogp_ |
|---|---|---|---|---|---|---|---|---|---|---|---|---|---|
| 1 | Gallic acid | 0.348 | 1.56e006 | Yes | Yes | No | No | Yes | No | 53.696 | No | 0.132 | 1.380 |
| 2 | Methyl gallate | 0.379 | 136319 | No | Yes | No | No | Yes | No | 69.746 | No | 1.414 | 1.414 |
| 6 | Protocatechuic acid | 0.059 | 3358.28 | No | No | No | Weakly | No | Substrate | 88.561 | No | −1.39 | 0.012 |
| 7 | Hinokiflavone | 0.116 | 0.197 | Yes | Yes | No | No | Yes | Weakly | 86.954 | Yes | 4.726 | 4.726 |
| 11 | Kaempferol | 0.286 | 22.077 | Yes | Yes | No | No | Yes | No | 79.439 | No | 1.62 | 1.620 |
| 12 | Myricetin | 0.110 | 520.444 | Yes | Yes | No | No | Yes | Weakly | 40.964 | No | 1.72 | 1.726 |
| 13 | Butein | 0.425 | 276.948 | Yes | Yes | No | No | Yes | No | 80.604 | No | 2.838 | 2.838 |
| 14 | β-caryophyllene | 13.319 | 5.322 | Yes | Yes | No | No | No | Substrate | 100 | Yes | 4.896 | 4.896 |
| 15 | Artemisinin | 1.305 | 565.609 | No | Yes | No | No | Yes | Substrate | 96.314 | No | 1.6861 | 1.686 |
| 16 | Camphor | 0.867 | 20539.8 | No | Yes | No | No | Yes | Substrate | 100 | Yes | 2.085 | 2.085 |
Table 5.
In silico Toxicity of selected compounds.
| N° | Name | algae_at | Ames_test | Carcino_Mouse | Carcino_Rat | daphnia_at | hERG_inhibition | medaka_at | minnow_at | TA100_10RLI | TA100_NA | TA1535_10RLI | TA1535_NA |
|---|---|---|---|---|---|---|---|---|---|---|---|---|---|
| 1 | Gallic acid | 0.0780307 | mutagen | negative | positive | 0.689639 | low_risk | 0.591427 | 0.22656 | negative | positive | positive | negative |
| 2 | Methyl gallate | 0.0747441 | mutagen | negative | positive | 0.693308 | low_risk | 0.584076 | 0.280741 | negative | positive | positive | positive |
| 6 | Protocatechuic acid | 0.0971347 | mutagen | negative | positive | 0.668698 | low_risk | 0.53684 | 0.194292 | negative | positive | positive | negative |
| 7 | Hinokiflavone | 0.00169272 | mutagen | negative | positive | 0.00465568 | medium_risk | 7.35421e-005 | 0.000103708 | negative | negative | negative | negative |
| 11 | Kaempferol | 0.0483223 | mutagen | negative | positive | 0.196882 | medium_risk | 0.0642539 | 0.0294885 | negative | positive | negative | negative |
| 12 | Myricetin | 0.0291424 | mutagen | negative | positive | 0.23573 | low_risk | 0.0961311 | 0.0399958 | negative | positive | negative | negative |
| 13 | Butein | 0.0290945 | mutagen | negative | positive | 0.0992371 | medium_risk | 0.0165333 | 0.00980503 | negative | negative | negative | negative |
| 14 | β-caryophyllene | 0.0133391 | mutagen | negative | positive | 0.038144 | medium_risk | 0.00197809 | 0.000587073 | negative | negative | negative | negative |
| 15 | Artemisinin | 0.0343163 | mutagen | negative | positive | 0.155968 | low_risk | 0.0310529 | 0.020973 | negative | negative | positive | negative |
| 16 | Camphor | 0.0520106 | mutagen | negative | positive | 0.657225 | low_risk | 0.44056 | 0.340321 | negative | negative | positive | negative |
BBB: in vivo blood-brain barrier penetration (C.brain/C.blood), Buffer_solubility: Water solubility in buffer system (SK atomic types, mg/L), HIA: Human intestinal absorption (HIA, %); Pgp_inhibition: in vitro P-glecoprotein inhibition, SK logD in pH 7.4 (SK atomic types), SK logP (SK atomic types).
All selected molecules have low BBB, except the molecule β-Caryophyllen. The two molecules Camphor and β-Caryophyllen are completely absorbed; the other molecules have different and acceptable absorption percentages between 69% and 96%. For metabolism, all these molecules could be inhibitors for the cytochromes CYP450_3A4 and CYP450_2C9 except the molecule Protocatechuic acid, all the studied compounds could inhibit CYP_2d6. Additionally, the other pharmacokinetics parameters such as human intestinal absorption (HIA) and water solubility (log mol/L) are all acceptable (Table 4).
Examination of the preADMET toxicity screening results for the selected compounds are shown in Table 5. The results revealed that Hinokiflavone, Butein and β-caryophyllene showed negative AMES mutagenicity to all salmonella strains. Kaempferol, Myricetin, Artemisinin and Camphor showed positive AMES mutagenicity to only one of salmonella strains. Gallic acid and Protocatechuic acid are a mutagen for both TA100_NA and TA1535_10RLI strains. Methyl gallate showed positive AMES mutagenicity to three salmonella strains. Moreover, Gallic acid, Methyl gallate, Protocatechuic acid and Camphor showed the highest toxicity against algae, daphnia, and fish. Additionally, all selected compounds showed positive carcinogenicity for either rat, and negative carcinogenicity for mice. Also, all of them have a low or medium risk for hERG_ inhibition (Table 5).
From these results, we can conclude that Hinokiflavone, Myricetin and Artemisinin are the structures with best affinity in the binding site of the studied enzyme and all of them respect the conditions mentioned in Lipinski's rule and have acceptable ADMET proprieties; so, these compounds could have more potent antiviral treatment of COVID-19 than the studied compounds, and they have important pharmacokinetic properties and bioavailability.
3.3. Interactions of selected compounds in the binding pocket of studied enzyme
The co-crystallized ligand taken from the crystal structure of studied enzyme present a large variety of interactions (Fig. 2 ), there are present of Conventional Hydrogen Bonds, amide-π Staked interactions, Carbon Hydrogen Bond, van der Waals interaction, Alkyl and π-Alkyl interactions,.
Fig. 2.
Interactions between inhibitor N3 and SARS-CoV-2 main protease.
The result of interactions between Hinokiflavone and the studied enzyme (Fig. 3 ) shows Conventional Hydrogen Bond, π-Sulfur, Amide-π Stacked and π-Alkyl.
Fig. 3.
2D and 3D presentations of interactions between Hinokiflavone and SARS-CoV-2 main protease.
Docking study of Myricetin in SARS-CoV-2 main protease 6LU7 (Fig. 4 ) shows π-Donor Hydrogen Bond, π-π Stacked, π-π Τ-shaped and π-Alkyl.
Fig. 4.
2D and 3D presentations of interactions between Myricetin and SARS-CoV-2 main protease.
The affinity of these compounds (Hinokiflavone, Myricetin) in the binding pocket of studied enzyme can be explained by the number and type of bonds noticed in these complexes. The inhibition of this studied enzyme will induce the inhibition of viral replication; these results show that the selected molecules could be interesting in the clinical management of COVID-19.
3.4. Molecular dynamic
3.4.1. Simply root-mean-square deviation (RMSD)
Simply root-mean-square deviation (RMSD) calculated for the two complexes based on ‘C-alpha’ atoms using Gromacs program are shown in Fig. 5 . The mean RMSD values are: (a) Hinokiflavone-protein complex = 1.85 ± 0.21 Å and (b) Myricetin-protein complex = 2.58 ± 0.55 Å. RMSD graph for Hinokiflavone-protein complex shows the structure remained stable throughout simulation time. Myricetin-protein complex shows increase in RMSD values which indicate local conformational changes in protein, particularly in C-terminal, as indicated by RMSF analysis.
Fig. 5.
RMSD for (a) Hinokiflavone-protein complex and (b) Myricetin-protein complex based on ‘C-alpha’ atoms.
Simply root-mean-square deviation (RMSD) calculated for both the ligands based on respective ligand's atoms using Gromacs program are shown in Fig. 6 . The mean RMSD values are: (a) Hinokiflavone = 0.90 ± 0.24 Å and (b) Myricetin = 0.57 ± 0.14 Å. RMSD shows that Hinokiflavone is quite flexible in protein binding site due to its higher number of rotating bonds in the molecule while the Myricetin is comparatively less flexible, as it has only one rotatable bond. The fluctuation pattern for Myricetin also indicates that the ligand is sometime rigid and sometime little flexible, possibly due to the fact that ligand is not always present in the binding pocket.
Fig. 6.
RMSD for (a) Hinokiflavone -protein complex and (b) Myricetin-protein complex based on respective ligand's atoms.
3.4.2. Root Mean Square Fluctuations (RMSF)
Root Mean Square Fluctuations (RMSF) calculated for both complexes ((a) Hinokiflavone and (b) Myricetin complexed with protein based on ‘C-alpha’ atoms using Gromacs program are shown in Fig. 7 . Overall the fluctuation pattern is same for both the complexes. However, the C terminals are significantly flexible in Myricetin (b), which supports why RMSD is higher for Myricetin.
Fig. 7.
RMSF calculated for (a) Hinokiflavone and (b) Myricetin based on ‘C-alpha’ atoms.
3.4.3. Radius of gyration (ROG)
Radius of gyration (ROG) calculated for both complexes based on ‘C-alpha’ atoms using Gromacs program are shown in Fig. 8 . The mean RoG values for (a) Hinokiflavone and (b) Myricetin protein complexes are 22.46 ± 0.12 Å and 22.60 ± 0.18 Å, respectively. The slight fluctuation within 0.5 Å Rog value during the MD simulation time indicates a negligible changes in the compactness of protein for Hinokiflavone. However, the higher fluctuation in Myricetin complex shows local conformational changes leading to a slight change in the compactness of protein.
Fig. 8.
ROG calculated (a) Hinokiflavone = 22.46 ± 0.12 Å and (b) Myricetin = 22.60 ± 0.18 Å.
3.4.4. Intermolecular analysis by MD simulation
3.4.4.1. Protein-Hinokiflavone complex
50 snapshots of Hinokiflavone taken at every 2ns during 100ns of simulation time. Fig. 9 indicates that the ligand remains bound with the protein with some conformational changes. The conformation of protein is set to the initial conformation referring to 0ns of simulation.
Fig. 9.
Protein- Hinokiflavone complex during 100ns of simulation time.
3.4.4.2. Protein-Myricetin complex
50 snapshots of Myricetin taken at every 2ns during 100ns of simulation time. Fig. 10 indicates that the ligand binds at two major regions of the protein. The conformation of protein is set to the initial conformation referring to 0ns of simulation.
Fig. 10.
Protein-Myricetin complex during 100ns of simulation time.
3.4.5. Hydrogen bonds (protein-ligand)
Fig. 11 shows Total number of hydrogen bonds formed between ligand and protein during 100ns of simulation time. The mean number of H-bonds are: (a) Hinokiflavone = 1.72 ± 1.05 and (b) Myricetin = 2.09 ± 1.51. Although Myricetin exhibits higher average number of H-bonds with protein, the bonds are not consistent. Missing h-bonds during 19–24ns indicate that Myricetin has left the binding pocket. On the other hand, Hinokiflavone exhibits consistent h-bonds with protein and remain s in bound form, conformations are however changed.
Fig. 11.
Total number of hydrogen bonds formed between ligand and protein during 100ns for (a) Hinokiflavone = 1.72 ± 1.05 and (b) Myricetin = 2.09 ± 1.51.
3.4.6. Hydrogen bonds (within protein)
Fig. 12 shows Total number of hydrogen bonds formed within protein during 100ns of simulation time. The mean number of H-bonds are: (a) Hinokiflavone-protein = 216.04 ± 7.37 and (b) Myricetin-protein = 212.04 ± 6.46.
Fig. 12.
Total number of hydrogen bonds formed within protein during 100ns for (a) Hinokiflavone-protein = 216.04 ± 7.37 and (b) Myricetin-protein = 212.04 ± 6.46.
3.4.7. Center of mass distance between ligand and protein
Fig. 13 shows Average Center-of-Mass Distance between ligand and protein during 100ns of simulation time. The mean distances are: (a) Hinokiflavone = 2.36 ± 0.18 Å and (b) Myricetin = 3.11 ± 0.76 Å. The plot indicates that Hinokiflavone exhibits close interactions with protein with fewer fluctuations during 32–38ns and 65–75ns of simulation. On the other hand, Myricetinexhibits a sudden higher distance fluctuations particularly between 20-30 and 90–100 ns, which indicates that ligand leaves the binding pocket. The distance from 30ns to 90ns indicates that the ligand binds back to the protein, however, the site is different than those during 0–18ns.
Fig. 13.
Average Center-of-Mass Distance between ligand and protein during 100ns for (a) Hinokiflavone = 2.36 ± 0.18 Å and (b) Myricetin = 3.11 ± 0.76 Å.
3.4.8. Principal Component Analysis
Fig. 14 shows Principal Component analysis of both complexes ((a) Hinokiflavone and (b) Myricetin) calculated from Bio3D program of R. All three PCs captured (a) 42.9% and (b) 63.3% of structural variance in protein.
Fig. 14.
Principal Component Analysis for (a) Hinokiflavone and (b) Myricetin by using Bio3D program of R.
3.4.8.1. PCA-1 and PCA-2 of Hinokiflavone
Fig. 15 shows Interpolated structures of Hinokiflavone along PC1 and PC2 produced by the mktrj.pca() function. In this view atoms are colored on a scale from blue to red, where blue represents atoms showing large motion amplitudes, and red are more rigid atoms.
Fig. 15.
Interpolated structures of Hinokiflavone along PC1 and PC2 produced by the mktrj.pca() function.
3.4.8.2. PCA-1 and PCA-2 of Myricetin
Fig. 16 shows Interpolated structures of Myricetin along PC1 and PC2 produced by the mktrj.pca() function. In this view atoms are colored on a scale from blue to red, where blue represents atoms showing large motion amplitudes, and red are more rigid atoms.
Fig. 16.
Interpolated structures of Myricetin along PC1 and PC2 produced by the mktrj.pca() function.
3.4.9. Dynamic Cross Correlation Matrix Analysis (DCCM)
Fig. 17 shows Protein Residue dynamic cross correlated motions for both complexes ((a) Hinokiflavone and (b) Myricetin) calculated from Bio3D program of R. Colors varying from red to white to Blue indicate intensity of correlated motion, where blue colors indicates positive correlation, white shows no correlation and pink color indicates negative correlated motions between residues.
Fig. 17.
Dynamic Cross Correlation Matrix Analysis (DCCM) for (a) Hinokiflavone and (b) Myricetin by using Bio3D program of R.
3.4.10. Potential energy
Fig. 18 shows Potential energy of system (a) Hinokiflavone and (b) Myricetin during 100 ns of MD simulation as obtained from Gromacs energy file. Both graphs show converged potential energy.
Fig. 18.
Potential energy of system (a) Hinokiflavone and (b) Myricetin during100 ns of MD simulation.
3.4.11. Pressure
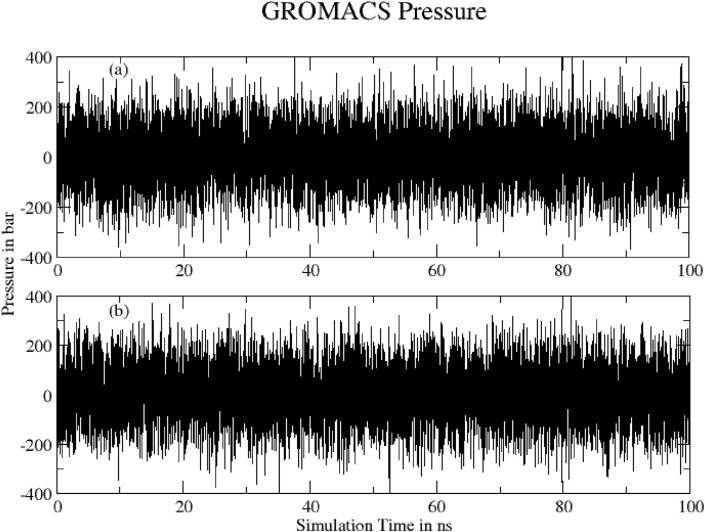
Fig. 19 shows Total pressure of system (a) Hinokiflavone and (b) Myricetin during 100 ns of MD simulation as obtained from Gromacs energy file. Both plots show converged pressure.
Fig. 19.
Total pressure of system (a) Hinokiflavone and (b) Myricetin during 100 ns of MD simulation.
3.4.12. Temperature
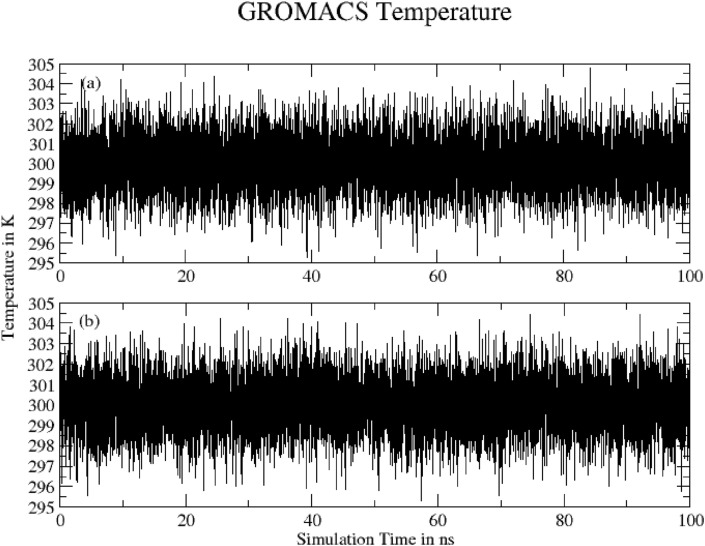
Fig. 20 shows Temperature of system (a) Hinokiflavone and (b) Myricetin during 100 ns of MD simulation as obtained from Gromacs energy file. Both plots show converged temperature.
Fig. 20.
Temperature of system (a) Hinokiflavone and (b) Myricetin during 100 ns of MD simulation.
3.4.13. MMPBSA binding energy
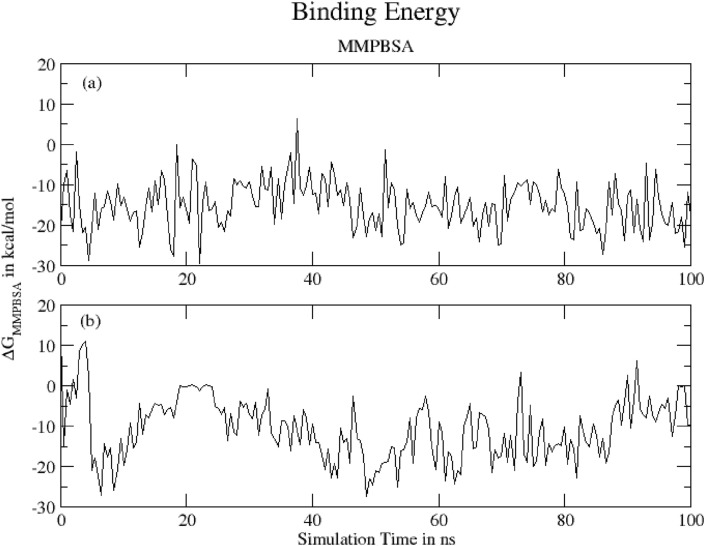
Fig. 21 shows Binding energy of (a) Hinokiflavone and (b) Myricetinprotein complexes during 100 ns of MD simulation as obtained MMPBSA method. The mean MMPBSA binding energy was found to be -15.15 ± 5.95 kcal/mol and -10.60 ± 7.67 kcal/mol at 310 K, respectively, for Hinokiflavone- and Myricetin-protein complexes (Table 6 ). The result for Hinokiflavone complex shows that the ligand remains in bound form during whole simulation time. For Myricetin complex it is clear that the ligand tends to bind at two different regions of protein.
Fig. 21.
Binding energy of (a) Hinokiflavone and (b) Myricetinprotein complexes during 100 ns of MD simulation.
Table 6.
MMPBSA binding energy in kcal/mol for protein-ligand complex.
| 6lu7 Complex with: | ΔEVDW (van der Waal's energy) | ΔEelec (Coulombic energy) | ΔGPB (Poisson-Boltzmann Polar solvation energy) | ΔESASA (Non-Polar solvation energy) | ΔGMMPBSA (Protein-Ligand Binding energy) |
|---|---|---|---|---|---|
| Hinokiflavone | −33.29 ± 7.61 | −11.37 ± 8.17 | 33.03 ± 8.25 | −3.53 ± 0.55 | −15.15 ± 5.94 |
| Myricetin | −16.34 ± 7.42 | −22.05 ± 19.53 | 29.74 ± 16.37 | −1.95 ± 0.73 | −10.60 ± 7.65 |
4. Conclusion
In this study, we have tried to carry out a docking study of Camphor, Artemisinin and 14 Sumac Phytochemicals in the active site of SARS-Cov-2 main protease, following by the evaluation of their Lipinski's rule violation and ADME proprieties predictions. The result indicates that Hinokiflavone and Myricetin are the structures with best affinity and stability in the binding site of the enzyme; and they have important pharmacokinetic properties and bioavailability. So, these compounds could have more potent antiviral treatment of COVID-19 than the studied compounds. The synthesis of these molecules and the evaluation of their in vitro activity against COVID-19 could be interesting. These results are supported by many other researches. According to the literature, Sumac Phytochemicals and Artemisinin possess a multitude of biological activities, including viral infections, cancer, anti-inflammatory and parasitic and infections.
Declaration of competing interests
The authors declare that they have no known competing financial interests or personal relationships that could have appeared to influence the work reported in this paper.
The authors declare the following financial interests/personal relationships which may be considered as potential competing interests:
References
- 1.Elfiky A.A. Anti-HCV, nucleotide inhibitors, repurposing against COVID-19. Life Sci. 2020;248:117477. doi: 10.1016/j.lfs.2020.117477. [DOI] [PMC free article] [PubMed] [Google Scholar]
- 2.Wu C., Liu Y., Yang Y., Zhang P., Zhong W., Wang Y., Wang Q., Xu Y., Li M., Li X., et al. Analysis of therapeutic targets for SARS-CoV-2 and Discovery of potential drugs by computational methods. Acta Pharm. Sin. B. 2020 doi: 10.1016/j.apsb.2020.02.008. [DOI] [PMC free article] [PubMed] [Google Scholar]
- 3.Singh A.K., Singh A., Shaikh A., Singh R., Misra A. Chloroquine and hydroxychloroquine in the treatment of COVID-19 with or without diabetes: a systematic search and a narrative review with a special reference to India and other developing countries. Diabetes Metab. Syndr. Clin. Res. Rev. 2020;14:241–246. doi: 10.1016/j.dsx.2020.03.011. [DOI] [PMC free article] [PubMed] [Google Scholar]
- 4.Kang D., Choi H., Kim J.-H., Choi J. Spatial epidemic dynamics of the COVID-19 outbreak in China. Int. J. Infect. Dis. 2020 doi: 10.1016/j.ijid.2020.03.076. [DOI] [PMC free article] [PubMed] [Google Scholar]
- 5.Likhite R., Banerjee A., Ghosh C., Majumder A., Karkhanis M., Kim H., Mastrangelo C.H. 2020. Mems stiction suppression using low-stress camphor sublimation; pp. 291–294. Proceedings of the 2020 IEEE 33rd International Conference on Micro Electro Mechanical Systems (MEMS); January. [Google Scholar]
- 6.Wang X., Zheng B., Ashraf U., Zhang H., Cao C., Li Q., Chen Z., Imran M., Chen H., Cao S., et al. Artemisinin inhibits the replication of flaviviruses by promoting the type I interferon production. Antivir. Res. 2020;179:104810. doi: 10.1016/j.antiviral.2020.104810. [DOI] [PubMed] [Google Scholar]
- 7.Sakhr K., El Khatib S. Physiochemical properties and medicinal, nutritional and industrial applications of Lebanese sumac (Syrian sumac - Rhus coriaria): a review. Heliyon. 2020;6 doi: 10.1016/j.heliyon.2020.e03207. [DOI] [PMC free article] [PubMed] [Google Scholar]
- 8.Shariatmadari F., Shariatmadari R. Sumac (Rhus coriaria) supplementation in poultry diet. World’s Poult. Sci. J. 2020:1–7. doi: 10.1080/00439339.2020.1745724. [DOI] [Google Scholar]
- 9.Kizil S., Turk M. Microelement contents and fatty acid compositions of Rhus coriaria L. And pistacia terebinthus L. Fruits spread commonly in the south eastern anatolia region of Turkey. Nat. Prod. Res. 2010;24:92–98. doi: 10.1080/14786410903132555. [DOI] [PubMed] [Google Scholar]
- 10.Khalilpour S., Behnammanesh G., Suede F., Ezzat M.O., Muniandy J., Tabana Y., Ahamed M.B., Tamayol A., Majid A.M.S., Sangiovanni E. Neuroprotective and anti-inflammatory effects of Rhus coriaria extract in a mouse model of ischemic optic neuropathy. Biomedicines. 2018;6:48. doi: 10.3390/biomedicines6020048. [DOI] [PMC free article] [PubMed] [Google Scholar]
- 11.Aanouz I., Belhassan A., El Khatabi K., Lakhlifi T., El Idrissi M., Bouachrine M. Moroccan medicinal plants as inhibitors of COVID-19: computational investigations. J. Biomol. Struct. Dyn. 2020;1–12 doi: 10.1080/07391102.2020.1758790. [DOI] [PMC free article] [PubMed] [Google Scholar]
- 12.Sokolova A.S., Yarovaya О.I., Korchagina D.V., Zarubaev V.V., Tretiak T.S., Anfimov P.M., Kiselev O.I., Salakhutdinov N.F. Camphor-based symmetric diimines as inhibitors of influenza virus reproduction. Bioorg. Med. Chem. 2014;22:2141–2148. doi: 10.1016/j.bmc.2014.02.038. [DOI] [PMC free article] [PubMed] [Google Scholar]
- 13.Protein data bank PDB. (http://www.rcsb.org).
- 14.Tahir ul Qamar M., Alqahtani S.M., Alamri M.A., Chen L.-L. Structural basis of SARS-CoV-2 3CLpro and anti-COVID-19 drug Discovery from medicinal plants. J. Pharm. Anal. 2020;10:313–319. doi: 10.1016/j.jpha.2020.03.009. [DOI] [PMC free article] [PubMed] [Google Scholar]
- 15.Pence H.E., Williams A. ChemSpider. An online chemical information resource. J. Chem. Educ. 2010;87:1123–1124. doi: 10.1021/ed100697w. [DOI] [Google Scholar]
- 16.Trott O., Olson A.J., Vina AutoDock. Improving the speed and accuracy of docking with a new scoring function, efficient optimization, and multithreading. J. Comput. Chem. 2010;31:455–461. doi: 10.1002/jcc.21334. [DOI] [PMC free article] [PubMed] [Google Scholar]
- 17.Hunter C.A., Lawson K.R., Perkins J., Urch C.J. Aromatic interactions. J. Chem. Soc. Perkin Trans. 2001;2:651–669. doi: 10.1039/B008495F. [DOI] [Google Scholar]
- 18.Dassault Systèmes BIOVIA Discovery Studio Modeling Environment Release 2017 Dassault Systèmes. 2016. [Google Scholar]
- 19.Hakmi M., Bouricha E.M., Kandoussi I., El Harti J., Ibrahimi A. Repurposing of known anti-virals as potential inhibitors for SARS-CoV-2 main protease using molecular docking analysis. Bioinformation. 2020;16:301. doi: 10.6026/97320630016301. [DOI] [PMC free article] [PubMed] [Google Scholar]
- 20.Belhassan A., En-nahli F., Zaki H., Lakhlifi T., Bouachrine M. Assessment of effective imidazole derivatives against SARS-CoV-2 main protease through computational approach. Life Sci. 2020:118469. doi: 10.1016/j.lfs.2020.118469. [DOI] [PMC free article] [PubMed] [Google Scholar]
- 21.Jalkute C.B., Barage S.H. 107–115. 2015. (Identification of Angiotensin Converting Enzyme Inhibitor : an in Silico Perspective). [DOI] [Google Scholar]
- 22.Daina A., Michielin O., Zoete V. SwissADME : a free web tool to evaluate pharmacokinetics , drug- likeness and medicinal chemistry friendliness of small molecules. Nat. Publ. Group. 2017:1–13. doi: 10.1038/srep42717. [DOI] [PMC free article] [PubMed] [Google Scholar]
- 23.PreADMET | prediction of ADME/tox available online: https://preadmet.bmdrc.kr/ (accessed on.
- 24.Zhao Y.H., Abraham M.H., Le J., Hersey A., Luscombe C.N., Beck G., Sherborne B., Cooper I. Rate-limited steps of human oral absorption and QSAR studies. 2002;19:1446–1457. doi: 10.1023/a:1020444330011. [DOI] [PubMed] [Google Scholar]


