

Abstract
Histone deacetylase (HDAC) proteins, which regulate the acetylation state of proteins, are the targets of multiple clinical drugs for cancer treatment. Due to the heterogeneity of tumors, HDAC proteins play different roles in the progression of various cancer types. For example, MDA-MB-468 and MDA-MB-231 cells are both triple negative breast cancer cells but belong to different subtypes that display different response to HDAC inhibitor drugs. To investigate the role of HDAC proteins in breast cancer, the substrate and associated proteins of HDAC1 in MDA-MB-231, MDA-MB-468, and a normal breast epithelial cell line, MCF10A, were analyzed using substrate trapping mutants and proteomics-based mass spectrometry. All three cell lines demonstrated nonoverlapping substrate protein profiles. While both normal MCF10A and cancerous MDA-MB-468 cell lines contained similar HDAC1 associated proteins, including proteins associated with epigenetic and RNA processing mechanisms, the HDAC1 associated protein profile of MDA-MB-231 cells was devoid of expected epigenetic proteins. The variable associated protein profiles of MDA-MB-231 and MDA-MB-468 suggest that HDAC1 plays distinct roles in breast cancer cell biology, which might affect cancer aggressiveness and HDAC inhibitor sensitivity.
Graphical Abstract

Introduction
Breast cancer is a leading cause of mortality in the United States of America, accounting for 14% of all estimated deaths. Among women, breast cancer is the second leading cause of cancer-related death.1 Breast cancer is routinely diagnosed based on the levels of estrogen receptor (ER), progesterone receptor (PR) and human epidermal growth factor receptor 2 (HER2) due to the availability of hormone therapeutics targeting each of these receptors.2 Breast cancers diagnosed with low levels of all three biomarkers are considered triple negative breast cancer (TNBC) which, therapeutically, is the most challenging subtype of breast cancer. In addition, breast cancers maintain extensive heterogeneity, and genomic profiling has indicated two molecular subtypes: Luminal and basal-like.3 Luminal breast cancer cells are characterized by positive expression of ER and/or PR, and thus have established treatment options. In contrast, basal-like breast cancer cells are more aggressive and usually include TNBC, which limits treatment options.4 While the luminal cluster of breast cancer cell lines are generally uniform, the basal-like cluster can be further classified as “basal “A” and basal “B” with different prognosis and aggressiveness.3 Different subtypes of breast cancer maintain distinct molecular and cellular signatures, which likely influence therapeutic effectiveness. While classification of receptor expression and subtype of breast cancer can suggest treatment options, the heterogeneity of breast cancer cells remains a key obstacle in breast cancer treatment, particularly for TNBC.3, 5 Gaining insights into the molecular differences between breast cancer cell types represents a first step toward realizing the goal of personalized treatment.
Histone deacetylase (HDAC) proteins have emerged as attractive therapeutic targets in many cancers, including breast.6 HDAC enzymes catalyze the removal of the acetyl group from acetyllysine. Lysine acetylation is a prominent posttranslational modification similar to protein phosphorylation, with implication in numerous cellular functions.7 Acetyllysine was initially identified on nucleosomal histone proteins, and alteration in chromatin structure by histone acetylation was shown to regulate gene expression.8 In fact, the loss of global histone H4 acetylation due to elevated HDAC activity is a hallmark of cancer onset.9 Overexpression of HDAC proteins reduces the levels of many proteins, including tumor suppressors.10 Many studies have demonstrated a correlation between overexpression of HDAC proteins and human tumor formation.11 The HDAC family is comprised of eighteen isoforms, with eleven metal-dependent HDAC isoforms, (HDAC1–11) within the family.12 Among the metal-dependent HDAC proteins, HDAC1 is highly expressed in roughly 33% of breast cancers.13 For example, HDAC1 mRNA was elevated in patients with invasive breast carcinoma.6 HDAC1 overexpression has been associated with silencing of the ER gene and reduction of ER activity in breast cancers.14 The relationship between HDAC1 and breast cancer metastasis and invasiveness is well documented,14–16 which suggests distinct activities of HDAC proteins in the various breast cancer subtypes.
Due to their role in cancer formation and progression, HDAC proteins are therapeutic targets in various cancer, including breast cancer.13, 17 Currently four HDAC inhibitors have been approved as cancer therapeutics, including SAHA (suberoyl anilide hydroxamic acid or Vorinostat) for treatment of cutaneous T-cell lymphoma.10, 11 Given the role of HDAC proteins in breast cancer, currently approved HDAC inhibitors have been studied for the treatment of breast cancer,18 including SAHA and panobinostat.17, 19 While results of a phase II trial of SAHA against metastatic breast cancer were inconclusive,17 the combination of HDAC inhibitors with hormone treatment showed positive outcomes.20, 21 HDAC inhibitors represent an exciting avenue for anti-cancer drug development.
Given the possible value of HDAC inhibitors in breast cancer treatment, understanding the full role of HDAC proteins in breast cancer cells would be instructive. Unfortunately, most studies to date focused on the correlation between HDAC1 expression and key breast cancer biomarkers, such as ER.14 These studies have failed to explore the large spectrum of HDAC1 functions, including their enzymatic activities, substrate profiles, and HDAC associated protein complexes. We have recently developed a simple method called “substrate trapping” to identify HDAC substrates (Figure 1). In the trapping strategy, inactive HDAC1 mutant (C151A) binds to substrates (Figure 1B) with longer residence time compared to wild type HDAC1 (Figure 1A). As a consequence, the inactive mutant assists in capturing HDAC1 substrates for subsequent identification by liquid chromatography-tandem mass spectrometry (LC-MS/MS) analysis. Prior work documented that inactive mutants of HDAC1 interact with associated proteins outside of the active site, indicating that mutants only affected substrate binding.22, 23 The trapping strategy has been previously applied in HEK293 and Jurkat cells, with the identification of two unanticipated HDAC1 substrates, KDM1A (LSD1) and Eg5.24, 25 We have also optimized the method to profile HDAC1 substrates in the full proteome of HEK293 cells.26 Substrate trapping represents a powerful tool to characterize the substrate profile of HDAC1 and define the full biological role of HDAC1 in normal and disease states.
Fig. 1.

Substrate trapping strategy. A) Wild type HDAC1 binds substrates transiently due to release after deacetylation, making enrichment and identification difficult and inconsistent. B) Inactive mutant HDAC1 binds substrates with longer residence time without deacetylation, allowing effective enrichment and identification of substrates.
To provide insight into the role of HDAC1 in breast cancer progression, we applied the substrate trapping strategy to two breast cancer cell models- MDA-MB-231 and MDA-MB-468. MDA-MB-231 and MDA-MB-468 cells are both classified as basal-like TNBC cells; MDA-MB-468 cells are classified as the less aggressive “basal A” subtype, whereas MDA-MB-231 cells are considered the more aggressive “basal B” subtype.3 Interestingly, MDA-MB-231 cells showed greater sensitivity to HDAC inhibitors27 compared to MDA-MB-468.15, 16, 19 Here, the substrate profiles of MDA-MB-231 and MDA-MB-468 were compared to the profile of the normal MCF10A breast cell line. Interestingly, the HDAC1 substrate profiles were distinct among the three cell lines. At the same time, the trapping method also revealed associated proteins of HDAC1 in the three cell lines, which showed that both non-tumorous MCF10A and the less aggressive MDA-MB-468 tumor cells maintained key proteins with epigenetic functions, whereas the more aggressive MDA-MB-231 cell line did not. These studies suggest that breast cancer cell biology is distinguished by variable HDAC1-dependent epigenetic gene regulation, which provides a foundation for future studies analyzing HDAC1 activities of other cancer cell lines.
Materials and Methods
Cell culture, plasmids and transient transfections
MCF10A cells were cultured in a DMEM:F12 Ham’s media mixture (1:1 ratio) supplemented with 5% equine serum (Invitrogen), EGF (20 ng/ml, Gibco, ThermoFisher Scientific, Waltham, MA, U.S.A.), insulin (10 μg/ml, Sigma Aldrich, St. Louis, MO, U.S.A.), hydrocortisone (0.5 mg/ml, Sigma), cholera toxin (100 ng/ml, Sigma), Antibiotic-Antimycotic (1X) (Gibco, 15240062, Gaithersburg, MD, U.S.A.) at 37°C in a 5% CO2 environment. MDA-MB-231 and MDA-MB-468 cells were cultured in DMEM high glucose Glutamax™ (Life Technologies, Grand Island, NY, U.S.A.) supplemented with 10% fetal bovine serum (Life Technologies) at 37°C in a 5% CO2 environment. HDAC1 single point mutants in the pBJ5HDAC1-FLAG expression plasmid have been previously described.25 Transfection of pBJ5HDAC1-FLAG wild type or C151A mutant plasmids (10 μg) into either MCF10A cells (2 × 10⁷) or MDA-MB-231 cells (3 × 10⁷) was performed using Jetprime transfection reagent (VWR, Radnor, PA, U.S.A.) according to manufacturer’s instructions. Transfection of pBJ5HDAC1-FLAG wild type or C151A mutant plasmids (10 μg) into MDA-MB-468 cells (3 × 10⁷) was performed using MDA-MB-468 cell Avalanche™ transfection reagent (EZ Biosystems, College Park, MD, U.S.A.), according to manufacturer’s instructions. After 48 h recovery growth, cells were treated with SAHA (5 μM in growth medium containing <2% DMSO), grown for another 24 h, harvested, and either stored at −80°C or used immediately.
Substrate trapping and inhibitor competition
Substrate trapping was performed as previously described with minor changes.26 Following transfection, cells were lysed using lysis buffer (LB, 500 μl, 50 mM Tris-Cl pH 8.0, 150 mM NaCl, 10% glycerol, 0.5% triton-X-100) containing 1X protease inhibitor (GenDepot, Katy, TX, U.S.A.) for 30 min at 4°C. Then, cell debris were removed by centrifugation at 13.2 × 10³ rpm (19515 rcf/g) for 10 min at 4°C. Anti-FLAG agarose beads (20 μl packed beads, Sigma, A2220) were washed twice with tris buffered saline (TBS, 500 μl; 20 mM Tris-Cl at pH 8.0, 150 mM NaCl) at 4°C prior to immunoprecipitation. Untransfected lysates (1.5 mg total protein) or transfected lysates expressing either wild type or C151A mutant HDAC1 (1.5 mg total protein) were mixed with pre-washed FLAG beads and rocked overnight at 4°C. As a control, transfected lysates expressing C151A mutant HDAC1 (1.5 mg total protein) were also immunuprecipitated in the presence of active site inhibitor SAHA (100 μM). After immunoprecipitation, beads were washed three times with high salt LB (1 ml; 50 mM Tris-Cl pH 8.0, 500 mM NaCl, 10% glycerol, 0.5% triton-X-100) and rocked for 5 min per wash. After each wash, beads were pelleted by spinning at 5000 rcf/g for 1 min at 4°C to assist in subsequent removal of the wash buffer. Following washing, bound proteins were eluted by boiling the beads for 5 min at 95°C in 2X SDS loading dye (30 μl; 50 mM Tris-Cl pH 6.8, 2% SDS, 10% glycerol, 0.004% bromophenol blue). β-mercaptoethanol (10% v/v) was added to the samples, boiled at 95°C for 2 min, separated by 10% SDS-PAGE, and visualized by Sypro Ruby total protein stain (Molecular Probes) according to manufacturer’s instructions. To detect HDAC1 protein levels, proteins after 10% SDS-PAGE separation were transferred to a PVDF membrane (Immobilon P, Millipore) and probed with anti-FLAG antibody (Sigma, F3165). Gel images were obtained using a FluorChem HD2 system (ProteinSimple, San Jose, CA, U.S.A.).
MS and data analysis
Mass spectrometry was performed as previously described.26 Briefly, immunoprecipitated proteins were separated using 10% SDS-PAGE as described above, but proteins were allowed to migrate roughly 1 cm into the gel matrix. Each 1 cm long gel lane was excised and cut into 1 mm small pieces. All the rehydration and dehydration steps were performed as described.26 Reduction, alkylation, trypsin digestion and extraction were performed as described previously.26 Samples were separated by ultra high pressure reverse phase chromatography using an Acclaim PepMap RSLC column and an Easy nLC 1000 UHPLC system (ThermoFisher Scientific, Waltham, MA, U.S.A,). Peptides were analyzed with a Fusion mass spectrometer (Thermo) with a 120,000 resolution orbitrap MS1 scan over 375–1600 m/z, followed by iontrap resolution MS2 scans using a 1.6 m/z window and 30% normalized collision energy for HCD. Peak lists were generated with Proteome Discoverer (ver 1.4; Thermo), and peptides scored using Mascot (ver 2.4; Matrix Science) and Sequest (ver 2.1). The search parameters included parent and fragment ion tolerances of 10 ppm and 0.6 Da, respectively, fixed modification of +57 on C (carbamidomethylation), variable modifications of +16 on M (oxidation), +42 on K and N-termini (acetylation), +1 on NQ (deamidation), and a tryptic digest with up to 2 missed cleavages. MS2 spectra were searched against a consensus human protein database from Uniprot (downloaded on 2016–04-07, 20,145 entries), and simultaneously against a scrambled database to calculate the false discovery rate (FDR). Protein identification was considered to be positive if at least 1 unique peptide was scored as ≤1% FDR, and the protein threshold was ≤1% FDR.
Label free quantification was performed using MaxQuant software.28 To determine if all samples within each trial showed equal HDAC1 levels, the relative intensity ratios of HDAC1 were analyzed. For each of the three cell lines, one of the six independent trials showed >2-fold higher HDAC1 in one of the four samples, indicating that the trial was an outlier and was omitted from further analysis (Tables S1A, S2A, and S3A). Using only the five remaining trials, nonspecifically bound proteins were removed by observing peptides that showed higher intensities in the untransfected negative control sample compared to the wild type sample. Then, an enrichment ratio was calculated by dividing the intensity of a protein in the C151A mutant sample by the intensity of that same protein in the wild type sample. Candidate substrates were selected if a protein showed an enrichment ratio of at least 2-fold in C151A compared to wild type samples and showed lower intensity in the C151A mutant with SAHA competition sample compared to the C151A mutant alone sample observed in at least 2 out of the 5 trials (Tables S1B, S2B, and S3). Proteins localized to the nucleus, which is where HDAC1 is found,24, 29 were identified to create a list of possible substrates (Tables 1, S1C, S2C, and S3C). Data analysis to identify HDAC1 associated protein used an enrichment ratio centered around 1-fold of between 0.56 and 1.8-fold in C151A samples compared to wild type and C151A mutant with SAHA competition samples in at least 2 out of the 5 trials (Tables S1D, S2D, and S3D). From this initial list, proteins localized to the nucleus were identified to create a list of possible associated proteins (Tables 2, S1E, S2E, and S3E).
Table 1.
HDAC1 substrate lista.
| MCF10A |
MDA-MB-468 |
||||
|---|---|---|---|---|---|
| Protein | Gene | Trialsb | Protein | Gene | Trials |
| Q09028 | RBBP4 Sa | 2 | Q8NC51 | SERBP1 | 3 |
| Q14839 | CHD4 K | 2 | Q9BTC8 | MTA1/3 | 2 |
| P05783 | KRT18 | 2 | P09211 | GSTP1 | 2 |
| Q6PJG2 | ELMSAN1 | 2 | |||
|
|
|||||
| Q9UJV9 | DDX41 | 2 | MDA-MB-231 |
||
| P62306 | SNRPF | 2 | Protein |
Gene |
Trials |
| P16989 | YBX3 | 2 | P55081 | MFAP1 | 2 |
| P19338 | NCL | 2 | Q9Y2W1 | THRAP3 | 2 |
| Q9H7L9 | SUDS3 | 2 2 |
O60341 | KDM1A | 2 |
| Q9Y3Z3 | SAMHD1 | 2 | O00299 | CLIC1 | 2 |
| P50402 | EMD | 2 | Q92597 | NDRG1 | 2 |
| P62805 | HIST1H4A | 2 | |||
Nuclear proteins showing at least 2-fold enrichment in C151A mutant compared to wild type immunoprecipitates in at least 2 out of 5 trials
The number of trials where that protein hit was enriched is indicated
If the identified peptide from LC-MS/MS matched more than one isoform of the protein, only the most abundant isoform is shown. See the supplemental tables for the additional possible isoforms.
Table 2.
HDAC1 associating protein list.a
| MDA-MB-468 |
MDA-MB-468 |
||||
|---|---|---|---|---|---|
| Protein ID | Gene name | Trialsb | Protein ID | Gene name | Trialsb |
| O94776 | MTA2 | 5 | Q01804 | OTUD4 | 2 |
| P31943c | HNRNPH1 | 3 | O14744c | PRMT5 | 2 |
| P55795c | HNRNPH2 | 3 | P43686 | PSMC4 | 2 |
| Q70IA6 | MOB2 | 3 | Q9P0K7 | RAI14 | 2 |
| Q16576 | RBBP7 | 3 | Q9H7D7 | WDR26 | 2 |
| Q96ST3 | SIN3A | 3 | P53778 | MAPK12 | 2 |
| Q9Y2W1 | THRAP3 | 3 | P38646 | HSPA9 | 2 |
| Q15208 | STK38 | 3 | |||
|
|
|||||
| Q9Y4E8 | USP15 | 3 | MCF10A |
||
| Q9UM54 | MYO6 | 3 | Protein ID |
Gene name |
Trialsb |
| P23588 | EIF4B | 2 | O94776 | MTA2 | 4 |
| P55199 | ELL | 2 | O14744c | PRMT5 | 4 |
| Q92769 | HDAC2 | 2 | Q9UKL0 | RCOR1 | 4 |
| P62805 | HIST1H4A | 2 | Q8WXI9 | GATAD2B | 3 |
| P52597c | HNRNPF | 2 | Q99878c | HIST1H2AJ | 3 |
| O60341 | KDM1A | 2 | Q15208 | STK38 | 3 |
| Q9UBB5 | MBD2 | 2 | Q92769 | HDAC2 | 2 |
| Q09028 | RBBP4 | 2 | P5259 c | HNRNPF | 2 |
| Q9H7L9 | SUDS3 | 2 | Q9UBB5 | MBD2 | 2 |
| Q96S53 | TESK2 | 2 | Q9BTC8 | MTA3 | 2 |
| O15145 | ARPC3 | 2 | Q9Y2W1 | THRAP3 | 2 |
| P59998 | ARPC4 | 2 | P54105 | CLNS1A | 2 |
| P54105 | CLNS1A | 2 | P62314 | SNRPD1 | 2 |
| Q92841c | DDX17 | 2 | Q9BQA1 | WDR77 | 2 |
| Q13045 | FLII | 2 | P38646 | HSPA9 | 2 |
| O95373 | IPO7 | 2 | |||
|
|
|||||
| Q96P70 | IPO9 | 2 | MDA-MB-231 |
||
| P46940 | IQGAP1 | 2 | Protein ID |
Gene name |
Trials |
| O00629 | KPNA4 | 2 | O60825 | PFKFB2 | 2 |
| Q32MZ4 | LRRFIP1 | 2 | P09211 | GSTP1 | 2 |
Nuclear proteins showing at least fold enrichment between 0.56 and 1.8 in C151A mutant compared to wild type immunoprecipitates in at least 2 out of 5 trials
The number of trials where that protein hit was enriched is indicated
If the identified peptide from LC-MS/MS matched more than one isoform of the protein, only the most abundant isoform is shown. See the supplemental tables for the additional possible isoforms.
Protein interactome analysis was performed using Genemania30 within Cytoscape31 (Version 3.8). The interaction between proteins were limited to physical interaction only. Gene ontology analysis was performed using web-based WebGestalt.32 Method of Interest was set to be Over-Representation Analysis (ORA), Function Database was set to be geneontology, noRedundant mode was selected for both biological pathway (BP) and molecular functions (MF) analysis, and the selected reference set was genome.
KDM1A deacetylation validation
Each cell line was grown for 48 h in growth media, as described above, to 70% confluency and then incubated without (growth media containing <2% DMSO) or with SAHA (10 μM in growth media containing <2% DMSO), SHI-1:2 (10 μM in growth media containing <2% DMSO), or tubastatin A 10 μM in growth media containing <2% DMSO) for 24 hr, harvested, and lysed, as described earlier. Endogenous KDM1A was immunoprecipitated by preincubating the lysates with the KDM1A antibody (Abcam, ab129195) for 5 hours at 4°C with rocking, followed by incubating with pre-washed Protein A/G agarose beads (20 μL bead slurry, SantaCruz, Sc-2003) at 4°C overnight with rocking. After immunoprecipitation, beads were washed three times with lysis buffer (1 mL) and bound proteins were eluted using SDS loading dye (25 μL), separated by 10% SDS-PAGE, transferred to PVDF membrane (Immobilon P), and immunoblotted with acetyllysine (Cell Signalling Technology, 9441S), KDM1A, and HDAC1 (Bethyl, A300–713A-T) antibodies.
Results
HDAC1 overexpression in breast cell lines
Prior to performing a full HDAC1 trapping experiment, gel analysis was used to assure equal levels of immunoprecipitation of wild type and inactive mutant HDAC1 from the three cell lines used in the study: MCF10A, MDA-MB-231, and MDA-MB-468. The three cell lines were transiently transfected with expression plasmids containing Flag-tagged wild type (WT) or inactive C151A mutant HDAC1, grown in culture for 48 hours, and then treated with the HDAC inhibitor SAHA for another 24 hours to induce robust acetylation, as described earlier.26 After cell lysis, Flag-tagged HDAC1 WT and mutant were immunoprecipitated and subjected to high stringency (500 mM NaCl) wash conditions to reduce nonspecific bead binding during enrichment, as previously reported.26 As a critical negative control, the HDAC inhibitor SAHA was included during immunoprecipitation of the C151A mutant sample to disrupt active site binding of substrates. As an indication of nonspecific bead binding during the enrichment step, immunoprecipitation of untransfected cell lysates was also included. Bound proteins were separated by SDS-PAGE followed by visualization of immunoprecipitated Flag-tagged HDAC1 using an anti-Flag antibody. A Flag-tagged protein band of the molecular weight of HDAC1 was present in all transfected samples (Figures 2A–C, lanes 2–4), but not the bead binding control (Figure 2A–C, lane 1). The gel analysis confirmed that HDAC1-Flag was immunoprecipitated equally in all three cell lines.
Fig. 2.
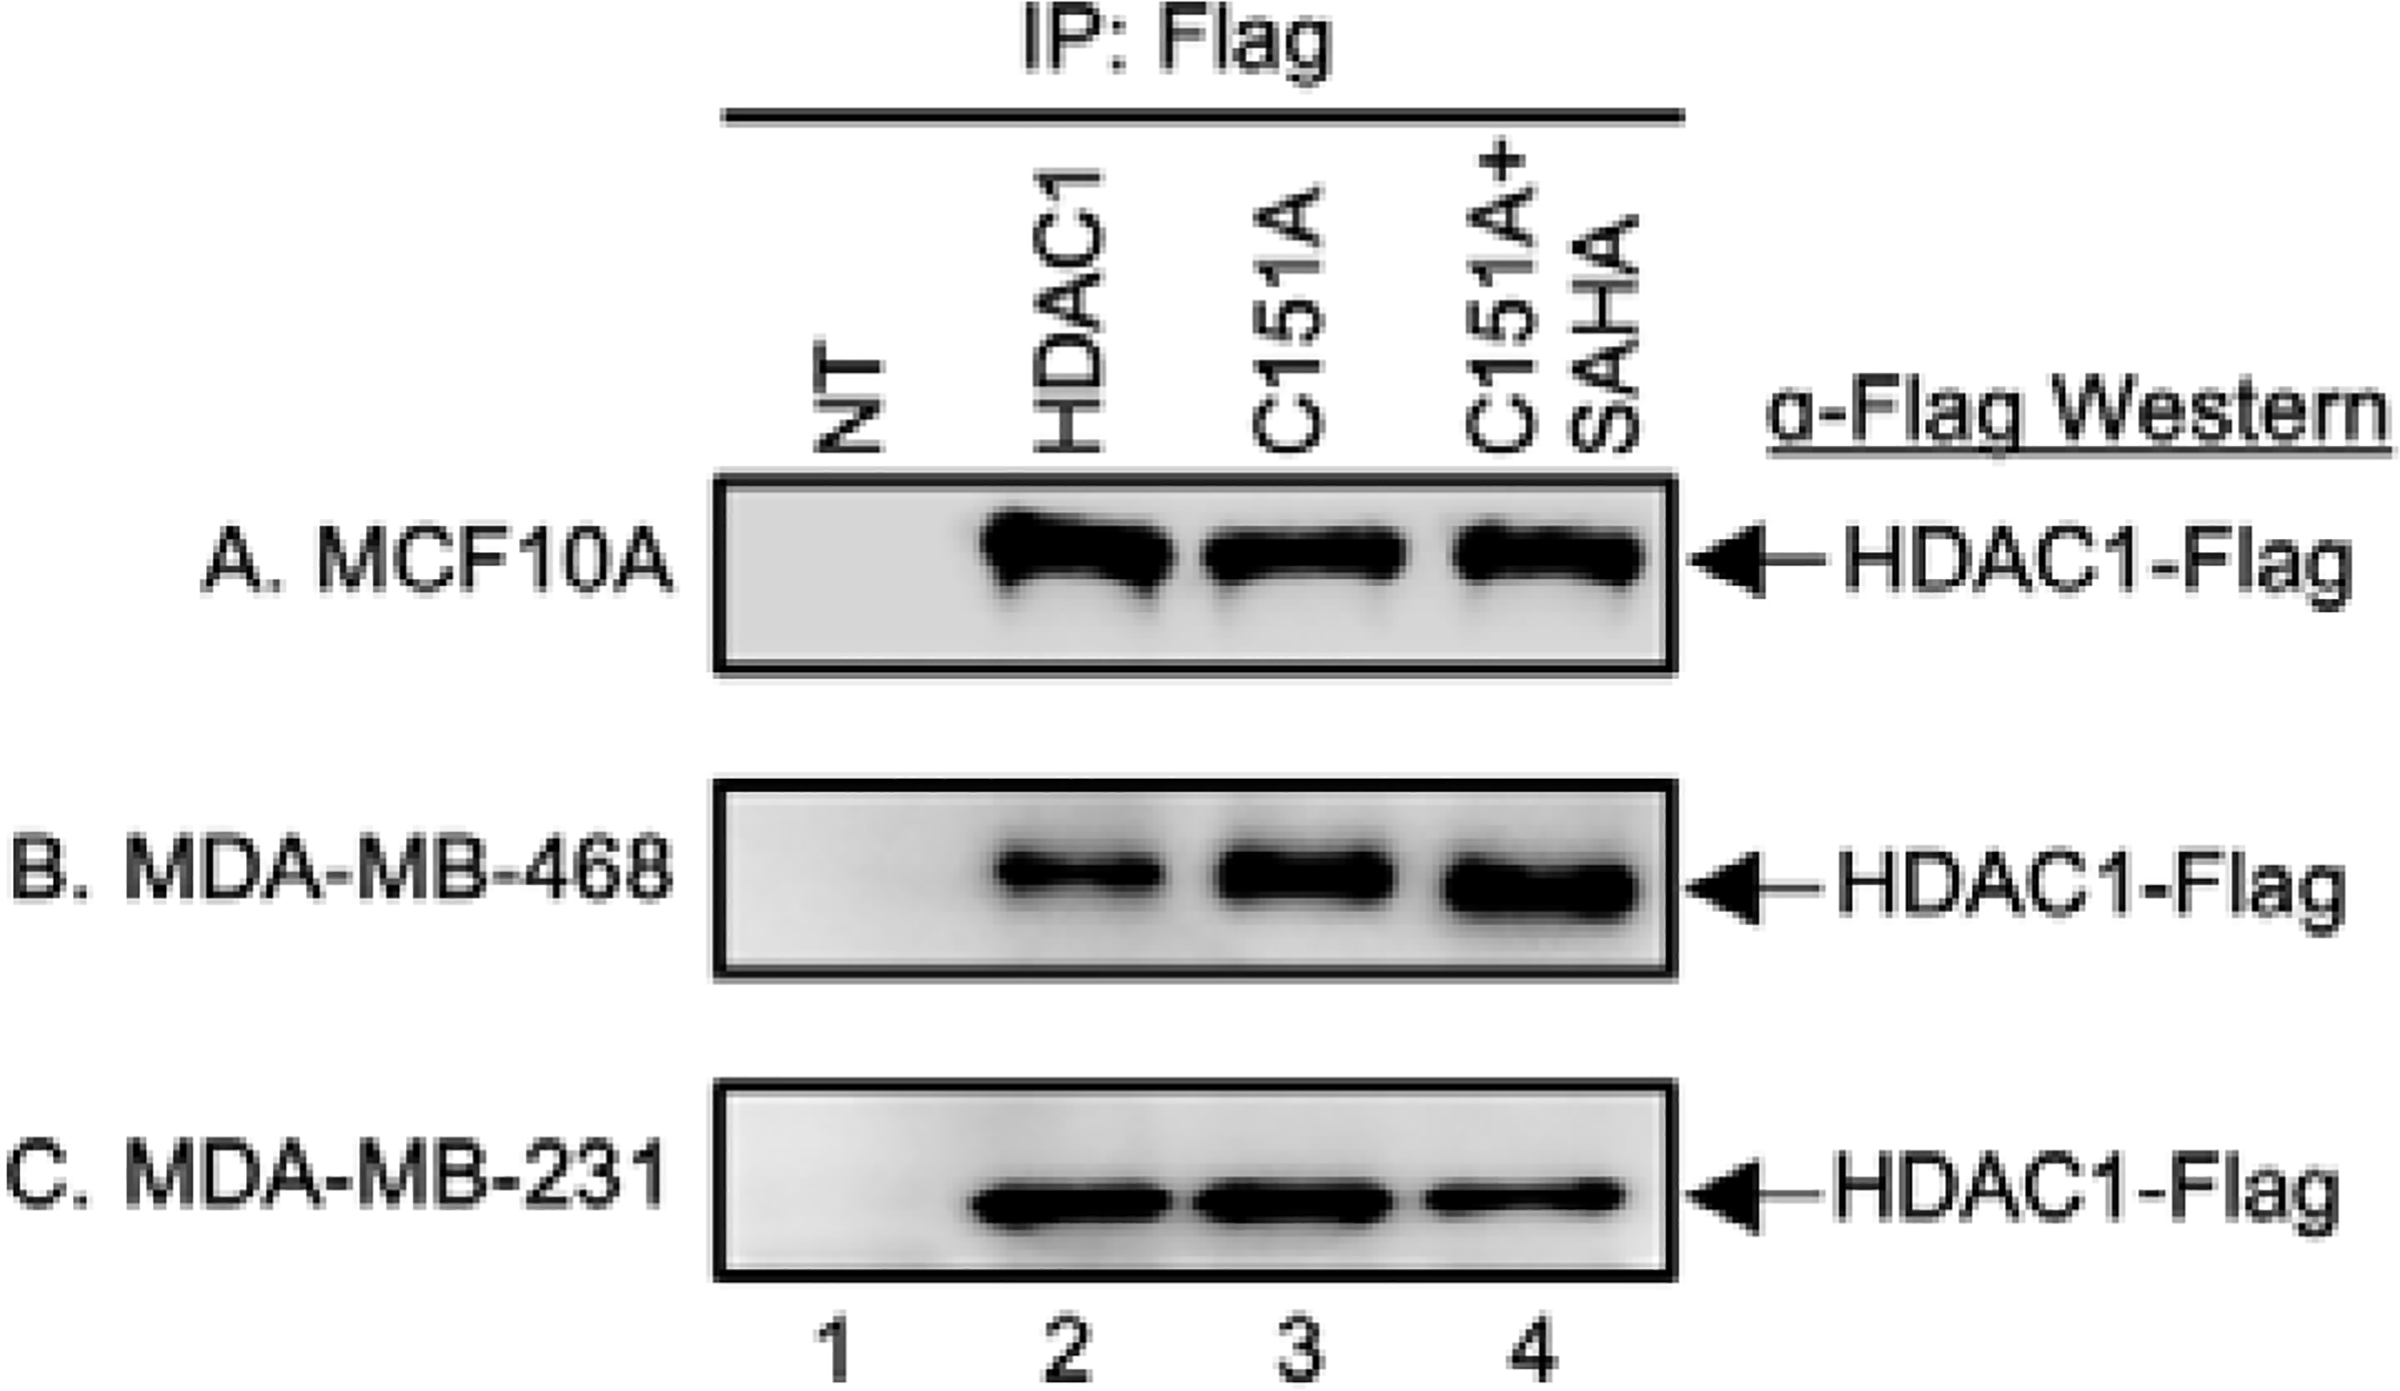
HDAC1 immunoprecipitation levels. Wild type (WT) and C151A mutant HDAC1 were expressed as Flag-tagged proteins in MCF10A (A), MDA-MB-468 (B), or MDA-MB-231 (C) cells. Untransfected cells (NT, lane 1) were used as a negative control. After 48h, cells were treated with SAHA (5 μM) for another 24h to induce robust acetylation. Proteins were immunoprecipitated from each lysate using Flag-bound agarose beads. SAHA was included as a binding competitor in a separate HDAC1 C151A mutant sample (lane 4). Bound proteins were eluted, separated by SDS-APGE, and analyzed by western blot with FLAG antibody (α-Flag). Repetitive trials are shown in Figures S1–3.
As a second means to confirm HDAC1-Flag levels after immunoprecipitation, total proteins were analyzed using Sypro Ruby stain. Gel analysis confirmed the presence of a new protein band at the size of HDAC1-Flag after immunoprecipitation from all transfected samples (Figure S4A and S4B, lanes 2–4), but not untreated samples (Figure S4A and S4B, lane 1). Interestingly, the levels of HDAC1-Flag immunoprecipitated in these breast-derived cell lines were lower than those observed previously in HEK293 using the same high stringency wash conditions (Figure S4A and S4B compared to S4C),24, 25 perhaps due to lower efficiency transfection of MDA-MB-231 and MDA-MB-468 cells.26 However, the presence of HDAC1-Flag, even at lower levels, confirmed the compatibility of trapping studies with breast cancer-derived cell lines.27
HDAC1 substrate trapping in MCF10A cells
To identify HDAC1 substrates, proteins in each trapped sample were analyzed by LC-MS/MS with label-free quantitation using MaxQuant software.26, 28 Six independent trials were analyzed for each cell line to reveal reproducible hits (Figure S1). In the case of the MCF10A non-tumorigenic breast cell line, proteomics analysis identified a total of 335 proteins (Table S1). As a first filter, HDAC1 levels were compared between samples within each independent trial to assure equal levels. Five out of six trials showed comparable levels of HDAC1 and were included in further analysis (Table S1A). Next, proteins bound to the Flag agarose beads in the absence of transfected Flag-tagged HDAC1 were removed to avoid nonspecifically bound proteins. To uncover possible substrates, an enrichment ratio was calculated by dividing the intensity of each protein in the C151A sample by the wild type and C151A with SAHA samples. Proteins enriched by at least 2-fold in the C151A mutant in at least 2 out of 5 trials were identified as possible substrates (Table S1B). A total of 40 possible HDAC1 substrates were identified in MCF10A cells. Given that HDAC1 is predominantly localized in the nucleus,24, 29 protein localization was determined using the Uniprot database,33 and only hits residing in the nucleus were retained. Among the 12 nuclear hits, the known HDAC1 substrate Histone H4 was identified (Table 1 and Table S1C, HIST1H4A).12 We note that the 2-fold enrichment cut-off was selected to capture histone H4 in the hit list. In addition, several proteins associated with epigenetics were also identified, including histone-binding proteins RBBP4 (RBAP48), which is a core component of two HDAC1-containing chromatin remodelling complexes - nucleosome remodelling and deacetylase (NuRD) and SIN3. Sin3 complex component (SDS3 or SUDS3) was also in the hit list, which is found in the HDAC1-containing SIN3 histone deacetylase complex.
HDAC1 substrate trapping in MDA-MB-468 cells
In the case of MDA-MB-468 TNBC cells, trapping and LC-MS/MS proteomics analysis identified a total of 403 proteins (Table S2A). One trial was removed due to abnormal HDAC1 levels, followed by HDAC1 normalization (Table S2A). After removal of nonspecifically bound proteins, a total of 17 possible HDAC1 substrates enriched at least 2-fold in the C151A mutant compared to wild type or SAHA-competed samples in at least 2 out of 5 trials were identified (Table S2B), with 3 nuclear hits (Table 1 and Table S2C). Among the nuclear hits, MTA1 is an epigenetic regulator found in the HDAC1-containing NuRD complex.
HDAC1 substrate trapping in MDA-MB-231 cells
In the case of MDA-MB-231 TNBC cells, trapping followed by LC-MS/MS proteomics analysis identified a total of 383 proteins (Table S3A), similar to the total proteins observed in the MCF10A and MDA-MB-468 trapping studies. Also similar to MCF10A and MDA-MB-468 trapping experiments, one trial was removed due to unequal HDAC1 levels within that trial (Table S3A). After removal of nonspecifically bound proteins, 15 possible HDAC1 substrates were enriched at least 2-fold in the C151A mutant compared to wild type or SAHA-competed samples in at least 2 out of 5 trials (Table S3B), with 5 nuclear hits (Table 1 and Table S3C). Among the nuclear hits, the epigenetic regulator lysine demethylase KDM1A (LSD1) was observed, which is found in the HDAC1-containing CoREST complex. Prior work documented that KDM1A is a substrate of HDAC1.25
Interactome analysis of the HDAC1 substrate profile
Considering the HDAC1 substrate profiles of the three cell lines, the largest number of putative substrates were observed in the non-tumorigenic MCF10A cells. To provide insight into the profile of proteins identified in MCF10A, we performed interactome analysis of identified proteins using GeneMania function from within Cytoscape (Figure 3A).30, 31 KDM1A from MDA-MB-231 and HIST1H4A from MCF10A are HDAC1 substrates that have direct physical interaction with HDAC1. Many of the other directly interacting proteins are in HDAC1-containing epigenetic regulating complexes, including CHD5, RBBP4 and SUDS3. Similar to MCF10A, both TNBC cell lines identified HDAC1-interacting epigenetic regulators as possible substrates. Members of the HDAC1-containing NuRD complex similarly were identified from both MCF10a and MDA-MB-468, whereas a CoREST complex member was identified from MDA-MB-231.
Fig. 3.

Interactome analysis of HDAC1 substrate and associated protein hits. Substrate (A) and associated protein (B) hits (circles) from MCF10A (blue), MDA-MB-468 (red), and MDA-MB-231 (green) were subjected to Cytoscape analysis using the GeneMania function to identify physical interactions, which are indicated as lines connecting two circles. Direct interacting proteins of HDAC1 (black) form the inner circles of hits. Proteins with secondary indirect interactions with HDAC1 are connected by lines to direct interacting proteins. Proteins with no direct or indirect interactions with HDAC1 are shown without interaction lines.
KDM1A substrate validation
Among the identified putative substrates, one protein, KDM1A from the MDA-MB-231 hit list (Table 1), was selected for further validation. KDM1A (also known as LSD1) was previously characterized as an HDAC1 substrate in HEK293 cells.25 The exclusive identification of KDM1A as an HDAC1 substrate in MDA-MB-231 cells suggested that HDAC1 selectively deacetylates KDM1A in MDA-MB-231, but not the other cell lines. To test the ability for HDAC1 to deacetylate KDM1A in each cell line, cells were treated with various HDAC inhibitors with different isoform selectivities, including broad spectrum SAHA, HDAC1/HDAC2 selective SHI-1:2 (BRD6929),34 and HDAC6-selective tubastatin A. After lysis, KDM1A was immunoprecipitated from each lysate and assessed for acetylation levels with an acetyllysine antibody. Consistent with the LC-MS/MS data, the acetylation levels of KDM1A were elevated in MDA-MB-231 cells treated with SAHA and SHI-1:2 (Figure 4C, lanes 2 and 3), but not tubastatin A (Figure 4C, lane 4). HDAC1 was co-immunoprecipitated with KDM1A from MDA-MB-231 cells, consistent with their close proximity for active deacetylation. In contrast, no change in KDM1A acetylation was observed with inhibitor treatment in MCF10A or MDA-MB-468 cells (Figures 4A and 4B). HDAC1 was absent from the co-immunoprecipitated KDM1A-bound complexes in MDA-MB-468 cells, consistent with the lack of HDAC1-dependent acetylation. The fact that HDAC1 was co-immunoprecipitated with KDM1A in MCF10A cells, yet no change in KDM1A acetylation was observed, suggests that proximity is not the only regulatory mechanism dictating HDAC1 substrate specificity.
Fig. 4.

KDM1A deacetylation assays. MCF10A (A), MDA-MB-468 (B), or MDA-MB-231 (C) cells were untreated (DMSO) or treated with HDAC inhibitors SAHA (10 μM), SHI-1:2 (10 μM), or tubastatin A (TubA, 10μM) for 24h to influence acetylation. Endogenous KDM1A was immunoprecipitated from each lysate, and bound proteins were eluted, separated by SDS-PAGE, and analyzed by Western blot with acetyllysine (AcK), KDM1A, and HDAC1 antibodies. Repetitive trials are shown in Figures S5.
Associated protein profiles of HDAC
In addition to substrate discovery, trapping also can be used to identify potential HDAC1 interacting proteins by modifying the filtering criteria. We rationalized that associated protein would bind HDAC1 similarly in all trapping samples due to interactions outside of the catalytic region, which are unaffected by mutation or inhibitor binding in the active site. Therefore, HDAC1 associated proteins were identified by expecting relatively equal presence in immunoprecipitates from wild type, C151A, and C151A with SAHA samples. Using the same enrichment ratios calculated to observe trapped substrates, potential associated proteins were required to have enrichment ratios within a range around 1-fold (0.56 to 1.8-fold) when comparing the intensities of proteins in the wild type to C151A samples. Using this filtration criteria, 28 hits from MCF10A (Table S1D), 89 hits from MDA-MB-468 cell line (Table S2D), and 7 hits from MDA-MB-231 cell line (Table S3D) were identified as possible associated proteins. Considering only nuclear proteins, the final associated protein list (Table 2) consisted of 15 protein hits from MCF10A (Figure S1E), 38 protein hits from MDA-MB-468 (Figure S2E), and 2 protein hits from MDA-MB-231 (Figure S3E), including known associated proteins, such as HDAC2, methyl-CpG binding domain protein 2 (MBD2), metastasis associated 1 family member 2 (MTA2), and protein arginine methyltransferase 5 (PRMT5). We note that the 0.56 and 1.8-fold enrichment range was selected to capture the known HDAC1 associated proteins MBD2 and HDAC2 in the hit list.
Analysis of HDAC1 associated protein profiles
An interactome analysis was performed to assess if the nuclear associated protein hits have known interactions with HDAC1. Using the GeneMania program in Cytoscape,30, 31 more than half of the hit proteins from the MCF10A and MDA-MB-468 cell lines are in the HDAC1 interactome network (Figure 3B). In contrast, the two proteins from MDA-MB-231 showed no known direct or indirect interaction with HDAC1.
The associated protein hits were further analyzed for functional clusters using WebGestalt.32 Most biological pathway categories identified from MCF10A were epigenetics related, such as chromatin remodelling, covalent chromatin modifications, macromolecular deacetylation, and DNA modification (Figure 5A, blue). Similar epigenetic categories were also identified from MDA-MB-486 cells, including chromatin remodelling, covalent chromatin modifications, macromolecular deacetylation (Figure 5A, red). Interestingly, another two overlapping categories between MCF10A and MDA-MB-468 were RNA splicing and mRNA processing, which both are distantly related to epigenetic regulation. Similar to biological pathway analysis, MCF10A and MDA-MB-468 cell lines demonstrated similar functional categories, such as deacetylase activity, C-N bond hydrolase activity, chromatin DNA binding, repressing transcription factor binding and histone deacetylase binding (Figure 5B). Almost all categories identified for both cell lines are related to epigenetic regulation, including Methyl-CpG binding and transcription corepressor activity from MCF10A (Figure 5, blue), as well as enhancer binding and histone binding from the MDA-MB-468 cell line (Figure 4B, red). The overlapping functions of the associated proteins hits from MDA-MB-468 and MCF10A cells suggest similar HDAC1 activities.
Fig. 5.
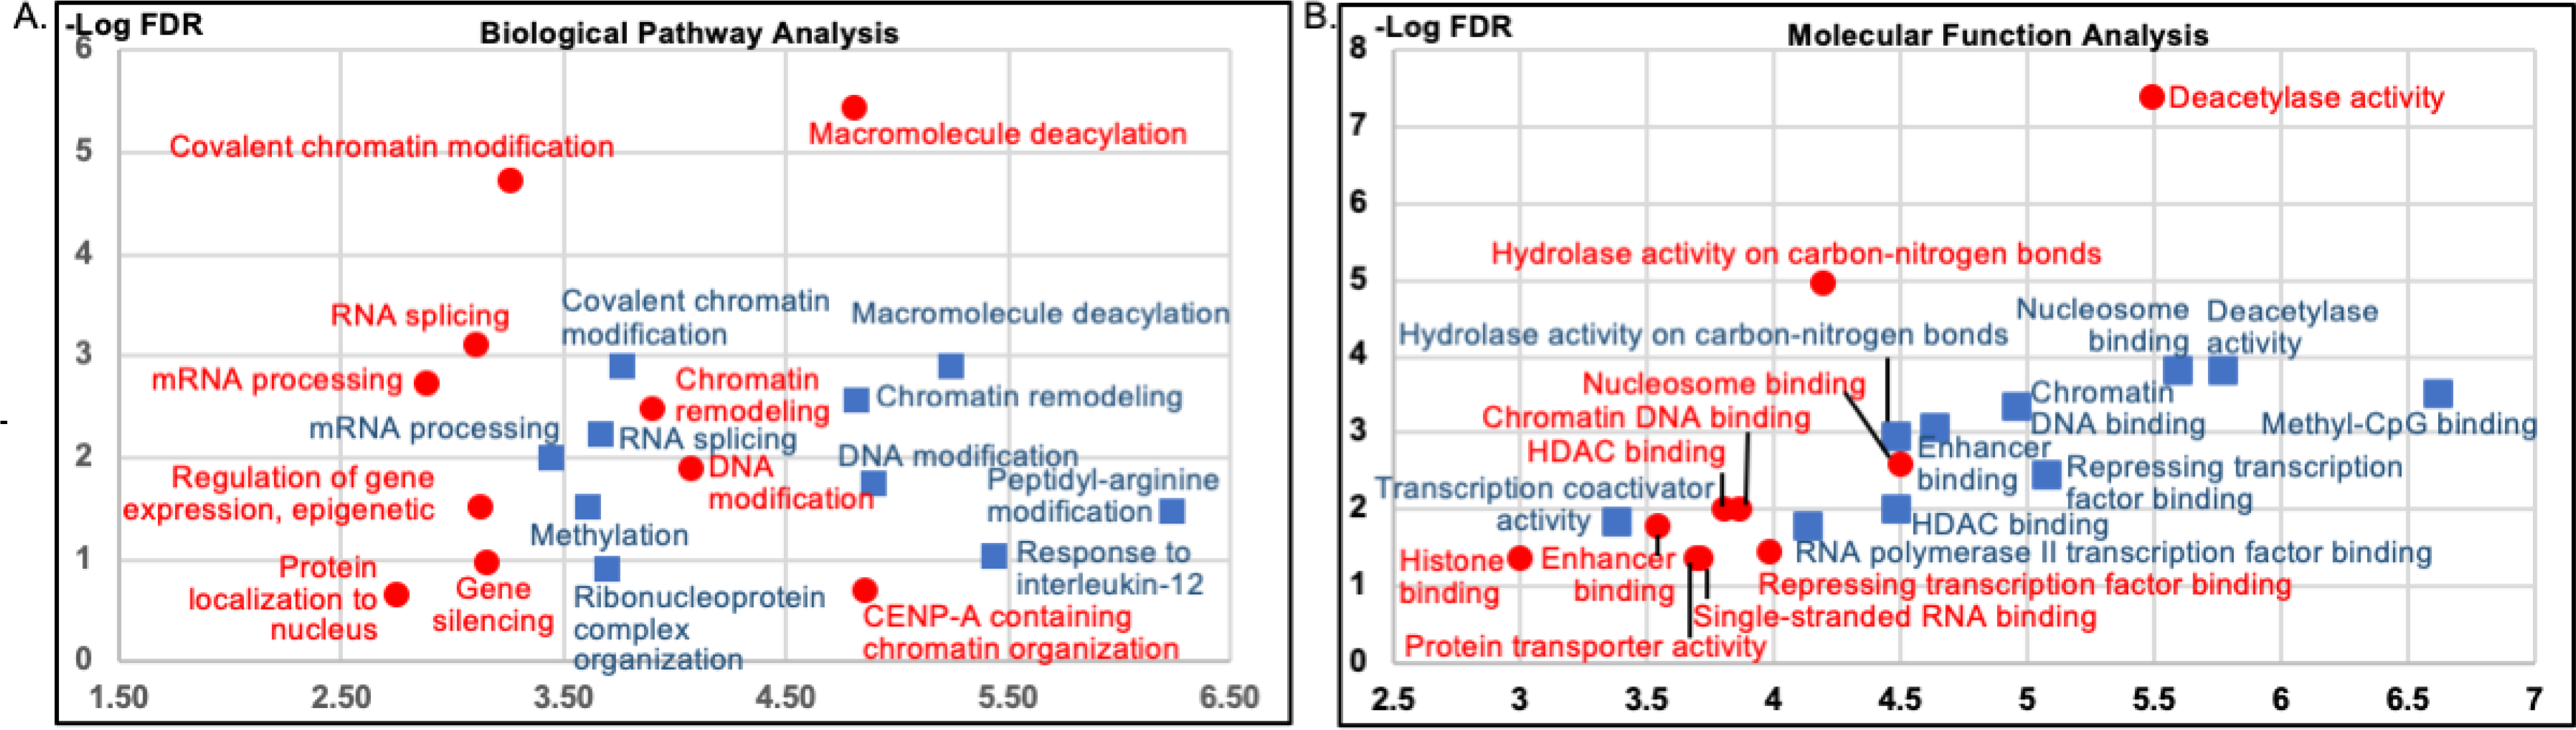
Gene Ontology (GO) analysis of HDAC1 associated proteins. HDAC1 associated protein hits from MCF10A (blue) and MDA-MB-468 (red) cells were subjected to GO analysis for biological pathway (A) and molecular function (B) using WebGestalt. The y axis indicates the fidelity of the enrichment (FDR – false discovery ratio), whereas the x axis indicates the enrichment ratio. For hits where the identified peptide is associated with multiple isoforms of a proteins, only the most abundant isoform was included to avoid over-representation. Only GO categories with FDR of less than 0.05 are shown. No GO categories with an FDR lower than 0.05 were observed from MDA-MB-231 cells due to the small number of hits.
In contrast to the MDA-MB-468 and MCF10A profiles, MDA-MB-231 cells yielded no functional category with meaningful FDR, likely due to the low number of protein hits identified. The absence of epigenetic proteins in the MDA-MB-231 profile suggests that HDAC1 maintains only partial or dysregulated activity and function in MDA-MB-231 cells. In summary, analyses of both biological pathways and molecular function showed similar HDAC1 associating proteins profiles in MCF10A and MDA-MB-468 cells, but not MDA-MB-231 cells.
Discussion
To provide insight into the HDAC1-dependent activities of breast cancer cell subtypes, we took advantage of the mutant trapping strategy to profile HDAC1 substrates and associated proteins. The breast cancer cell lines MDA-MB-231 and MDA-MB-468 were selected here to represent the more aggressive “basal B” and less aggressive “basal A” subtypes, respectively. In addition, MDA-MB-468 cells are less responsive to the pan-HDAC inhibitor panobinostat compared to MDA-MB-231 cells.15, 16, 19, 27 The difference in aggressiveness and HDAC inhibitor sensitivities among various breast cancers suggests that further insights in the HDAC-dependent mechanism would be useful.
Trapping studies using the inactive C151A HDAC1 mutant in MDA-MB-231, MDA-MB-468, and MCF10A cells identified several potential substrates after LC-MS/MS proteomics analysis (Table 1). Known HDAC1 substrates histone H4 and KDM1A (LSD1) were among the potential substrate list, documenting the value of the trapping method. However, relatively few substrate hits were identified compared to previous studies using HEK293 or Jurkat cells.24, 25 We hypothesize that the relatively fewer hits are due to lower expression levels of HDAC1-Flag in the breast cell lines compared to HEK293 cells after transient transfection of expression plasmids (Figure S4). To overcome the low expression levels with breast-derived cells, stable transfection or viral transfection system are currently being tested in our laboratory for elevated HDAC-Flag expression and trapping efficiency.
Despite the relatively low expression levels of HDAC1, many putative substrates were identified. The substrate hit lists contained numerous proteins found in known HDAC1-containing chromatin remodeling complexes, including histone 4 (HIST1H4A), RbAp48 (RBBP4), SUDS3, CDH4, MTA1, KDM1A (LSD1). The presence of these chromatin remodeling proteins suggests that HDAC1 influences epigenetic mechanisms by both deacetylating histones and nearby associated proteins. In fact, prior work documented that HDAC1 regulates the demethylase activity of CoREST complex member KDM1A (LSD1) through deacetylation, which indicates a crosstalk between acetylation and methylation in histone-mediated transcription.25 The data presented here suggest that additional members of HDAC1-containing chromatin remodeling complexes are influenced by HDAC1-mediated deacetylation.
Protein interactome analysis confirmed that many putative substrates maintain physical interaction with HDAC1 (Figure 3A). The proximity of hit proteins to HDAC1 might be consistent with their putative substrate status. On the other hand, hits interacting indirectly with HDAC1 might have been isolated via binding to a substrate, not due to a direct substrate relationship with HDAC1. Therefore, proteins without known interactions with HDAC1 might be the most likely substrates.
To confirm the LC-MS/MS analysis, deacetylase assays were performed with KDM1A, given its known substrate role, yet presence in only the MDA-MB-231 hit list. As expected, acetylation levels of KDM1A were elevated after treatment of HDAC1-targeting SAHA and SHI-1:2 inhibitors, with HDAC1 present in the KDM1A immunoprecipitates (Figure 4C), consistent with a mechanism where KDM1A is in proximity to HDAC1 for active deacetylation. In contrast, HDAC inhibitor treatment of MCF10A and MDA-MB-468 cells failed to influence KDM1A acetylation, which is also consistent with the LC-MS/MS data. Interestingly, while KDM1A and HDAC1 did not co-immunoprecipitate in MDA-MB-468 cells, explaining the lack of HDAC1-dependent deacetylation, HDAC1 co-immunoprecipitated with KDM1A in MCF-10A cells, suggesting that cellular proximity is not the only regulator of HDAC1 substrate specificity.
While the trapping method was designed to identify novel HDAC1 substrate, the method can also be used to identify co-immunoprecipitating HDAC1 associated proteins. We rationalized that associated proteins should be similarly isolated by HDAC1 in all trapping samples. By selecting hits with similar LC-MS/MS intensities in wild type and C151A mutant samples, a list of potential associated proteins was generated (Table 2), with most hits coming from MCF10A and MDA-MB-468 cells. Protein interactome analysis confirmed that more than half of the proteins are direct or indirect interactors of HDAC1 (Figure 3B), consistent with their isolation as associated proteins. Gene ontology (GO) analysis focusing on biological pathway and molecular function identified similar epigenetic functions among the associated proteins (Figure 4, blue vs red). Based on the similar associated protein profiles of MCF10A and MDA-MB-469 cells, we hypothesize that the presence of normal epigenetic function might be one of the reasons MDA-MB-468 is classified as a less aggressive “basal A” TNBC subtype.
Beyond the similarity in GO analysis categories, seven proteins were shared between the associated protein lists from MCF10A and MDA-MB-468 cells, including four from HDAC1-containing deacetylase complexes involved in epigenetic regulation (HDAC2, MTA2, MBD2, and PRMT5). Among the shared associated proteins, MBD2 is a component of the HDAC1-containing NuRD chromatin remodeling complex.35 In breast cancer cells, MBD2 knockdown led to growth suppression and reduced ability of aggressive breast cancer cells to form in vivo xenograft tumors.36 In another study, MBD2 bound hypermethylated CpG regions to reduce expression of the GSTP1 gene, which is absent in many cancer cell lines, including breast.35 The presence of MBD2 as an associated protein in both MCF10A and MDA-MB-468 cells suggests normal epigenetic regulation in the TNBC MDA-MB-468 cells, which is also consistent with the less aggressive “basal A” TNBC subtype classification.
The trapping studies also identified MTA2 in both MCF10A cells and MDA-MB-468 cells and MTA3 in MDA-MB-468 cells only. Although they share similar names, MTA2 and MTA3 play different roles in breast cancer. While MTA2 shows no direct correlation with breast cancer, reduced MTA3 expression is associated with tumor cell invasion.37 Moreover, MTA3 is exclusively expressed in a subset of cells derived from ER-positive premalignant lesions.37 Although MDA-MB-468 is categorized as basal-like breast cancer cell line, a recent study suggested a weakly luminal classification that features expression of ER and PR.4 A previous study also documented that the ER levels in MDA-MB-468 cells were comparable to that of MCF7, a known ER positive breast cancer cell line.38 The presence of MTA3 in the associated protein hit list of MDA-MB-468 is consistent with this prior work showing expression of ER and basal A classification.
While similar epigenetic-related associated proteins were observed in MCF10A and MDA-MB-468 trapping studies, only two associated protein hits were observed from MDA-MB-231 cells and neither are connected with epigenetic regulation or HDAC1. The absence of epigenetic proteins among HDAC1 associated proteins in MDA-MB-231 cells suggests dysfunctional and/or dysregulated epigenetic mechanisms. MDA-MB-231 is categorized as “basal B” and even mesenchymal-like.4 While differentiated cells rely on proper epigenetic regulation for correct gene expression, epigenetic deregulation is linked to many malignancies, including mesenchymal stem cell derived tumors.39, 40 Interestingly, the only epigenetic protein observed by trapping in MDA-MB-231 cells was lysine demethylase 1A (KDM1A), which was validated as an HDAC1 substrate here (Figure 4C). Regarding breast cancer, KDM1A plays a critical role in promoting epithelial-to-mesenchymal transition (EMT).41 The presence of only a single epigenetic enzyme linked to a mesenchymal-like state among the MDA-MB-231 trapping hits suggests that the invasiveness that is typical for MDA-MB-231 cells might come from its stem cell-like state, which is maintained due to limited epigenetic regulation.
Comparing the substrate and associated protein hit lists (Tables 1 and 2), five proteins were found in the substrate hit list of one cell line but the associated protein hit list of another (RBBP4, SUDS3, GSTP1, THRAP3, and KDM1A). Most notably, KDM1A is an exclusive substrate of HDAC1 in MDA-MB-231 cells (Figure 4), but an associated protein hit exclusively from MDA-MB-468 cells. Interestingly, KDM1A from MDA-MB-468 cells did not co-immunoprecipitate HDAC1 (Figure 4B), suggesting that HDAC1 and KDM1A associate at low levels not observable by gel methods. Combined with the fact that KDM1A and HDAC1 associate but do not have a substrate-enzyme relationship in MCF10A cells, the connection between protein association/recruitment and substrate specificity is not fully understood; although associated proteins have the potential to be HDAC1 substrates, proximity is not the sole determinant of HDAC1 substrate preference. Additional cellular studies are needed to confirm and extend the discoveries from these trapping data to identify the mechanisms leading to cell type specific, HDAC1-mediated deacetylation.
Conclusions
Trapping was successfully extended to breast cancer cell lines to explore HDAC1-dependent functions in the different subtypes. Functional analysis of the substrates and associated proteins among the different cell lines showed distinct patterns. The non-tumorigenic MCF10A and MDA-MB-468 breast cancer cell line displayed the largest number of HDAC1 substrates and associated proteins, with activities similarly related to epigenetics and RNA-related functions. However, the MDA-MB-231 cells failed to maintain a normal HDAC1 associated protein profile and lacked hits linked to epigenetic regulation. Taken together, the data suggests that the aggressiveness of breast cancers correlate with maintenance of normal HDAC1 epigenetic functions. As only the first trapping study identifying the HDAC1 substrate and associating protein profile in different cancer cell lines, our results should be compared to future HDAC1 substrate and associating protein profiles in other cancer cells lines to identify common HDAC1-dependent mechanisms. Validation of the distinct mechanisms in each cancer model will reveal molecular details of breast cancer metastasis, which can ultimately lead to individualized medical treatment.
Supplementary Material
Acknowledgements
The Authors thank the National Institutes of Health (GM131821 and GM121061), Karmanos Cancer Institute, and Wayne State University for funding, Arun Rishi (Karmanos Cancer Institute) for the kind gifts of MDA-MB-231 and MDA-MB-468 cell lines, and U. Ariyaratne for comments on the manuscript.
Footnotes
Conflicts of interest
The Authors declare no conflicts of interest regarding this study.
Notes and references
- 1.Siegel RL, Miller KD and Jemal A, CA Cancer J Clin, 2017, 67, 7–30. [DOI] [PubMed] [Google Scholar]
- 2.Conzen SD, Mol Endocrinol, 2008, 22, 2215–2228. [DOI] [PMC free article] [PubMed] [Google Scholar]
- 3.Neve RM, Chin K, Fridlyand J, Yeh J, Baehner FL, Fevr T, Clark L, Bayani N, Coppe JP, Tong F, Speed T, Spellman PT, DeVries S, Lapuk A, Wang NJ, Kuo WL, Stilwell JL, Pinkel D, Albertson DG, Waldman FM, McCormick F, Dickson RB, Johnson MD, Lippman M, Ethier S, Gazdar A and Gray JW, Cancer Cell, 2006, 10, 515–527. [DOI] [PMC free article] [PubMed] [Google Scholar]
- 4.Dai X, Cheng H, Bai Z and Li J, J Cancer, 2017, 8, 3131–3141. [DOI] [PMC free article] [PubMed] [Google Scholar]
- 5.Polyak K, J Clin Invest, 2011, 121, 3786–3788. [DOI] [PMC free article] [PubMed] [Google Scholar]
- 6.Damaskos C, Garmpis N, Valsami S, Kontos M, Spartalis E, Kalampokas T, Kalampokas E, Athanasiou A, Moris D, Daskalopoulou A, Davakis S, Tsourouflis G, Kontzoglou K, Perrea D, Nikiteas N and Dimitroulis D, Anticancer Res, 2017, 37, 35–46. [DOI] [PubMed] [Google Scholar]
- 7.Choudhary C, Weinert BT, Nishida Y, Verdin E and Mann M, Nat Rev Mol Cell Biol, 2014, 15, 536–550. [DOI] [PubMed] [Google Scholar]
- 8.Krämer OH, Göttlicher M and Heinzel T, Trends in Endocrinology & Metabolism, 2001, 12, 294–300. [DOI] [PubMed] [Google Scholar]
- 9.Fraga MF, Ballestar E, Villar-Garea A, Boix-Chornet M, Espada J, Schotta G, Bonaldi T, Haydon C, Ropero S, Petrie K, Iyer NG, Perez-Rosado A, Calvo E, Lopez JA, Cano A, Calasanz MJ, Colomer D, Piris MA, Ahn N, Imhof A, Caldas C, Jenuwein T and Esteller M, Nat Genet, 2005, 37, 391–400. [DOI] [PubMed] [Google Scholar]
- 10.Hesham HM, Lasheen DS and Abouzid KAM, Med Res Rev, 2018, 38, 2058–2109. [DOI] [PubMed] [Google Scholar]
- 11.West AC and Johnstone RW, J Clin Invest, 2014, 124, 30–39. [DOI] [PMC free article] [PubMed] [Google Scholar]
- 12.Seto E and Yoshida M, Cold Spring Harb Perspect Biol, 2014, 6, a018713. [DOI] [PMC free article] [PubMed] [Google Scholar]
- 13.Müller BM, Jana L, Kasajima A, Lehmann A, Prinzler J, Budczies J, Winzer K-J, Dietel M, Weichert W and Denkert C, BMC Cancer, 2013, 13, 215–215. [DOI] [PMC free article] [PubMed] [Google Scholar]
- 14.Kawai H, Li H, Avraham S, Jiang S and Avraham HK, Int J Cancer, 2003, 107, 353–358. [DOI] [PubMed] [Google Scholar]
- 15.Park SY, Jun JA, Jeong KJ, Heo HJ, Sohn JS, Lee HY, Park CG and Kang J, Oncology reports, 2011, 25, 1677–1681. [DOI] [PubMed] [Google Scholar]
- 16.Krusche CA, Wulfing P, Kersting C, Vloet A, Bocker W, Kiesel L, Beier HM and Alfer J, Breast Cancer Res Treat, 2005, 90, 15–23. [DOI] [PubMed] [Google Scholar]
- 17.Ververis K and Karagiannis TC, Am J Transl Res, 2012, 4, 24–43. [PMC free article] [PubMed] [Google Scholar]
- 18.Chatterjee N and Tenniswood M, Breast Cancer Manag, 2015, 4, 85–97. [Google Scholar]
- 19.Tate CR, Rhodes LV, Segar HC, Driver JL, Pounder FN, Burow ME and Collins-Burow BM, Breast Cancer Res, 2012, 14, R79. [DOI] [PMC free article] [PubMed] [Google Scholar]
- 20.Raha P, Thomas S, Thurn KT, Park J and Munster PN, Breast Cancer Res, 2015, 17, 26. [DOI] [PMC free article] [PubMed] [Google Scholar]
- 21.Zhou W, Feng X, Han H, Guo S and Wang G, Sci Rep, 2016, 6, 28004. [DOI] [PMC free article] [PubMed] [Google Scholar]
- 22.Weerasinghe SVW, Estiu G, Wiest O and Pflum MKH, J. Med. Chem, 2008, 51, 5542–5551. [DOI] [PMC free article] [PubMed] [Google Scholar]
- 23.Wambua MK, Nalawansha DA, Negmeldin AT and Pflum MK, Journal of medicinal chemistry, 2014, 57, 642–650. [DOI] [PMC free article] [PubMed] [Google Scholar]
- 24.Nalawansha DA, Gomes ID, Wambua MK and Pflum MKH, Cell Chem Biol, 2017, 24, 481–492 e485. [DOI] [PMC free article] [PubMed] [Google Scholar]
- 25.Nalawansha DA and Pflum MK, ACS chemical biology, 2017, 12, 254–264. [DOI] [PMC free article] [PubMed] [Google Scholar]
- 26.Nalawansha DA, Zhang Y, Herath K and Pflum MKH, ACS Chem Biol, 2018, 13, 3315–3324. [DOI] [PMC free article] [PubMed] [Google Scholar]
- 27.Nikkhah M, Strobl JS, Schmelz EM, Roberts PC, Zhou H and Agah M, Biomaterials, 2011, 32, 7625–7632. [DOI] [PubMed] [Google Scholar]
- 28.Cox J and Mann M, Nat Biotechnol, 2008, 26, 1367–1372. [DOI] [PubMed] [Google Scholar]
- 29.Suzuki T, Kouketsu A, Itoh Y, Hisakawa S, Maeda S, Yoshida M, Nakagawa H and Miyata N, J. Med. Chem, 2006, 49, 4809–4812. [DOI] [PubMed] [Google Scholar]
- 30.Warde-Farley D, Donaldson SL, Comes O, Zuberi K, Badrawi R, Chao P, Franz M, Grouios C, Kazi F, Lopes CT, Maitland A, Mostafavi S, Montojo J, Shao Q, Wright G, Bader GD and Morris Q, Nucleic Acids Res, 2010, 38, W214–220. [DOI] [PMC free article] [PubMed] [Google Scholar]
- 31.Shannon P, Markiel A, Ozier O, Baliga NS, Wang JT, Ramage D, Amin N, Schwikowski B and Ideker T, Genome research, 2003, 13, 2498–2504. [DOI] [PMC free article] [PubMed] [Google Scholar]
- 32.Liao Y, Wang J, Jaehnig EJ, Shi Z and Zhang B, Nucleic Acids Res, 2019, 47, W199–W205. [DOI] [PMC free article] [PubMed] [Google Scholar]
- 33.UniProt C, Nucleic Acids Res, 2019, 47, D506–D515. [DOI] [PMC free article] [PubMed] [Google Scholar]
- 34.Witter DJ, Harrington P, Wilson KJ, Chenard M, Fleming JC, Haines B, Kral AM, Secrist JP and Miller TA, Bioorg Med Chem Lett, 2008, 18, 726–731. [DOI] [PubMed] [Google Scholar]
- 35.Lin X and Nelson WG, Cancer Res, 2003, 63, 498–504. [PubMed] [Google Scholar]
- 36.Mian OY, Wang SZ, Zhu SZ, Gnanapragasam MN, Graham L, Bear HD and Ginder GD, Mol Cancer Res, 2011, 9, 1152–1162. [DOI] [PMC free article] [PubMed] [Google Scholar]
- 37.Zhang H, Stephens LC and Kumar R, Clin Cancer Res, 2006, 12, 1479–1486. [DOI] [PubMed] [Google Scholar]
- 38.Wang WL, Porter W, Burghardt R and Safe SH, Carcinogenesis, 1997, 18, 925–933. [DOI] [PubMed] [Google Scholar]
- 39.Teven CM, Liu X, Hu N, Tang N, Kim SH, Huang E, Yang K, Li M, Gao JL, Liu H, Natale RB, Luther G, Luo Q, Wang L, Rames R, Bi Y, Luo J, Luu HH, Haydon RC, Reid RR and He TC, Stem Cells Int, 2011, 2011, 201371. [DOI] [PMC free article] [PubMed] [Google Scholar]
- 40.Jones PA and Baylin SB, Nat Rev Genet, 2002, 3, 415–428. [DOI] [PubMed] [Google Scholar]
- 41.Boulding T, McCuaig RD, Tan A, Hardy K, Wu F, Dunn J, Kalimutho M, Sutton CR, Forwood JK, Bert AG, Goodall GJ, Malik L, Yip D, Dahlstrom JE, Zafar A, Khanna KK and Rao S, Sci Rep, 2018, 8, 73. [DOI] [PMC free article] [PubMed] [Google Scholar]
Associated Data
This section collects any data citations, data availability statements, or supplementary materials included in this article.