

Abstract
Background/Objectives:
The pathogenesis of hyperglycemia during acute pancreatitis (AP) remains unknown due to inaccessibility of human tissues and lack of animal models. We aimed to develop an animal model to study the mechanisms of hyperglycemia and impaired glucose tolerance in AP.
Methods:
We injected ferrets with intraperitoneal cerulein (50μg/kg, 9 hourly injections) or saline. Blood samples were collected for glucose (0, 4, 8, 12, 24h); TNF-α, IL-6 (6h); amylase, lipase, insulin, glucagon, pancreatic polypeptide (PP), glucagon-like peptide-1 (GLP-1), and gastric inhibitory polypeptide (GIP) (24h). Animals underwent oral glucose tolerance test (OGTT), mixed meal tolerance test (MMTT) at 24h or 3 months, followed by harvesting pancreas for histopathology and immunostaining.
Results:
Cerulein-injected ferrets exhibited mild pancreatic edema, neutrophil infiltration, and elevations in serum amylase, lipase, TNF-α, IL-6, consistent with AP. Plasma glucose was significantly higher in ferrets with AP at all time points. Plasma glucagon, GLP-1 and PP were significantly higher in cerulein-injected animals, while plasma insulin was significantly lower compared to controls. OGTT and MMTT showed abnormal glycemic responses with higher area under the curve. The hypoglycemic response to insulin injection was completely lost, suggestive of insulin resistance. OGTT showed low plasma insulin; MMTT confirmed low insulin and GIP; abnormal OGTT and MMTT responses returned to normal 3 months after cerulein injection.
Conclusions:
Acute cerulein injection causes mild acute pancreatitis in ferrets and hyperglycemia related to transient islet cell dysfunction and insulin resistance. The ferret cerulein model may contribute to the understanding of hyperglycemia in acute pancreatitis.
Keywords: pancreatitis, glucose intolerance, insulin, glucagon, incretins
INTRODUCTION
Acute pancreatitis (AP) is an inflammatory disease of the pancreas associated with local tissue damage, systemic inflammatory response and organ failure1. Acute pancreatitis creates a major burden for children and adults with increased need for emergency room visits, hospitalizations, multiple tests and imaging studies, procedures and surgeries2, 3. Indeed, AP is the leading cause of inpatient admissions among gastrointestinal disorders, causing an estimated $2.6 billion in inpatient costs4.
Acute pancreatitis is considered a disease specific to the exocrine pancreas with little understanding of the endocrine complications. Exocrine pancreatic function may be impacted during AP, sometimes requiring pancreatic enzyme replacement therapy, depending on the severity of pancreatitis, the amount of necrosis, and underlying risk factors5–7. It is expected that the exocrine pancreatic function will completely recover after an AP attack, unless there is significant tissue necrosis, chronic inflammation, fibrosis and profound acinar cell loss.
It has long been recognized that patients with AP may suffer from varying degrees of hyperglycemia during the attack8, 9. Hyperglycemia during AP has been considered as a poor prognostic sign10, 11 and more commonly seen with severe acute pancreatitis or pancreatic necrosis12. The mechanisms of hyperglycemia during AP are unknown, but thought to be secondary to the stress of acute illness13, called “stress hyperglycemia”14.
The reason why acute pancreatitis causes hyperglycemia is poorly understood because most patients are not closely monitored or undergo broad functional metabolic testing during or after the event. In general, it is assumed that a single acute pancreatitis event resolves without long term sequelae, and that blood glucoses return to normal as patients recover from AP. However a recent systematic review reported persistent hyperglycemia in people with acute pancreatitis after discharge from the hospital15 and three recent population-based studies reported prediabetes and/or diabetes risk two-fold or higher after a single attack of acute pancreatitis in humans16–18. These studies suggest that exocrine pancreatic inflammation may have long-lasting effects on the endocrine pancreas for unknown reasons.
The pathogenesis of hyperglycemia induced by AP remains unknown due to the inaccessibility of human tissues and lack of representative animal models. To investigate the mechanisms of glucose homeostasis disturbances during AP, we developed a ferret acute pancreatitis model using cerulein. Ferrets have been broadly used in biochemical studies19 and they display many features that resemble human physiology. In the cystic fibrosis (CF) ferret model, pancreatic involvement mimics exocrine pancreatic damage and CF-related diabetes (CFRD) typically seen in CF patients20–24. Thus, to better understand the impact of acute pancreatitis on glycemic control and insulin secretion, we administered cerulein injections to ferrets. Animals developed hyperglycemia and decreased insulin secretion that dissipated after resolution of pancreatic inflammation. These findings suggest that the AP ferret model is a feasible tool to investigate the pathogenesis of glycemic disturbances associated with acute pancreatitis.
MATERIALS AND METHODS
Animals.
The study was performed on four-week-old ferrets. Animal maintenance conditions and experimental protocols were approved by the University of Iowa Animal Care and Use Committee.
Study Protocol.
Figure S1 summarizes the study protocol. The rationale was to induce acute pancreatitis using cerulein and immediately thereafter conduct studies to measure islet cell dysfunction and insulin resistance. We utilized the cerulein-induced AP protocol described in mice25 with some modifications to accommodate oral glucose tolerance test (OGTT), mixed meal tolerance test (MMTT), and insulin tolerance test (ITT). Briefly, after 3h fasting, animals were given intraperitoneal (IP) injections of cerulein (50 μg/kg body weight, Sigma-Aldrich, St. Louis, MO) or saline every hour (total 9 injections) to induce acute pancreatitis. They had access to water during cerulein injections and were offered food for 12h after completion of injections. Blood was obtained at 6h after the first cerulein injection for interleukin-6 (IL-6) and tumor necrosis factor-alpha (TNF-α) measurements in plasma. Twenty-four hours after the first cerulein injection, blood was obtained for amylase, lipase and hormone measurements in plasma; OGTT, MMTT, ITT were then performed, followed by euthanasia and harvesting of the pancreas.
Histopathology.
At necropsy, pancreas was fixed in 10% neutral buffered formalin, processed and embedded in paraffin, and sectioned at 4 μm. Sections were stained with hematoxylin and eosin (H&E) for light microscopy and scored in a semi-quantitative fashion by a board-certified veterinary pathologist (KNGC) for pancreatic interstitial edema, inflammation and acinar cell necrosis as previously described26, 27: edema 0 = none present; 1 = very mild, rare increases in interstitial clear space (<10% of tissue on slide is affected); 2 = multifocal expansion of the interstitium with clear space (between 10–50% of tissue on the slide is affected); 3 = diffuse, marked expansion of the interstitium with clear space (>50% of tissue on the slide is affected). For inflammation, 0 = none present; 1 = rare, scattered, individualized inflammatory cells are present with the pancreatic parenchyma and/or interstitium; 2 = multifocal to coalescing inflammatory cell infiltrates are present; 3 = diffuse, marked inflammatory cell infiltrates are present. For acinar cell necrosis, 0 = none present; 1 = rare, scattered, individualized acinar cells are necrotic, characterized by hypereosinophilic cytoplasm with pyknotic nuclei and/or nuclear fragmentation; 2 = multifocal, sometimes clustered acinar cell necrosis; 3 = coalescing to large foci of acinar cell necrosis. Sections were also stained for myeloperoxidase (MPO) via immunohistochemistry. Briefly, slides were antigen retrieved with 10 mM Tris/EDTA buffer at a pH of 9.0 in a decloaker at 125°C for 5 minutes, quenched with 3% hydrogen peroxidase for 8 minutes and the MPO antibody (ThermoFisher PA5–16672; Waltham, MA) was applied at a dilution of 1:50 in buffer for 60 minutes at room temperature followed by detection with the DAKO (Santa Clara, CA) Rabbit Envision HRP system reagent for 30 minutes, DAKO DAB plus for 5 minutes and counterstained with hematoxylin. MPO stained slides were evaluated and MPO immunoreactive cells were counted in five separate high-powered fields (40x magnification) per slide and these were averaged for each slide for final quantification.
Blood glucose level measurements.
Blood was obtained from the tail vein of ferrets at 0, 4, 8, 12 and 24 hours after first cerulein or saline injection. Glucose levels were measured using a glucometer.
Oral glucose tolerance test (OGTT).
Oral glucose tolerance test was performed following 3h fasting on animals treated with saline or cerulein injections, as previously described23. An oral glucose solution (TRUTOL 100 Glucose tolerance beverage, Thermo Fisher Scientific, Middletown, VA) of 1g per kg body weight was ingested by ferrets over 2 minutes. Blood samples were collected in chilled heparinized tubes at 0, 30, 60, 120, and 180 min after the ingestion of oral glucose. Blood samples were centrifuged at 4°C applying 3000xg to separate plasma, which was then stored at −80°C for hormone assays. Blood glucose levels were determined using a glucometer.
Mixed meal tolerance test (MMTT).
A mixed meal tolerance test was performed following 3h fasting on animals treated with saline or cerulein injections, as previously described23. Elecare (Abbott, Chicago, IL) was ingested by animals over 5 minutes. Elecare dose was normalized to the body surface area estimate (BSAE in cm2) of each animal, as previously described23. Typically, 6.45 mg carbohydrate per cm2 of BSAE was used. Blood samples were collected in chilled heparinized tubes at 0, 30, 60, 120, and 180 min after Elecare ingestion. Blood glucose levels were determined with a glucometer.
Insulin tolerance test (ITT).
Insulin tolerance test was performed following 3h fasting on animals treated with saline or cerulein injections. Insulin was given as 1U per kg body weight intraperitoneally. Blood samples were collected in chilled heparinized tubes at 0, 30, 60, 120, and 180 min after insulin injection. Blood samples were centrifuged at 4°C applying 3000xg to separate plasma, which was then stored at −80°C for hormone assays. Blood glucose levels were determined using a glucometer.
Plasma insulin, glucagon, pancreatic polypeptide (PP), glucagon-like peptide 1 (GLP-1), and gastric inhibitory polypeptide (GIP) measurements.
Plasma insulin, glucagon, PP, GLP-1, and GIP were measured using a Human Metabolic Hormone Magnetic Bead Panel (Millipore Burlington, MA). The antibody pairs were specific only to the desired analyte and exhibited no or negligible (<2%) cross-reactivity with other analytes in the panel.
Plasma IL-6, TNF-α, growth hormone, and cortisol measurements.
Plasma IL-6 and TNF-α were measured using a Canine Cytokine Magnetic Bead Panel (Millipore Burlington, MA). There was negligible cross-reactivity among different analytes within the panel. Plasma Growth Hormone was measured using a Rat/Mouse Growth Hormone ELISA kit (Millipore, Burlington, MA). Plasma cortisol was measured using a Cortisol Competitive ELISA kit (Invitrogen/Thermo Fisher Scientific, Waltham MA).
Pancreatic lipase and amylase measurements.
Plasma pancreatic lipase was measured using a Human Pancreatic Lipase Assay (Kamiya Biomedical Company, Seattle, WA) following the manufacturer’s protocol. Plasma amylase was measured using an Amylase Assay Kit (Abcam, Cambridge, MA) following the manufacturer’s protocol.
Immunofluorescence.
At necropsy, pancreata were fixed in 10% neutral buffered formalin, embedded in paraffin, and sectioned at 4 μm. Tissue sections were subsequently deparaffinized, rehydrated, boiled 20 min in 0.1 M sodium citrate (pH 6.0) for antigen retrieval, and blocked with 100 −120 μl per slide of PBS with 10% donkey serum + 0.5% Triton-X-100 for 1 hour at room temperature. Sections were incubated overnight at 4°C with the primary antibody, guinea pig anti-insulin at a 1:500 dilution (MP Biomedicals, Santa Ana, CA). The secondary antibody was rhodamine red-conjugated donkey anti-guinea pig at 1:250 dilution (Jackson ImmunoResearch, West Grove, PA). Following staining, samples were rinsed in PBS and placed in Vectashield Mounting Medium (Vector Laboratories, Burlingame, CA) containing DAPI to stain nuclei prior to imaging with Zeiss 700 confocal microscope.
Statistical Analyses.
All data were presented as mean ± SD. Area under the curve (AUC) of OGTT and MMTTs was calculated using the trapezoid rule. Statistical comparisons between two groups were performed by two tail student’s t-test analysis and p < 0.05 was considered to indicate significant differences.
RESULTS
Cerulein induces acute pancreatitis in ferrets.
To test whether cerulein induces acute pancreatitis in ferrets, we measured amylase, lipase, cytokine levels, MPO staining, and performed histological scoring of the H&E-stained pancreas sections. Compared to controls, ferrets treated with cerulein exhibited histopathologic changes observed in secretagogue-induced acute pancreatitis including mild interstitial edema and scattered neutrophil infiltration (Figure 1A–D). Although the histological scoring of H&E slides did not show any significant difference in edema, inflammation or acinar cell necrosis between the groups (Fig 1E–G), there was a mild increase in pancreatic MPO staining within the pancreas of cerulein-treated ferrets, consistent with neutrophilic infiltration (Fig. 2A–D). Plasma amylase and lipase were significantly elevated in cerulein-treated animals compared to controls (1.8 and 2.8-fold higher respectively) (Fig. 3A, B). In addition, plasma IL-6 and TNF-α, both markers of inflammation were significantly upregulated, 23- and 30-fold higher respectively, in cerulein-injected ferrets compared to controls (Fig. 3C, D). Inflammation was confined to pancreas, with no injury to the lungs (data not shown). Taken together, these results indicate that cerulein administration leads to mild pancreatic injury and a profound inflammatory response.
Fig. 1. Cerulein-induces acute pancreatitis in ferrets.

(A-D) Representative photomicrographs of (A, B) control and (C, D) cerulein-treated pancreata stained with hematoxylin-eosin (H&E) at low (left) and high (right) magnification. The pancreatic interstitial space is widened following cerulein treatment (edema; C (arrow), D (star indicates widened lymphatic vessels; note surrounding clear space) and there is an infiltrate of inflammatory cells (primarily neutrophils) (D; inset). Histology scoring for (E) edema; (F) inflammation; (G) acinar cell necrosis. Results show the mean ± SD. P values are shown. Scale bars are: A-D: 200µm, 20µm, 20µm, 20µm respectively (inset 20µm).
Fig. 2. Pancreatic myeloperoxidase in cerulein-treated ferrets.

(A, B) Representative photomicrographs of myeloperoxidase (MPO) immunoreactivity in (A) control and (B) cerulein-treated pancreata at low and high (inset) magnification, identifying neutrophils (stained brown) within the pancreatic interstitial space. Bars = 100µm (inset bar = 20µm). Quantification showing (C) number of MPO positive cells per field (x40); and (D) MPO IHC score. Results show the mean ± SD. P values are shown.
Fig. 3. Cerulein-induced acute pancreatitis in ferrets.

Parameters of pancreatitis in cerulein-treated ferrets. (A) plasma amylase; (B) lipase; (C) IL-6, (D) TNF-α in saline or cerulein-treated ferrets. Results show the mean ± SD. P values are shown.
Ferrets with cerulein-induced acute pancreatitis demonstrate fasting hyperglycemia, hypoinsulinemia, and abnormal pancreatic and incretin hormone secretion.
We next examined whether acute pancreatitis induced by cerulein impacted fasted blood glucose and plasma endocrine and incretin hormone levels. Twenty hours after cerulein injection, fasting glucose remained significantly elevated (Fig. 4A), plasma insulin was significantly lower (Fig. 4B), pancreatic polypeptide (PP) and glucagon like peptide-1 (GLP-1) levels were significantly higher (Fig. 4D,E) in 3 hr fasted ferrets with acute pancreatitis compared to controls. Glucagon and GIP levels were not significantly different between the groups (Fig. 4C,F). Plasma cortisol and growth hormone levels were not different between cerulein and saline-injected ferrets (Supplemental Fig. S2A,B). These results suggest that AP induced by cerulein significantly impacts glycemic regulation at 24h post-injury, possibly by inhibiting insulin secretion.
Fig. 4. Acute pancreatitis induces fasting hyperglycemia and abnormal hormone levels.

Blood was drawn from fasted saline- or cerulein-treated ferrets at 24 hr following cerulein injection. (A) Blood glucose, (B) plasma insulin, (C) glucagon, (D) pancreatic polypeptide (PP), (E) glucagon-like peptide-1 (GLP-1), (F) gastric inhibitory polypeptide (GIP) were obtained. Results show the mean ± SD. P values are shown.
Cerulein-induced acute pancreatitis alters glucose homeostasis in ferrets.
To determine whether hyperglycemia occurs during the early stages of acute pancreatitis, we monitored the plasma glucose levels every 4 to 8 hours for 24 hours after cerulein administration. Compared to controls, cerulein-treated animals exhibited a marked increase in plasma glucose at all time points, with a peak at 12 hours (Fig. 5A). Area under the curve (AUC) measured during the course of AP was significantly higher in ferrets with acute pancreatitis compared to controls (Fig. 5B).
Fig. 5. Abnormal glucose homeostasis in acute pancreatitis.

Animals were assessed following cerulein- or saline-injected ferrets using blood glucose and AUC respectively (A, B) at baseline (0, 4, 8, 12 and 24 hours after first cerulein or saline injection); (C, D) during oral glucose tolerance test (OGTT); (E, F) mixed meal tolerance test (MMTT) and (G, H) insulin tolerance test (ITT). Values are shown as mean ± SD. Two-tailed student’s t-test is performed for AUC and ANOVA test for the progress curves during 0–120 min. The asterisk mark significant differences (*** p<0.001; ** p<0.01; * p<0.05), number of animals are shown.
To better understand how acute pancreatitis influences the glucose metabolism, we performed OGTT, MMTT, and ITT, 24 h after cerulein or saline injection in 3h-fasted animals. Plasma glucoses and AUC measured during OGTT (Fig. 5C,D), MMTT (Fig. 5E,F), and ITT (Fig.5G,H) demonstrated significantly elevated glucoses in animals that have received cerulein compared to controls. Taken together, these results show that ferrets with acute pancreatitis have impaired glucose tolerance (IGT) and insulin resistance compared to controls.
Cerulein-induced acute pancreatitis alters plasma endocrine and incretin hormone levels in ferrets.
We postulated that hyperglycemia in acute pancreatitis could be related to defects in islet and enteric hormone secretion. We proceeded to answer this question by measuring hormone levels during OGTT and MMTT. Following ingestion of oral glucose, plasma insulin levels rose sharply and peaked at 30 min, then fell back to baseline over the next 120 min in both control and cerulein-treated animals. Compared to controls, plasma insulin levels were markedly lower in ferrets treated with cerulein, with significant difference at 30 min and by AUC (Fig 6A,B). Plasma PP levels also rapidly reached the peak at 30 min after glucose ingestion. Compared to controls, PP levels were higher in cerulein-treated ferrets at 30 min, but there was no difference in overall secretion as judged by AUC (Fig. 6C,D). There was no difference in the secretion of glucagon, GLP-1 and GIP secretion between the groups (Fig. 6E–J). These OGTT results suggest that the hyperglycemic response in animals with acute pancreatitis is, at least in part, due to an insulin secretory defect.
Fig. 6. Acute pancreatitis alters plasma hormone levels during oral glucose tolerance test (OGTT).
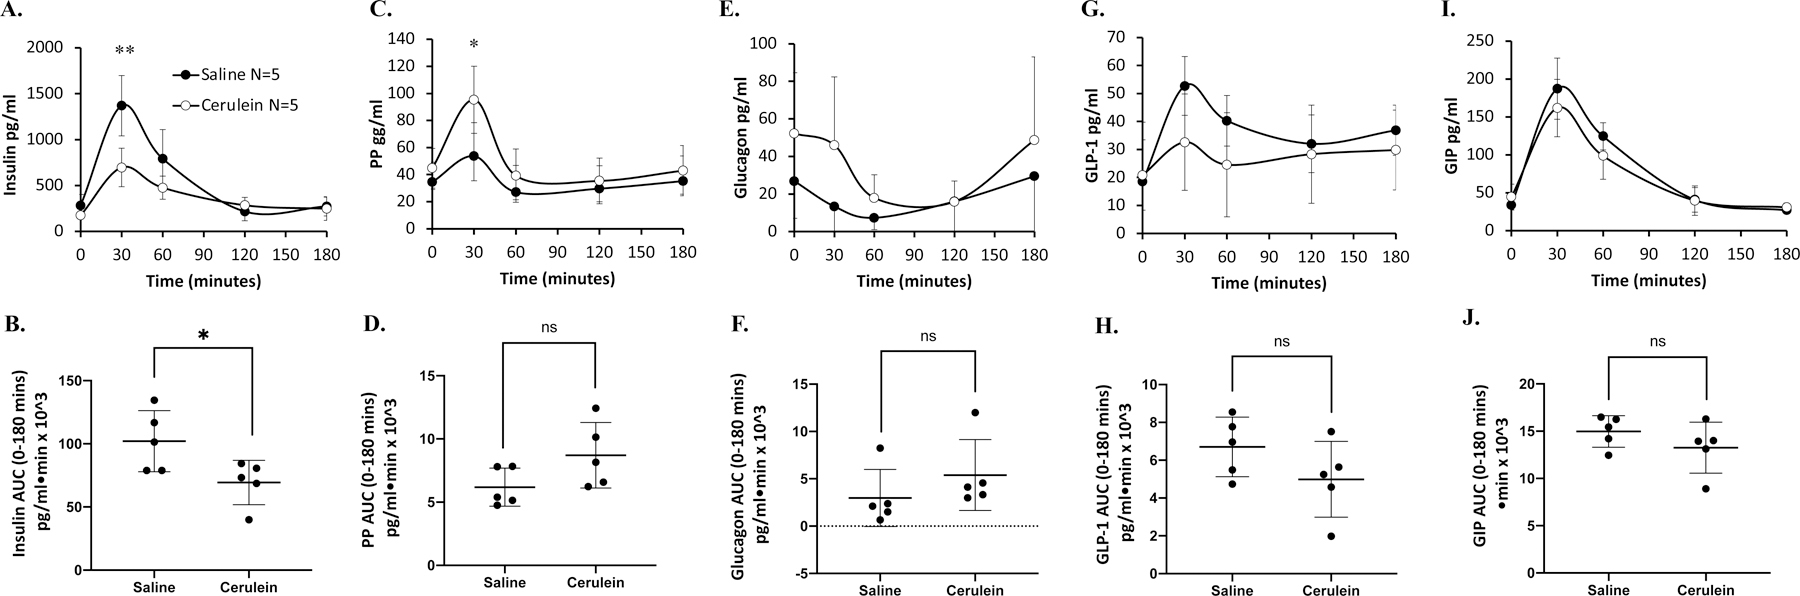
Plasma was assessed following cerulein- or saline-injected ferrets for (A) insulin, (C) pancreatic polypeptide, (E) glucagon, (G) glucagon-like peptide-1 (GLP-1), and (I) gastric inhibitory polypeptide (GIP). The corresponding area under the curve (AUC) 0–120 min are shown (B, D, F, H, and J). Hormone results show the mean ± SD with the significant difference for marked comparison between cerulein and saline. Two-tailed student’s t-test is performed for AUC and ANOVA test for the progress curves during 0–120 min. The asterisk marks significant differences (*** p<0.001; ** p<0.01; * p<0.05), ns: not significant; number of animals are shown.
We next proceeded with MMTT to better determine islet and incretin hormone responses in animals with AP (Fig. 7). Plasma insulin levels peaked at 30 min and they were significantly lower in ferrets treated with cerulein compared to controls at 30 to 120 min (Fig 7A). Likewise, the AUC for insulin was also significantly lower in in ferrets with acute pancreatitis (Fig 7B). There was no difference in PP levels between treatment and control groups (Fig. 7C,D). Glucagon and GLP-1 levels were significantly elevated in AP ferrets with relative higher levels at 60 and 120 min and 60, 120 and 180 min, respectively (Fig 7E–H). In contrast, GIP levels were significantly higher at 30 min in controls ferrets and overall secretion was decreased in ferrets that received cerulein (Fig. 7I, J). MMTT results suggest that animals treated with cerulein demonstrate reduced insulin secretion and increase in secretion of glucagon and incretin hormones.
Fig. 7. Acute pancreatitis alters plasma hormone levels during MMTT.

Plasma was assessed following cerulein- or saline-injected ferrets for (A) insulin, (C) pancreatic polypeptide (PP), (E) glucagon, (G) glucagon-like peptide-1 (GLP-1), and (I) gastric inhibitory polypeptide (GIP). The corresponding area under the curve (AUC) 0–180 mins shown (B, D, F, H, and J). Hormone results show the mean ± SD with the significant difference for marked comparison between cerulein- and saline-injected ferrets. Two-tailed student’s t-test is performed for AUC and ANOVA test for the progress curves during 0–180 min. The asterisk marks significant differences (*** p<0.001; ** p<0.01; * p<0.05), ns: not significant; number of animals are shown.
Cerulein-treated ferrets have intact beta cells.
To evaluate whether changes observed in cerulein-treated ferrets were due to possible structural changes in the endocrine pancreas, we evaluated islet insulin expression by immunofluorescence. As shown in Fig. S3, both AP and control ferrets had intact islets with no discernable differences in insulin expression. Thus, we conclude that defective insulin secretion in AP ferrets was not due to the destruction of islets.
The impact of cerulein on islets is transient.
To examine whether the impact of acute pancreatitis on islet dysfunction was long-lasting, we repeated MMTT and OGTT 3 months after the animals have received cerulein, measuring glucose and hormone levels (Supplemental Figs. S4 and S5). There were no differences between the groups suggesting that the effect of cerulein on the islet dysfunction was transient.
DISCUSSION
In the ferret model, exposure to cerulein induced mild injury to the pancreas but marked increases in proinflammatory cytokines. Animals exhibited profound islet dysfunction characterized by fasting hyperglycemia, impaired insulin secretion and altered pancreatic and incretin hormones. There was no morphological injury to the islets, or insulin-expressing β cells, and the impaired glucose tolerance and hormonal abnormalities were transient.
To our knowledge, this is the first report of cerulein-induced acute pancreatitis in ferrets. Similar to mouse and rat models of cerulein-induced AP28–30, ferrets exhibit an inflammatory reaction to cerulein. The major difference between mouse and rat models of cerulein-induced AP is that mice develop less interstitial edema and intracellular vacuolization, but more acinar cell necrosis compared to rats31. As in rats28, pancreatic injury is mild in ferrets in response to cerulein, characterized by interstitial edema, neutrophil infiltration, elevations in plasma amylase and lipase, and marked elevation in proinflammatory cytokines, IL-6 and TNF-α. In contrast to rats, which demonstrated no abnormalities in serum glucose and insulin levels after cerulein exposure32, ferrets have developed glucose intolerance and significant hormonal dysregulation. The differences in cerulein-response across animal models is unknown but may be due to variations between species. There are differences among nearly all species, including distinct contrasts between rodents and humans. One possibility for variations in hormonal responses across animal models may be due to their islet cryoarchitecture and composition33.
As emphasized in the review of animal models of pancreatitis by Saloman et al.29, various induction protocols exist for acute and chronic pancreatitis, therefore it is important to consider the most appropriate time points to assess the chosen parameters. Since there were no previous published studies of cerulein-induced acute pancreatitis in ferrets, we used published protocols in mice and had to make modifications to accommodate time needed for MMTT, OGTT and ITT. Because cytokines are expected to peak earlier compared to amylase and lipase levels and histopathologic changes34, we determined cytokines at an earlier time point. It is possible that modifying the protocol to accommodate the islet cell dysfunction and insulin resistance studies has impacted our ability to detect the histological grade of pancreatitis at earlier time points.
Hyperglycemia during AP is long believed to occur as a reaction to “stress” triggered by the acute illness13. Stress hyperglycemia is caused by the interplay of counter-regulatory hormones including growth hormone, cortisol and cytokines14. This phenomenon is associated with excessive hepatic glucose production through glucagon secretion and gluconeogenesis, and characterized by insulin resistance35–37. We have indeed observed insulin resistance during ITT, increased glucagon secretion during MMTT, and high levels of proinflammatory cytokines that may all be consistent with stress hyperglycemia during AP. However, the stress hormone cortisol and growth hormone were not elevated in ferrets with AP. One possibility is that cerulein may have direct or indirect effect on the islets. This is unlikely as cerulein has a very short-half life, measured in minutes38.
Our observations in ferrets are consistent with an acute and transient glucose intolerance. This is in contrast to recent observations that reported an increased risk for prediabetes and/or diabetes risk after an attack of acute pancreatitis in humans15–18. The mechanisms of increased long-term risk of diabetes mellitus after a single attack of acute pancreatitis remain unknown. There are no longitudinal and prospective studies that followed patients from the initial acute pancreatitis attack to the development of diabetes mellitus to identify the risk factors. Only few studies have reported functional islet studies such as OGTT39, 40. Some patients had abdominal obesity, pancreatic fat deposition and insulin resistance after AP41, 42, concerning that mechanisms typically seen in type 2 diabetes may be contributing factors.
Although exocrine and endocrine systems have long been viewed as separate systems, there is an increased understanding of their anatomical, morphological and functional connections and their joined influence on pancreatic diseases43. Indeed, early studies in animals have suggested insulin having a role in zymogen release and acinar cell growth, thus the term “insulin-acinar axis” was proposed44. For example, streptozotocin-induced islet destruction not only causes islet cell loss, but also functional reduction in the exocrine pancreas45. Likewise, exocrine pancreatic insufficiency without evidence of chronic pancreatitis is now well-recognized in patients with type 1 or type 2 diabetes mellitus46. Moreover, a new type of diabetes, pancreatogenic diabetes or type 3c diabetes mellitus (T3cDM) has been reported in patients with exocrine pancreatic diseases47. The mechanism by which islet dysfunction occurs in exocrine pancreatic diseases and specifically acute pancreatitis are unknown. It is possible that pancreatic islet microenvironment, their rich vascular and neuronal connections and their cell-to cell contact with acinar cells may be playing a role48.
Although the effects of cerulein-induced acute pancreatitis on the endocrine pancreas was transient in our studies in ferrets, some hormone levels during the acute phase resembled those found in patients with pancreatogenic diabetes or T3cDM including insulin deficiency, reduced glucose-stimulated insulin secretion and hyperglucagonemia49–52. As seen in T3cDM53, 54, we observed insulin resistance, but no PP deficiency in our model. Our findings pertaining to incretins showed a stimulated GLP-1 and low GIP. In humans with T3cDM, incretin responses have been mixed probably due to low sample size55. Overall, there are similarities between the glycemic defects and hormonal changes observed in the ferret AP model and human pancreatogenic diabetes mellitus. These changes may be due to the inhibition of insulin secretion caused by cytokine release during the acute phase56. It is possible that repetitive proinflammatory insults in people with chronic pancreatic diseases would impact the islet microenvironment and lead to persistent changes.
In summary, acute exposure to cerulein causes acute pancreatitis, hyperglycemia, transient islet dysfunction, but no structural injury to the islets in ferrets through a mechanism that involves exocrine pancreatic inflammation. Future studies in the ferret cerulein model may contribute to the understanding of pancreatogenic diabetes.
Supplementary Material
Fig. S1. Study Protocol. Schematic presentation of the research protocol. After a 3h fast, ferrets were injected with saline or cerulein (50 μg/kg) every hour x9. After completion of injections, they were offered food for 12h. Twenty-four hours after the first cerulein injection and following a 3h fast, oral glucose tolerance test (OGTT), mixed meal tolerance test (MMTT), insulin tolerance test (ITT) were performed. Blood was obtained for glucose, amylase, lipase, interleukin-6 (IL-6) and tumor necrosis factor-alpha (TNF-α) at time points indicated. Animals were euthanized and pancreata were harvested upon completion of OGTT, MMTT, ITT.
Fig S2. Plasma growth hormone and cortisol levels are not elevated in ferret AP model. Blood was drawn from fasted saline- or cerulein-injected ferrets at 24 hr following the last cerulein injection. (A) Plasma Growth Hormone, (B) plasma cortisol. Results are shown as mean ± SD. P values are shown.
Fig. S3. Ferrets with acute pancreatitis have intact β-cells. Insulin immunostaining from saline or cerulein-treated ferrets. Insulin (green), DAPI (blue). Image is representative of three independent experiments.
Fig. S4. Islet dysfunction is transient after cerulein-OGTT. Three months after cerulein or saline injections, OGTT was performed. (A) Blood glucose, (B) plasma insulin, (C) glucagon, (D) pancreatic polypeptide (PP), (E) glucagon-like peptide-1 (GLP-1), (F) and gastric inhibitory polypeptide (GIP) were measured. Results are shown as mean ± SD. Two-tailed student’s t-test is performed for AUC and ANOVA test for the progress curves during 0–120 min.
Fig. S5. Islet dysfunction is transient after cerulein-MMTT. Three months after cerulein or saline injections, MMTT was performed. (A) Blood glucose, (B) plasma insulin, (C) glucagon, (D) pancreatic polypeptide (PP), (E) glucagon-like peptide-1 (GLP-1), and (F) gastric inhibitory polypeptide (GIP) were measured. Results are shown as mean ± SD. Two-tailed student’s t-test is performed for AUC and ANOVA test for the progress curves during 0–120 min.
ACKNOWLEDGMENTS
Funding:
Research reported in this publication was supported by the National Institute of Diabetes and Digestive and Kidney Diseases (NIDDK) Award Numbers, R01 DK115791, R01DK118752, and U01 DK108334, RC2 DK124207, P30 DK054759 and Federal Contract #75N2019C00010. The content is solely the responsibility of the authors and does not necessarily represent the official views of the National Institutes of Health.
Footnotes
Publisher's Disclaimer: This is a PDF file of an unedited manuscript that has been accepted for publication. As a service to our customers we are providing this early version of the manuscript. The manuscript will undergo copyediting, typesetting, and review of the resulting proof before it is published in its final form. Please note that during the production process errors may be discovered which could affect the content, and all legal disclaimers that apply to the journal pertain.
Conflict of Interest: Dr. Aliye Uc is an Associate Editor of Pancreatology, Subboard Chair of American Board of Pediatrics and Consultant for Cystic Fibrosis Foundation. All others authors declare no conflict of interests.
REFERENCES
- 1.van Dijk SM, Hallensleben NDL, van Santvoort HC, Fockens P, van Goor H, Bruno MJ et al. : Acute pancreatitis: Recent advances through randomised trials. Gut 2017; 66: 2024–2032. [DOI] [PubMed] [Google Scholar]
- 2.Garg SK, Sarvepalli S, Campbell JP, Obaitan I, Singh D, Bazerbachi F et al. : Incidence, admission rates, and predictors, and economic burden of adult emergency visits for acute pancreatitis: Data from the national emergency department sample, 2006 to 2012. J Clin Gastroenterol 2019; 53: 220–225. [DOI] [PubMed] [Google Scholar]
- 3.Abu-El-Haija M, El-Dika S, Hinton A, Conwell DL: Acute pancreatitis admission trends: A national estimate through the kids’ inpatient database. J Pediatr 2017. [DOI] [PMC free article] [PubMed]
- 4.Peery AF, Dellon ES, Lund J, Crockett SD, McGowan CE, Bulsiewicz WJ et al. : Burden of gastrointestinal disease in the united states: 2012 update. Gastroenterology 2012; 143: 1179–1187e1173. [DOI] [PMC free article] [PubMed] [Google Scholar]
- 5.Boreham B, Ammori BJ: A prospective evaluation of pancreatic exocrine function in patients with acute pancreatitis: Correlation with extent of necrosis and pancreatic endocrine insufficiency. Pancreatology 2003; 3: 303–308. [DOI] [PubMed] [Google Scholar]
- 6.Malecka-Panas E, Juszynski A, Wilamski E: The natural course of acute gallstone pancreatitis. Mater Med Pol 1996; 28: 8–12. [PubMed] [Google Scholar]
- 7.Migliori M, Pezzilli R, Tomassetti P, Gullo L: Exocrine pancreatic function after alcoholic or biliary acute pancreatitis. Pancreas 2004; 28: 359–363. [DOI] [PubMed] [Google Scholar]
- 8.Raman VS, Loar RW, Renukuntla VS, Hassan KV, Fishman DS, Gilger MA et al. : Hyperglycemia and diabetes mellitus in children with pancreatitis. J Pediatr 2011; 158: 612–616e611. [DOI] [PubMed] [Google Scholar]
- 9.Shenoy SD, Cody D, Rickett AB, Swift PG: Acute pancreatitis and its association with diabetes mellitus in children. J PediatrEndocrinolMetab 2004; 17: 1667–1670. [DOI] [PubMed] [Google Scholar]
- 10.Mentula P, Kylanpaa ML, Kemppainen E, Jansson SE, Sarna S, Puolakkainen P et al. : Early prediction of organ failure by combined markers in patients with acute pancreatitis. Br J Surg 2005; 92: 68–75. [DOI] [PubMed] [Google Scholar]
- 11.Dauphine C, Kovar J, Stabile BE, Haukoos JS, de Virgilio C: Identification of admission values predictive of complicated acute alcoholic pancreatitis. Arch Surg 2004; 139: 978–982. [DOI] [PubMed] [Google Scholar]
- 12.Raizner A, Phatak UP, Baker K, Patel MG, Husain SZ, Pashankar DS: Acute necrotizing pancreatitis in children. J Pediatr 2013; 162: 788–792. [DOI] [PMC free article] [PubMed] [Google Scholar]
- 13.Petrov MS, Zagainov VE: Influence of enteral versus parenteral nutrition on blood glucose control in acute pancreatitis: A systematic review. ClinNutr 2007; 26: 514–523. [DOI] [PubMed] [Google Scholar]
- 14.Dungan KM, Braithwaite SS, Preiser JC: Stress hyperglycaemia. Lancet 2009; 373: 1798–1807. [DOI] [PMC free article] [PubMed] [Google Scholar]
- 15.Jivanji CJ, Asrani VM, Windsor JA, Petrov MS: New-onset diabetes after acute and critical illness: A systematic review. Mayo Clin Proc 2017; 92: 762–773. [DOI] [PubMed] [Google Scholar]
- 16.Das SL, Singh PP, Phillips AR, Murphy R, Windsor JA, Petrov MS: Newly diagnosed diabetes mellitus after acute pancreatitis: A systematic review and meta-analysis. Gut 2014; 63: 818–831. [DOI] [PubMed] [Google Scholar]
- 17.Shen HN, Yang CC, Chang YH, Lu CL, Li CY: Risk of diabetes mellitus after first-attack acute pancreatitis: A national population-based study. Am J Gastroenterol 2015; 110: 1698–1706. [DOI] [PubMed] [Google Scholar]
- 18.Bendor CD, Bardugo A, Zucker I, Cukierman-Yaffe T, Lutski M, Derazne E et al. : Childhood pancreatitis and risk for incident diabetes in adulthood. Diabetes Care 2020; 43: 145–151. [DOI] [PMC free article] [PubMed] [Google Scholar]
- 19.Ball RS: Issues to consider for preparing ferrets as research subjects in the laboratory. ILAR J 2006; 47: 348–357. [DOI] [PMC free article] [PubMed] [Google Scholar]
- 20.Olivier AK, Yi Y, Sun X, Sui H, Liang B, Hu S et al. : Abnormal endocrine pancreas function at birth in cystic fibrosis ferrets. J Clin Invest 2012; 122: 3755–3768. [DOI] [PMC free article] [PubMed] [Google Scholar]
- 21.Sun X, Olivier AK, Yi Y, Pope CE, Hayden HS, Liang B et al. : Gastrointestinal pathology in juvenile and adult cftr-knockout ferrets. Am J Pathol 2014; 184: 1309–1322. [DOI] [PMC free article] [PubMed] [Google Scholar]
- 22.Sun X, Sui H, Fisher JT, Yan Z, Liu X, Cho HJ et al. : Disease phenotype of a ferret cftr-knockout model of cystic fibrosis. J Clin Invest 2010; 120: 3149–3160. [DOI] [PMC free article] [PubMed] [Google Scholar]
- 23.Yi Y, Sun X, Gibson-Corley K, Xie W, Liang B, He N et al. : A transient metabolic recovery from early life glucose intolerance in cystic fibrosis ferrets occurs during pancreatic remodeling. Endocrinology 2016; 157: 1852–1865. [DOI] [PMC free article] [PubMed] [Google Scholar]
- 24.Sun X, Yi Y, Xie W, Liang B, Winter MC, He N et al. : Cftr influences beta cell function and insulin secretion through non-cell autonomous exocrine-derived factors. Endocrinology 2017; 158: 3325–3338. [DOI] [PMC free article] [PubMed] [Google Scholar]
- 25.Huang H, Swidnicka-Siergiejko AK, Daniluk J, Gaiser S, Yao Y, Peng L et al. : Transgenic expression of prss1(r122h) sensitizes mice to pancreatitis. Gastroenterology 2020; 158: 1072–1082e1077. [DOI] [PMC free article] [PubMed] [Google Scholar]
- 26.Zhang J, Rouse RL: Histopathology and pathogenesis of caerulein-, duct ligation-, and arginine-induced acute pancreatitis in sprague-dawley rats and c57bl6 mice. Histol Histopathol 2014; 29: 1135–1152. [DOI] [PubMed] [Google Scholar]
- 27.Gibson-Corley KN, Olivier AK, Meyerholz DK: Principles for valid histopathologic scoring in research. Vet Pathol 2013; 50: 1007–1015. [DOI] [PMC free article] [PubMed] [Google Scholar]
- 28.Lampel M, Kern HF: Acute interstitial pancreatitis in the rat induced by excessive doses of a pancreatic secretagogue. Virchows Arch A Pathol Anat Histol 1977; 373: 97–117. [DOI] [PubMed] [Google Scholar]
- 29.Saloman JL, Albers KM, Cruz-Monserrate Z, Davis BM, Edderkaoui M, Eibl G et al. : Animal models: Challenges and opportunities to determine optimal experimental models of pancreatitis and pancreatic cancer. Pancreas 2019; 48: 759–779. [DOI] [PMC free article] [PubMed] [Google Scholar]
- 30.Kaiser AM, Saluja AK, Sengupta A, Saluja M, Steer ML: Relationship between severity, necrosis, and apoptosis in five models of experimental acute pancreatitis. Am J Physiol 1995; 269: C1295–1304. [DOI] [PubMed] [Google Scholar]
- 31.Lerch MM, Gorelick FS: Models of acute and chronic pancreatitis. Gastroenterology 2013; 144: 1180–1193. [DOI] [PubMed] [Google Scholar]
- 32.Warzecha Z, Ceranowicz P, Dembinski A, Cieszkowski J, Kusnierz-Cabala B, Tomaszewska R et al. : Therapeutic effect of ghrelin in the course of cerulein-induced acute pancreatitis in rats. J Physiol Pharmacol 2010; 61: 419–427. [PubMed] [Google Scholar]
- 33.Steiner DJ, Kim A, Miller K, Hara M: Pancreatic islet plasticity: Interspecies comparison of islet architecture and composition. Islets 2010; 2: 135–145. [DOI] [PMC free article] [PubMed] [Google Scholar]
- 34.Zhang H, Neuhofer P, Song L, Rabe B, Lesina M, Kurkowski MU et al. : Il-6 trans-signaling promotes pancreatitis-associated lung injury and lethality. J Clin Invest 2013; 123: 1019–1031. [DOI] [PMC free article] [PubMed] [Google Scholar]
- 35.McGuinness OP, Fugiwara T, Murrell S, Bracy D, Neal D, O’Connor D et al. : Impact of chronic stress hormone infusion on hepatic carbohydrate metabolism in the conscious dog. Am J Physiol 1993; 265: E314–322. [DOI] [PubMed] [Google Scholar]
- 36.Lang CH, Bagby GJ, Blakesley HL, Spitzer JJ: Importance of hyperglucagonemia in eliciting the sepsis-induced increase in glucose production. Circ Shock 1989; 29: 181–191. [PubMed] [Google Scholar]
- 37.Zauner A, Nimmerrichter P, Anderwald C, Bischof M, Schiefermeier M, Ratheiser K et al. : Severity of insulin resistance in critically ill medical patients. Metabolism 2007; 56: 1–5. [DOI] [PubMed] [Google Scholar]
- 38.Vincent ME, Wetzner SM, Robbins AH: Pharmacology, clinical uses, and adverse effects of ceruletide, a cholecystokinetic agent. Pharmacotherapy 1982; 2: 223–234. [DOI] [PubMed] [Google Scholar]
- 39.Tu J, Yang Y, Zhang J, Yang Q, Lu G, Li B et al. : Effect of the disease severity on the risk of developing new-onset diabetes after acute pancreatitis. Medicine (Baltimore) 2018; 97: e10713. [DOI] [PMC free article] [PubMed] [Google Scholar]
- 40.Tu J, Zhang J, Ke L, Yang Y, Yang Q, Lu G et al. : Endocrine and exocrine pancreatic insufficiency after acute pancreatitis: Long-term follow-up study. BMC Gastroenterol 2017; 17: 114. [DOI] [PMC free article] [PubMed] [Google Scholar]
- 41.Singh RG, Pendharkar SA, Cervantes A, Cho J, Miranda-Soberanis V, Petrov MS: Abdominal obesity and insulin resistance after an episode of acute pancreatitis. Dig Liver Dis 2018; 50: 1081–1087. [DOI] [PubMed] [Google Scholar]
- 42.Singh RG, Nguyen NN, DeSouza SV, Pendharkar SA, Petrov MS: Comprehensive analysis of body composition and insulin traits associated with intra-pancreatic fat deposition in healthy individuals and people with new-onset prediabetes/diabetes after acute pancreatitis. Diabetes Obes Metab 2019; 21: 417–423. [DOI] [PubMed] [Google Scholar]
- 43.Rickels MR, Norris AW, Hull RL: A tale of two pancreases: Exocrine pathology and endocrine dysfunction. Diabetologia 2020; 63: 2030–2039. [DOI] [PMC free article] [PubMed] [Google Scholar]
- 44.Williams JA, Goldfine ID: The insulin-pancreatic acinar axis. Diabetes 1985; 34: 980–986. [DOI] [PubMed] [Google Scholar]
- 45.Patel R, Yago MD, Manas M, Victoria EM, Shervington A, Singh J: Mechanism of exocrine pancreatic insufficiency in streptozotocin-induced diabetes mellitus in rat: Effect of cholecystokinin-octapeptide. Mol Cell Biochem 2004; 261: 83–89. [DOI] [PubMed] [Google Scholar]
- 46.Mohapatra S, Majumder S, Smyrk TC, Zhang L, Matveyenko A, Kudva YC et al. : Diabetes mellitus is associated with an exocrine pancreatopathy: Conclusions from a review of literature. Pancreas 2016; 45: 1104–1110. [DOI] [PMC free article] [PubMed] [Google Scholar]
- 47.Hart PA, Bellin MD, Andersen DK, Bradley D, Cruz-Monserrate Z, Forsmark CE et al. : Type 3c (pancreatogenic) diabetes mellitus secondary to chronic pancreatitis and pancreatic cancer. The lancet Gastroenterology & hepatology 2016; 1: 226–237. [DOI] [PMC free article] [PubMed] [Google Scholar]
- 48.Barreto SG, Carati CJ, Toouli J, Saccone GT: The islet-acinar axis of the pancreas: More than just insulin. Am J Physiol Gastrointest Liver Physiol 2010; 299: G10–22. [DOI] [PubMed] [Google Scholar]
- 49.Nyboe Andersen B, Krarup T, Thorsgaard Pedersen NT, Faber OK, Hagen C, Worning H: B cell function in patients with chronic pancreatitis and its relation to exocrine pancreatic function. Diabetologia 1982; 23: 86–89. [DOI] [PubMed] [Google Scholar]
- 50.Domschke S, Stock KP, Pichl J, Schneider MU, Domschke W: Beta-cell reserve capacity in chronic pancreatitis. Hepatogastroenterology 1985; 32: 27–30. [PubMed] [Google Scholar]
- 51.Schrader H, Menge BA, Zeidler C, Ritter PR, Tannapfel A, Uhl W et al. : Determinants of glucose control in patients with chronic pancreatitis. Diabetologia 2010; 53: 1062–1069. [DOI] [PubMed] [Google Scholar]
- 52.Lundberg R, Beilman GJ, Dunn TB, Pruett TL, Freeman ML, Ptacek PE et al. : Early alterations in glycemic control and pancreatic endocrine function in nondiabetic patients with chronic pancreatitis. Pancreas 2016; 45: 565–571. [DOI] [PMC free article] [PubMed] [Google Scholar]
- 53.Yki-Jarvinen H, Kiviluoto T, Taskinen MR: Insulin resistance is a prominent feature of patients with pancreatogenic diabetes. Metabolism 1986; 35: 718–727. [DOI] [PubMed] [Google Scholar]
- 54.Brunicardi FC, Chaiken RL, Ryan AS, Seymour NE, Hoffmann JA, Lebovitz HE et al. : Pancreatic polypeptide administration improves abnormal glucose metabolism in patients with chronic pancreatitis. J Clin Endocrinol Metab 1996; 81: 3566–3572. [DOI] [PubMed] [Google Scholar]
- 55.Hart PA, Bellin MD, Andersen DK, Bradley D, Cruz-Monserrate Z, Forsmark CE et al. : Type 3c (pancreatogenic) diabetes mellitus secondary to chronic pancreatitis and pancreatic cancer. The lancet Gastroenterology & hepatology 2016; 1: 226–237. [DOI] [PMC free article] [PubMed] [Google Scholar]
- 56.Pavan Kumar P, Radhika G, Rao GV, Pradeep R, Subramanyam C, Talukdar R et al. : Interferon gamma and glycemic status in diabetes associated with chronic pancreatitis. Pancreatology 2012; 12: 65–70. [DOI] [PubMed] [Google Scholar]
Associated Data
This section collects any data citations, data availability statements, or supplementary materials included in this article.
Supplementary Materials
Fig. S1. Study Protocol. Schematic presentation of the research protocol. After a 3h fast, ferrets were injected with saline or cerulein (50 μg/kg) every hour x9. After completion of injections, they were offered food for 12h. Twenty-four hours after the first cerulein injection and following a 3h fast, oral glucose tolerance test (OGTT), mixed meal tolerance test (MMTT), insulin tolerance test (ITT) were performed. Blood was obtained for glucose, amylase, lipase, interleukin-6 (IL-6) and tumor necrosis factor-alpha (TNF-α) at time points indicated. Animals were euthanized and pancreata were harvested upon completion of OGTT, MMTT, ITT.
Fig S2. Plasma growth hormone and cortisol levels are not elevated in ferret AP model. Blood was drawn from fasted saline- or cerulein-injected ferrets at 24 hr following the last cerulein injection. (A) Plasma Growth Hormone, (B) plasma cortisol. Results are shown as mean ± SD. P values are shown.
Fig. S3. Ferrets with acute pancreatitis have intact β-cells. Insulin immunostaining from saline or cerulein-treated ferrets. Insulin (green), DAPI (blue). Image is representative of three independent experiments.
Fig. S4. Islet dysfunction is transient after cerulein-OGTT. Three months after cerulein or saline injections, OGTT was performed. (A) Blood glucose, (B) plasma insulin, (C) glucagon, (D) pancreatic polypeptide (PP), (E) glucagon-like peptide-1 (GLP-1), (F) and gastric inhibitory polypeptide (GIP) were measured. Results are shown as mean ± SD. Two-tailed student’s t-test is performed for AUC and ANOVA test for the progress curves during 0–120 min.
Fig. S5. Islet dysfunction is transient after cerulein-MMTT. Three months after cerulein or saline injections, MMTT was performed. (A) Blood glucose, (B) plasma insulin, (C) glucagon, (D) pancreatic polypeptide (PP), (E) glucagon-like peptide-1 (GLP-1), and (F) gastric inhibitory polypeptide (GIP) were measured. Results are shown as mean ± SD. Two-tailed student’s t-test is performed for AUC and ANOVA test for the progress curves during 0–120 min.