Abstract
Dynamin plays an important role in clathrin-mediated endocytosis (CME) by cutting the neck of nascent vesicles from the cell membrane. Here through using gold nanorods as cargos to image dynamin action during live CME, we show that near the peak of dynamin accumulation, the cargo-containing vesicles always exhibit abrupt, right-handed rotations that finish in a short time (~0.28 s). The large and quick twist, herein named the super twist, is the result of the coordinated dynamin helix action upon GTP hydrolysis. After the super twist, the rotational freedom of the vesicle drastically increases, accompanied with simultaneous or delayed translational movement, indicating that it detaches from the cell membrane. These observations suggest that dynamin-mediated scission involves a large torque generated by coordinated actions of multiple dynamins in the helix, which is the main driving force for vesicle scission.
Introduction
Dynamin is a GTP-binding protein that participates in various membrane fission and fusion processes1–6, including clathrin-mediated endocytosis (CME). At the final stage of CME, dynamin assembles and acts as a mechanochemical scaffold that constricts and deforms the membrane at the neck of invaginated clathrin coated pits (CCPs) and cuts the nascent vesicles from the cell membrane7–9. There is a growing consensus as to the roles that dynamin plays during the fission process10: (i) dynamin self-assembles into helices around a lipid membrane tube; (ii) GTP-bound dynamin favors more constricted states of the helix; (iii) vesicle fission is induced by the dynamin helix in a GTP hydrolysis-dependent manner. However, how dynamin breaks the neck of the CCPs is still under debate.
Currently, two prevailing models have been proposed. (1) The Two-Stage Model11–16. It suggests that in the first stage, dynamin in a nucleotide-bound conformation assembles to a helical structure, leading to a constricted membrane tube inside. At the second stage, coordinated GTP hydrolysis by multiple dynamin molecules facilitates the formation of a hemi-fission intermediate of the membrane tube and destabilizes the dynamin assembly, followed by the rupture of the membrane tube. Structural studies had shown that during GTP hydrolysis, the relative orientation between the GTPase and bundle signaling element (BSE) portions in dynamin changes by ~70°17,18. This conformational change may be transmitted through the stalk, leading to a tilted Pleckstrin homology domain (PHD) and the wedging of the lipid membrane underneath15,19. With this strong interaction, the energy barrier for hemi-fission to occur diminishes or even disappears12,20.
(2) The Ratchet/Constriction Model9,21,22. In this model, dynamin can act as a molecular motor similar to myosin. The model suggests that when assembled, adjacent rungs slide on each other progressively upon cycles of stochastic GTP hydrolysis, leading to the twisting and constriction of the helix until the membrane tube reaches a state that the hemi-fission intermediate can form spontaneously or through thermal fluctuation. Finally, disassembly of the dynamin helix is proposed to be caused either by conformational stress as the transition state conformation cannot be docked in any of the dynamin helical structures17, or by loss of the underlying membrane tube template due to fission. This model is consistent with in vitro observation that dynamin helix generates twisting motion upon GTP hydrolysis9. The observed 70° rotation between the GTPase and the BSE portions is also consistent with this model, as it may cause a power-stroke that slides dynamin by one unit along the helix17,19.
Both models include a crucial conformation change by assembled dynamins upon GTP hydrolysis but the mechanochemical step serves different purposes in scission. Recent theoretical studies suggest that the two models may be reconciled: an effective rotation of the dynamin helix around its longitudinal axis may happen simultaneously with the tilting of dynamin PH domains, which better facilitates severing of the membrane energetically23.
To resolve these issues and define the mechanism of dynamin-catalyzed fission, it is important to directly observe dynamin action during the live endocytic process. Live-cell observation is especially crucial because dynamin may behave differently depending on its environment. For example, in the absence of the GTP, dynamin assembles into “non-constricted”, long helical coils around membrane tubes in vitro7,24–26. The addition of GTP generates torsion and constriction but may not necessarily cut the tube. In contrast, in the constant presence of GTP, which is more relevant to in vivo environment, dynamin will generate highly constricted but short helices that lead to scission13. In addition, the “non-constricted” helix of dynamin with no nucleotide has a one-start helical structure, while helices of dynamin assembled with nucleotides or analogs can have a one-start (i.e., the “constricted”)27, or a two-start (i.e., the “super-constricted”) helical structures19,28. The one-start and two-start helical structures cannot convert to each other through sliding or simple reorganization19,28, which brings into question which of these intermediate structures are relevant to dynamin action in vivo. All these indicate that in vitro models may not apply to in vivo conditions, and hence live-cell observation is crucial in decoding how dynamin works.
Herein, we used gold nanorods (AuNRs)29 as cargos and in vivo probes to directly report dynamin actions, especially the twisting behavior, if there is any, during the complete endocytic process. AuNRs strongly scatter light at their localized surface plasmon resonance (LSPR) wavelengths, which is polarized along their axes, allowing them to be detected in the crowded cellular environment. The challenge for observing the rotational movement of these probes is that they are too small to resolve their orientation using conventional optical microscopy due to the optical diffraction limit. With our developed three-dimensional single particle orientation and rotational tracking (3D-SPORT) system, it becomes possible to not only track AuNR’s translational movement in 3D space (Focused channel, Fig. 1A) but also resolve its orientation changes (Defocused channel, Fig. 1A).
Fig 1. Scheme of 3D SPORT.
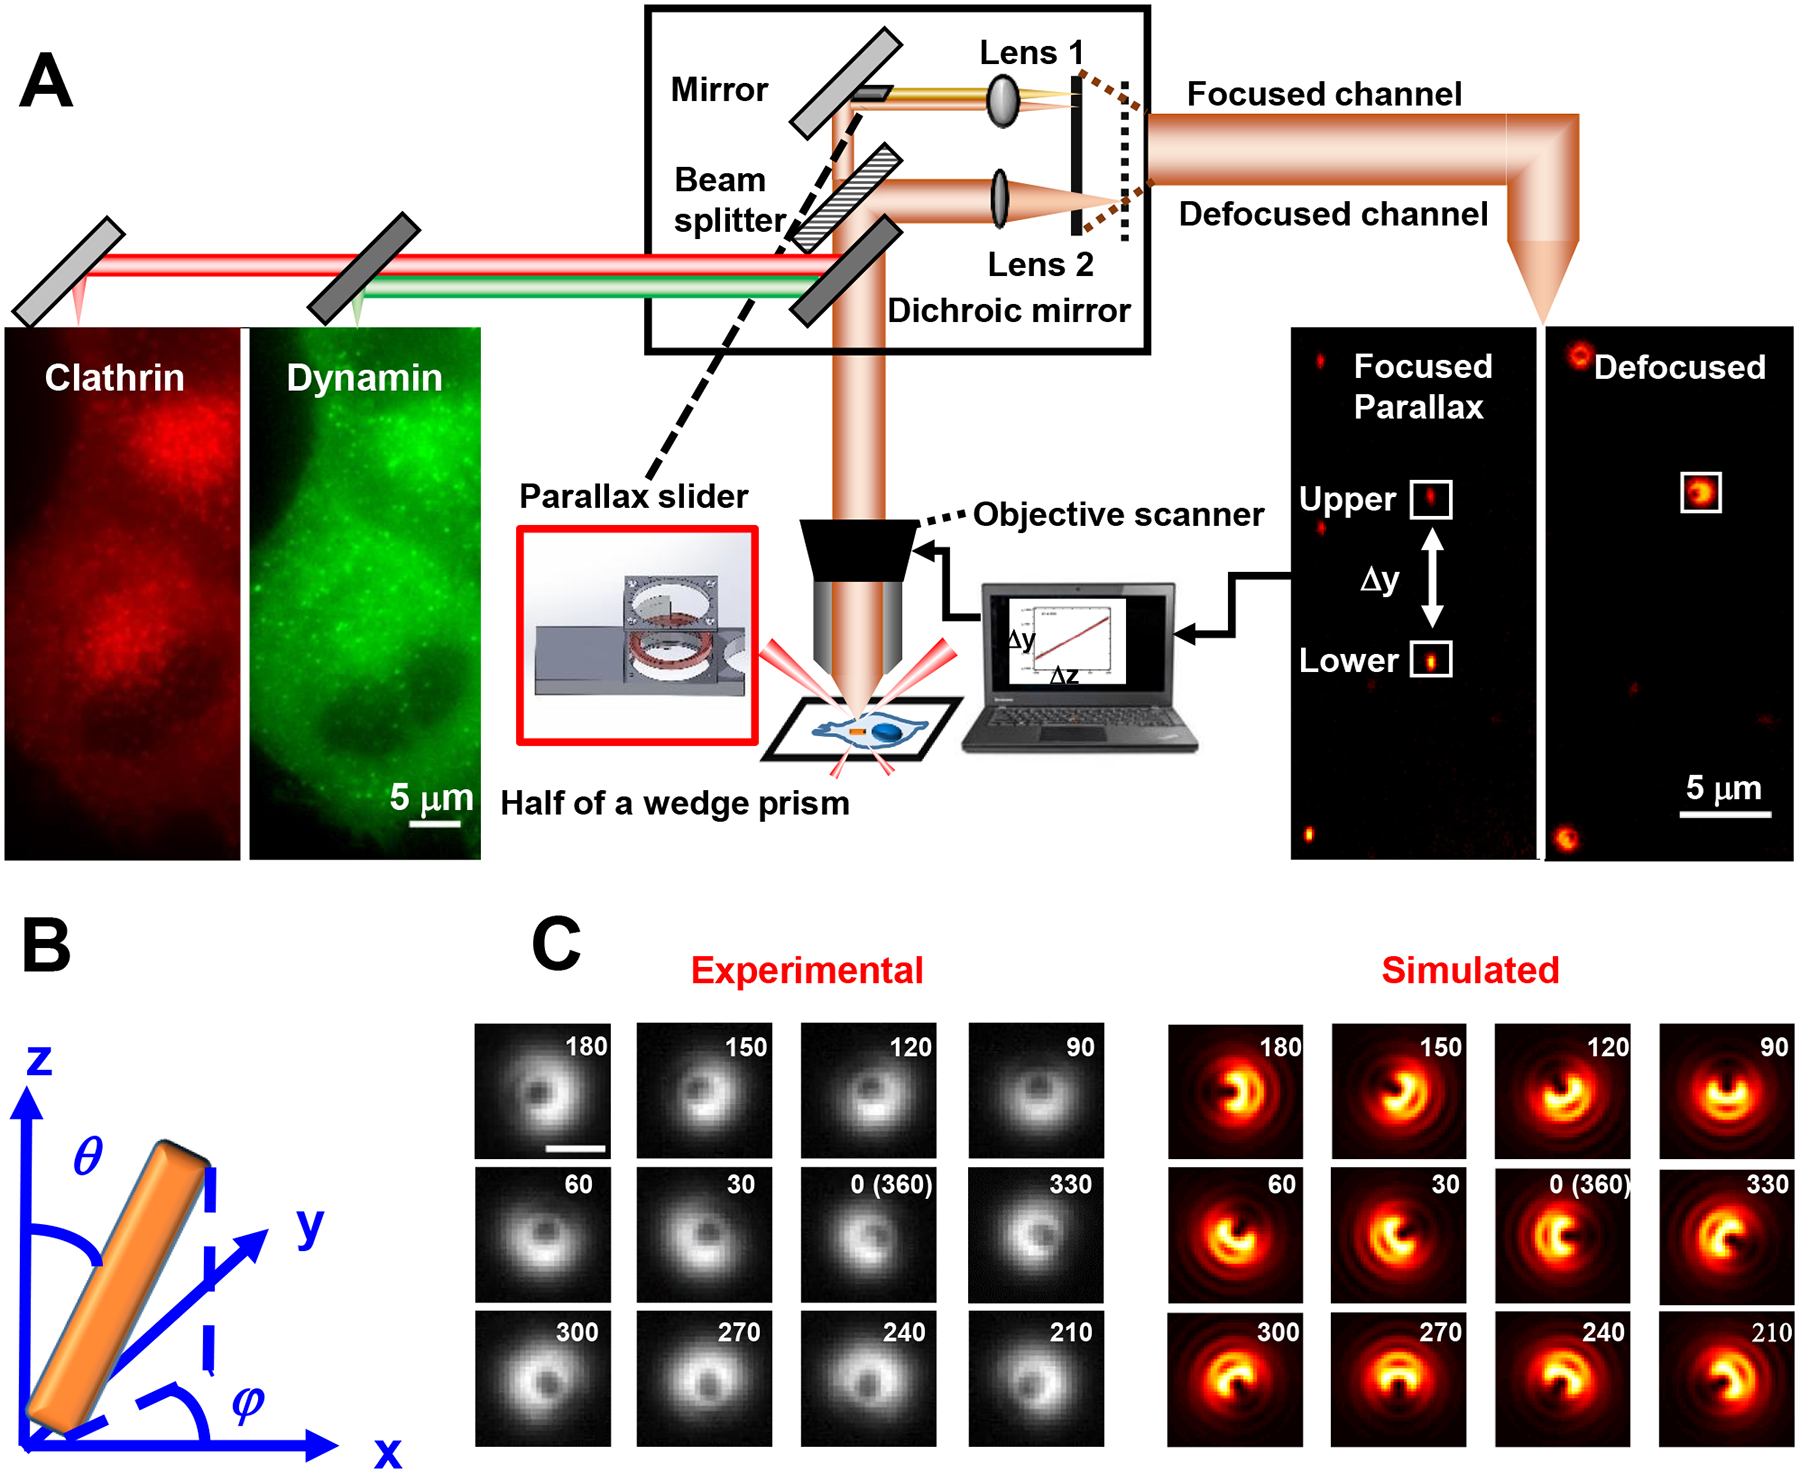
(A) Schematic of the instrument. (B) Definition of the 3D orientation: the polar angle θ and the azimuth angle φ. (C) Experimental (left) and simulated (right) defocused images of a AuNR with fixed polar angle at different azimuth angles. In the experimental images, a AuNR was immobilized in agarose gel with a fixed polar angle of 60° and varying azimuth angles (more experimental images are shown in Extended Data Fig.2). To recover their 3D orientation, a correlation coefficient mapping method was used, which compares an experimental image with all simulated images at different orientations, followed by a weighting procedure to report the most probable azimuth and polar angles of the probe. The simulated image patterns were from the theoretical point spread functions (PSF) of an emitting dipole, which were a function of its azimuth and polar angles and can be generated using the six basic functions of dipole emission (, , , , , ) (Supplemental Information 1.3 and Extended Data Fig.3). These basic image patterns are dependent on system-specific parameters including the numerical aperture and magnification of the objective, and the defocusing distance. The analysis of the orientation-dependent uncertainties associated with the recovered azimuth and polar angles is provided in Extended Data Fig.4 and Supplemental Information 1.4. Importantly, the defocused image patterns are unique at different azimuth/polar angles, confirming that the defocused imaging overcomes angular degeneracy (with exceptions at the polar angle of ~90°, at which the azimuth angle shows a 2-fold degeneracy) (Supplemental Information 1.5) and provides true rotational direction information. The scale bar in C is 1 μm.
Results
3D-SPORT.
The essential aspect of this study is to use AuNR cargos to track changes in the orientation of cargo-laden CCPs during endocytosis in vivo and thus measure the hypothesized twisting motions involved in dynamin-induced fission. To facilitate the CME of AuNRs, transferrin molecules were conjugated to the surface of 40 nm × 80 nm AuNRs. Gold nanoparticles with similar sizes modified in this way have been shown to be taken up by cells predominately through CME30–33. Well-dispersed nanoparticles in this size are endocytosed individually. They are tightly wrapped by the lipid membrane and their motions reflect the movement of the whole vesicle32,34. Given the size of these particles, we anticipate that each CCP and nascent clathrin-coated vesicle (CCV) will carry only a single transferrin-conjugated AuNR and thus, their dynamics will report those of the cargo-laden CCP/CCV35.
To track the AuNR’s orientation over the entire 3D space (0–360° for azimuth and 0–90° for polar angles), defocused dark-field imaging was used to collect the image pattern of AuNRs36. We employed parallax imaging setup to track the AuNR’s 3D position and used a feedback loop that automatically locks the AuNR probe in the focal plane to overcome the probe moving problem (Fig. 1A and Extended Data Fig. 1A, Methods, and Supplemental Information 1.1 and 1.2). The collected defocused images (Fig. 1B–C and Extended Data Fig.2) were compared with simulated image patterns (Supplemental Information 1.3 and 6 basic functions of dipole emission in Extended Data Fig. 3) to obtain the AuNR’s orientation. The instrument can resolve the 3D orientation (defined in Fig. 1B) of the AuNRs with a time resolution of ~20 ms. Under our typical live-cell imaging conditions, a precision of < 2° can be accomplished for most polar and azimuth angles with a signal-to-noise ratio of ~10 (Extended Data Fig.4 and Supplemental Information 1.4.) The degeneracy problem of AuNRs can be effectively eliminated when the particle rotates slowly (Supplemental Information 1.5). The AuNR’s position in the 3D space can be recovered with a precision of 4~6 nm laterally and 14 nm axially (Extended Data Fig. 1B–F and Supplemental Information 1.6).
Multi-dimensional tracking.
3D SPORT can collect the translational and rotational motion of AuNR probes in the 3D space in focused and defocused channels, respectively. Our customized instrument (Fig. 1A) also allows two additional fluorescence color channels to be simultaneously collected with a second EMCCD camera, which provides dynamic molecular information (i.e., dynamin and clathrin in this study) around the AuNR probe with a signal integration time of 0.5 s or 1.5 s and a waiting time between frames of 0.5 s. Sparsely distributed frames over time were used to minimize photobleaching.
In the experiments, we used the SK-MEL-2 cell line that were gene-edited to express RFP-tagged clathrin (CLTA-RFP) and EGFP-tagged dynamin2 (DNM2-EGFP)37. The surface-modified AuNR solution was added to cells plated on a glass substrate. Once a AuNR landed on the curved cell membrane surface, the recording was started and continued until AuNR was detected inside the cell (as indicated by linear translocation of the cargo over a long distance in the cell). All channels including AuNR scattering, dynamin and clathrin fluorescence were synchronized and recorded simultaneously. Only one AuNR was monitored during each experiment. To exclude any unambiguity, we focused on endocytosis events where both dynamin and clathrin were observable (Movies S1).
Fig. 2 shows an example of an endocytic event with the AuNR probe’s translational displacements and two fluorescence channels. The simultaneous fluorescence observations give detailed dynamics of the recruitment of these two proteins on the vesicles and the entry spot.
Fig. 2. Multi-dimensional imaging of a AuNR and surrounding molecular fluorescence.
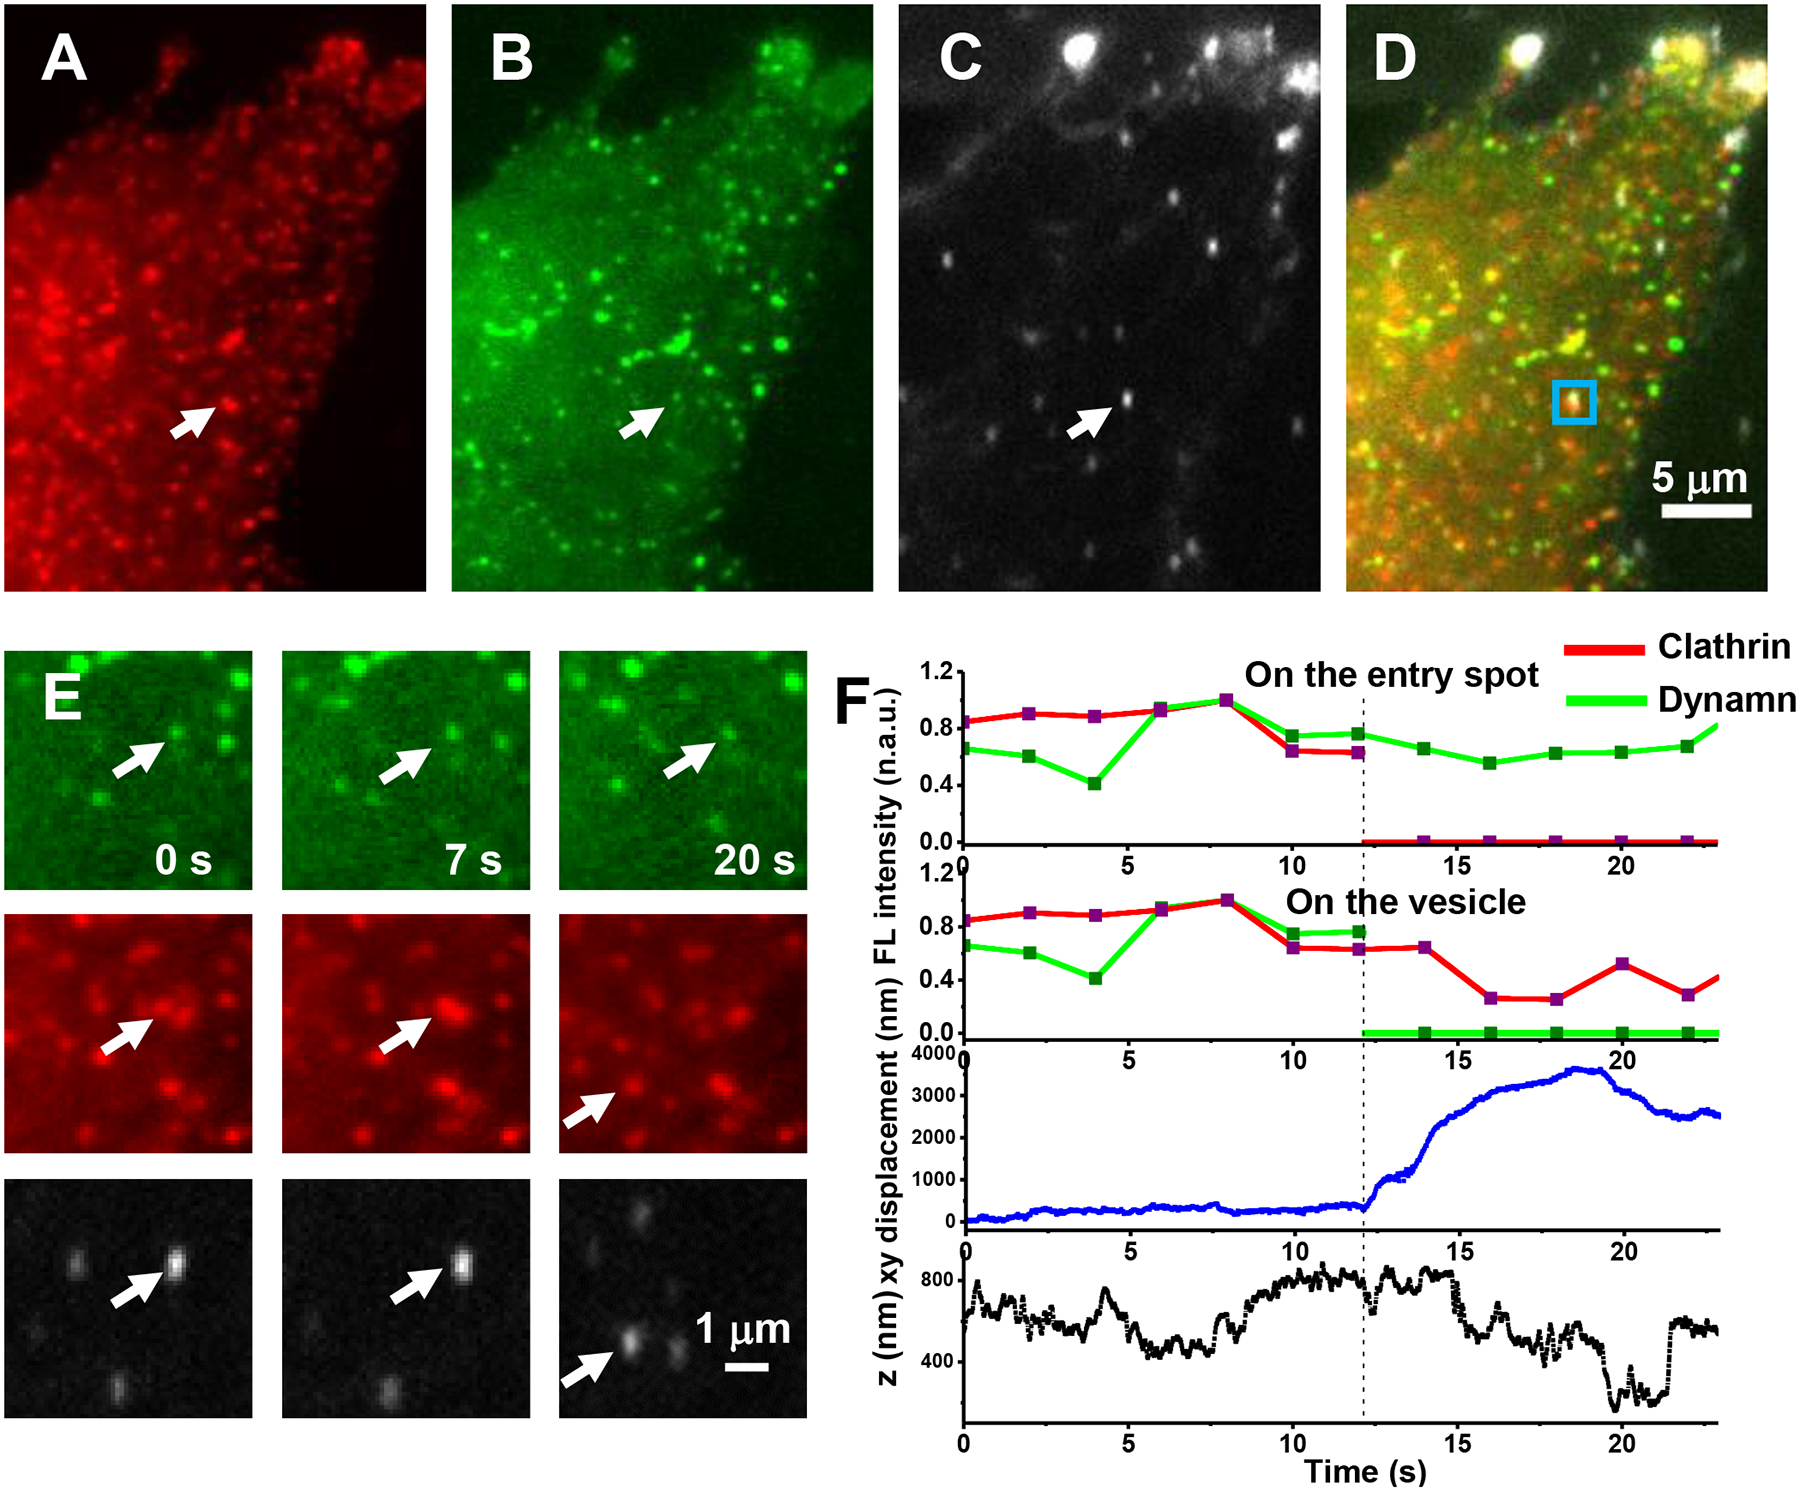
(A) Clathrin channel. (B) Dynamin channel. (C) Focused scattering channel for AuNRs. (D) Overlaid images. (E) Zoomed-in views of the squared region in Figure (D) of the dynamin channel (top row), clathrin channel (middle row) and focused scattering channel (bottom row) at different times. The colocalization of the scattering image of the AuNR cargo with clathrin and dynamin fluorescence gave direct evidence that CME happens for the observed endocytic event. (F) Time evolution of clathrin and dynamin fluorescence on the entry spot, clathrin and dynamin fluorescence on the vesicle, the lateral (xy), and axial (z) displacements of the particle from the entry spot during an endocytosis event. Z-axis direction is defined as pointing toward the outside of the cell. The dashed line indicates the time of fission. The detachment of the nascent vesicle from the cell membrane occurred at 12.2 s, which was indicated in this case by a sudden large xy-displacement, accompanied with a 260 nm inward z-directional change from the original entry spot (Fig. 2F, bottom two panels). This indicates that fission happened at, or slightly before the point at 12.2 s (i.e. the detachment point). The accumulation of dynamin at the CCPs showed large variations from case to case but usually peaked around the detachment point. In this specific case, dynamin fluorescence on the vesicle quickly dropped to the baseline after fission; whereas the opposite was observed for clathrin fluorescence, which was lost from the entry spot, but remained on the vesicle for several seconds and dropped quickly to the baseline (2E and 2F, top two panels). At the entry spot on the membrane, although the dynamin fluorescence persisted, the intensity dropped, possibly reflecting partial disassembly of the dynamin helix. It is worth noting that the focal plane moved away from the entry spot along with the vesicle, which also contributed, but to a lesser extent, to the fluorescence intensity drop at the entry spot (2F). The experiment has been performed 5 times with similar results obtained.
Rotational motions of AuNR cargos during endocytosis.
When the rotational motion of the cargo is considered, new information of endocytosis can be obtained. Fig. 3A shows as a typical example of tracked endocytosis events (Extended Data Fig. 5 shows the cell images, clathrin, dynamin information for this example).
Fig. 3. A typical example of an endocytic event with vesicle rotational information.
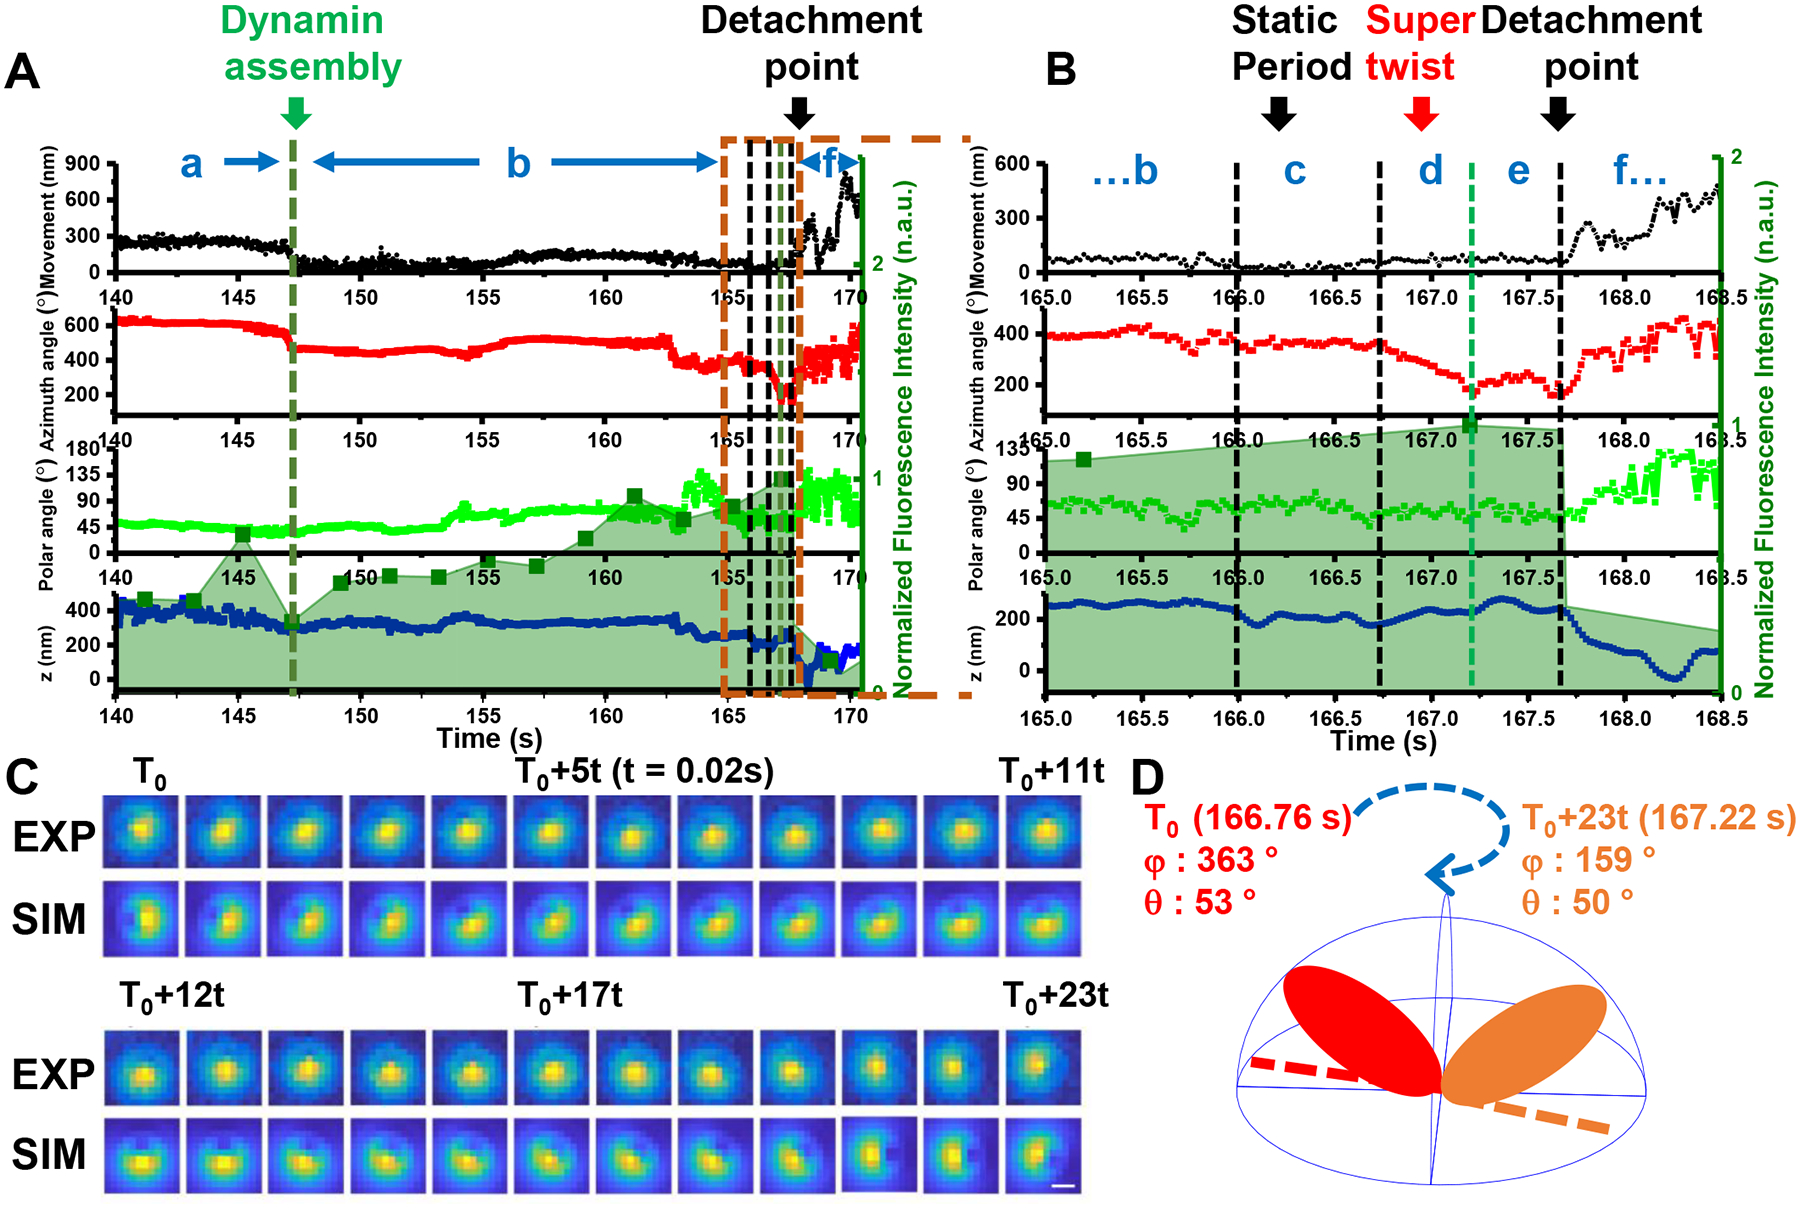
(A) The overlay of the time evolution of the cargo’s xy- displacements, rotational azimuth, and polar angles, z-displacement from top to bottom, and dynamin fluorescence in shaded light green in the background, respectively. Note that the azimuth and polar angles are cumulative with respect to the AuNR’s initial orientation so that they may exceed their nominal ranges (0–360° and 0–180°, respectively). The movements can be interpreted in the context of dynamin fluorescence intensity, which is shown in shaded light green in the background. The characteristic rotational motions together with fluorescence information can be delineated as 7 stages: (a) the initial active rotation – immobilization cycles, (b) the dynamin accumulation stage toward its peak with high variability in rotations, (c) a static period before the super twist, (d) the right-handed, super twist at dynamin peak, (e) a short, relatively slow random rotation period, and (f) a post-detachment period, which is characterized with either active translational and rotational diffusion, or linear transport with little rotation inside the cell. (B) Expanded time window near the fission point (orange frame in A). (C) Cargo’s defocused image patterns showing the “super twist” at Stage d, t = 20 ms. (D) Schematic diagram of the AuNR’s right-handed rotation during the “super twist”. The experiment has been performed 45 times, with similar results obtained.
At first glance, the AuNRs showed complicated motional patterns, experiencing multiple rotation-immobilization cycles. However, when combined with molecular information from the fluorescence observation, these motions can be classified into characteristic “stages”. All of the endocytosed AuNR cargos (45/45) showed a sequential combination of these characteristic stages throughout the process, although in some cases individual stages were missing or repeated. These stages of characteristic rotational motions, which are delineated in Fig. 3 (more examples of complete endocytosis events are shown in Extended Data Fig. 6 and 7). Of these, stages a-c are more variable, and thus will be discussed only briefly here while more detailed discussions are in the Supplemental Information 1.7. Invariant, however, is the super twist observed prior to vesicle departure.
Stage a. Gradual loss of rotational freedom.
When AuNRs first attached onto cell membrane, they showed active rotation accompanied by lateral diffusion. The translational and rotational freedoms of the AuNRs were lost gradually, with the AuNRs going back and forth between the active rotation and immobilized modes38,39. The accumulation, and presumably assembly of clathrin is often deemed as an indication that endocytosis has started, which can be observed in Stage a with large variations in duration5. This stage, which usually lasts for minutes (~2 minutes for the example in Fig. 3), is not plotted in full in Fig. 3 for clarity. Extended Data Fig. 8 and Movie S2 show a typical example of active rotation of a AuNR on the cell membrane surface at this stage.
Stage b. Dynamin accumulation step with rotation variability.
This stage is highly variable in length of time (Fig. 3, Extended Data Fig. 6 and 7) and in rotational freedoms. In 5 out of 45 cases, the AuNR cargos would maintain static during the whole period (e.g. Extended Data Fig. 7 A and D). In other cases, the AuNR cargos would restore slow or fast random rotations intermittently (e.g., 147.2–166.0 s in Fig. 3A). This stage is defined by the recruitment of dynamin to the underlying CCP (shaded light green fluorescence in the background of Fig. 3 A and B 147.2–166.0 s) toward its peak, although the kinetics and the extent of dynamin recruitment varied considerably (Fig. 3, Extended Data Fig. 6 and 7), as has been reported by other groups6,40. At the end of this stage, which coincided with the peak of dynamin recruitment/assembly, the cargo vesicle would pause rotation for those showed rotation earlier. Stage b took 18.8 s for this specific example in Fig. 3, which is consistent with the literature reports of the time for dynamin recruitment37,41.
Stage c. Static period before the super twist.
Stage b is invariably followed by a brief static period, or waiting time (Stage c, Fig. 3C, 166.0–166.76 s), as if the vesicle went into a deadlock, or was waiting for a signal to restart motion. To accurately calculate the duration time of stage c, only 40 cases with AuNR rotation in stage b were taken into accounted. Therefore, the duration was 1.9 ± 1.5 s (Fig. 4A). This stage occurs at or near the peak of dynamin recruitment and could correspond to a constricted coated pit, which has been identified biochemically and linked to dynamin assembly11.
Fig. 4. Statistics of major events before fission and Scheme of the dynamin scission model.
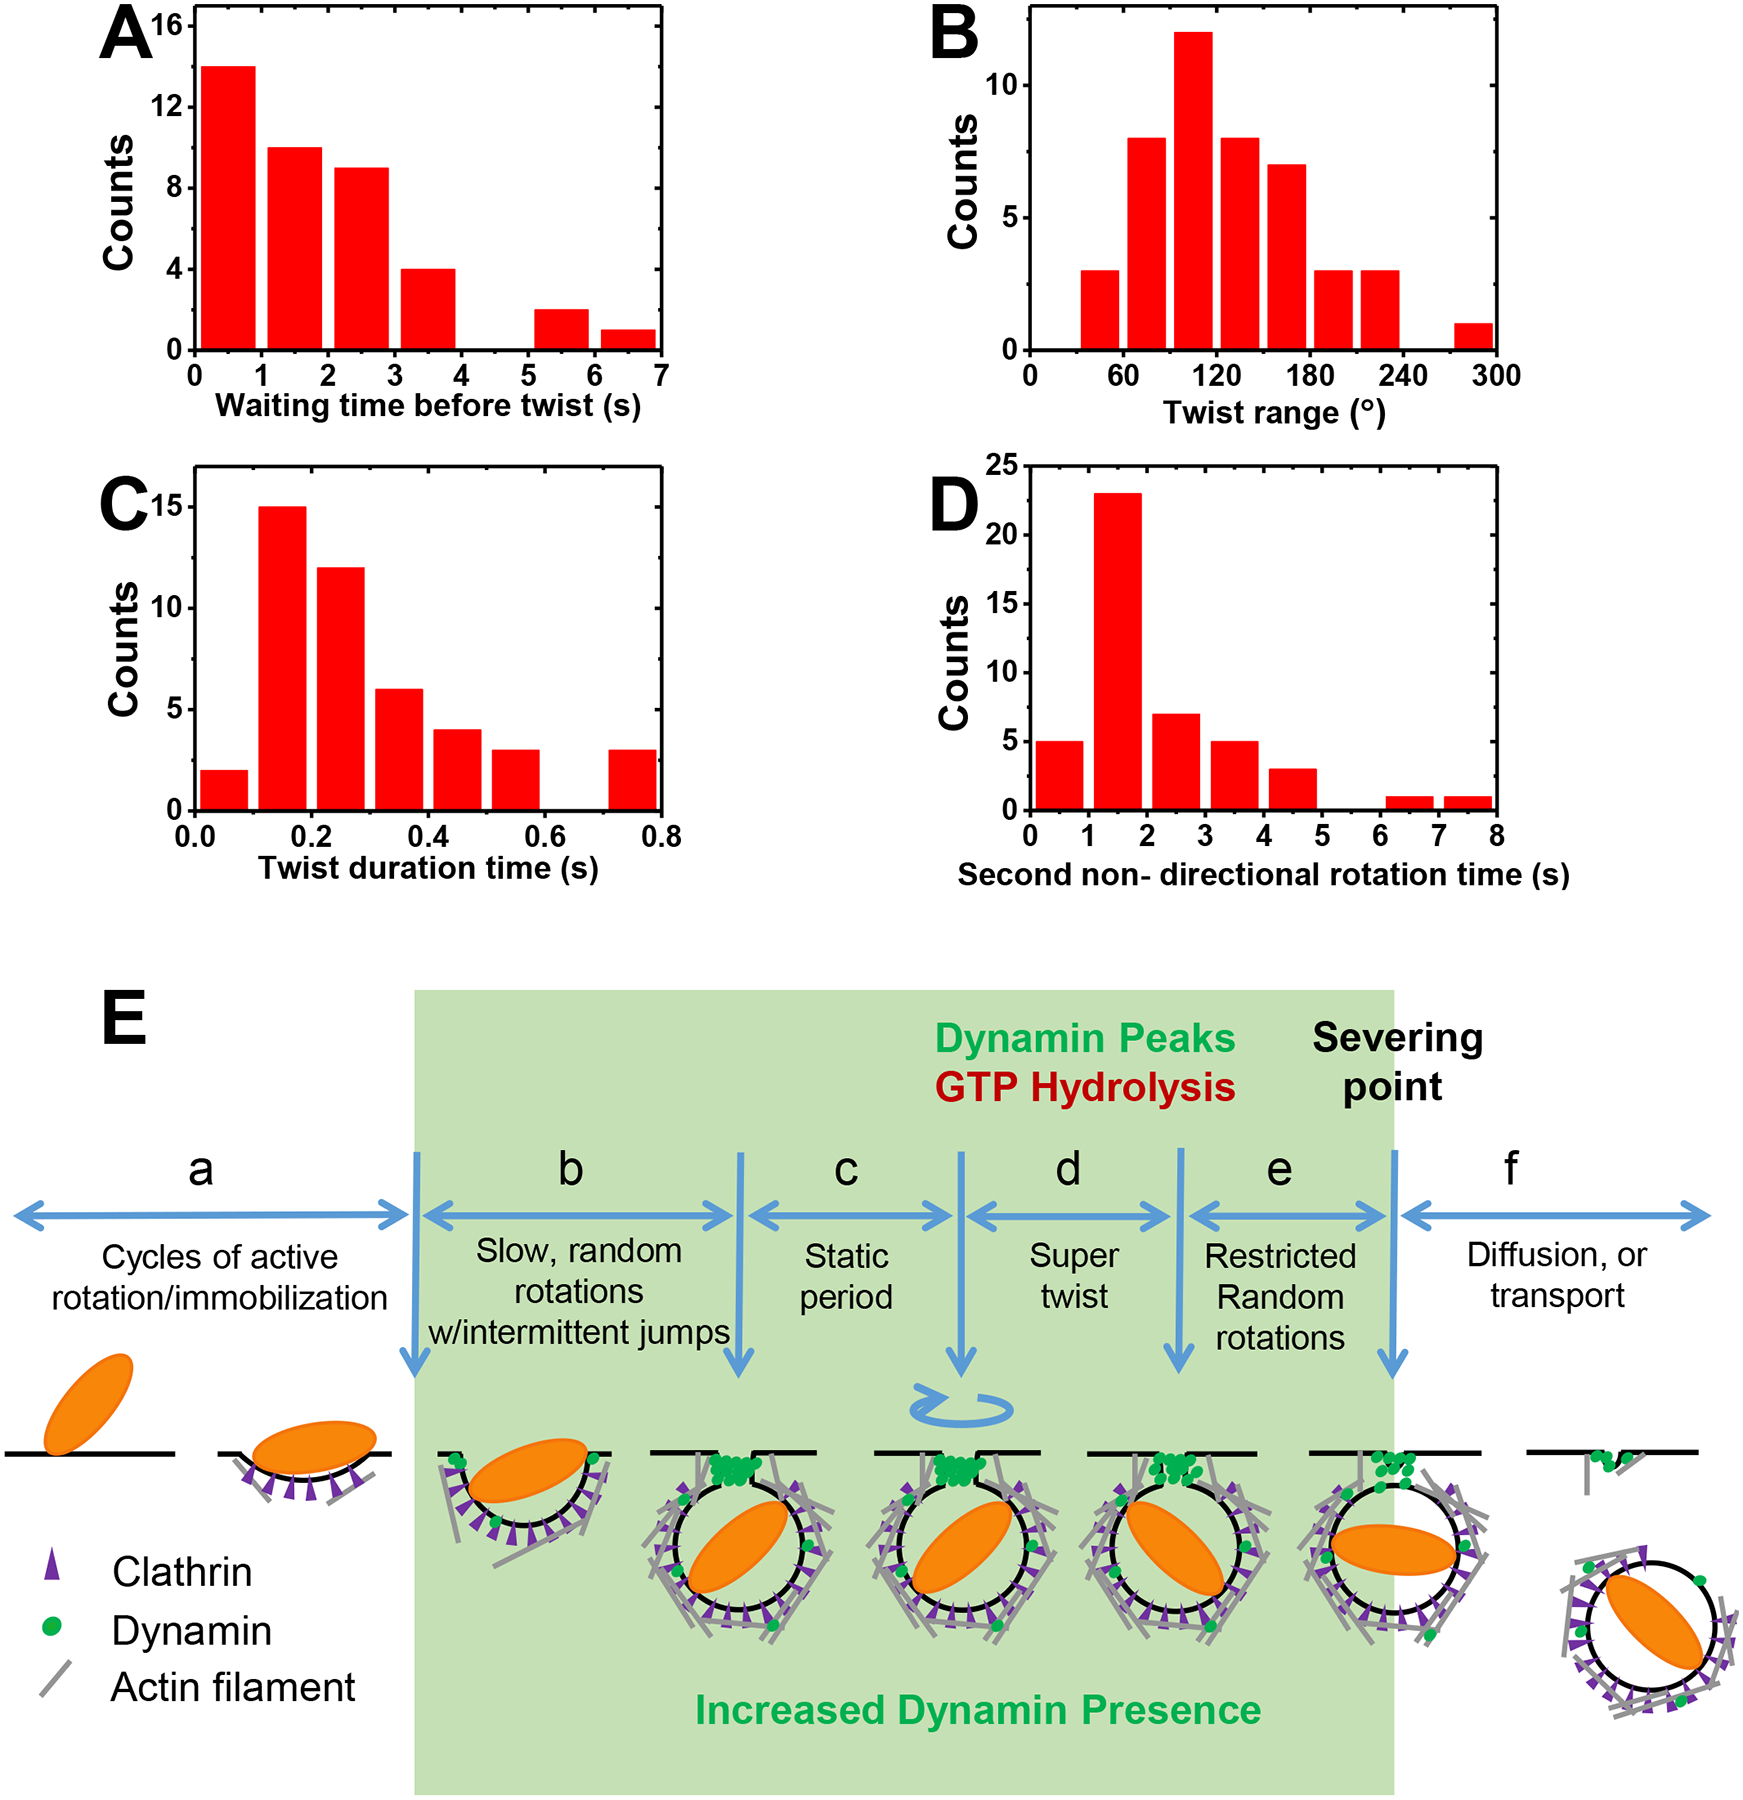
(A) Waiting time before the super twist averaged at 1.9 ± 1.5 s (Stage c, Mean ± SD, n=40, biologically independent experiments). (B) Distribution of twisting angles with average of 130 ± 56° (n = 45, biologically independent experiments) (C) Duration of the super twist averaged at 0.28 ± 0.18 s (n = 45, biologically independent experiments) (Stage d). (D) Duration of the slow non-directional rotation time after the super twist and before fission with average of 2.1 ± 1.4 s (Stage e) (n = 45, biologically independent experiments). (E) Scheme of the dynamin scission model. The endocytosis starts with the cargo’s active rotational motion slowing down to complete immobilization (Stage a). Clathrin accumulates during this stage. Then, a pulse of dynamin accumulation starts, initiating Stage b. The cargo may restore intermittent slow or fast random rotations, or stays immobilized. For those cargos restored rotational freedom, their rotation pauses (Stage c) when dynamin accumulation peaks. GTP hydrolysis by assembled dynamin is then initiated either through an external trigger or simply by the completion of dynamin assembly, which generates a ~130° right-handed super twist (Stage d). It is likely that the super twist leads to the hemi-fission of the membrane tube and the partial disassembly of dynamin helix. Then, the cargo undergoes another period of relatively slow, constrained rotation (Stage e), during which dynamin completely disassembles and scission completes. At the final stage (Stage f), the vesicle is detached from cell membrane. It either restores active random rotation and diffuses away, or is transported away by motor proteins.
Stage d. A right-handed super twist induces membrane fission.
The most dramatic and invariant (45/45) observation is the occurrence of a large and rapid right-handed, in-plane rotation(s) of the AuNR (Step d in Fig. 3B, in which case the AuNR rotated 204° in-plane from 166.76 to 167.22 s). During the whole period, the polar angle barely changed (Fig. 3B).
The average twisting angle for all the observed cases was 130 ± 56° and was finished in a very short time of 0.28 ± 0.18 s (Fig. 4B and C). Given their magnitude, we named these rotations the “super twist” in this manuscript. Movies S3–5 show 3 examples of these super twists imaged in the defocused channel starting from the static period. A large portion of these super twists (33/45, e.g., Fig. 3, Extended Data Fig. 7B, C and D) were finished in a clear single step, with the rest (12/45, e.g. Extended Data Fig. 6 and Fig. 7A) showing two steps. No more than two steps were identified. The total length of time from the end of Stage b to the departure of the vesicle (Stage f, discussed below), which encompassed the peak of dynamin recruitment (Fig. 3A) was short (e.g., 1.68 s in this example).
Fig. 7. An example of an abortive scission event.
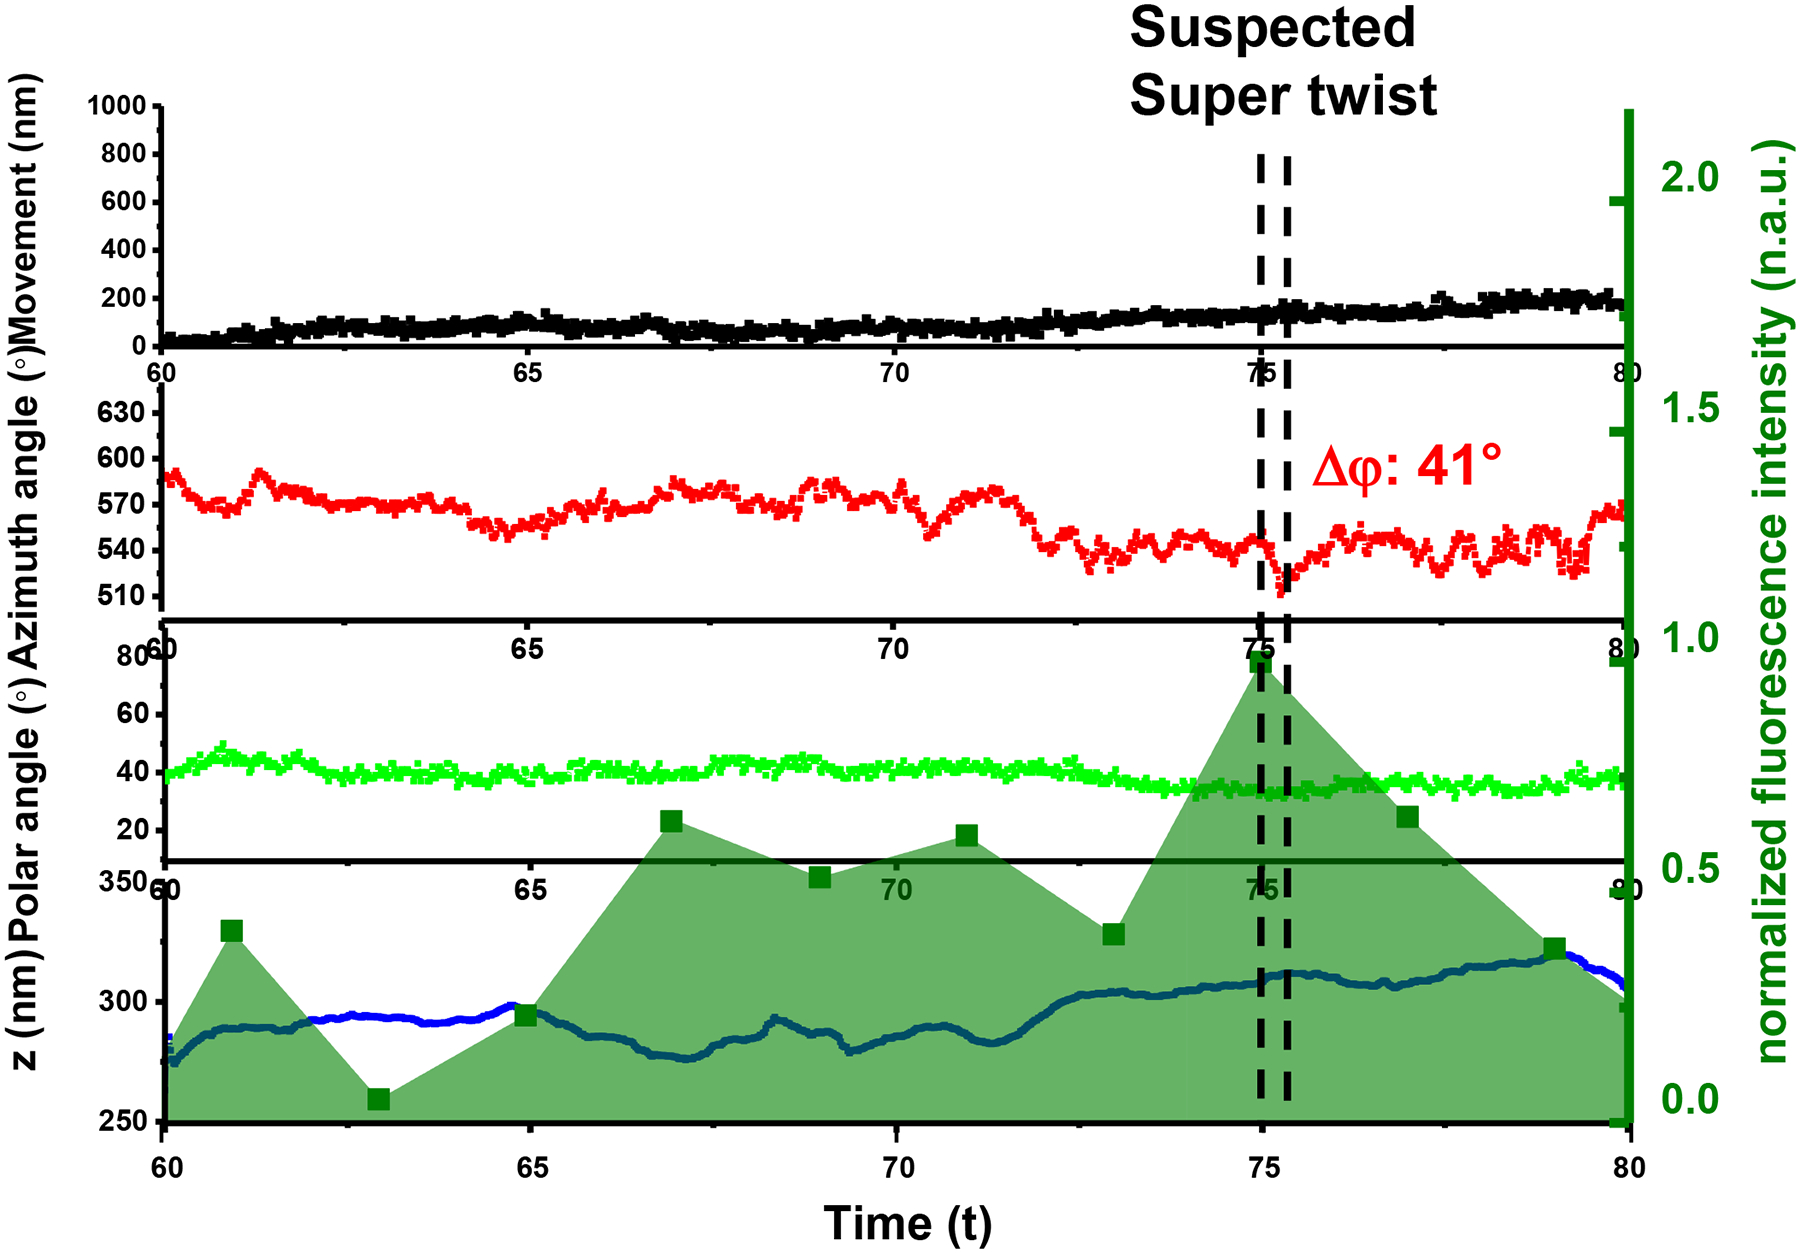
The overlay of the time evolution of the cargo’s xy-, z-displacements, rotational azimuth and polar angles, and dynamin fluorescence in the background, respectively. The experiments have been performed 4 times and with similar results obtained.
The coincidence of the peak of dynamin accumulation and the super twist suggests that the super twist may be driven by dynamin hydrolysis of GTP and is the major factor for driving fission and dynamin disassembly. To test this hypothesis, we carried out a control study using cells that express the K44A dynamin mutant defective in GTPase activity. In single-particle observation experiments with these cells, no successful endocytosis event was observed (n = 25) with sufficiently long observation time (tens of minutes). While characteristic AuNR motions consistent with early stages up to the static stage (Stage c) were detected, no super twist was detected (for a specific example, Fig. 5A). These cells showed significantly reduced efficiency in internalizing AuNRs (Fig. 5B). As a result, CME was not completed. These data confirmed that the dynamin helix generates the super twist upon GTP hydrolysis.
Fig. 5. Endocytosis of AuNRs by A-549 cells expressing K44A dynamin mutants with deficient GTPase activity.
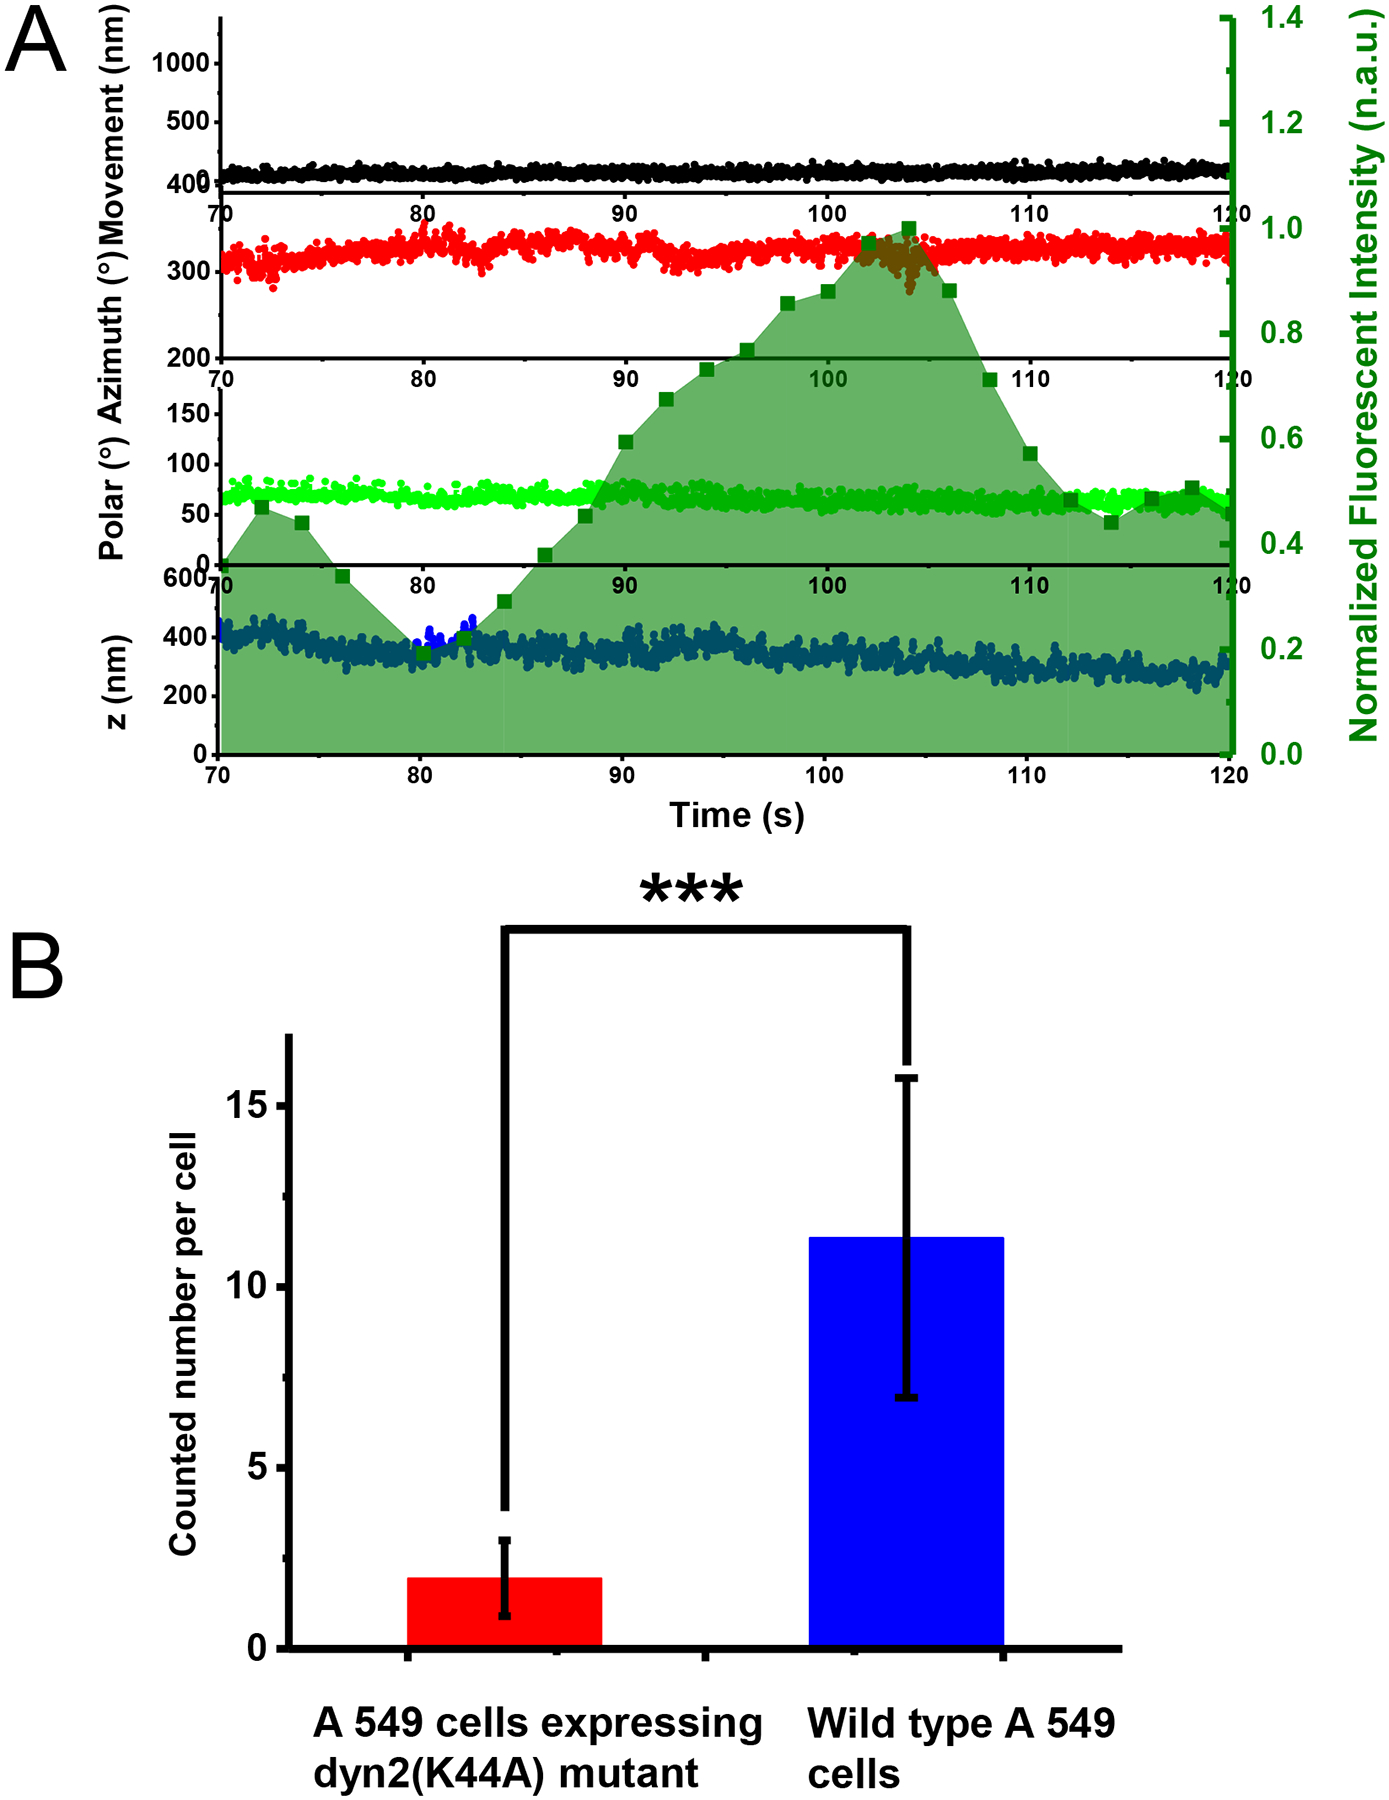
(A) A typical example of a failed endocytosis event in an A-549 cell expressing GFP-Dynamin 2-K44A. The overlay of the time evolution of the cargo’s xy-, z-displacements, rotational azimuth and polar angles, and dynamin fluorescence in the background, respectively. The experiments have been performed 25 times with similar results obtained. (B) AuNRs internalization efficiency. The internalized AuNRs after 2 hours incubation time were counted for A-549 cells expressing dyn2 (K44A) mutant and wild type A-549 cell, respectively. A-549 cells expressing GFP - Dynamin 2 - K44A: 2.0 ± 1.0 per cell (Data were expressed as mean ± SD, n= 42 samples measured in 17 independent experiments); wild type A 549 cells: 11.4 ± 4.4 per cell (Data were expressed as mean ± SD, n= 41 samples measured in 8 independent experiments). Asterisks represent significant differences between the two groups, ***p=1.62×10⁻¹⁷, two tailed t tests with unequal variance.
Stage e. Constrained random rotations before vesicle release.
After the super twist, the vesicle had another period of relatively slow, random rotations within a limited range before the detachment from the cell membrane (Stage e). The rotation steps (10 ± 13°/frame azimuth and 7± 10°/frame polar, Fig. 6E and F) were larger than those in the first slow rotation Step b (5 ± 8°/frame azimuth and 3 ± 6°/frame polar, Fig. 6C and D), yet much smaller than those in the random diffusion step (Step f: 21 ± 32°/frame azimuth and 12 ± 18° /frame polar, Fig. 6G and H). These observations possibly indicate that the rigid scaffold that stabilizes the vesicle and the neck was broken but the vesicle was still associated with the cell membrane through the remaining protein-protein interactions. The duration of this period was highly variable (2.1 ± 1.4 s, Fig. 4D).
Fig. 6. Histograms of rotation step sizes at different times during endocytosis.
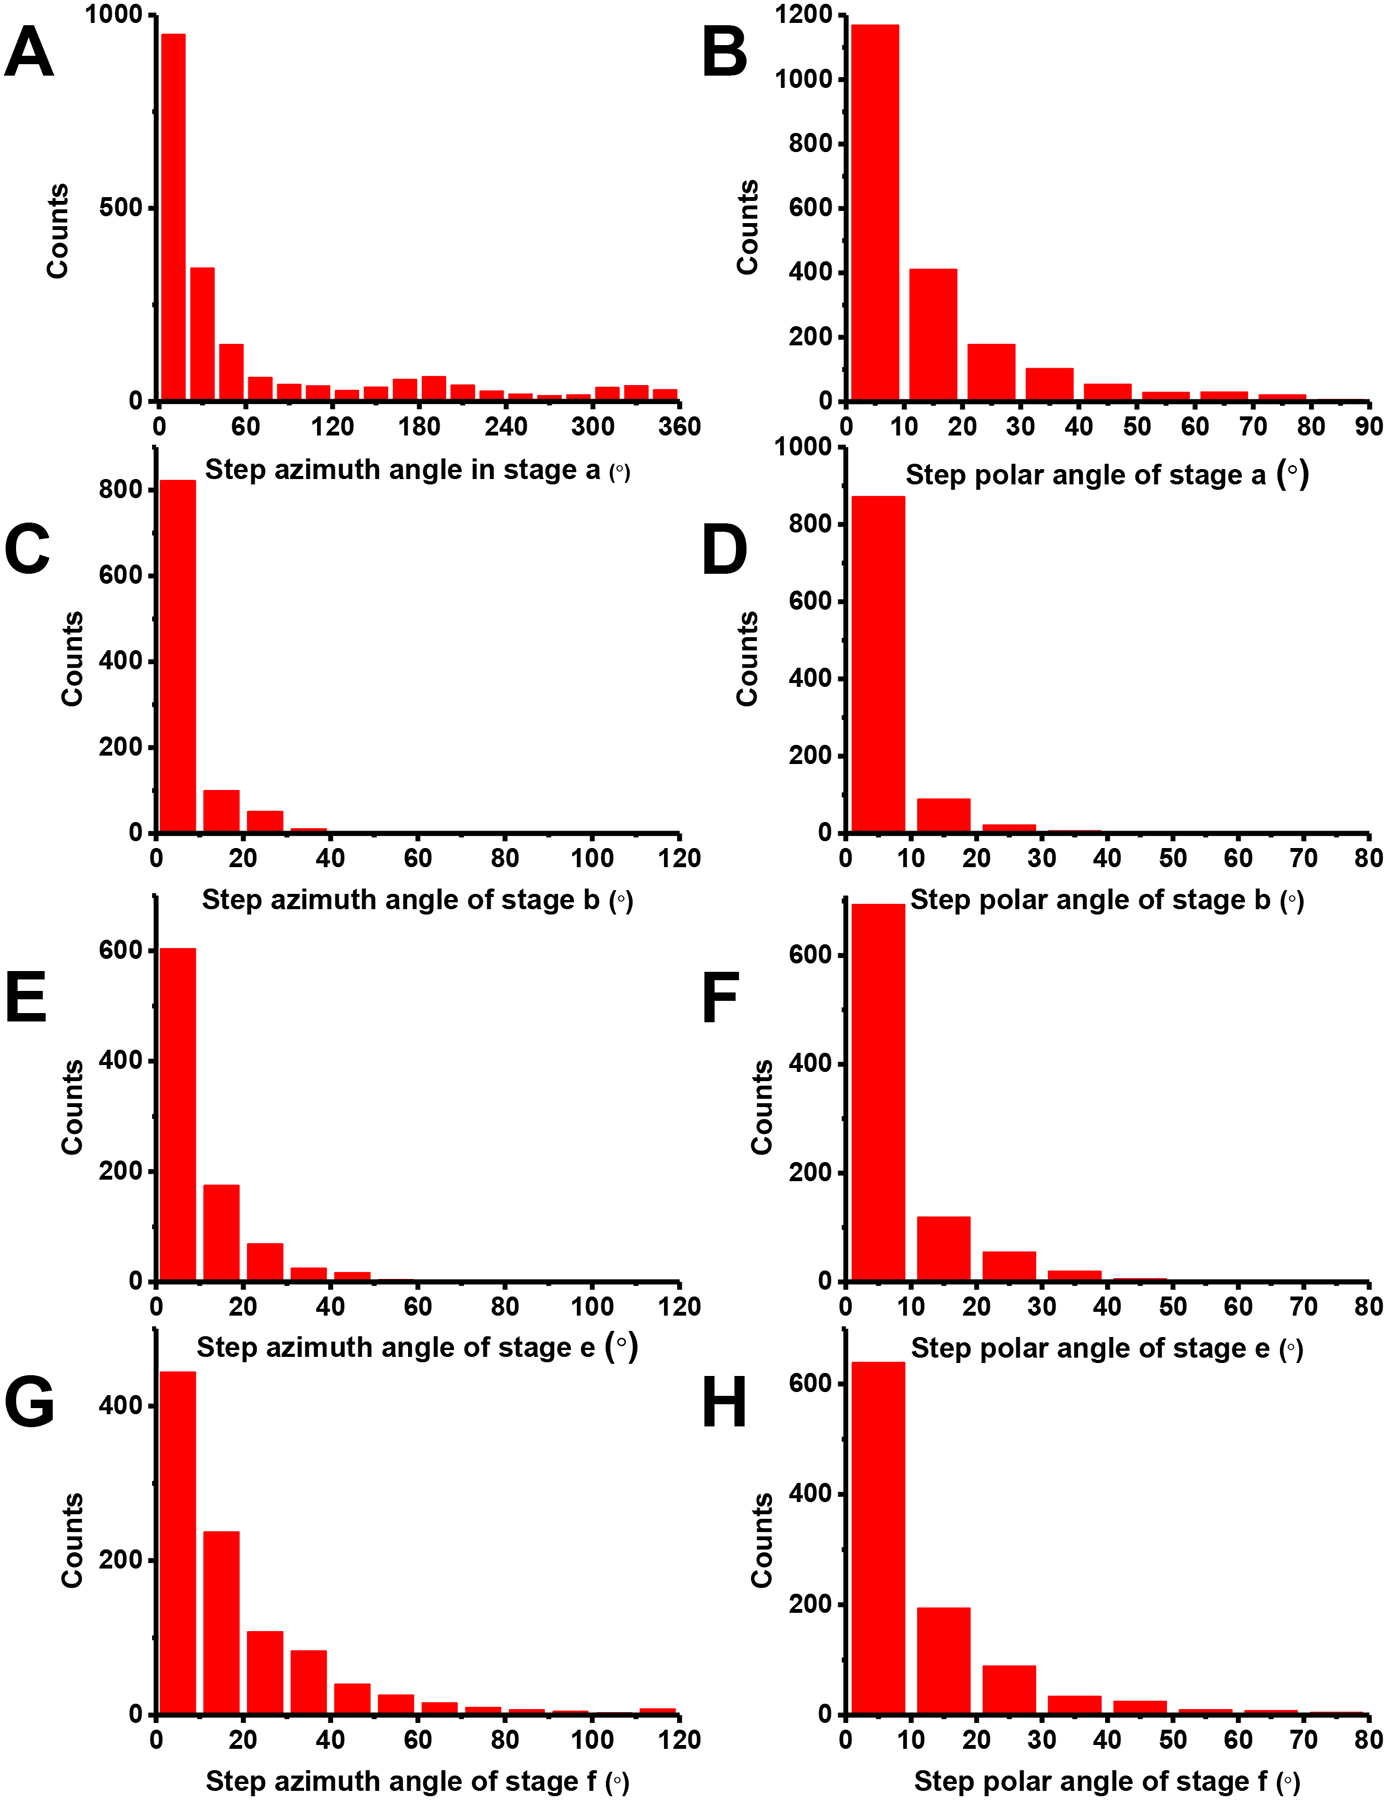
(A) (C) (E) (G): Azimuth steps. (B) (D) (F) (H): Polar steps. (A) and (B) Stag a: active rotation after initial binding to cell membrane. Azimuth step size: 65± 92°/frame. Polar step size: 13± 16°/frame (Mean ± SD, n = 2000 steps measured in a representative experiment out of 45 independent repeats. (C) and (D) Stag b: slow random rotations. Azimuth step size: 5± 8°/frame. Polar step size: 3± 6°/frame (Mean ± SD, n = 990 steps measured in a representative experiment out of 45 independent repeats. (E) and (F) Stag e: second random rotations after the super twist. Azimuth step size: 10± 13°/frame. Polar step size: 7± 10°/frame (Mean ± SD, n = 900 steps measured across 8 independent experiments, the experiments have been performed 45 times, with similar results obtained. (G) and (H) Stag f, random diffusion after scission. Azimuth step size: 21± 32°/frame. Polar step size: 12± 18°/frame (Mean ± SD, n = 1000 steps measured across 12 independent experiments, the experiments have been performed 45 times, with similar results obtained.
Stage f. Vesicle detachment and severing point.
The “fission point”, by convention, marks the time at which the vesicle membrane is no longer continuous with the plasma membrane. Pinpointing the fission point in live cells has been a challenging problem41,42. Since we cannot exclude the possibility that a mature vesicle is still connect to the cell membrane through the protein scaffold, the fission point cannot be identified using conventional imaging methods.
Here, we use “severing” or “detachment” to describe the status of a mature vesicle that is no longer connected to the cell membrane by the lipid tube, or the rigid protein scaffold on the CCP neck. However, in practice, vesicles in this state may still be trapped in the actin mesh, or tethered to the membrane through loose connections such as actin filaments so they do not leave the entry spot immediately. Thus, the onset of the displacement cannot be used as the criteria for “severing”. Indeed, the disappearance of dynamin and/or clathrin fluorescence from the evanescent field as measured in TIRF studies was shown to imprecisely reflect the scission point, as −7 ± 22s from the point of the disappearance of the dynamin fluorescence in the evanescent field40.
Our rotational observation can accurately determine the detachment point. A rigorous set of criteria was applied. First, our observations are based on dark-field imaging, which has a large depth of view and allows a more complete assessment of the displacement of the cargo vesicle. A long-distance of diffusion or linear traveling provides definitive evidence that the cargo has entered the cell. Second, the most important criterium was the restoration of active rotational motions, which can be identified visually or through quantitative analysis. It happens slightly earlier than, or at the same time as the onset of the lateral displacement. This criterium is used because a relatively rigid connection, either by the lipid membrane tube, or the remaining of the broken protein scaffold such as dynamin or other tightly bound coat proteins, would not allow large rotational steps (Stage f: 21 ± 32°/frame azimuth, 12 ± 18°/frame polar, Fig. 6G and H, as opposed to Stage b: 5 ± 8°/frame azimuth, 3± 6° /frame polar, Fig. 6C and D). Third, in many events (~70%), the AuNR cargos had an instantaneous z-movement of >100 nm accompanied with the onset of the active rotation (e.g., Fig. 3A at 167.7 s, which had an inward z-movement of 300 nm). The rapid z-movement is possibly caused by the release of tension that is generated by the rigid protein scaffold and other endocytic protein machinery, upon the severing of the vesicle from the membrane43,44. Finally, the recruitment dynamics of dynamin and clathrin on both the nascent vesicle and the entry spot facilitate the assignment of rotation stages (Fig. 2 and 3).
Determining the range of fission point.
Although we are unable to determine the exact fission point, the existence of Stage e possibly suggests that scission is a gradual process that involves the complete disassembling of proteins (e.g., dynamin) connecting the vesicle and cell membrane. The multi-dimensional approach used in our experiments allows us to accurately pinpoint the time of vesicle detachment as well as the onset of the super twist. The fission point must occur after the start of the super twist, and before or at the point of vesicle detachment. Thus, we are able to narrow down the time range with a high confidence level, i.e. fission occurs within the range of 2.4 ± 1.5 s that encompass Stages d and e.
Super twist-like motion and abortive scission events.
In the experiments, we also observed that dynamin accumulation/disassembly may happen without successful scission. Fig. 7 shows such a case in which dynamin peaked at 75 s and disassembled in the following frames of images, without subsequent vesicle detachment. While a smaller twist action of ~50° was detected, it failed to produce a large enough torque or twisting action to drive scission. These may represent failed scission attempts and we name these actions as “super twist-like actions”. It is unclear why fission may fail but a plausible explanation is that excessive resistance stalled the super twist. After the super twist-like action, dynamin disassembled, possibly suggesting that the GTP hydrolysis leads to the disassembly of dynamin helix.
Discussion
The super twist.
We report that prior to scission, endocytic pits/vesicles invariably undergo a rapid super twist that coincides with the peak of dynamin recruitment and requires dynamin’s GTPase activity in vivo. The twist unequivocally discloses that dynamin action generates a torque at the final stage of the scission.
This twisting action is partially consistent with the Ratchet model, in which the GTPase domains of dynamin work as molecular motors and slide on the helical turns by cycles of association/power stroke/dissociations, leading to the twisting and tightening of the membrane tube. However, the twisting occurs in an abrupt manner, and the whole process is finished in a very short time, ~0.28 ± 0.18 s (Fig. 4C), during which the cargo vesicle rotated by a large angle of 130 ± 56° (Fig. 4B) in the azimuth plane, with a peak rotation angle at ~130°. Given that the rate of assembly-stimulated GTPase activity of dynamin is much slower8, our data suggest that the super twist involves highly orchestrated conformational changes from multiple dynamin molecules.
It is unclear how constricted the dynamin assembly is before the super twist. CryoEM experiments have shown that the “non-constricted” helix composed of dynamin without nucleotides may have 14–18 dynamin dimers per rung45,46, the “constricted” helix containing dynamin in the presence of GTP analogues has 13.2 dimers per rung27, and the “super constricted” helix has a unique two-start structure and has 11.8 pairs of dynamin dimers per rung19,28. Assuming that the assembled dynamin before the super twist adopts a helical structure similar to one of the above-mentioned structures, a rotation of the vesicle by ~130° (õne third of a circle) requires that the GTPase domain of dynamin slides by at least ~4 dynamin units along the helix. In majority of these events (33/45), the super twist was completed in a single step in ~0.28 s. Considering that several GTP hydrolysis events are focused in such a short time, it suggests that this process involves coordinated actions from multiple dynamins in the helix, rather than independent, sequential GTP hydrolysis and twisting steps. Note that the focused GTP hydrolysis events are also consistent with recent observations that GTP hydrolysis peaks near the dynamin accumulation maximum despite there is a slight, random shift between the two47. Such focused GTP hydrolysis possibly indicates that there is a hidden regulation mechanism in vivo that initiates multiple GTP molecules to act in a short time. It is interesting to note that in the Two-State model, all dynamin molecules in adjacent rungs of a helix need to act in a coordinated manner to cut the vesicle neck11. Here, we see the two models and out data are converging. Considering the stepping nature of dynamin sliding on each other in the helix upon GTP hydrolysis, it is possible that once GTP hydrolysis starts, a cascade of reactions follows such that the completion of the earlier reaction triggers the next one, until the twist is completed. Thus, the super twist may consist of several steps that appear as a single large step and the rates of GTP hydrolysis measured in vitro could be much slower than those accomplished in vivo. Note that a defective dynamin in the helix may pause or terminate the cascaded reactions, which is consistent with the observation that a small fraction of defective dynamin drastically decreases the fission activity11.
We also speculate that the super twist may be paused or terminated in the process. A fraction of successful endocytosis events included a pause then resumed the super twist (e.g., 12/45) very quickly (< 0.1 s) and scission was completed. In many other cases (n > 50), we observed super twist-like actions that did not result in scission and instead were likely terminated. These observations suggest that in some cases (> 50%) the GTP hydrolysis reactions failed to produce sufficient constriction to drive scission and are consistent with the stochastic nature of dynamin-catalyzed scission observed in vitro12,13. It is interesting to note that regardless of whether the super twist continues to complete scission, or fails, the accumulated dynamin dissociates. This is possibly an indication that focused GTP hydrolysis is linked to the destabilization of dynamin helix and its disassembly. Nevertheless, it is worthwhile to point out that the final super twist is indispensable in all the successful scission events, suggesting a large torque is the main driving force for scission.
The state of dynamin assembly before and after super twist.
The super twist always occurs near the peak of dynamin accumulation, which is an indication that dynamin recruitment has been completed. An important question is what are the structures of dynamin molecules before and after the twist?
It is generally accepted that assembled dynamin adopts a helical structure before scission but the structure during and after scission is still under debate. Especially of interest is the “super-constricted” helix, which has such a small radius (i.d. 3.7 nm) that the membrane tube inside can proceed to the hemi-fission intermediate with barely any energy barrier48, 19. It is tempting to assign the dynamin helix after the super twist as the “super-constricted” helical state, and dynamin assembly before the super twist as one of the less constricted helices. However, it also has been reported that the super-constricted dynamin helix has a unique two-start structure. Recruiting of additional dynamin and elongation of the membrane tube are required to convert one-start, less constricted helices to the super-constricted state28. These observations contributed to the argument that the helices captured in cryo-EM experiments may not necessarily be on the same pathway leading to scission; other undiscovered intermediates may exist. Yet, it is also possible that they are on the same pathway: the conversion of one-start helix to two-start helix could happen during the cutting, and the super twist could reflect this twisting and tightening process with the insertion of pre-accumulated dynamins into the helix. All these indicate the complexity of the scission process.
While we are unable to determine the dynamin structures before or after the twist, we speculate that after the super twist, the dynamin helix is either in a reversible, very constricted state ready for hemi-fission, or, in an irreversible state that has already triggered hemi-fission and partial disassembly of the dynamin helix. After the super twist, a limited increase of rotational freedom (Fig. 6) was observed yet the vesicle did not leave the endocytosis spot, suggesting that the stable dynamin-helix/membrane tube structure has already been broken but the vesicle is still connected to the membrane, possibly through the remaining of the broken protein scaffold. Complete detachment of the vesicle from the membrane happens at a later time shortly after the super twist (Stage e, 2.1 ± 1.4 s, Fig. 4D). The delayed start of active rotation suggests that scission is not an instantaneous action but a gradual process that takes ~1 s to finish.
Since a successful super twist always leads to fission and the disassembly of the dynamin assembly, it is more likely that the super twist irreversibly destabilizes the dynamin helical structure due to GTP hydrolysis and induces hemi-fission and partial disassembly of dynamin as suggested by the Two-Stage model. It is also possible that the super twist tightens the helix and generates conformational stress that breaks the helix as proposed in the Ratchet model. Since our fluorescence imaging has a limited time resolution (~1 s), we are unable to rule out either of the possibilities. Finally, it is unclear but also possible that more GTP hydrolysis is required in this process to completely sever the connection between the vesicle and the membrane. Other methods will be needed to identify the dynamin helical structures before and after the super twist.
The static period (Stage c) before the super twist.
The static period, which lasted for 1.9 ± 1.5 s for 40 cases, is another interesting finding (Stage c, Fig. 4A). We speculate that the dynamin collar has formed around the CCP at this stage so as to limit the fluctuation of membrane and restrict the cargo rotation. The static nature indicates that dynamin hydrolysis of GTPs did not start immediately but instead the dynamin assembly seemed to wait for a signal to trigger the hydrolysis reaction.
This unexplained phenomenon possibly indicates that GTP hydrolysis by assembled dynamin helix is regulated through an unknown mechanism as also suggested by other group47,49,50. Indeed, there are many processes happening during scission that are less clear. For example, although the proline-rich domain (PRD) of dynamin is not required for fission activity in vitro, dynamin’s GTPase and fission activities are regulated by SH3 domain proteins that bind to the PRD49,50. Scission is also regulated by BAR-domain proteins such as endophilin and amphiphysin5,49–52. Indeed, endophilin, which is recruited in a synchronized manner with dynamin at the late stages of scission52 and was thought to promote dynamin function52 has also been shown to inhibit dynamin function at high concentrations53,54, which may be relevant to the pause of GTPase functionality after dynamin assembly. Another study showed that the stimulatory action of amphiphysin on dynamin is dependent on lipid bilayer curvature55. These interactions may be relevant to the paused start of GTPase functionality after dynamin assembly. Or, as an alternative explanation to chemical signaling, the control of GTP hydrolysis may simply be physical: the restoring force from the squeezed membrane tube may stall GTP hydrolysis. Further study is needed to better explain this phenomenon.
In summary, we demonstrated the characteristic translational and rotational motions of the AuNR cargos at different stages throughout the CME process. Especially at the final stage of scission, the dynamin helix induces a large, right-handed twist through coordinated actions from multiple dynamin molecules. This unequivocally shows that a torque is generated in dynamin action in vivo. We summarize the scission model in Fig. 4E, which is consistent with both the Ratchet and the Two-Stage models but provides much missing details regarding dynamin actions in vivo, upon which the two models may eventually converge. The rotational study paves the way toward a deeper, more comprehensive understanding of how dynamin works by combining other feature studies such as structural characterization and molecular simulations.
Methods
Mutli-dimensional microscopy.
A Nikon Eclipse 80i upright microscope equipped with a heating stage (Bioscience Tools) was used in this study. For dark-field microscopy, a Nikon oil immersion dark-field condenser (numerical aperture (NA): 1.20–1.43), and a Nikon 60× Plan Fluor oil immersion objective (NA: 0.5–1.25) were used with the NA set to 1.0. The same objective was used for both excitation and emission collection. The scattering of gold nanoparticles was excited using a transmission light from a halogen lamp that is filtered with a band pass filter (FF01-650/13, Semrock). The fluorescence of GFP-Dynamin and RFP-Clathrin were excited using two collimated and coaligned 488 nm (50 mW) and 561 nm (100 mW) lasers (Oxxius) which were reflected into the collecting objective by a dual-band dichroic mirror (Di03-R488/561, Semrock). A dual-band pass filter (FF01-482/563, Semrock) in front of the dichroic mirror was used to clean up the two lasers. To reduce the fluorescence background, variable angle epifluorescence illumination configuration was used. Both illumination pathways (dark-field scattering and fluorescence) are turned on at the same time in multi-dimensional imaging experiments.
Simultaneously dark-field scattering, and fluorescence imaging were achieved using a self-design and home-made 4-channel imaging module (Fig. 1). Briefly, the fluorescence and dark-field signals were collected simultaneously through the same objective and relayed to the 4-channel imaging module for further splitting and processing. To remove the scattering background from the lasers, a combination of two notch filters (ZET488NF and ZET561NF, Chroma) was used before entering the 4-channel imaging module. The collected signals were first split by a long pass dichroic mirror (BLP01-635R, Semrock): reflection for fluorescence (left arm) and transmission for dark-field scattering (right arm). The reflected fluorescence signals were further split into 2 channels using a long pass dichroic mirror (LP03-532RU, Semrock). Fluorescence signals of dynamin and clathrin in each channel were filtered using two band pass filters FF01-512/25 (Semrock) and FF01-598/25 (Semrock), respectively. Both channels of the fluorescence images were then focused to different portions of a same EMCCD camera chip (Andor Technology; iXonEM+ Ultra 888) through the same left exit port of the imaging module. Bifocal imaging, parallax microscopy, and the auto-chasing under dark-field mode were achieved in the right arm of the 4-channel imaging module. First, the dark-field image was split into a focused channel and a defocused channel using a beam splitter (Thorlabs) where 30% of signal in focused channel for localization and auto-chasing and 70% of signal in defocused channel for orientation determination. In defocused channel, an additional focal lens (f = 500 mm) was inserted into the optical pathway to create a defocusing distance of 0.9 μm, which was found to generate the most suitable defocused image patterns for orientation determination. The dark-field images in focused and defocused channels were focused to different portions of a second EMCCD camera (Andor Technology; iXonEM+ Ultra 897) through the same right exit port of the 4-channel imaging module.
All dark-field movies were recorded at 50 frames per second (fps). The heating stage was set to 37 °C to maintain the living conditions for cells. Fluorescence images were recorded at 1 or 0.5 fps. The image acquisition on two EMCCD cameras were triggered and synchronized using a mechanical shutter. The acquired images were analyzed using ImageJ and MATLAB.
3D-SPORT.
Bifocal imaging, parallax microscopy, and an automatic feedback control module are the key components of the imaging system. The purpose of the design is to keep the target probe in focus continuously in the focused channel to extract the 3D spatial coordinates (x, y, z) with nanoscale precision while obtaining image patterns with a constant defocusing distance in the defocused channel to determine the probe’s orientation angles accurately and robustly.
The auto-chasing was achieved using parallax imaging in the focused channel. Briefly, a custom-cut wedge prism (0.5°, Edmund) was inserted in the focused channel near the back focal plane of the objective to deviate half of the scattering light from the sample by a very small angle, effectively splitting the light to form two half-plane images (as opposed to the standard full-plane images using the full pupil) in only the focused channel. The two associated half-plane mirror images for a single probe are always manually aligned vertically, and they will be referred to as the upper and lower image, respectively, throughout our discussions. The x and y coordinates were resolved by Gaussian fitting. The z position of a probe is a function of the separation distance (Δy) between its upper and lower images. A calibration curve was constructed experimentally to correlate this relationship. The experimental localization precision in the x, y, and z axes (Extended Data Fig. 1) is 4.9, 6.3 and 14.0 nm, respectively. Finally, the automatic feedback control system, composed of a piezo objective scanner (Physik Instrumente) and a tracking program in μManger, was implemented to keep the target probe in focus. When the target probe was in perfect focus, the y distance between the upper and lower images in the focused channel was obtained as the reference (Δy0). During the tracking, Δy was calculated for every other frame. The tracking program would move the objective scanner to keep the target probe in focus in the next frame.
Preparation of surface-modified gold nanorods for cell experiments.
Sodium citrate-capped AuNRs (40 nm × 80 nm) were purchased from Nanopartz. The average aspect ratio of the AuNRs is 2.0. The electrostatic adsorption method establishing transferrin-coated AuNRs was used by following a published method30. Briefly, 100 μL of the AuNRs solution (3.7×10¹⁰ mL−1) was mixed with 4 μL of 50 mM borate buffer (pH 8.5). Then 5 μL of 3 mg/mL transferrin (CAS: 11096-37-0, Sigma-Aldrich) was added to the gold nanorod solution and reacted for 3 hours. Finally, the mixture was centrifuged at 5000 rpm for 5 min twice and resuspended in 100 μL of 2 mM borate buffer (pH 8.5). AuNRs modified this way was shown to be up taken by cells predominantly through the CME pathway (>~70%)31,32.
Cell culture.
A549 human lung cancer cell line was purchased from American Type Culture Collection (ATCC, Manassas, VA; catalog number: CCL-185). SK-MEL-2 cell line was a gift from the Drubin group (UC Berkeley). The cells were cultured in a T25 cell culture flask (Corning) and grown in a cell culture medium (DMEM/F12, Gibco) supplemented with 10% fetal bovine serum (FBS). This cell culture medium contains both ferric nitrate and ferrous sulfate. When subculturing, 150 μL of cell suspension solution was transferred to a 22×22 mm coated coverslip, housed in a 35-mm Petri dish (Corning). After that 1.5 mL of the cell culture medium with 10% FBS supplement was added to immerse the coverslip, the Petri dish was kept in the incubator for 48 hours.
Transfection of A549 cells to express GFP-Dynamin 2- K44A.
E. Coli bacteria with GFP-Dynamin 2-K44A plasmid was purchased from Addgene (Plasmid 22301). The plasmid was purified from the bacteria with the plasmid extraction kit (cat. 27104). The high density A549 cells were subcultured on a coverslip in a Petri dish in the incubator. After 24 hours, the GFP-Dynamin 2- K44A was mixed with lipofectamine 3000 regent in the Opti-EME medium (ThermoFisher) first and then add to the Petri dish. After 48 hours of incubation, the cells were ready for imaging.
Quantification of AuNRs Internalization.
The wild type A549 cells and A549 cells expressing GFP-Dynamin 2-K44A were cultured on a coverslip in Petri dishes overnight in the incubator. Then, AuNRs functionalized with transferrin were injected into the Petri dish and the final concentration of AuNRs was 3.7×10⁹ mL−1. After two-hour of incubation in the incubator, the cells were ready to be used. The uptake of AuNRs was visualized with a DIC microscope at 650 nm wavelength and z-stacks were obtained using an objective scanner and reconstructed with ImageJ. Then the endocytosed AuNRs in individual cells were identified and counted. The counted numbers of AuNRs per cell in A549 cells expressing GFP-Dynamin 2- K44A and wild type A549 cells were 2.0 ± 1.0 (Mean ± SD, n = 20, biologically independent experiments), 11.4 ± 4.4 (Mean ± SD, n = 20, biologically independent experiments), respectively.
Live-cell imaging of endocytosis.
Two pieces of double-sided taps were adhered to the clean glass side. A cover glass with adherent cells was placed on the top of the double-sided taps with cells facing to the glass slide, to form a chamber. Then 5 μL of the transferrin@AuNRs solution mixed with 45 μL of the cell culture medium was injected into the chamber. To prevent evaporation and leakage of the medium, the cover glass was sealed by nail polish.
Statistics and Reproducibility
All results are expressed as either absolute value or Mean ± SD. P values were calculated using unpaired two-tailed Student’s t-test with unequal variance for two groups comparison. Exact p value was provided in the legends when available. ***p < 0.001 shows significant differences. No sample size calculation was performed. Sample size was determined based on our experience and previous studies. All data were replicated at least three times and most results were representative of ten or more times in independent experiments, with similar results obtained.
Data availability
Source data for all figures have been uploaded. All other data supporting the findings of this study are available from the corresponding author on reasonable request.
Code availability
The auto-chasing was achieved using micro-manager. The localization and orientation of an AuNR was analyzed with Matlab. All code is available from the corresponding author on request.
Extended Data
Extended Data Fig. 1. Calibration curve of Δy vs. Δz and 3D localization precision of a AuNR.
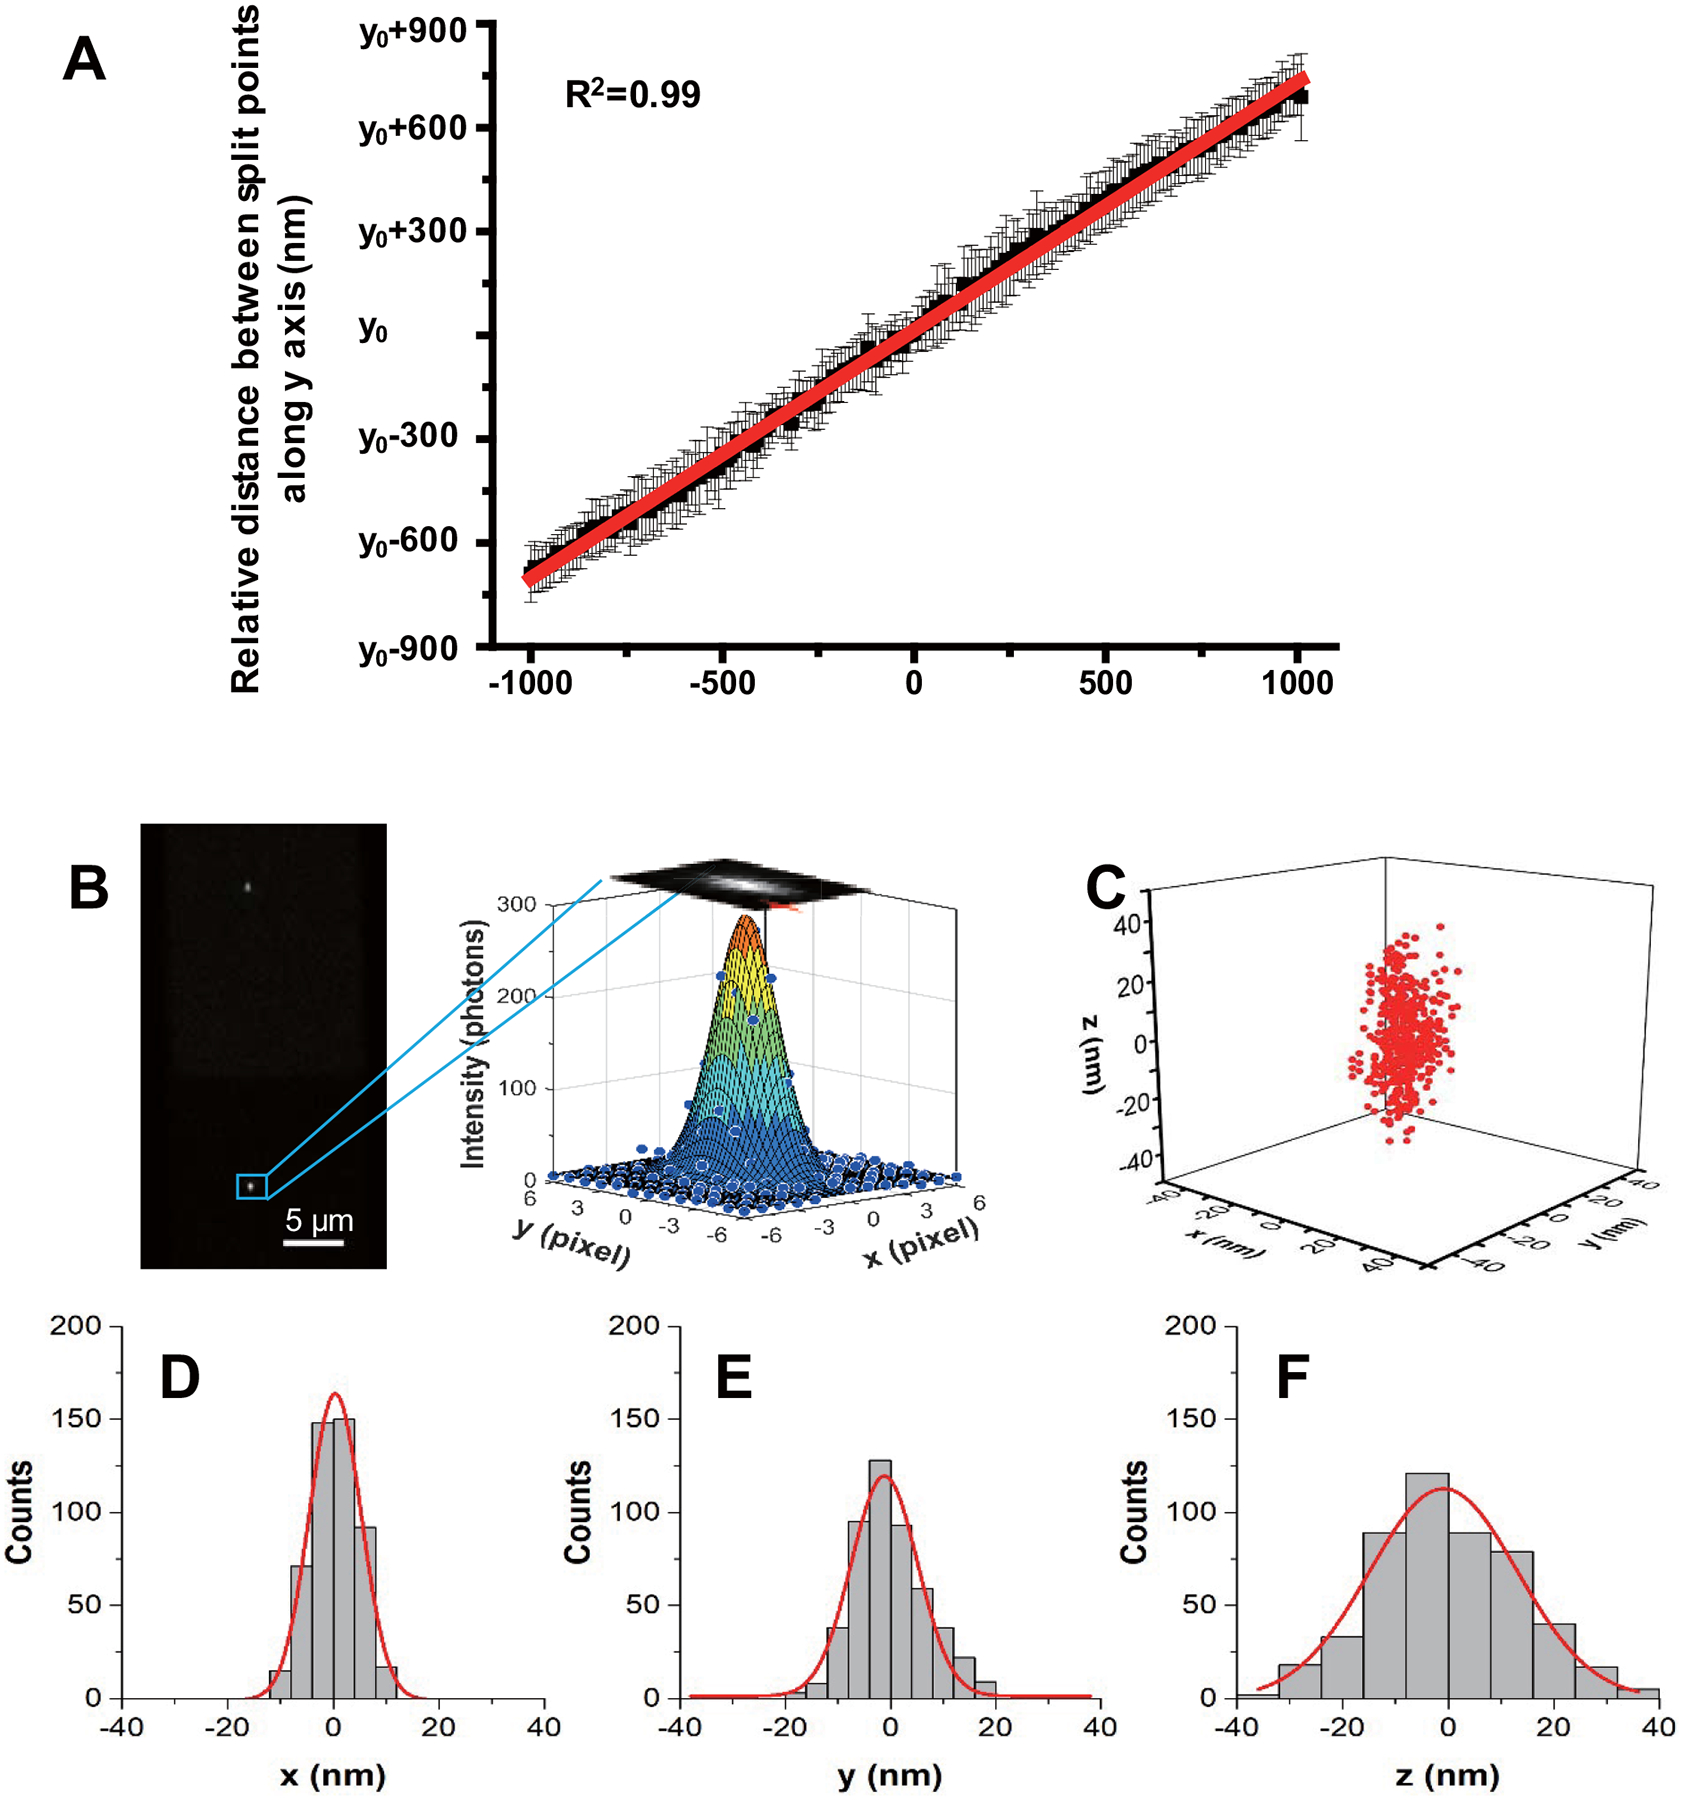
(A) The AuNRs were immobilized on a glass slide surface with various orientations and scanned along the z-axis from −1000 nm to 1000 nm with 10 nm steps using a high-precision objective scanner (Data were expressed as mean ± SD, n=20 independent experiments). (B) Typical upper and lower half-plane dark-field images of a AuNR with 0.02 s integration time are shown on the left. Scale bar is 5 μm. The lateral positions of the AuNR are determined by 2D elliptical Gaussian fitting (right) the intensity profile. (C) Scatter plot of locations of the same AuNR in 500 frames. The x, y positions are determined using 2D elliptical Gaussian fitting of the particle image intensity profile. The z positions are obtained from feedback of the objective scanner when auto-focusing system was engaged. The localization precision is determined as the standard deviation from 1D Gaussian function fitting the histogram distribution of the AuNR locations in x, y, z, giving σx = 4.9 nm (D), σy = 6.3 nm (E) and σz = 14.0 nm (F).
Extended Data Fig. 2. Another example of the full plane defocused image patterns of a AuNR.
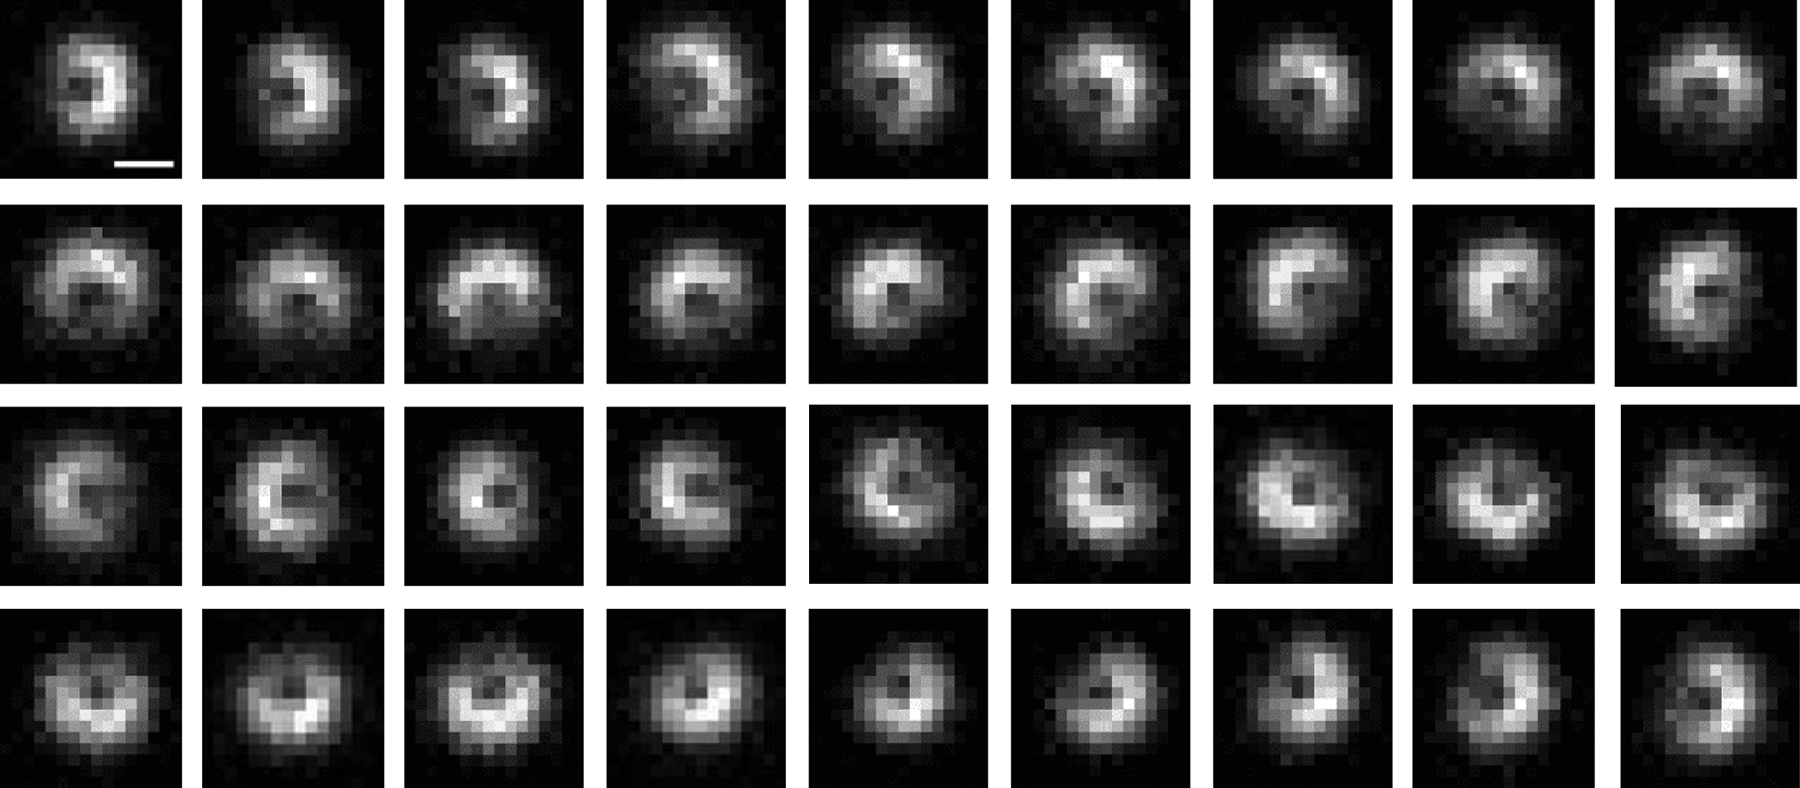
The defocused images of a AuNR with a polar angle of 60° at different azimuth angles with 10° intervals were shown. Scale bar is 1 μm.
Extended Data Fig. 3. The six basic dipole emission templates used in simulation.
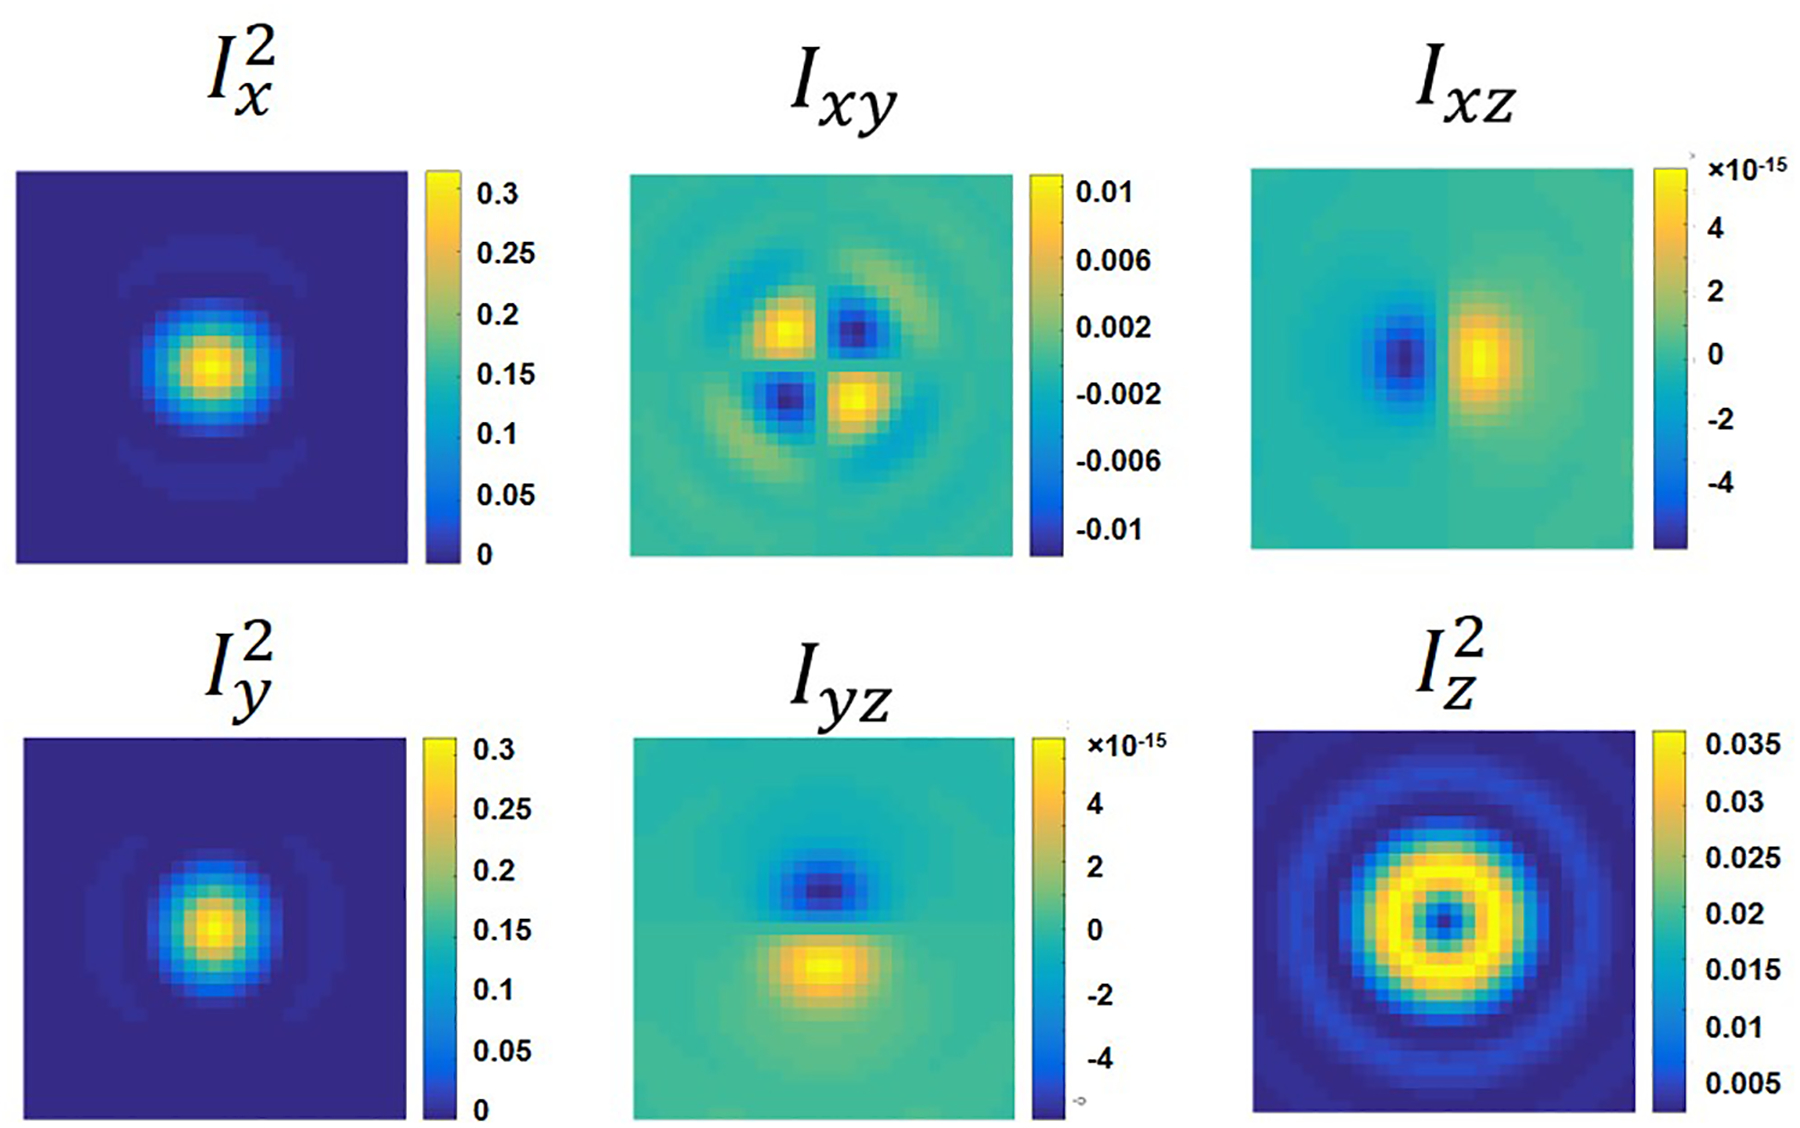
These basic image patterns are dependent on system-specific parameters including the numerical aperture and magnification of the objective, and the defocusing distance.
Extended Data Fig. 4. Estimated polar and azimuth angle errors for orientation recovery at S/N = 10.
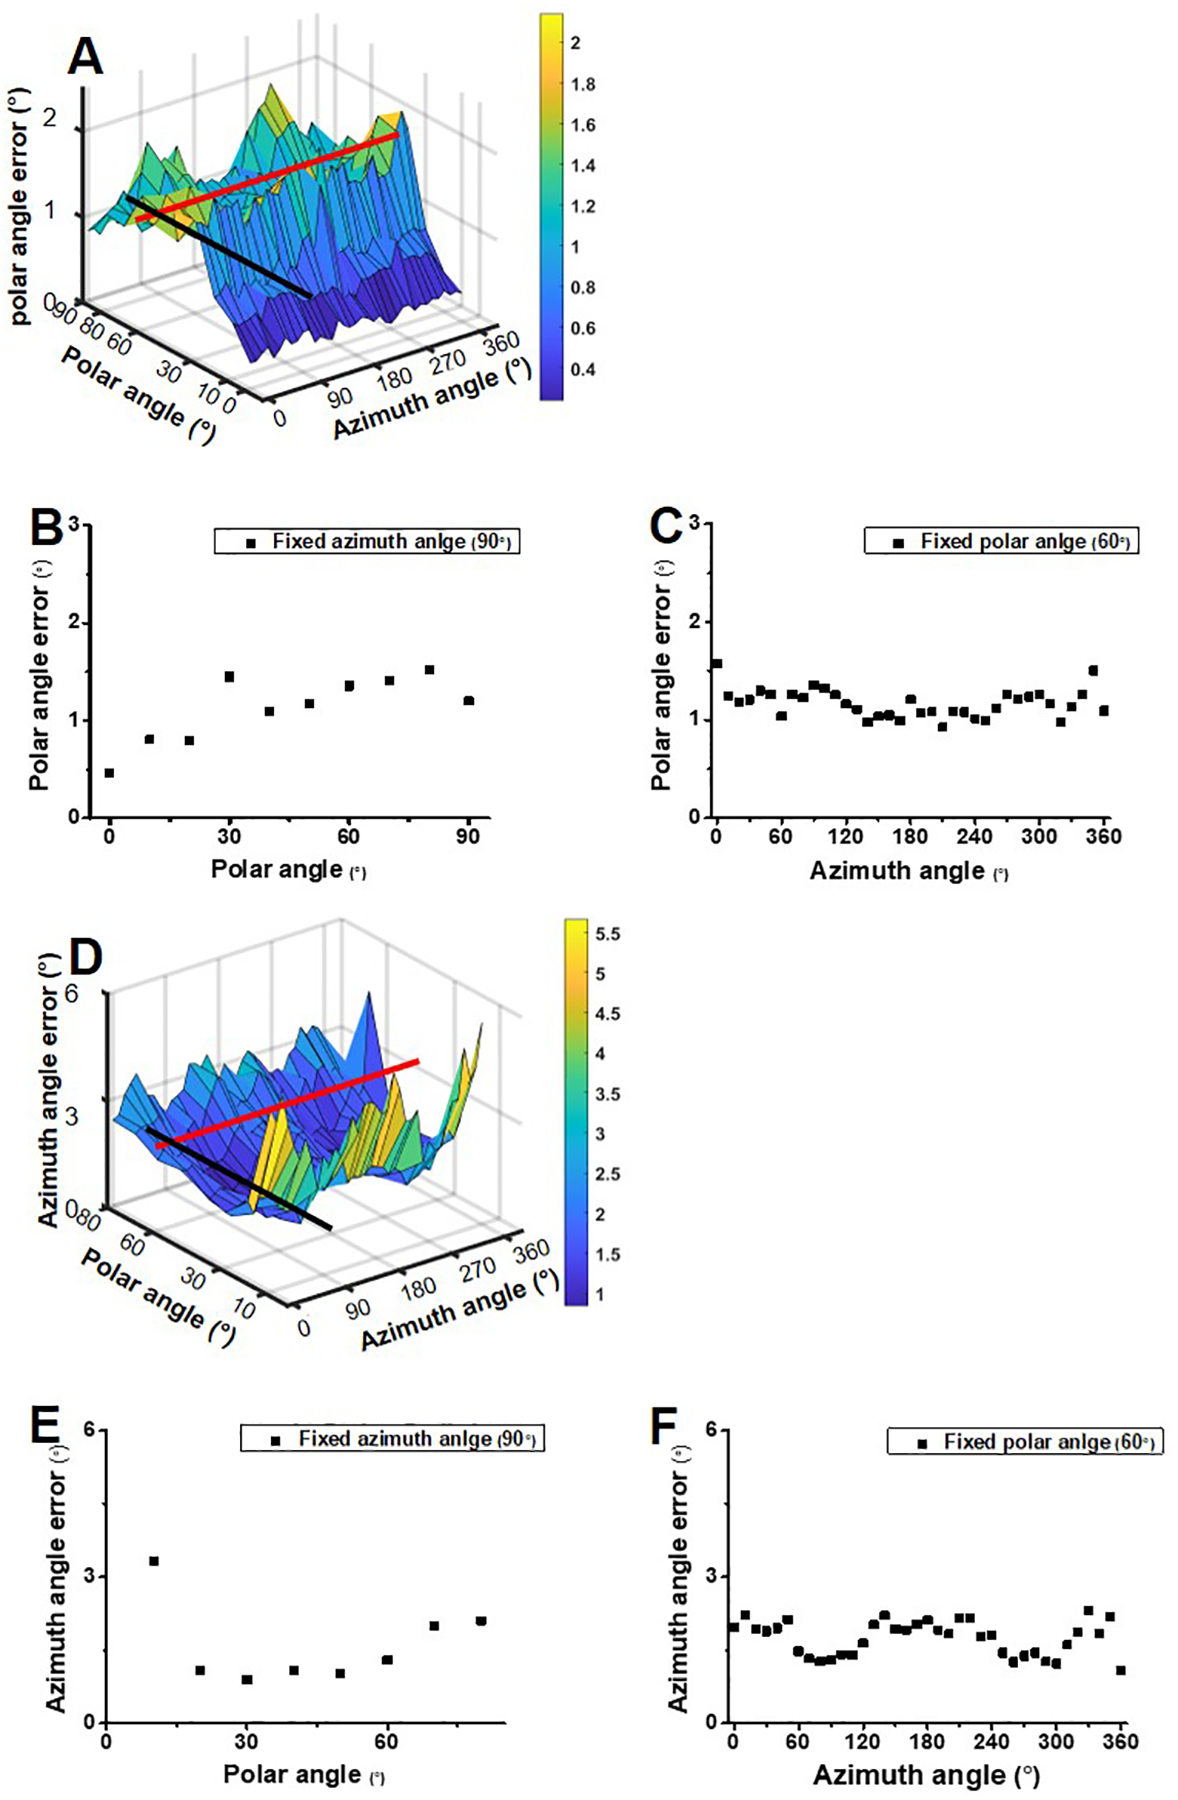
(A) Estimated polar errors for orientation with various combinations of the azimuth angle and polar angle at S/N = 10. (B) The cross section along the black line in (A) shows the polar angle errors with various polar angles and a fixed azimuth angle of 90°. (C) The cross section along the red line in (A) represents the polar angle errors with various azimuth angles and a fixed polar angle of 60°. (D) Estimated azimuth errors for orientation with various combinations of the azimuth angle and polar angle at S/N = 10. (E) The cross section along the black line in (D) shows the azimuth angle errors with various polar angles and a fixed azimuth angle of 90°. (F) The cross section along the red line in (D) represents the azimuth angle errors with various azimuth angles and a fixed polar angle of 60°.
Extended Data Fig. 5. Dynamin and clathrin fluorescence during endocytosis of the example shown in Fig. 3.
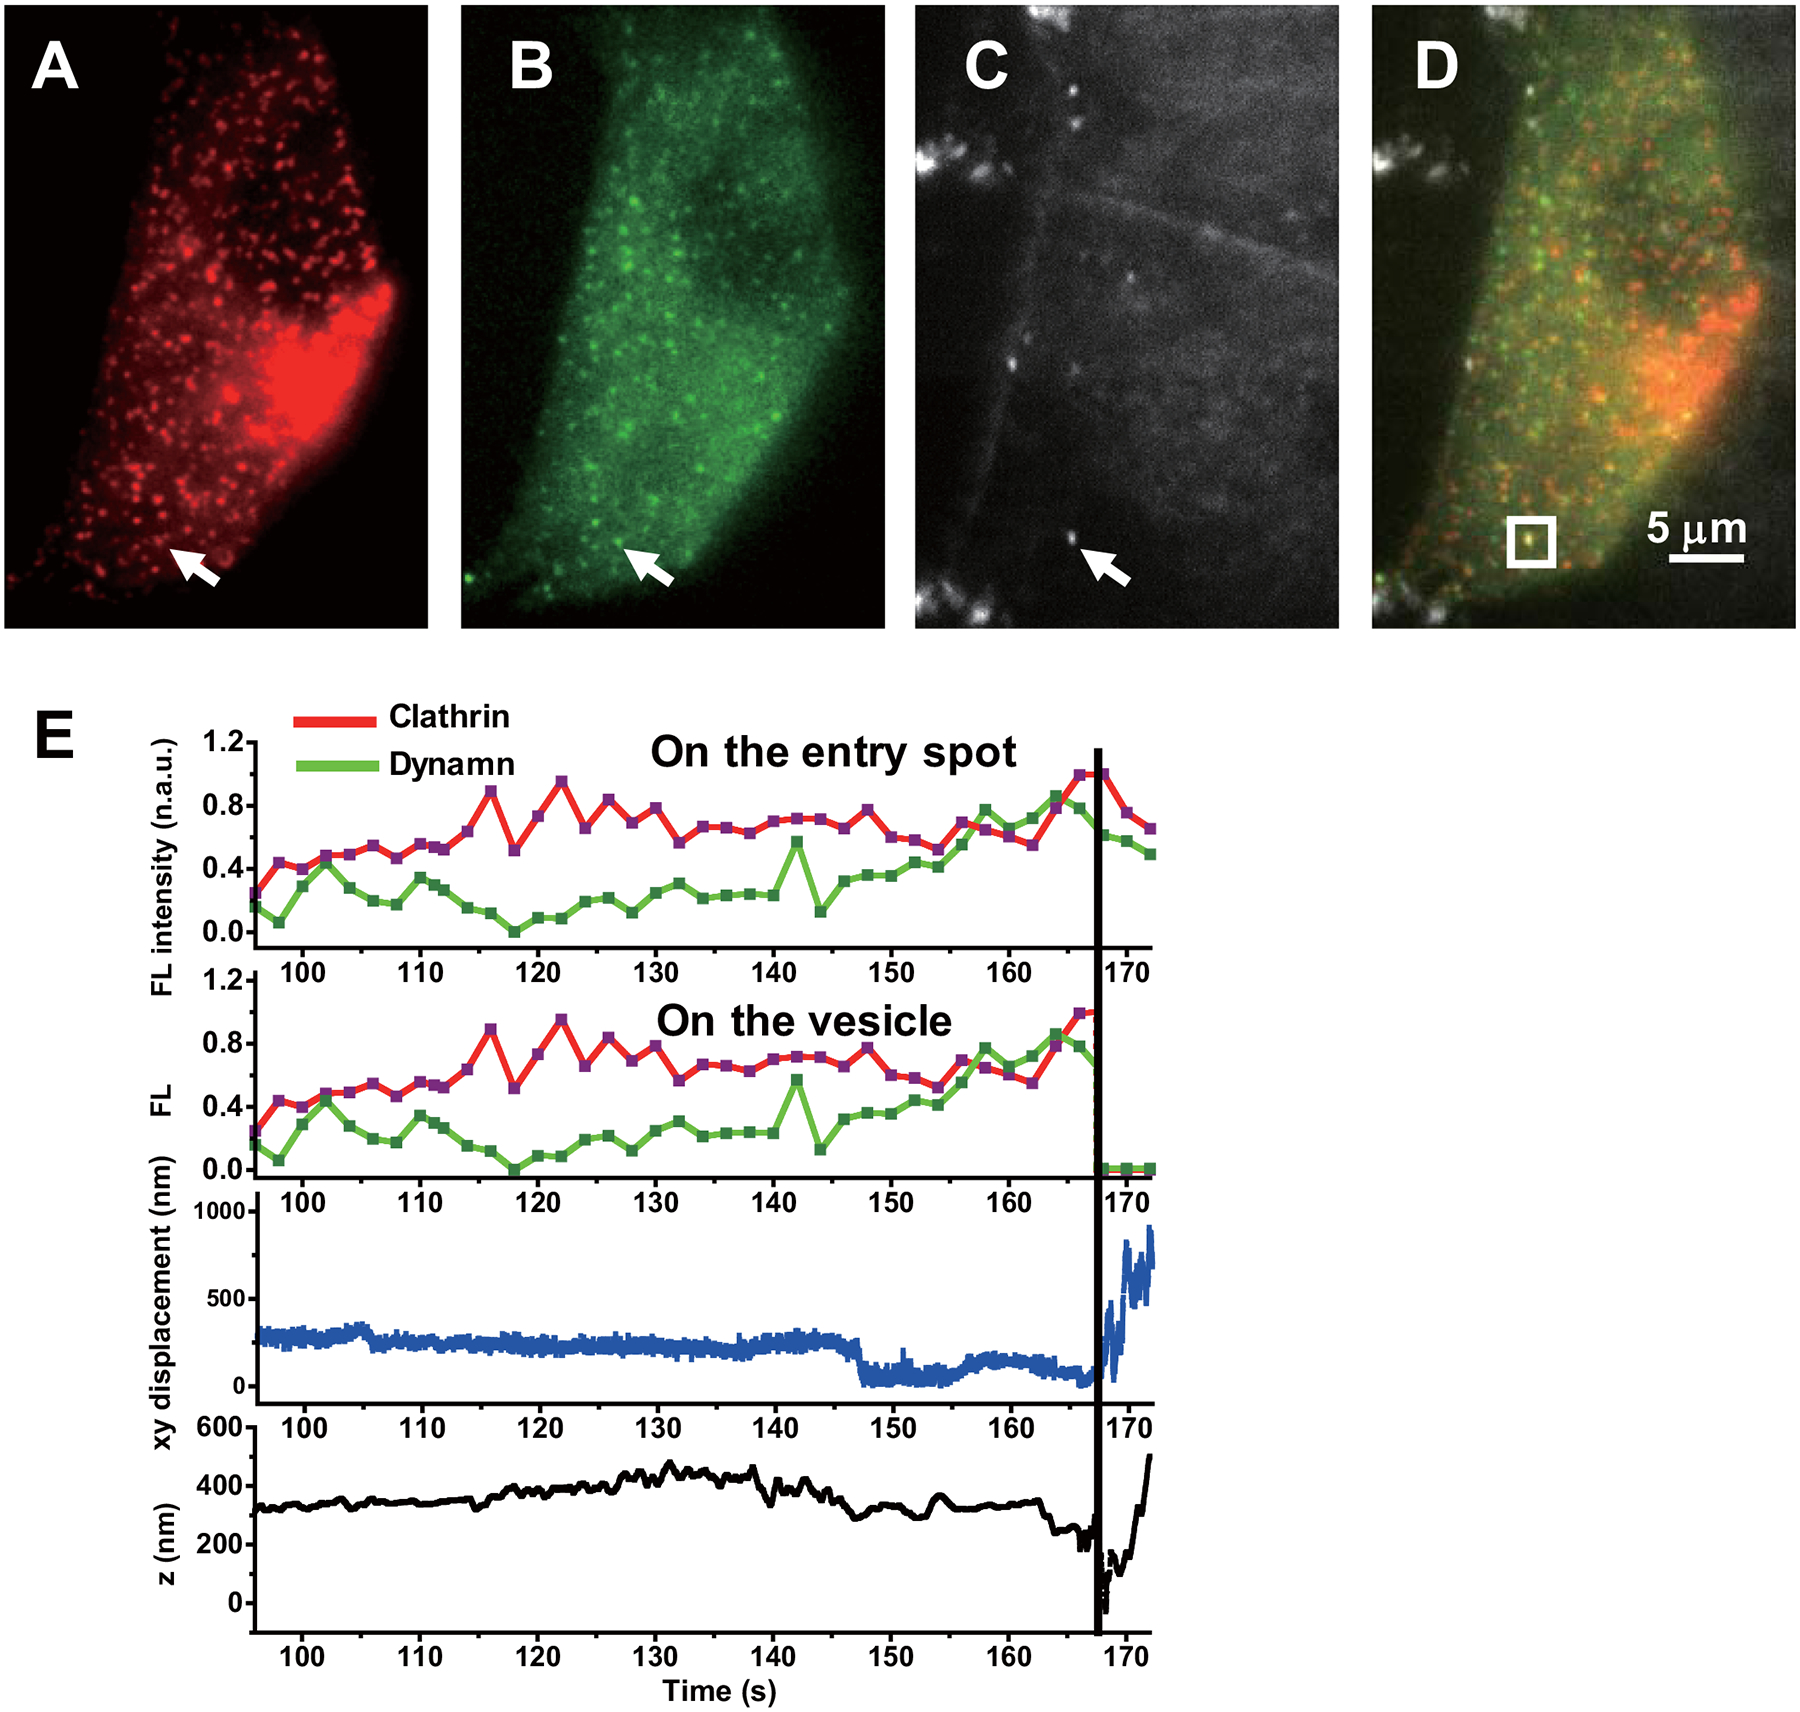
(A) Clathrin channel. (B) Dynamin channel. (C) Focused scattering channel for AuNRs. (D) Overlapped images. (E) Time evolution of clathrin and dynamin fluorescence on the entry spot, clathrin and dynamin fluorescence on the vesicle, the xy-, and the z-displacement of the particle from the entry spot during an endocytosis event. The dashed line indicates the time of fission point. The experiments have been performed 5 times and with similar results obtained.
Extended Data Fig. 6. A complete 3D trajectory, rotation information, and dynamin fluorescence of an endocytosis event.
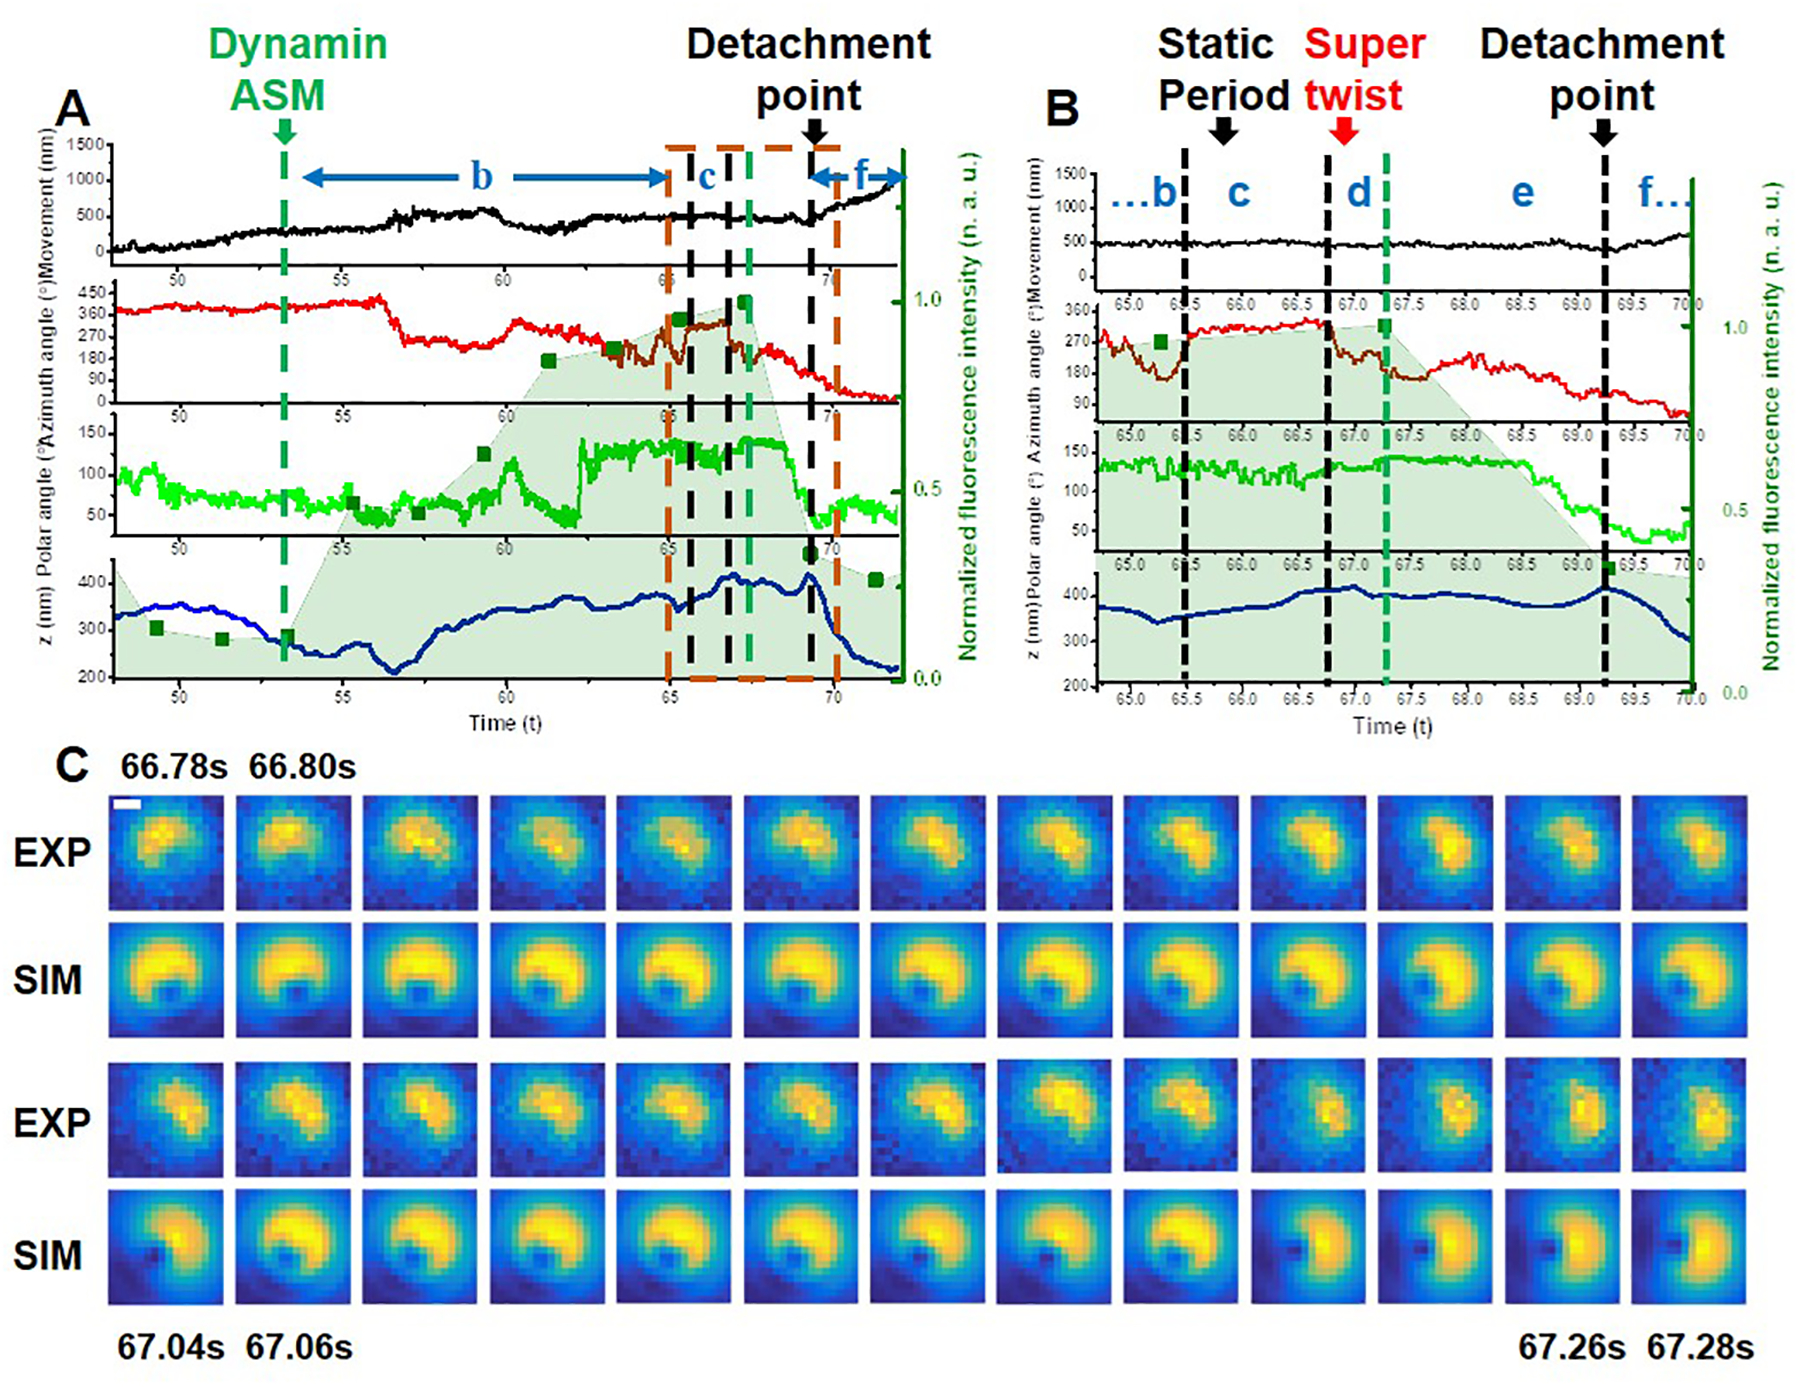
(A) The overlay of the time evolution of the cargo’s xy-, z-displacements, rotational azimuth and polar angles, and dynamin fluorescence in the background, respectively. Labels b, c, d, e and f represent various steps during the endocytosis. (B) Expanded time window near the fission point (orange frame) in (A). (C) Cargo’s defocused image patterns showing the “super twist” at Stag d. The scale bar is 500 nm. The experiments have been performed 45 times, with similar results obtained.
Extended Data Fig. 7. More examples of complete endocytosis events.
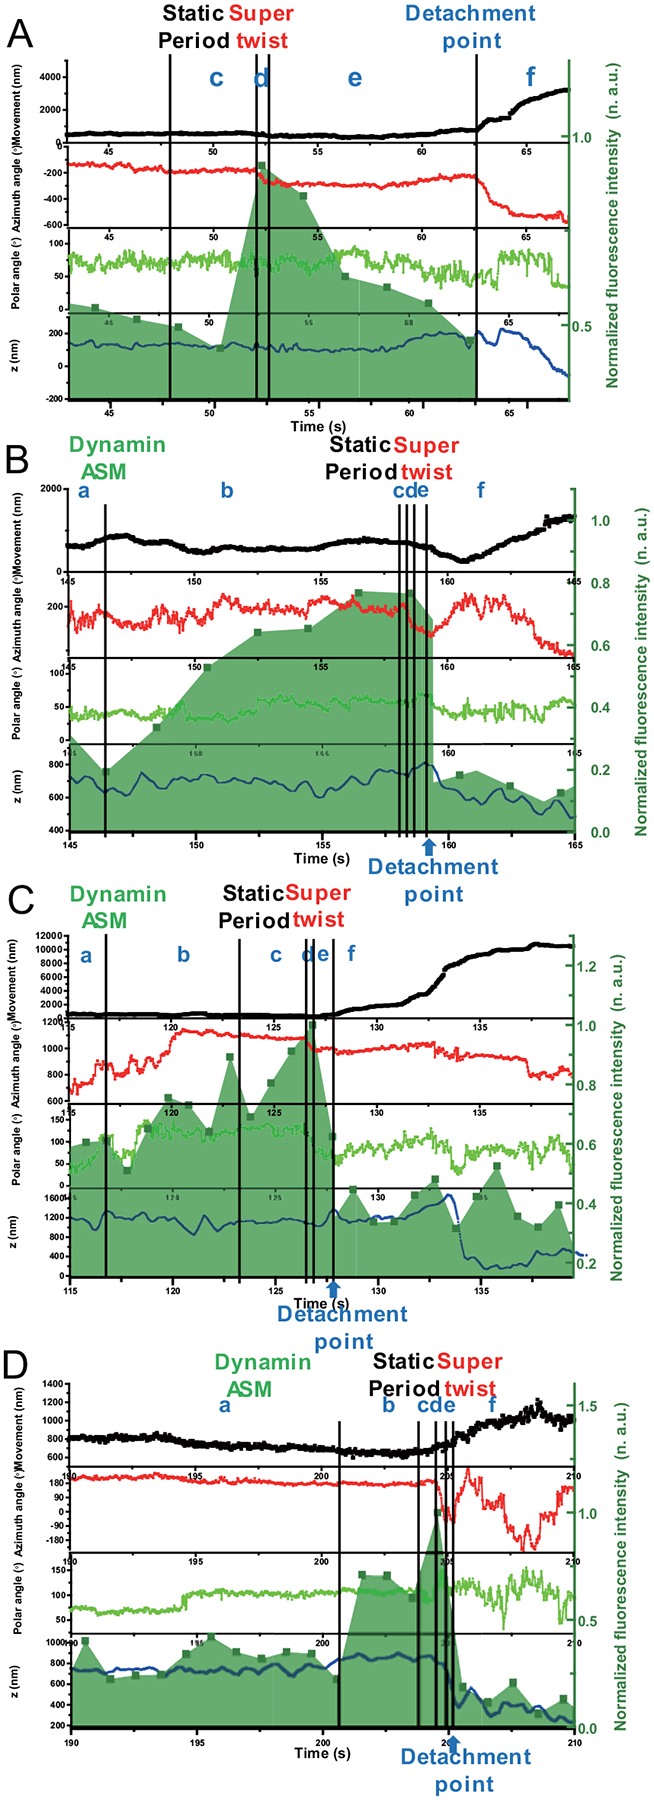
(A) Example 1, (B) Example 2, (C) Example 3 and (D) Example 4. The overlay of the time evolution of the cargo’s xy-, z-displacements, rotational azimuth and polar angles, and dynamin fluorescence in the background, respectively. Labels a, b, c, d, e, and f represent various stages during endocytosis.
Extended Data Fig. 8. An example of rotational tracking of a AuNR in Stage a.
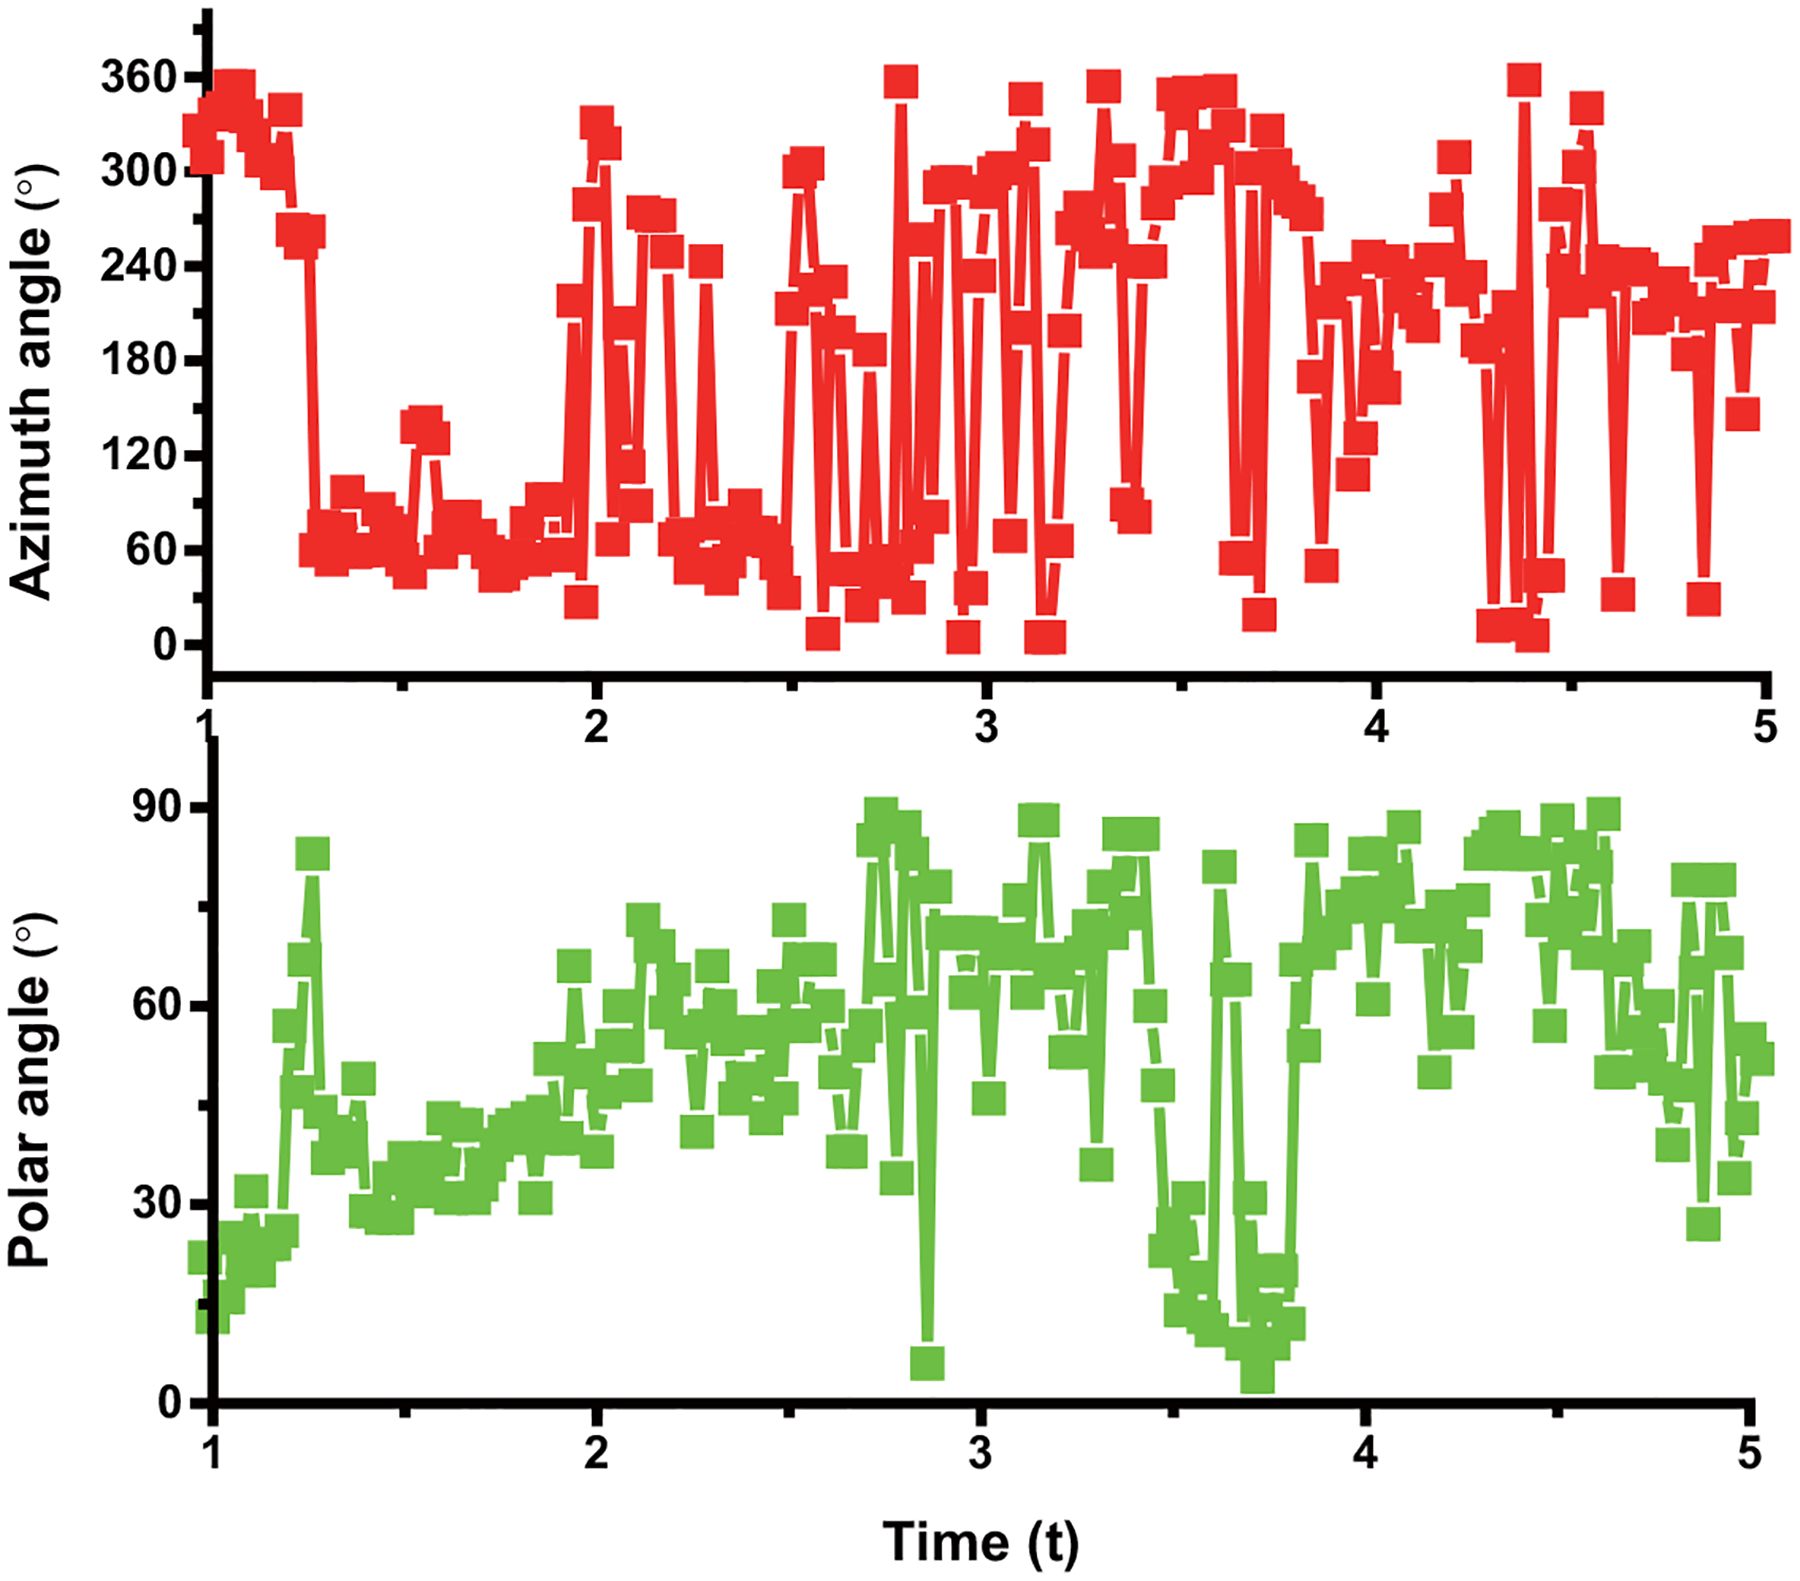
The overlay of the time evolution of the cargo rotational azimuth, and polar angles in stage a. The experiments have been performed 45 times and with similar results obtained.
Supplementary Material
Supplementary Video 1 An example of multi-dimensional images of a AuNR endocytosis. Red: Clathrin fluorescence. Green: Dynamin fluorescence. Gray: Scattering image of a AuNR. The white arrow indicates the overlaid point of clathrin channel, dynamin channel and AuNR scattering channel. Fluorescence images were acquired at 0.5 fps and played at real time. Scattering images were acquired at 50 fps and played at 50 fps. The scale bar is 5 μm.
Supplementary Video 2 An example of active rotation in Stage a. Movie was acquired at 50 fps and played at 100 fps. The scale bar is 3 μm.
Supplementary Video 3 Scattering images showing the static period and the super twists. Left: original defocused images. Right: reconstructed images using recovered azimuth and polar angles. movies were collected at 50 fps and played at 10 fps.
Supplementary Video 4 An additional example for scattering images showing the static period and the super twists. The description of left and right parts and movies collection and play rate are the same as those in Movie S3.
Supplementary Video 5 An additional example for scattering images showing the static period and the super twists. The description of left and right parts and movies collection and play rate are the same as those in Movie S3.
Acknowledgements
This work is supported by National Institution of Health (R01GM115763). X. C. acknowledges partial support from Science and Technology Projects of Innovation Laboratory for Sciences and Technologies of Energy Materials of Fujian Province (IKKEM) (RD2020050501). The authors greatly appreciate Dr. David Drubin giving gene-edited SK-MEL-2 cell line, and Dr. Sandra Schmid’s insightful comments and help during the completion of this manuscript.
Footnotes
Competing Interests
The authors declare no competing interests.
Contributor Information
Xiaodong Cheng, Department of Chemistry, Georgia State University, Atlanta, GA, USA, 30303.; State Key Laboratory of Physical Chemistry of Solid Surfaces, Innovation Laboratory for Sciences and Technologies of Energy Materials of Fujian Province (IKKEM), College of Chemistry and Chemical Engineering, Xiamen University, Xiamen, Fujian, China, 361005.
Kuangcai Chen, Department of Chemistry, Georgia State University, Atlanta, GA, USA, 30303..
Bin Dong, Department of Chemistry, Georgia State University, Atlanta, GA, USA, 30303..
Meek Yang, Department of Chemistry, Georgia State University, Atlanta, GA, USA, 30303..
Seth L. Filbrun, Department of Chemistry, Georgia State University, Atlanta, GA, USA, 30303.
Yong Myoung, Department of Chemistry, Georgia State University, Atlanta, GA, USA, 30303..
Teng-Xiang Huang, Department of Chemistry, Georgia State University, Atlanta, GA, USA, 30303..
Yan Gu, The Bristol-Myers Squibb Company, Devens, MA, USA, 01434..
Gufeng Wang, Department of Chemistry, Georgia State University, Atlanta, GA, USA, 30303..
Ning Fang, Department of Chemistry, Georgia State University, Atlanta, GA, USA, 30303.; State Key Laboratory of Physical Chemistry of Solid Surfaces, Innovation Laboratory for Sciences and Technologies of Energy Materials of Fujian Province (IKKEM), College of Chemistry and Chemical Engineering, Xiamen University, Xiamen, Fujian, China, 361005.
References
- 1.Ferguson SM & De Camilli P Dynamin, a membrane-remodelling GTPase. Nat. Rev. Mol. Cell Biol 13, 75–88 (2012). [DOI] [PMC free article] [PubMed] [Google Scholar]
- 2.Kamerkar SC, Kraus F, Sharpe AJ, Pucadyil TJ & Ryan MT Dynamin-related protein 1 has membrane constricting and severing abilities sufficient for mitochondrial and peroxisomal fission. Nat. Commun 9, 1–15 (2018). [DOI] [PMC free article] [PubMed] [Google Scholar]
- 3.Koirala S et al. Interchangeable adaptors regulate mitochondrial dynamin assembly for membrane scission. Proc. Natl. Acad. Sci. U.S.A 110, E1342–E1351 (2013). [DOI] [PMC free article] [PubMed] [Google Scholar]
- 4.Yamada H et al. Dynasore, a dynamin inhibitor, suppresses lamellipodia formation and cancer cell invasion by destabilizing actin filaments. Biochem, Biophys. Res. Commun 390, 1142–1148 (2009). [DOI] [PubMed] [Google Scholar]
- 5.Mettlen M, Chen P-H, Srinivasan S, Danuser G & Schmid SL Regulation of clathrin-mediated endocytosis. Annu. Rev. Biochem 87, 871–896 (2018). [DOI] [PMC free article] [PubMed] [Google Scholar]
- 6.Cocucci E, Gaudin R & Kirchhausen T Dynamin recruitment and membrane scission at the neck of a clathrin-coated pit. Mol. Biol. Cell 25, 3595–3609 (2014). [DOI] [PMC free article] [PubMed] [Google Scholar]
- 7.Sweitzer SM & Hinshaw JE Dynamin undergoes a GTP-dependent conformational change causing vesiculation. Cell 93, 1021–1029 (1998). [DOI] [PubMed] [Google Scholar]
- 8.Stowell MHB, Marks B, Wigge P & McMahon HT Nucleotide-dependent conformational changes in dynamin: evidence for a mechanochemical molecular spring. Nat. Cell Biol 1, 27–32 (1999). [DOI] [PubMed] [Google Scholar]
- 9.Roux A, Uyhazi K, Frost A & De Camilli P GTP-dependent twisting of dynamin implicates constriction and tension in membrane fission. Nature 441, 528–531 (2006). [DOI] [PubMed] [Google Scholar]
- 10.Antonny B et al. Membrane fission by dynamin: what we know and what we need to know. EMBO J 35, 2270–2284 (2016). [DOI] [PMC free article] [PubMed] [Google Scholar]
- 11.Liu Y-W, Mattila J-P & Schmid SL Dynamin-catalyzed membrane fission requires coordinated GTP hydrolysis. PLoS One 8, e55691 (2013). [DOI] [PMC free article] [PubMed] [Google Scholar]
- 12.Bashkirov PV et al. GTPase Cycle of Dynamin Is Coupled to Membrane Squeeze and Release, Leading to Spontaneous Fission. Cell 135, 1276–1286 (2008). [DOI] [PMC free article] [PubMed] [Google Scholar]
- 13.Pucadyil TJ & Schmid SL Real-Time Visualization of Dynamin-Catalyzed Membrane Fission and Vesicle Release. Cell 135, 1263–1275 (2008). [DOI] [PMC free article] [PubMed] [Google Scholar]
- 14.Shnyrova AV et al. Geometric Catalysis of Membrane Fission Driven by Flexible Dynamin Rings. Science 339, 1433–1436 (2013). [DOI] [PMC free article] [PubMed] [Google Scholar]
- 15.Mattila J-P et al. A hemi-fission intermediate links two mechanistically distinct stages of membrane fission. Nature 524, 109–113 (2015). [DOI] [PMC free article] [PubMed] [Google Scholar]
- 16.Schmid SL & Frolov VA Dynamin: Functional Design of a Membrane Fission Catalyst. Annu. Rev. Cell Dev. Biol 27, 79–105 (2011). [DOI] [PubMed] [Google Scholar]
- 17.Chappie JS et al. A Pseudoatomic Model of the Dynamin Polymer Identifies a Hydrolysis-Dependent Powerstroke. Cell 147, 209–222 (2011). [DOI] [PMC free article] [PubMed] [Google Scholar]
- 18.Srinivasan S, Dharmarajan V, Reed DK, Griffin PR & Schmid SL Identification and function of conformational dynamics in the multidomain GTPase dynamin. EMBO J 35, 443–457 (2016). [DOI] [PMC free article] [PubMed] [Google Scholar]
- 19.Sundborger AC et al. A dynamin mutant defines a superconstricted prefission state. Cell Rep 8, 734–742 (2014). [DOI] [PMC free article] [PubMed] [Google Scholar]
- 20.Kozlovsky Y & Kozlov MM Membrane fission: Model for intermediate structures. Biophys. J 85, 85–96 (2003). [DOI] [PMC free article] [PubMed] [Google Scholar]
- 21.Morlot S et al. Membrane shape at the edge of the dynamin helix sets location and duration of the fission reaction. Cell 151, 619–629 (2012). [DOI] [PMC free article] [PubMed] [Google Scholar]
- 22.Colom A, Redondo-Morata L, Chiaruttini N, Roux A & Scheuring S Dynamic remodeling of the dynamin helix during membrane constriction. Proc. Natl. Acad. Sci. U.S.A 114, 5449–5454 (2017). [DOI] [PMC free article] [PubMed] [Google Scholar]
- 23.Pannuzzo M, McDargh ZA & Deserno M The role of scaffold reshaping and disassembly in dynamin driven membrane fission. Elife 7, e39441 (2018). [DOI] [PMC free article] [PubMed] [Google Scholar]
- 24.Takei K et al. Generation of coated intermediates of clathrin-mediated endocytosis on protein-free liposomes. Cell 94, 131–141 (1998). [DOI] [PubMed] [Google Scholar]
- 25.Takei K, Slepnev VI, Haucke V & De Camilli P Functional partnership between amphiphysin and dynamin in clathrin-mediated endocytosis. Nat. Cell Biol 1, 33–39 (1999). [DOI] [PubMed] [Google Scholar]
- 26.Danino D, Moon KH & Hinshaw JE Rapid constriction of lipid bilayers by the mechanochemical enzyme dynamin. J. Struct. Biol 147, 259–267 (2004). [DOI] [PubMed] [Google Scholar]
- 27.Zhang P & Hinshaw JE Three-dimensional reconstruction of dynamin in the constricted state. Nat. Cell Biol 3, 922–926 (2001). [DOI] [PubMed] [Google Scholar]
- 28.Kong L et al. Cryo-EM of the dynamin polymer assembled on lipid membrane. Nature 560, 258–262 (2018). [DOI] [PMC free article] [PubMed] [Google Scholar]
- 29.Willets KA & Van Duyne RP Localized surface plasmon resonance spectroscopy and sensing. Annu. Rev. Phys. Chem 58, 267–297 (2007). [DOI] [PubMed] [Google Scholar]
- 30.Cheng X et al. Resolving cargo-motor-track interactions with bifocal parallax single-particle tracking. Biophys. J 120, 1378–1386 (2021). [DOI] [PMC free article] [PubMed] [Google Scholar]
- 31.Qian ZM, Li H, Sun H & Ho K Targeted drug delivery via the transferrin receptor-mediated endocytosis pathway. Pharmacol. Rev 54, 561–587 (2002). [DOI] [PubMed] [Google Scholar]
- 32.Gu Y et al. Rotational dynamics of cargos at pauses during axonal transport. Nat. Commun 3.1, 1–8 (2012). [DOI] [PubMed] [Google Scholar]
- 33.Chen K et al. Characteristic rotational behaviors of rod-shaped cargo revealed by automated five-dimensional single particle tracking. Nat. Commun 8.1, 1–10 (2017). [DOI] [PMC free article] [PubMed] [Google Scholar]
- 34.Kaplan L, Ierokomos A, Chowdary P, Bryant Z & Cui B Rotation of endosomes demonstrates coordination of molecular motors during axonal transport. Sci. Adv 4.3, e1602170 (2018). [DOI] [PMC free article] [PubMed] [Google Scholar]
- 35.Cureton DK, Massol RH, Whelan SPJ & Kirchhausen T The Length of Vesicular Stomatitis Virus Particles Dictates a Need for Actin Assembly during Clathrin-Dependent Endocytosis. PLoS Pathog 6.9, e1001127 (2010). [DOI] [PMC free article] [PubMed] [Google Scholar]
- 36.Xiao L, Ha JW, Wei L, Wang G & Fang N Determining the full three-dimensional orientation of single anisotropic nanoparticles by differential interference contrast microscopy. Angew. Chem. Int 51, 7734–7738 (2012). [DOI] [PubMed] [Google Scholar]
- 37.Grassart A et al. Actin and dynamin2 dynamics and interplay during clathrin-mediated endocytosis. J. Cell Biol 205, 721–735 (2014). [DOI] [PMC free article] [PubMed] [Google Scholar]
- 38.Gu Y, Sun W, Wang G & Fang N Single particle orientation and rotation tracking discloses distinctive rotational dynamics of drug delivery vectors on live cell membranes. J. Am. Chem. Soc 133, 5720–5723 (2011). [DOI] [PubMed] [Google Scholar]
- 39.Gu Y et al. Revealing rotational modes of functionalized gold nanorods on live cell membranes. Small 9, 785–792 (2013). [DOI] [PubMed] [Google Scholar]
- 40.Taylor MJ, Perrais D & Merrifield CJ A High Precision Survey of the Molecular Dynamics of Mammalian Clathrin-Mediated Endocytosis. PLoS Biol 9.3, e1000604 (2011). [DOI] [PMC free article] [PubMed] [Google Scholar]
- 41.Merrifield CJ, Perrais D & Zenisek D Coupling between clathrin-coated-pit invagination, cortactin recruitment, and membrane scission observed in live cells. Cell 121, 593–606 (2005). [DOI] [PubMed] [Google Scholar]
- 42.Engqvist-Goldstein ÅE & Drubin DG Actin assembly and endocytosis: from yeast to mammals. Annu. Rev. Cell Dev. Biol 19, 287–332 (2003). [DOI] [PubMed] [Google Scholar]
- 43.Boulant S, Kural C, Zeeh J-C, Ubelmann F & Kirchhausen T Actin dynamics counteract membrane tension during clathrin-mediated endocytosis. Nat. Cell Biol 13, 1124–1131 (2011). [DOI] [PMC free article] [PubMed] [Google Scholar]
- 44.Kaksonen M & Roux A Mechanisms of clathrin-mediated endocytosis. Nat. Rev. Mol. Cell Biol 19.5, 313 (2018). [DOI] [PubMed] [Google Scholar]
- 45.Chen Y-J, Zhang P, Egelman EH & Hinshaw JE The stalk region of dynamin drives the constriction of dynamin tubes. Nat. Struct. Mol. Biol 11, 574–575 (2004). [DOI] [PubMed] [Google Scholar]
- 46.Chappie JS, Acharya S, Leonard M, Schmid SL & Dyda F G domain dimerization controls dynamin’s assembly-stimulated GTPase activity. Nature 465, 435–440 (2010). [DOI] [PMC free article] [PubMed] [Google Scholar]
- 47.Galli V, Sebastian R, Moutel S, Ecard J & Roux A Uncoupling of dynamin polymerization and GTPase activity revealed by the conformation-specific nanobody dynab. Elife 6, e25197 (2017). [DOI] [PMC free article] [PubMed] [Google Scholar]
- 48.Jimah JR & Hinshaw JE Structural Insights into the Mechanism of Dynamin Superfamily Proteins. Trends Cell Biol 29, 257–273 (2019). [DOI] [PMC free article] [PubMed] [Google Scholar]
- 49.Meinecke M et al. Cooperative Recruitment of Dynamin and BIN/Amphiphysin/Rvs (BAR) Domain-containing Proteins Leads to GTP-dependent Membrane Scission. J. Biol. Chem 288, 6651–6661 (2013). [DOI] [PMC free article] [PubMed] [Google Scholar]
- 50.Neumann S & Schmid SL Dual Role of BAR Domain-containing Proteins in Regulating Vesicle Release Catalyzed by the GTPase Dynamin-2. J. Biol. Chem 288, 25119–25128 (2013). [DOI] [PMC free article] [PubMed] [Google Scholar]
- 51.Daumke O, Roux A & Haucke V BAR domain scaffolds in dynamin-mediated membrane fission. Cell 156, 882–892 (2014). [DOI] [PubMed] [Google Scholar]
- 52.Haucke V & Kozlov MM Membrane remodeling in clathrin-mediated endocytosis. J. Cell Sci 131.17 (2018). [DOI] [PubMed] [Google Scholar]
- 53.Boucrot E et al. Membrane Fission Is Promoted by Insertion of Amphipathic Helices and Is Restricted by Crescent BAR Domains. Cell 149, 124–136 (2012). [DOI] [PMC free article] [PubMed] [Google Scholar]
- 54.Hohendahl A et al. Structural inhibition of dynamin-mediated membrane fission by endophilin. Elife 6, e26856 (2017). [DOI] [PMC free article] [PubMed] [Google Scholar]
- 55.Yoshida Y et al. The stimulatory action of amphiphysin on dynamin function is dependent on lipid bilayer curvature. EMBO J 23, 3483–3491 (2004). [DOI] [PMC free article] [PubMed] [Google Scholar]
Associated Data
This section collects any data citations, data availability statements, or supplementary materials included in this article.
Supplementary Materials
Supplementary Video 1 An example of multi-dimensional images of a AuNR endocytosis. Red: Clathrin fluorescence. Green: Dynamin fluorescence. Gray: Scattering image of a AuNR. The white arrow indicates the overlaid point of clathrin channel, dynamin channel and AuNR scattering channel. Fluorescence images were acquired at 0.5 fps and played at real time. Scattering images were acquired at 50 fps and played at 50 fps. The scale bar is 5 μm.
Supplementary Video 2 An example of active rotation in Stage a. Movie was acquired at 50 fps and played at 100 fps. The scale bar is 3 μm.
Supplementary Video 3 Scattering images showing the static period and the super twists. Left: original defocused images. Right: reconstructed images using recovered azimuth and polar angles. movies were collected at 50 fps and played at 10 fps.
Supplementary Video 4 An additional example for scattering images showing the static period and the super twists. The description of left and right parts and movies collection and play rate are the same as those in Movie S3.
Supplementary Video 5 An additional example for scattering images showing the static period and the super twists. The description of left and right parts and movies collection and play rate are the same as those in Movie S3.
Data Availability Statement
Source data for all figures have been uploaded. All other data supporting the findings of this study are available from the corresponding author on reasonable request.


