

Abstract
Aims:
Population pharmacokinetics (PK) and pharmacodynamics (PD) of tranexamic acid (TXA) have not been studied to prevent postpartum hemorrhage (PPH) in pregnant women. It is unclear which TXA dose assures sufficient PPH prevention. This study investigated population PK/PD of TXA in pregnant women who underwent cesarean delivery to determine the optimal prophylactic doses of TXA for future studies.
Methods:
We analyzed concentration (PK) and maximum lysis (PD) data from 30 pregnant women scheduled for cesarean delivery who received 5 mg/kg, 10 mg/kg, or 15 mg/kg of TXA intravenously, using population approach.
Results:
TXA PK was best described by a two-compartment model with first-order elimination and the following parameters: clearance (between-subject variability) of 9.4 L/hr (27.7%), central volume of 10.1 L (47.4%), inter-compartmental clearance of 22.4 L/hr (66.7%), peripheral volume of 14.0 L (13.1%), and additive error of 1.4 mg/L. The relationship between TXA concentration and maximum lysis was characterized by a sigmoid Emax model with baseline lysis of 97%, maximum inhibition of 89%, IC50 of 6.0 mg/L (65.3%), hill factor of 8.5 (86.3%), and additive error of 7.3%. Simulations demonstrated that 500 mg and 650 mg of TXA maintained therapeutic targets for 30 minutes and 1 hour respectively in 90% of patients.
Conclusion:
This is the first population PK and PD study of TXA in pregnant women undergoing cesarean delivery. Our analysis suggests that a 650 mg dose provides adequate PPH prophylaxis up to 1 hour, which is less than the currently used 1000 mg of TXA in pregnant women.
Keywords: post-partum hemorrhage, prophylaxis, TXA, population pharmacokinetics, population pharmacodynamics
Introduction
Postpartum hemorrhage (PPH) is an increasingly prevalent condition and leading cause of maternal mortality in the US.1 Tranexamic acid (TXA), an antifibrinolytic agent, significantly reduces PPH-related deaths in women administered TXA after the onset of PPH (risk ratio: 0.81). It is especially effective in women treated within 3 hours of giving birth (risk ratio: 0.69).2 As a result, in 2017 the World Health Organization recommended the early use of TXA for PPH treatment in addition to standard care.3
TXA is a synthetic lysine analog that was originally approved for reducing and preventing hemorrhage in patients with hemophilia during and following tooth exaction.4 Currently, TXA is widely used in various settings to reduce blood loss, including acute trauma, and in select cardiac, orthopedic, and obstetrical surgeries.5 TXA inhibits both plasminogen activation and plasmin activity, preventing the process that dissolves fibrin clots.6 Renal clearance is the major elimination pathway, with 95% of the dose found unchanged in urine.4
Despite its important role in blood conservation, the pharmacokinetics (PK) and pharmacodynamics (PD) of TXA are poorly characterized, especially in pregnant women. Since a consensus exposure-response relationship for TXA has not been established, current dosing strategies are not scientifically objective. Thus, TXA dosage regimens vary across clinical trials.5,7 Clinical pharmacology studies of TXA to determine optimal dosing regimens for pregnant women are especially important. That is because the PK and PD characteristics of TXA (i.e. clearance, volume of distribution) in pregnant women are likely to differ from non-pregnant population due to the profound anatomic and physiologic changes during pregnancy.8 Notably, given the thrombotic risk associated with pregnancy and cesarean delivery, a lower dose tailored specifically for prophylactic use of TXA in pregnant women may be feasible or needed.
Here, we characterized the PK of TXA in pregnant women and investigated the PK/PD relationship between TXA concentration and clot lysis using a population approach. Through simulations, we proposed TXA prophylactic doses for PPH that could be used in future studies. The models presented here provide the rationales for PK- and PD- evidenced dosing of TXA in pregnancy.
Methods
Study Population
This was a prospective, single-center, open-label, dose-ranging study that recruited thirty pregnant women at The George Washington University from February 2018 to May 2019. Inclusion criteria were normal renal function (serum creatinine < 0.9 mg/dL), and greater than 34+0 weeks gestation age with planned cesarean delivery. Patients were excluded if they had a thromboembolic history or hypersensitivity to TXA (or any antifibrinolytic therapies). The study protocol was approved by the institutional review board (IRB# 041737), and written consent was obtained from each patient before entering the study.
Dosing and Blood Sampling
Thirty patients were treated sequentially: the first ten patients received 5 mg/kg of TXA, the second ten received 10 mg/kg of TXA, and the last ten received 15 mg/kg of TXA. Total body weight was used to calculate the actual doses, which were capped at 1000 mg. TXA (Cyklokapron®) was given intravenously at the time of umbilical cord clamping and was infused via an infusion pump for approximately 15 minutes (500 mL/hour of 110 mL volume).
Maternal blood samples were collected from the opposite arm of drug administration through peripheral venous catheters or separate venous blood draws. Three samples per patient were taken at each sample time, including pre-drug, 10 minutes, 30–60 minutes, 1.5–3 hours, 4–6 hours, 7–8 hours, and 24 hours post end-of-infusion. One of the three samples for PK analysis was drawn into a tube containing potassium ethylenediaminetetraacetic acid (Becton Dickinson Vacutainer tubes, K2 EDTA 7·2 mg). This sample was further centrifuged at 3000 ×g for 15 minutes to obtain platelet-poor plasma. The other two samples for PD analysis were drawn into tubes coated with sodium citrate (Becton Dickinson Vacutainer tubes, Na Citrate 0·109 M, 3·2%). Samples were stored on dry ice until further analysis.
Biomarkers and covariates
TXA concentration determined by ultra-high-performance liquid chromatography-tandem mass spectrometry was used as the PK metric. A modified rotational thromboelastometry (ROTEM) analysis9 was used to quantify the anti-fibrinolysis effect of TXA. Maximum lysis (ML), the proportion of clot lysed from the maximum clot (range 0–100%), was chosen as the PD marker to reflect the lysis potential of a formed clot.10 Briefly, clotting was initiated with tissue factor and recalcification in the presence of exogenous recombinant tissue plasminogen activator, as described.11 The bioanalysis details regarding TXA concentration and ML measurements are published elsewhere.11
Patient-specific routine clinical data were obtained from the electronic medical record. Demographic data included age, height, weight, and BMI. Pre-delivery laboratory data included serum creatinine level (Scr), platelet count, and hematocrit level. Cockcroft-Gault12 equation was used to estimate creatinine clearance (CrCl). Patient comorbidities (diabetes and hypertension) were also recorded.
Data Analysis
The population approach was adopted using Pumas v1.0.5 (www.pumas.ai).13 Non-linear mixed effects modeling with first-order conditional estimation with interaction approach was applied to characterize TXA concentration and its effect on ML. Models were built hierarchically: a base model containing a structural component and a variability component was determined first, followed by the exploration of covariate models to explain the variability in the parameters. The graphic presentation of the data and output was performed using R (version 4.0.2)14 and ggplot2 (version 3.0.0).15
Pharmacokinetic modeling
Base model development:
One-compartment and two-compartment models with first-order elimination from the central compartment were explored and compared. One-compartment models were parameterized by clearance (CL) and central volume of distribution (Vc). Additional parameters including inter-compartmental clearance (Q) and peripheral volume of distribution (Vt) were used to parametrize the two-compartment models. Between subject variability (BSV) in all the PK parameters was assumed to be log-normally distributed as shown in Equation 1, where Pi denotes the individual parameter, tvP denotes the population typical parameter and ηi denotes the patient-specific deviation from the population parameters that follows a normal distribution with 0 as mean, ɷ2 as variance.
| Equation 1 |
Different residual error models were also tested to account for the unexplained residual variability between observations and model predictions, including additive, proportional and combined (both additive and proportional) models. Equation 2 shows the formula of the combined error model. OBSi,j and IPREDi,j are the observation and prediction for the ith patient at time j. The difference between these two variables was characterized by a proportional error term and an additive error term that follow normal distributions with mean at 0 and variance at .
| Equation 2 |
Covariate model development:
Covariate models were tested to leverage patient-specific covariates to explain the variability in parameters. Potential relationships were assessed from the graphical diagnosis first. Body weight was included in the model using allometric scaling to reflect the impact of organ size on PK. Given the hydrophilic properties of TXA, lean body mass (LBM) calculated by Boer equation16 was used in the allometry function to compare with total body weight. To explain clearance variability resulting from different levels of kidney functions, kidney function related covariates (Scr, CrCl) were tested upon clearance using a power function.
The final model was chosen based on statistical diagnosis and graphical diagnosis. A model was determined to be significantly better if it reduced the objective function value (OFV) by more than 3.84 units (P < 0.05, for 1 degree of freedom). Covariates included in the final model are physiological or mechanistically relevant, and can explain the parameter variability significantly compared to the base model.
Pharmacodynamic modeling
A sequential population approach was used to perform the TXA concentration-ML analysis. This standard approach has been used previously.17 Briefly, first the PK model was developed, and the individual predicted concentrations from the final PK model were used as an independent variable for the PD modeling. Due to the ex vivo characteristics of the ML bioassay, only direct effect models are reasonable. As shown in Equation 3, the PD model was parameterized in terms of baseline ML (ML0), maximal fractional inhibition (Imax), concentration of TXA causing 50% of maximal fractional inhibition (IC50), and hill factor (γ). Variabilities of all the parameters were assumed to be log-normally distributed. Different error models were evaluated and compared to account for the random residual variability. The effect of covariates on PD parameters was evaluated in the same manner as for PK parameters.
| Equation 3 |
Model Evaluation
Five-hundred bootstrap samples, each containing 30 patients, were generated by randomly sampling with replacement from the original dataset. Final PK and PD models from previous steps were used to re-estimate the parameters for the 500 bootstrap samples. Subsequently, the 95% confidence interval of the bootstrap results was calculated.
Simulations to derive optimal dosing
In vitro studies have found that 10 mg/L of TXA is required to obtain 80% inhibition of fibrinolysis; thus, 10 mg/L was chosen as the PK therapeutic target.18,19 Based on data obtained from women after non-hemorrhagic deliveries, the normal reference of maximum lysis 17% was chosen as the PD therapeutic target.20 Individual TXA concentration and ML were simulated using a dose range of 100–1000 mg. The post-hoc individual parameters from the final PK and PD models were employed for the simulations. The proportion of patients who met the PK or the PD targets were determined for each dosing regimen.
Results
Demographics of Patients
A total of 30 patients completed the PK and PD assessments of TXA, resulting in 174 observations for model building. Patient demographics are presented in Table 1. Patients had body weight range 59.5–147.5 kg and BMI range 23.2–55.8 kg/m2. Twelve (40%) had BMI within the range of 30–40 kg/m2 and seven (23.3%) had BMI above 40 kg/m2. All patients had normal kidney function with Scr level 33.6–60.1 μmol/L. Those with and without comorbidities had similar Scr values. Creatinine clearance, calculated by Cockcroft-Gault equation, had a median at 225.3 mL/min (132.1–397.0 mL/min). Previous studies reported that the average absolute GFR of healthy pregnant women remains at 150 mL/min from the first trimester until delivery21,22, indicating that the calculated CrCl clearly overestimated GFR in pregnancy; thus, creatinine clearance levels were capped at 150 mL/min in this study. After capping, twenty-nine (96.7%) patients had CrCl at 150 mL/min, and one patient (3.3%) at 132.1 mL/min.
Table 1.
Dosing and Patient Demographics
| Cohorts | Number of Patients | Median Dose (mg) | Dose Range (mg) |
|---|---|---|---|
| 5 mg/kg group | 10 | 416.2 | 347 – 632.8 |
| 10 mg/kg group | 10 | 853.6 | 595.1 – 1022.9 |
| 15 mg/kg group | 10 | 1000 | 1000 – 1000 |
| Overall | 30 |
| Variables | Units | Median | Min | Max |
|---|---|---|---|---|
| Age | years | 32 | 23 | 41 |
| Weight | kg | 86.5 | 59.5 | 147.5 |
| Lean body mass (LBM) 1 | kg | 52.6 | 40.1 | 66.4 |
| Height | cm | 162.6 | 149.9 | 182.9 |
| BMI | kg/m2 | 31.2 | 23.2 | 55.8 |
| Serum creatinine (scr) | μmol/L | 44.2 | 33.6 | 60.1 |
| Creatinine clearance (CrCl) 2 | mL/min | 225.3 | 132.1 | 397.0 |
| Creatinine clearance cap (CrCl_cap) 3 | mL/min | 150 | 132.1 | 150 |
| Hematocrit | % | 34 | 27.3 | 41.9 |
| Platelets | Count; x103 | 210 | 93 | 408 |
| Diabetes | ||||
| Yes | Count | 9 (30%) | ||
| No | Count | 21 (70%) | ||
| Races | ||||
| African American | Count | 16 (54%) | ||
| White/Caucasian | Count | 12 (40%) | ||
| Asian | Count | 1 (3%) | ||
| Other | Count | 1 (3%) | ||
| Ethnicity | ||||
| Hispanic/Latino | Count | 2 (7%) | ||
| Non-Hispanic/Latino | Count | 28 (93%) | ||
Lean body mass is calculated by Boer formula
Creatinine clearance is calculated by Cockcroft-Gault equation using actual body weight.
Creatinine clearance is being capped at 150 mL/min.
Exploratory analysis
Figure 1 displays the individual and mean (geometric mean) PK profiles for each cohort. Since patients received different doses due to different body weights, concentrations shown in Figure 1 were normalized to 70 kg to compare between cohorts. On average, TXA concentration was dose-proportional. Maximum concentrations of 15–35 mg/L were achieved 30 minutes after the infusion started. Subsequently, concentrations declined rapidly for the first hour, followed by a shallower decline until 8 hours, at which time more than 90% of TXA was eliminated. The biphasic profile indicates the two-compartment disposition of TXA. Individual profiles had similar trends, except one individual in 15 mg/kg cohort had distinctive PK profiles with the last sample concentration of 1.95 mg/L while the average was 0.26 mg/L. The reason for this is unknown.
Figure 1. PK exploratory profiles.
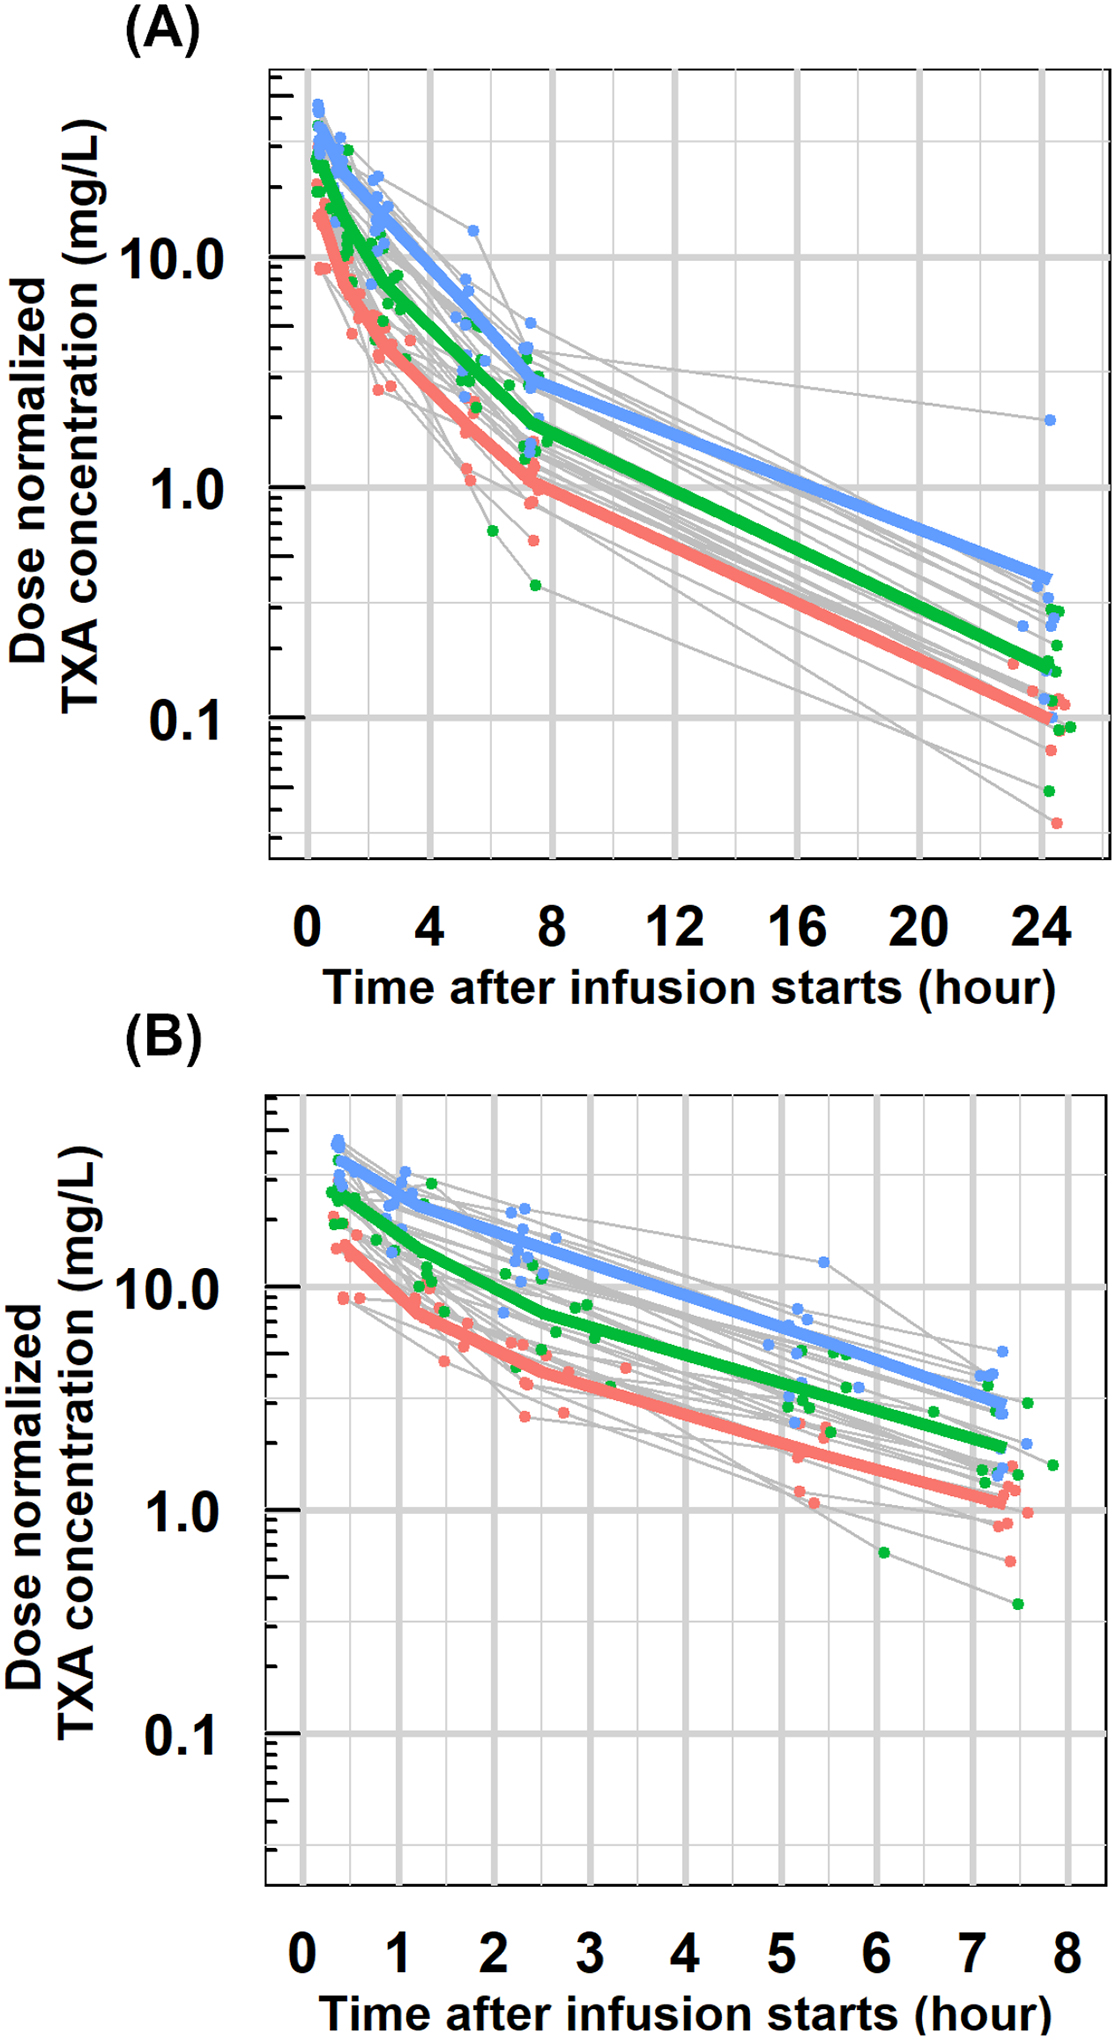
Individual dose-normalized concentration-time profiles with geometric mean profiles for each dose cohort (5mg/kg: red; 10 mg/kg: green; 15 mg/kg: blue) in semi-logarithm scale for the whole PK assessment (A) and the first eight hours after administration (B). All concentrations were normalized to 70 kg using actual concentration divided by dose (in mg) and then multiplied by 350 mg (for 5 mg/kg cohort) or 700 mg (for 10 mg/kg cohort) or 1000 mg (for 15 mg/kg cohort).
Figure 2 shows the individual and mean (geometric mean) profiles of ML-time and ML- concentration. Overall, individual PD profiles exhibited more variability than that of PK. Mean ML-time profiles from the three cohorts are highly overlapping for the first 4 hours with ML nadir around 10% achieved at 30 minutes and then returned to about 50% at 4 hours post-infusion. As shown in Figure 2(B), TXA effects on ML were dependent on TXA plasma concentrations in a non-linear relationship. The clinical efficacy and safety outcomes of this study are reported elsewhere.11
Figure 2. PD exploratory profiles.
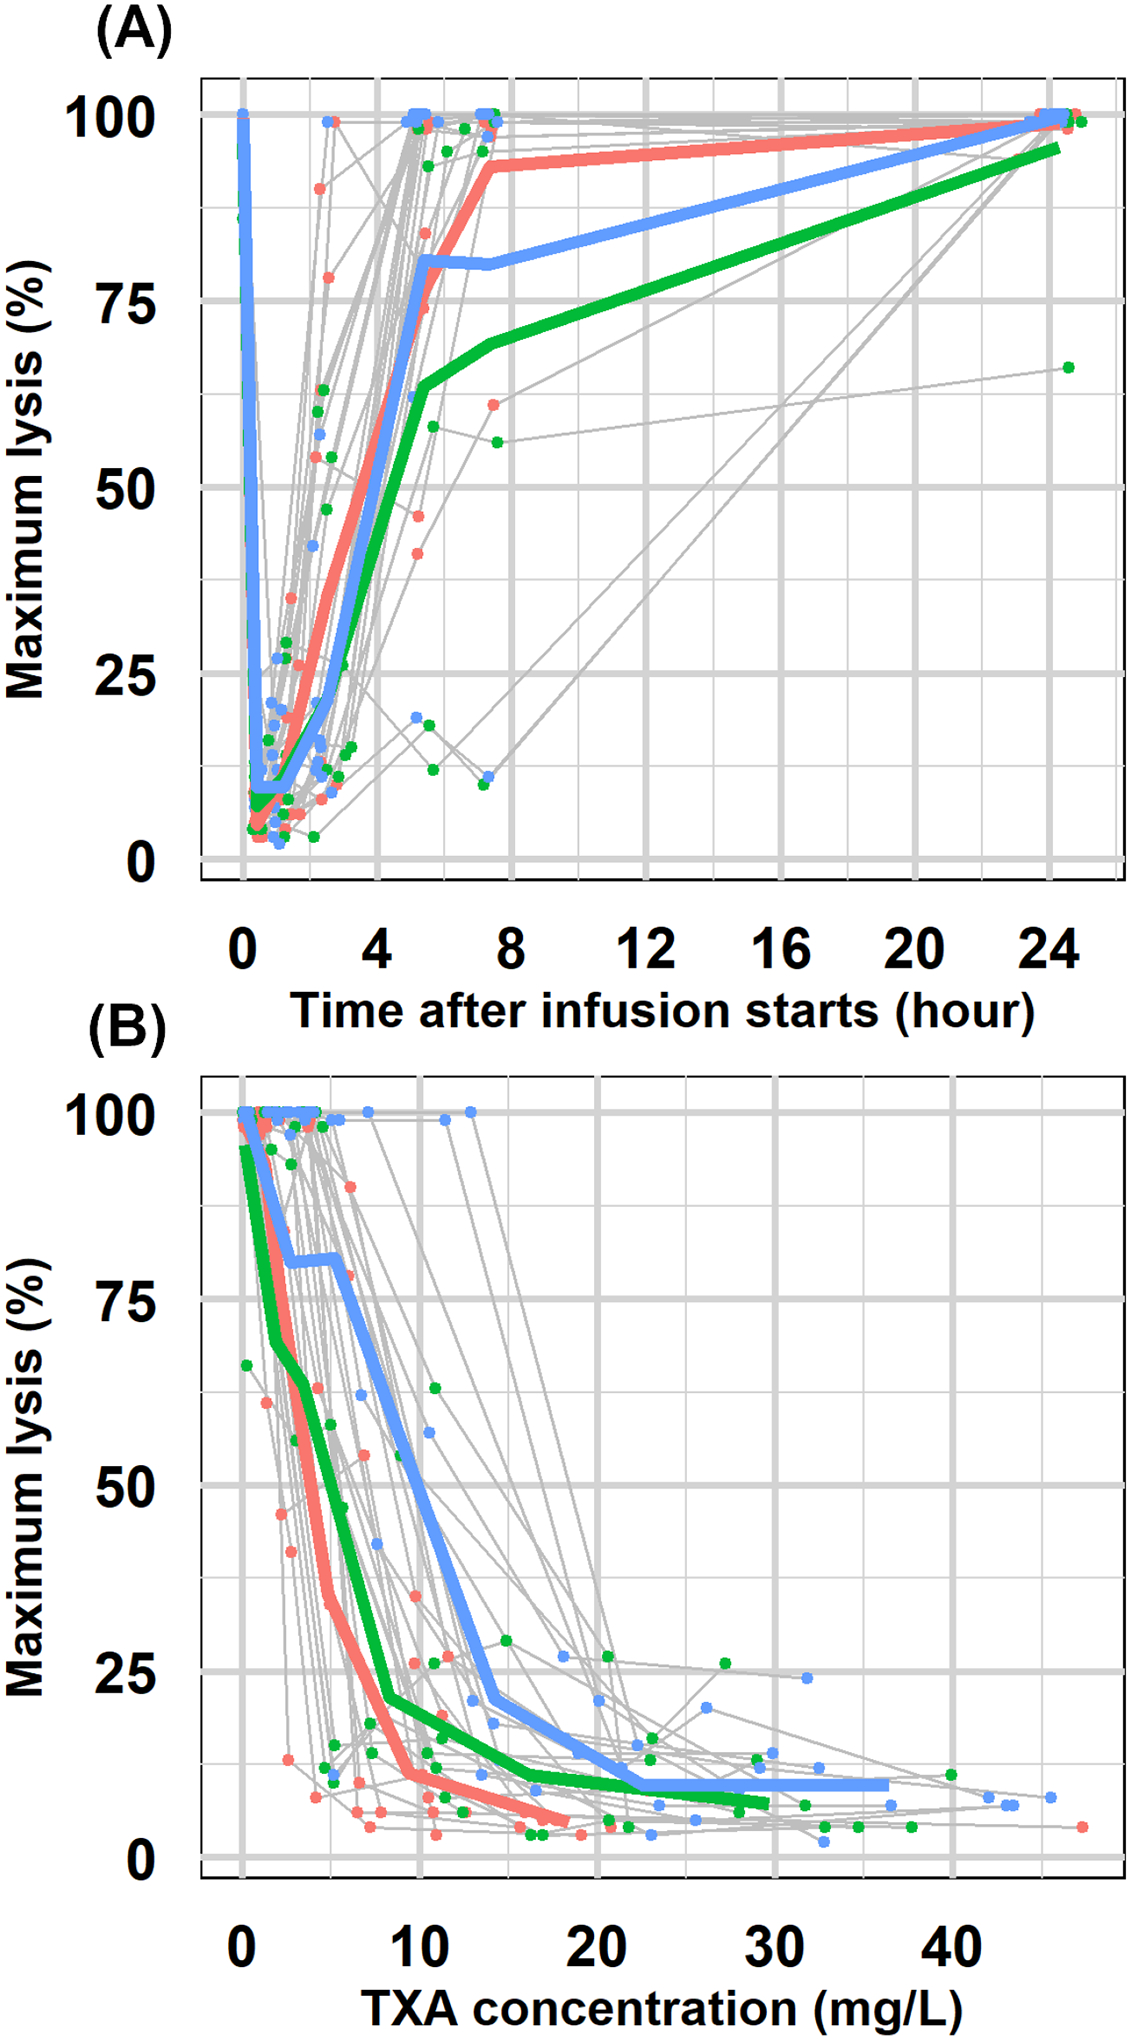
(A)Individual maximum lysis-time profiles with geometric mean profiles for each cohort (5mg/kg: red; 10 mg/kg: green; 15 mg/kg: blue). (B) Individual maximum lysis -concentration profiles with geometric mean profiles for each cohort (5mg/kg: red; 10 mg/kg: green; 15 mg/kg: blue).
By exploring the correlation between patient-specific covariates, only weight-derived metrics (LBM and BMI) exhibited high correlations with body weight. The other continuous covariates did not show significant correlations with each other (Supplemental Figure S1).
Pharmacokinetic modeling
Compared to a one-compartment model, a two-compartment model reduced the objective function value by about 200 units, which is in agreement with the biexponential disposition shown in Figure 1. A two-compartment model was deemed as the best structural model. Compared with other residue error models, an additive error model provided the best fitting evidenced by the close alignment of the predictions and the observations on the identity line (Supplemental Figure S2). Even though proportional error and combined error offered 239 units lower OFV, the predictions were not as good as those of the additive error model. Visually checking the individual predictions showed that the additive error model more accurately predicted high concentrations. The proportional/combined error models more accurately predicted low concentrations, but underpredicted high concentrations (Supplemental Figure S2(D)). The underprediction is because Vc was estimated to be as high as 21 L in the proportional/combined error models compared to 10 L in the additive error model. In this study, high concentrations after infusion were used to project the optimal doses instead of low concentrations at the end of the PK assessment, making an accurate prediction for high concentrations more important. Therefore, the additive residual error model was chosen over the proportional/combined error models. A two-compartment model with an additive residual error model was considered as the base PK model. Parameter estimates and corresponding variability of the base model are listed in Table 2.
Table 2.
PK model parameter estimates
| Final PK model | Bootstrap | |||
|---|---|---|---|---|
| Parameter | Estimates | BSV in CV% [shrinkage] |
Estimates | 95% confidence interval |
| CL (L/hr) | 9.4 | 27.7% [0.08] |
9.4 | 7.8 – 10.4 |
| Vc (L) | 10.1 | 47.4% [0.29] |
10.1 | 2.8 – 13.6 |
| Q (L/hr) | 22.4 | 66.7% [0.15] |
22.4 | 12.7 – 30.0 |
| Vt (L) | 14.0 | 13.1% [0.49] |
14.0 | 11.0 – 16.5 |
|
Additive error σ (mg/L)
[shrinkage] |
1.3 [0.22] |
1.3 | ||
The individual post-hoc PK parameters for the base PK model were plotted with patient-specific covariates to explore their potential relationships (Supplemental Figure S3). In general, trends were not obvious. Specifically, individual clearance (CLi) correlated weakly with weight-related metrics (body weight, LBM, BMI), age, and serum creatinine. (Supplemental Figure S3(A)) Similarly, the individual central and peripheral volume of distribution (Vci, Vti) correlated with weight-related metrics (Supplemental Figure S3 (B, D)). Including these covariates in the base PK model resulted in lower OFV and reduced variability (Supplemental Table S1). Body weight explained the variability of CL by 10% (from 27.5% to 24.8%) and reduced OFV by 7 units. LBM explained the variability of Vc by 6% (from 46.5% to 43.7%) and reduced OFV by 7 units. Other covariates either did not improve further or induce instability to the base model, evidenced by completely different estimates and low variability (0.01%) of Vc. Given the limited improvement of the covariates, the base PK model (two-compartment, additive residue error, no covariates) was chosen as the final PK model.
Bootstrap results for the final PK model are listed in Table 2. The final PK model parameters were close to the median of the 500 times bootstrap estimates and inside the range of 95% confidence interval derived from bootstrap, indicating the stability of the final PK model. Representative individual plots are displayed in Figure 3(C) for patients with the lowest, median, and highest body weight. The close alignment between the prediction and observation indicated the accuracy of the models.
Figure 3. Goodness of fit plots for PK and PD models.
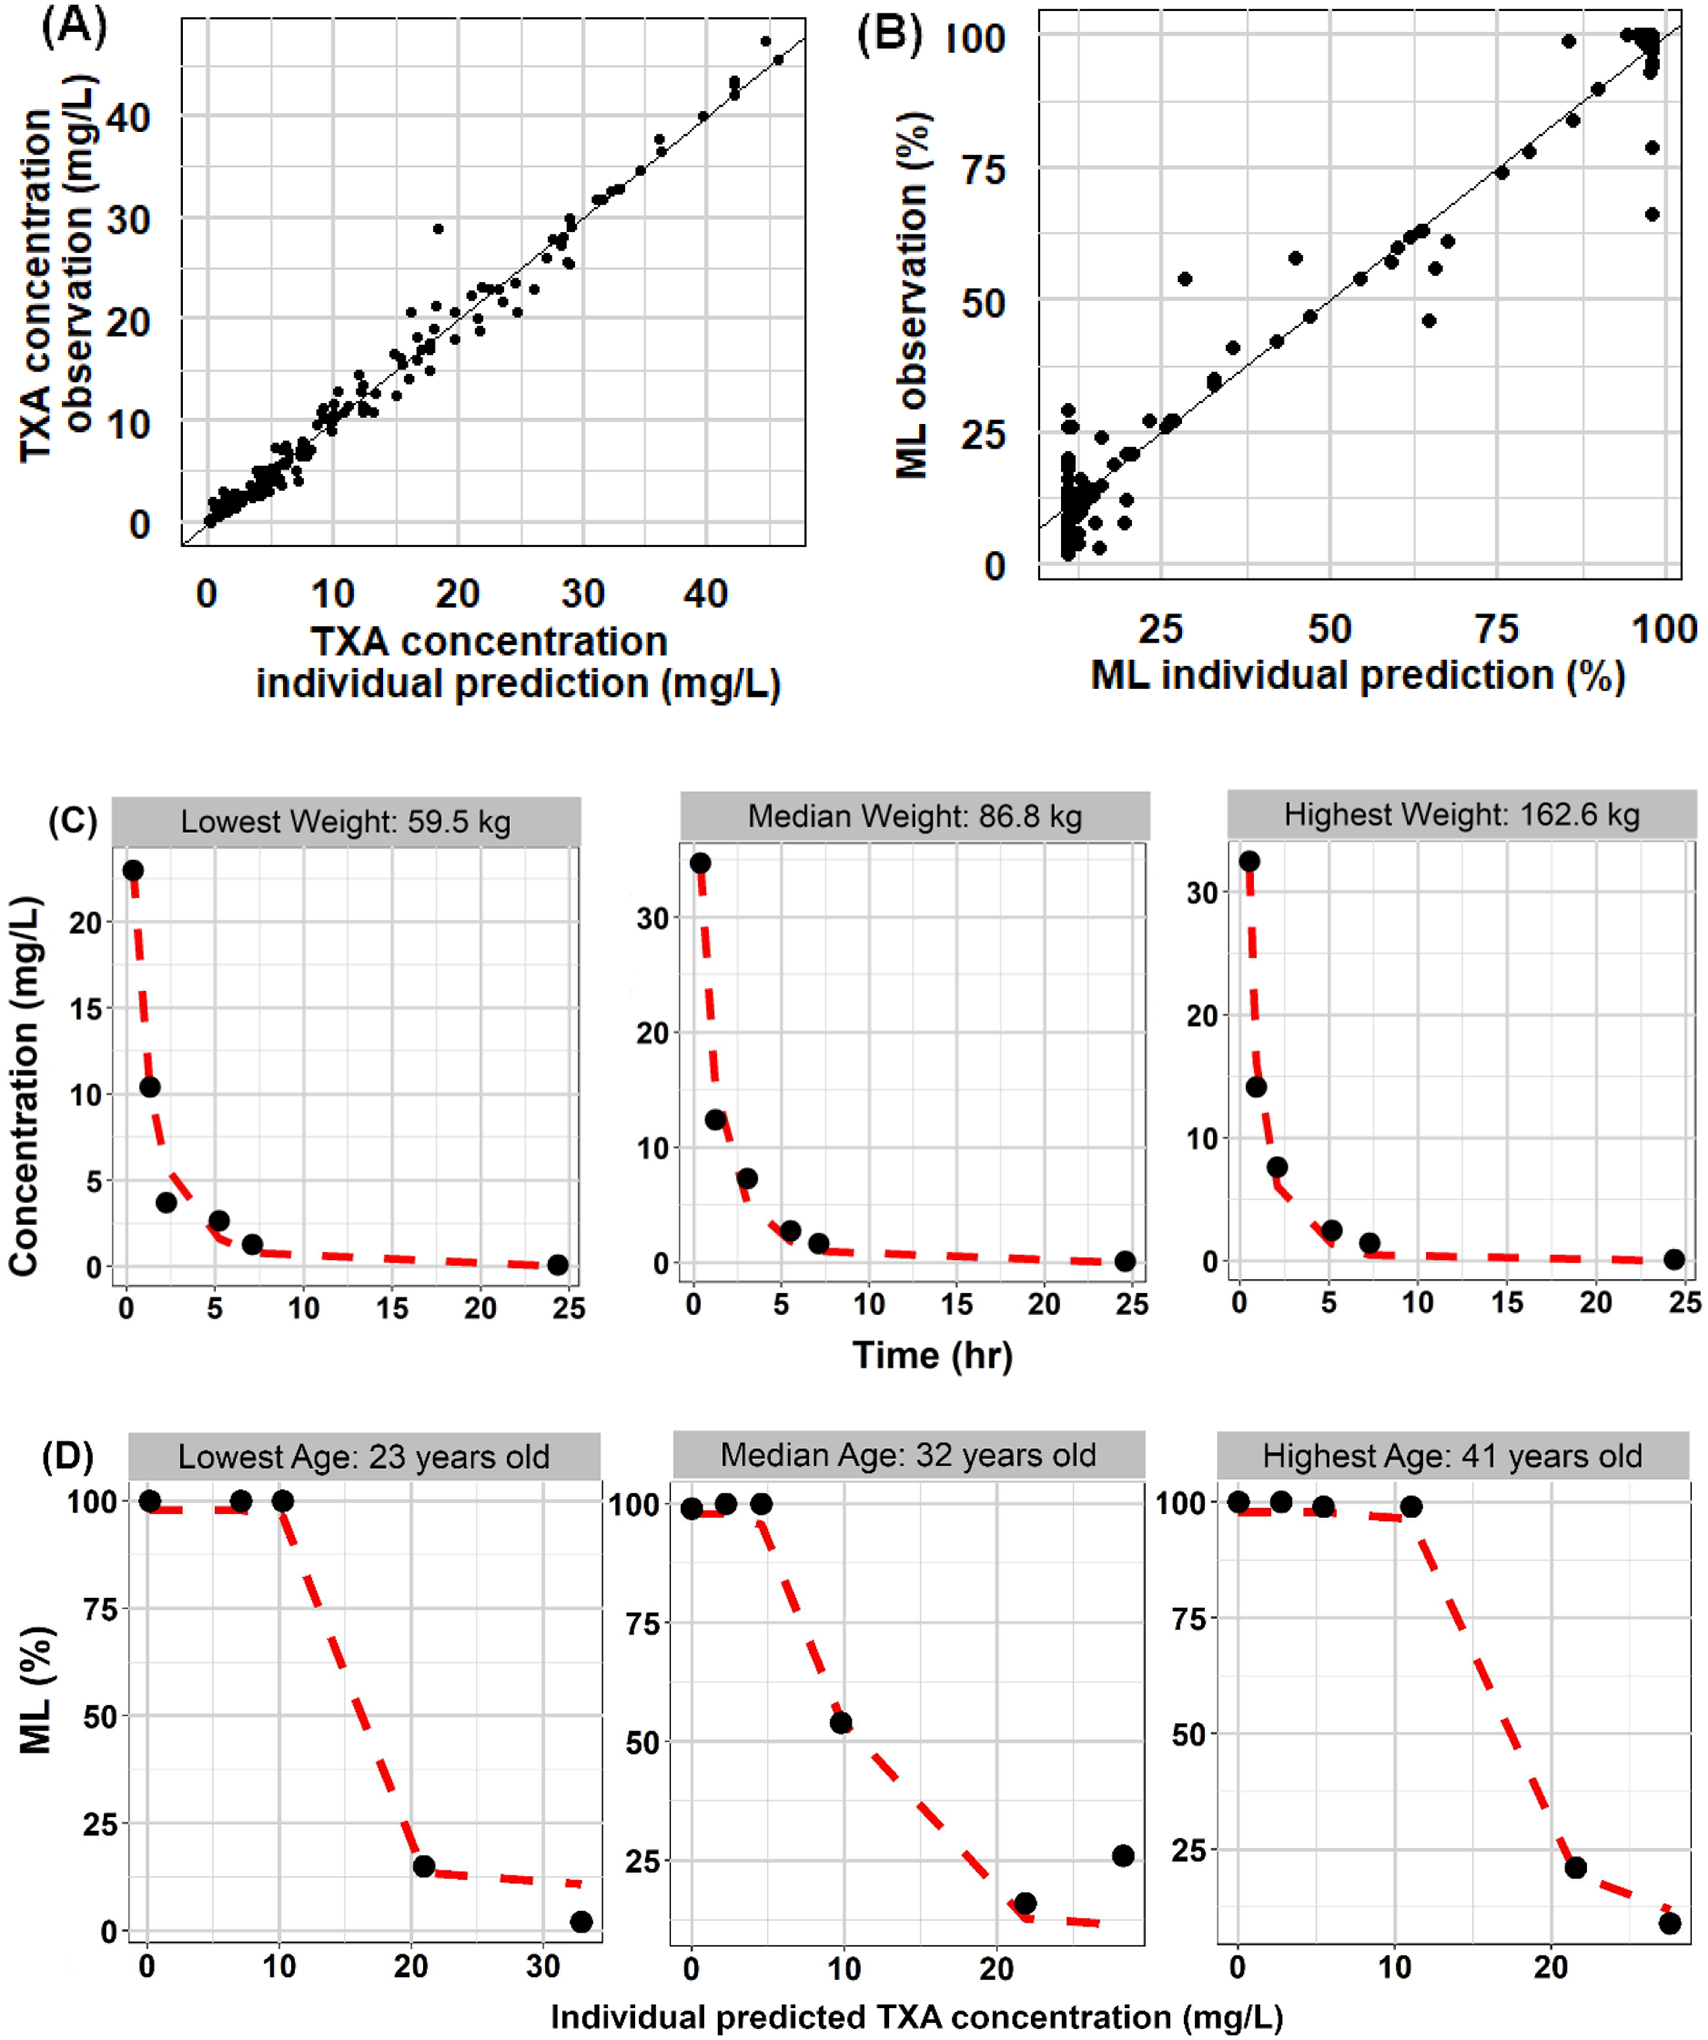
Observations with predictions for PK and PD models (PK: A, PD: B). Black solid lines are identity lines. Individual PK and PD profiles (PK: C, PD: D) for patients with lowest, median and highest body weight and age, respectively. Symbols are the observation and dashed red lines are prediction.
Pharmacodynamic modeling
An Imax model was chosen as the structural PD model for ML. Compared between different residual error models, the additive error model had the lowest OFV (up to 200 lower) and the best goodness-of-fit plot (Supplemental Figure S4). Baseline ML was estimated to be 97%, consistent with the expectation without any drug concentration in the system. IC50 was estimated to be 6 mg/L with an Imax of 0.89. Estimated PD parameters did not show clear trends with patient-specific covariates. (Supplemental Figure S5) Therefore, the final PD model was a proportional Imax model with an additive residual error model. Parameter estimates and between-subject variability are listed in Table 3. The between-subject variabilities for E0 and Imax were negligible (10−4) with high shrinkage (0.99), so were fixed to zero. Bootstrap results for the final PD models are listed in Table 3, and individual ML-concentration plots are displayed in Figure 3(D).
Table 3.
PD model parameter estimates
| Final PD model | Bootstrap | |||
|---|---|---|---|---|
| Parameter | Estimates | BSV in CV% [shrinkage] |
Estimates | 95% confidence interval |
| IC 50 (mg/L) | 6.0 | 65.3% [0.15] |
6.0 | 4.6 – 7.4 |
| Hill factor _γ | 8.5 | 86.3% [0.36] |
8.5 | 5.5 – 13.7 |
| ML 0 (%) | 97.0 | - | 97.0 | 94.6 – 99.0 |
| Imax | 0.89 | - | 0.89 | 0.87 – 0.91 |
|
Additive error σ (%)
[shrinkage] |
7.3 [0.10] |
7.3 | ||
Simulations to derive optimal dosing
Figure 4 displays the proportion of the 30 pregnant women who have TXA concentration higher than 10 mg/L and ML less than 17% for a dose range of 100 mg to 1000 mg. Flat dosing was used for the simulations, as body weight was not a meaningful covariate for the PK of TXA. In general, discrepancy existed between PK- and PD-evidenced dosing. For example, 400 mg of TXA ensured that all the 30 patients maintained at least 10 mg/L of TXA for 0.5 hour. However, only 80% of the patients had ML lower than 17% at the same dose. The discrepancy could be due to PD profiles exhibited higher variability than PK. Several individuals had considerably higher IC50 than due to unknown reasons.
Figure 4. Proportion of patients to reach targets.
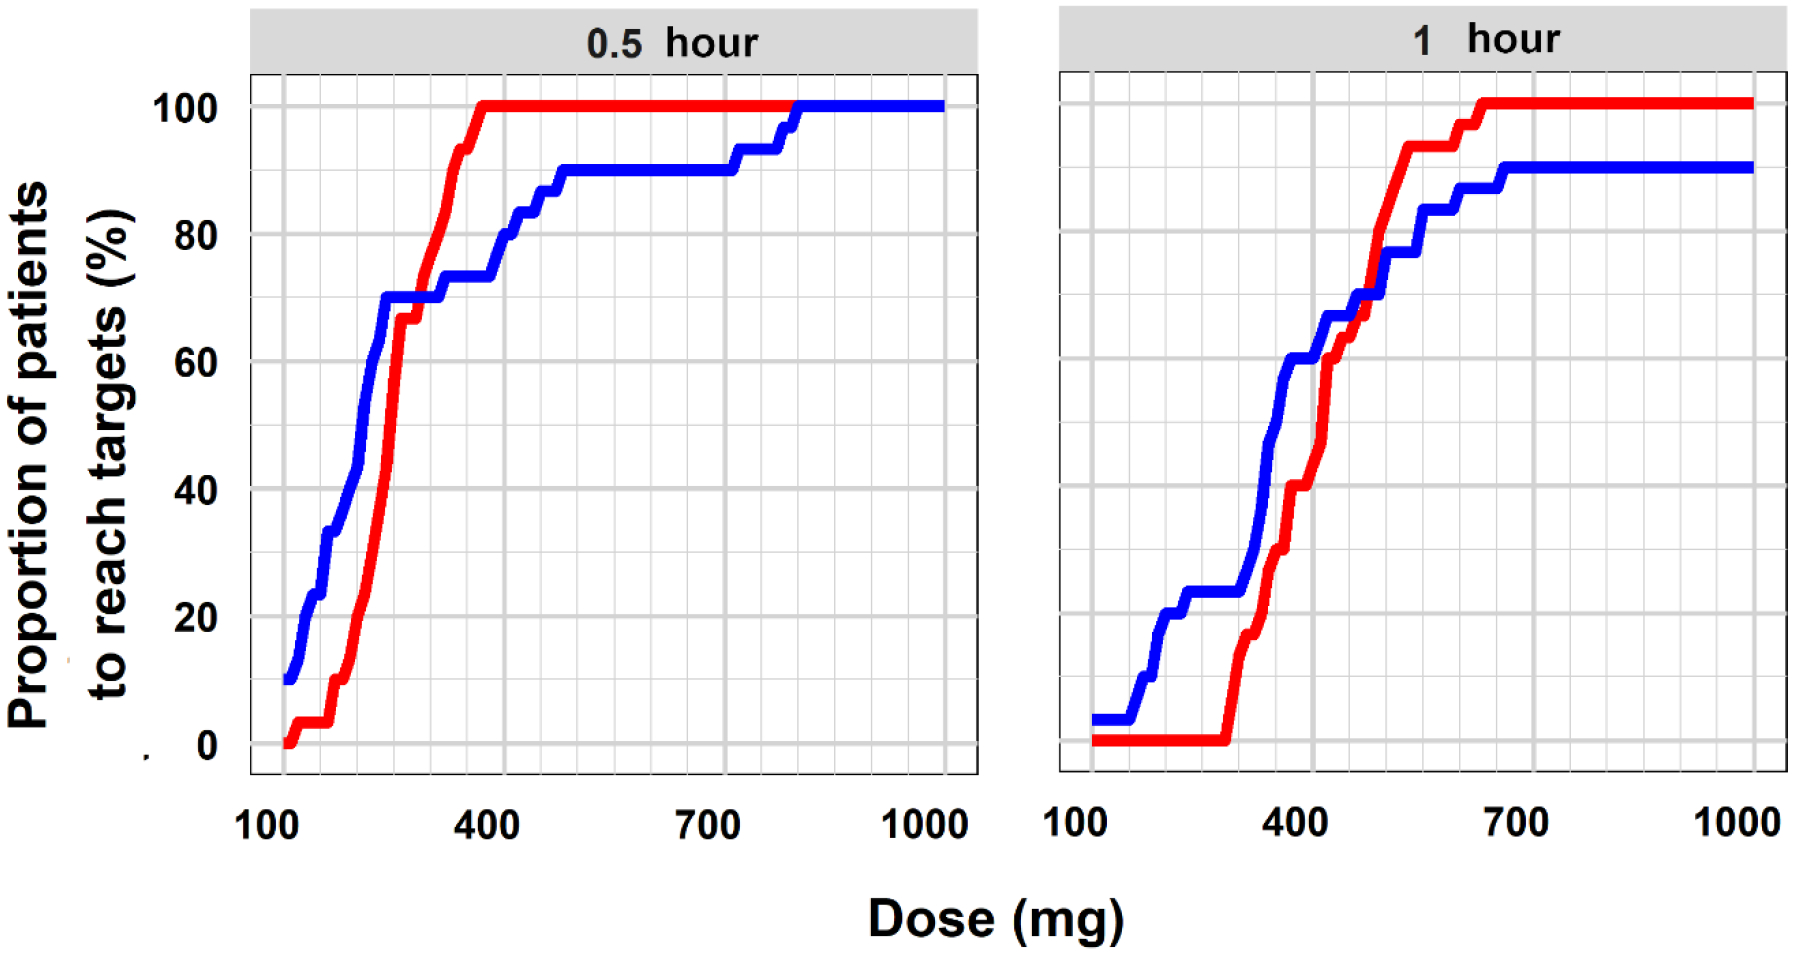
Proportional of the 30 patients reach the PK target (red) and PD target (blue) for 0.5 hour and 1 hour after the administration of TXA doses of 100 mg to 1000 mg.
To ensure around 90% of patients reach both PK and PD targets, 500 mg and 650 mg of TXA were proposed as the optimal prophylactic doses to maintain the targets for 0.5 hour and 1 hour, respectively. The average time to achieve PK target was 3 minutes for 500 mg (range: 1.8–6.6 minutes), and 2.4 minutes for 650 mg (range: 1.8–5.4 minutes), as shown in Supplemental Figure S6.
Discussion
Pregnant and postpartum women are usually excluded from clinical trials due to potential maternal and fetal risks, which results in substantial knowledge gaps for this patient population. To our knowledge, this study is the first to use a population approach to model the PK and PD data for TXA use in pregnancy and suggest the optimal prophylactic doses. The therapy intends to prevent PPH in women undergoing cesarean delivery. As shown in the WOMAN trial, patients given TXA treatment (1000 mg) within 3 hours of delivery had a lower death rate than the patients treated later2; thus, prophylactic doses right after delivery will ensure more patients benefit from the early antifibrinolytic effect of TXA. The most salient feature of this research is that the design and analysis of the clinical study were prospectively aimed to find the optimal prophylactic dose for pregnant women. The dose selection was performed systematically using the science-based modeling and simulation approach. Compared to the current regimen of 1000 mg, much lower doses of TXA, 500 mg and 650 mg, were found to maintain therapeutic targets for up to 0.5 hour and 1 hour, respectively. Since a majority of PPH cases are diagnosed within 1 hour after delivery, the proposed doses could provide sufficient prophylaxis for the high-risk period after delivery. Identifying lower effective TXA dosing for prevention use could reduce the drug costs, especially for lower- and middle-income countries, and has the potential to reduce more costly medical and surgical interventions. More importantly, avoiding excess dosing could reduce potential thromboembolic risks associated with the postpartum period.
An open two-compartment model with first-order elimination satisfactorily described the PK data, consistent with previously reported models of TXA.23–27 Even though the covariates, such as body weight and age, were found to reduce OFV statistically significantly, the reductions in the between-subject variabilities were negligible (<5%), as shown in Supplemental Table S1. As a result, dose adjustment for covariates was deemed unnecessary. We recognize that previously reported models include body weight, CrCl, and age as covariates. Age could explain CL variability due to different kidney maturation in pediatrics, which does not apply to this study. Possible reasons for why including body weight as a covariate did not significantly reduce between-subject variability include the following: first, parameter variabilities in this study are not high (BSV: 30–40%). Given variabilities are around 30–40% after including covariates in previous studies, variabilities observed in this study could mostly be random; thus, could not be further explained by covariates.23,25,27 Second, body weight used here are pre-delivery values, part of which comes from placental weight and infant weight that could differ among patients. Besides, the potential effects of delivery and cesarean surgery on body weight and body composition could also be different among patients. These factors could be why body weight did not reduce between-subject variability significantly in this study. Lanoiselee et al. reported that CrCl decreases the between-subject variability of CL by 27% in their study, where patients have a wide range of Scr (range: 47.7–271.4 μmol/L).27 In this study patients all had normal renal function with a narrow28 range of Scr (range: 33.6–60.1 μmol/L), which could explain why Scr was not found to be important in explaining the variability of CL. Additionally, instead of adding CrCl on CL directly, Scr together with age and body weight was added on CL in this study. That is because 29 out of 30 patients have the same CrCl after capping the estimated CrCl to 150 mg/min. Nevertheless, patients in the current study presented with normal renal function; hence, it is not surprising not to find CrCl as a significant factor to describe between-subject variability in CL.
Pregnant women exhibit higher clearance and volume of distribution than that of other patient populations (Table 4). Differences may be due to physiological changes during pregnancy. Intravascular and extravascular fluid volumes increase by 5 to 8 L during pregnancy, potentially explaining a higher volume of distribution of TXA in pregnant women.22 Also, due to increased cardiac output, the renal blood flow and glomerular filtration rate increase by 50% during pregnancy29, which likely explains the higher clearance of TXA found in this study. These distinctive PK parameters of TXA are critical for providing efficacious and safe doses for this special population.
Table 4.
Published PK parameter for current population
| References | Population | Estimates for current studied population | |||
|---|---|---|---|---|---|
| CL (L/hr) | Vc (L) | Q (L/hr) | Vp (L) | ||
| Current study | Pregnant women cesarean delivery | 9.4 | 10.1 | 22.4 | 14.0 |
| Lanoiselee et al 27 | Adults hip arthroplasty | 7.3 [150 mL/min] |
7.5 [86 kg] |
23.3 | 9.55 |
| Grassin-Delyle et al 25 | Adults CPB | 5.6 [86 kg] |
8.1 [86 kg] |
39.5 [86 kg] |
13.2 [86 kg] |
| Dowd et al 26 | Adult CPB | 9.5 [86kg] [before CPB] |
11.2 [86 kg] [before CPB] |
12.2 [86kg] [before CPB] |
9.8 [86kg] [before CPB] |
| Goobie et al. 23 | Pediatrics craniosynostosis surgery | 38.1 [86 kg] [32 years old] |
37 [86 kg] |
2.77 | 1.53 |
| Grassin-Delyle et al 24 | Pediatrics CPB | 2.85 [86 kg] |
17.3 [86 kg] |
6.7 [86 kg] [before CPB] |
40.3 [86 kg] |
No delays between TXA concentrations and maximum lysis were found (Figure 2(B)). A simple direct effect PD model successfully described the relationship between TXA concentrations and ML. The IC50 of 6 mg/L is achieved at all three dose levels tested. However, the time above the IC50 was longer with higher doses. The Imax of 0.89 indicates that about 90% of lysis is inhibited. Interestingly, the hill coefficient is 8.5, suggesting a very steep TXA concentration-ML relationship. Small changes in concentrations lead to large fluctuations in ML. This PD model allowed exploration of the appropriate dosing regimen for pregnant women.
Two therapeutic targets were used for exploring suitable dosing regimens. In vitro studies indicated that a TXA concentration ≥ 10 mg/L provided a substantial antifibrinolytic effect.19 Reference values for rotation thromboelastometry parameters indicated a target ML ≤ 17% for pregnant women after delivery.20 Even though the targets are from two different studies, they correlated well with each other. Average ML was lower than 17% at TXA concentration higher than 10 mg/L (Figure 2(B)). The IC50 of 6.0 mg/L with a steep sigmoidicity factor is also consistent with the PK target selection. Generally, pharmacodynamic responses are more variable than pharmacokinetics.30 Patients’ ML profiles exhibited higher variability (up to 80%). Based on the PKPD simulations, at a dose of 600 mg 97% patients maintained the PK target for one hour, while only 87% patients maintained the PD target. A dose of 650 mg achieved the PK target in 100% and the PD target in 87% of the patients. Even at a dose of 1000 mg, only 90% of patients reached the PD target. As shown in Figure 3(B), ML in two patients remained at baseline despite the concentrations reaching > 10 mg/L. However, at the subsequent time points the ML were at the minimum (< 10%), indicating a very steep relationship. Perhaps, additional sampling between 3–5 hr might have aided in better estimation of the IC50 in these two patients. Considering the totality of evidence, a TXA dose of 650 mg is recommended for preventing PPH in pregnant women.
Conclusions
To the best of our knowledge, the PK and PD profiles of TXA in pregnant women who underwent cesarean delivery are described for the first time. The optimal dose of 650 mg is anticipated to provide adequate PPH prophylaxis for up to 1 hour after delivery.
Supplementary Material
Study Highlights.
What is already known about this subject?
Tranexamic acid (TXA) is widely used in obstetrics.
However, the pharmacokinetics (PK) and pharmacodynamics (PD) of TXA in pregnant women are poorly characterized.
An optimal dose of TXA in postpartum hemorrhage (PPH) prevention is missing.
What this study adds?
This is the first study using a population approach to characterize PK and PD of TXA in pregnant women.
Compared to non-pregnant populations, pregnant women have higher clearance and volume of distribution of TXA.
The optimal dose of 650 mg is anticipated to provide adequate PPH prophylaxis for up to 1 hour after delivery.
Acknowledgements
Alexandra North and Ebonie Carter helped with study recruitment. Brooke Langevin helped with editing of the final manuscript.
Funding Information
The project was funded by National Institutes of Health (K23HL141640 and KL2TR001877/ UL1TR001876 to HKA; R61HL141791 and R33HL141791 to ASW; T32HD087969 to JVDA). Of note, this publication was supported by Award Numbers UL1TR001876 and KL2TR001877 from the NIH National Center for Advancing Translational Sciences. Its contents are solely the responsibility of the authors and do not necessarily represent the official views of the National Center for Advancing Translational Sciences or the National Institutes of Health.
Footnotes
Conflict of Interest
Jogarao V.S. Gobburu is a co-founder of Pumas-AI that commercializes Pumas software.
Data availability statement
Research data are not shared.
References
- 1.Reale SC, Easter SR, Xu X, Bateman BT, Farber MK. Trends in Postpartum Hemorrhage in the United States From 2010–2014. Obstet Anesth Dig. 2020;40(1):12. doi: 10.1097/01.aoa.0000652796.48760.fd [DOI] [PubMed] [Google Scholar]
- 2.Shakur H, Roberts I, Fawole B, et al. Effect of early tranexamic acid administration on mortality, hysterectomy, and other morbidities in women with post-partum haemorrhage (WOMAN): an international, randomised, double-blind, placebo-controlled trial. Lancet. 2017;389(10084):2105–2116. doi: 10.1016/S0140-6736(17)30638-4 [DOI] [PMC free article] [PubMed] [Google Scholar]
- 3.World Health Organization (WHO). Updated WHO Recommendation on Tranexamic Acid for the Treatment of Postpartum Haemorrhage: Highlights and Key Messages from the World Health Organization’s 2017 Global Recommendation. 2017;(October):5. [PubMed] [Google Scholar]
- 4.CykloKapron package insert. https://www.accessdata.fda.gov/drugsatfda_docs/label/2011/019281s030lbl.pdf.2012;(11):2012.
- 5.Goobie SM. Tranexamic acid: Still far to go. Br J Anaesth. 2017;118(3):293–295. doi: 10.1093/bja/aew470 [DOI] [PubMed] [Google Scholar]
- 6.Miszta A, Ahmadzia HK, Luban NLC, et al. Application of a plasmin generation assay to define pharmacodynamic effects of tranexamic acid in women undergoing cesarean delivery. J Thromb Haemost. 2021;19(1):221–232. doi: 10.1111/jth.15114 [DOI] [PMC free article] [PubMed] [Google Scholar]
- 7.Phillips JM, van den Anker JN, Ahmadzia HK. Next Generation Medical Management of Postpartum Hemorrhage. Curr Pharm Des. 2019;25(5):549–555. doi: 10.2174/1381612825666190320155337 [DOI] [PubMed] [Google Scholar]
- 8.Kazma JM, van den Anker J, Allegaert K, Dallmann A, Ahmadzia HK. Anatomical and physiological alterations of pregnancy. J Pharmacokinet Pharmacodyn. 2020;47(4):271–285. doi: 10.1007/s10928-020-09677-1 [DOI] [PMC free article] [PubMed] [Google Scholar]
- 9.Dirkmann D, Hanke AA, Görlinger K, Peters J. Perioperative use of modified thrombelastography in factor XI deficiency: A helpful method to assess drug effects. Acta Anaesthesiol Scand. 2007;51(5):640–643. doi: 10.1111/j.1399-6576.2007.01284.x [DOI] [PubMed] [Google Scholar]
- 10.Bolliger D, Seeberger MD, Tanaka KA. Principles and Practice of Thromboelastography in Clinical Coagulation Management and Transfusion Practice. Transfus Med Rev. 2012;26(1):1–13. doi: 10.1016/j.tmrv.2011.07.005 [DOI] [PubMed] [Google Scholar]
- 11.Ahmadzia HK, Luban NLC, Li S, Guo D, Miszta A, Gobburu JVS, Berger JS, James AH, Wolberg AS van den AJ. Optimal use of tranexamic acid for hemorrhage prevention in pregnant women. Am J Obs Gynecol. In Press. [DOI] [PMC free article] [PubMed] [Google Scholar]
- 12.Cockcroft DW, Gault MH. Prediction of creatinine clearance from serum creatinine. Nephron. 1976;16(1):31–41. doi: 10.1159/000180580 [DOI] [PubMed] [Google Scholar]
- 13.Rackauckas C, Ma Y, Noack A, Dixit V et al. Accelerated Predictive Healthcare Analyticswith Pumas, a High Performance Pharmaceuticalmodeling and Simulation Platform. bioRxiv. 2020. [Google Scholar]
- 14.R Core Team. R:A language and environment for statistical computing. (R Foundation for Statistical Computing, Vienna, Austria, 2018). [Google Scholar]
- 15.Wickham H. ggplot2: Elegant graphics for data analysis. 2016:https://ggplot2-book.org/.
- 16.Boer P Estimated lean body mass as an index for normalization of body fluid volumes in humans. Am J Physiol - Ren Fluid Electrolyte Physiol. 1984;16(4). doi: 10.1152/ajprenal.1984.247.4.f632 [DOI] [PubMed] [Google Scholar]
- 17.Madabushi R, Cox DS, Hossain M, et al. Pharmacokinetic and pharmacodynamic basis for effective argatroban dosing in pediatrics. J Clin Pharmacol. 2011;51(1):19–28. doi: 10.1177/0091270010365550 [DOI] [PubMed] [Google Scholar]
- 18.Picetti R, Shakur-Still H, Medcalf RL, Standing JF, Roberts I. What concentration of tranexamic acid is needed to inhibit fibrinolysis? A systematic review of pharmacodynamics studies. Blood Coagul Fibrinolysis. 2019;30(1):1–10. doi: 10.1097/MBC.0000000000000789 [DOI] [PMC free article] [PubMed] [Google Scholar]
- 19.Andersson L, Nilsoon IM, Colleen S, Granstrand JB, Melander B. Role of urokinase and tissue activator in sustaining bleeding and the management thereof with EACA and AMCA. Ann N Y Acad Sci. 1968;146(2):642–656. doi: 10.1111/j.1749-6632.1968.tb20322.x [DOI] [PubMed] [Google Scholar]
- 20.Oudghiri M, Keïta H, Kouamou E, et al. Reference values for rotation thromboelastometry (ROTEM®) parameters following nonhaemorrhagic deliveries. correlations with standard haemostasis parameters. Thromb Haemost. 2011;106(1):176–178. doi: 10.1160/TH11-02-0058 [DOI] [PubMed] [Google Scholar]
- 21.Davison JM, Dunlop W. Renal hemodynamics and tubular function in normal human pregnancy. Kidney Int. 1980;18(2):152–161. doi: 10.1038/ki.1980.124 [DOI] [PubMed] [Google Scholar]
- 22.Dallmann A, Ince I, Meyer M, Willmann S, Eissing T, Hempel G. Gestation-Specific Changes in the Anatomy and Physiology of Healthy Pregnant Women: An Extended Repository of Model Parameters for Physiologically Based Pharmacokinetic Modeling in Pregnancy. Clin Pharmacokinet. 2017;56(11):1303–1330. doi: 10.1007/s40262-017-0539-z [DOI] [PubMed] [Google Scholar]
- 23.Goobie SM, Meier PM, Sethna NF, et al. Population pharmacokinetics of tranexamic acid in paediatric patients undergoing craniosynostosis surgery. Clin Pharmacokinet. 2013;52(4):267–276. doi: 10.1007/s40262-013-0033-1 [DOI] [PubMed] [Google Scholar]
- 24.Grassin-Delyle S, Couturier R, Abe E, Alvarez JC, Devillier P, Urien S. A practical tranexamic acid dosing scheme based on population pharmacokinetics in children undergoing cardiac surgery. Anesthesiology. 2013;118(4):853–862. doi: 10.1097/ALN.0b013e318283c83a [DOI] [PubMed] [Google Scholar]
- 25.Grassin-Delyle S, Tremey B, Abe E, et al. Population pharmacokinetics of tranexamic acid in adults undergoing cardiac surgery with cardiopulmonary bypass. Br J Anaesth. 2013;111(6):916–924. doi: 10.1093/bja/aet255 [DOI] [PubMed] [Google Scholar]
- 26.Dowd NP, Karski JM, Cheng DC, et al. Pharmacokinetics of tranexamic acid during cardiopulmonary bypass. Anesthesiology. 2002;97(2):390–399. doi: 10.1097/00000542-200208000-00016 [DOI] [PubMed] [Google Scholar]
- 27.Lanoiselée J, Zufferey PJ, Ollier E, Hodin S, Delavenne X. Is tranexamic acid exposure related to blood loss in hip arthroplasty? A pharmacokinetic–pharmacodynamic study. Br J Clin Pharmacol. 2018;84(2):310–319. doi: 10.1111/bcp.13460 [DOI] [PMC free article] [PubMed] [Google Scholar]
- 28.Harel Z, McArthur E, Hladunewich M, et al. Serum Creatinine Levels Before, During, and after Pregnancy. JAMA - J Am Med Assoc. 2019;321(2):205–207. doi: 10.1001/jama.2018.17948 [DOI] [PMC free article] [PubMed] [Google Scholar]
- 29.Dunlop W Serial changes in renal haemodynamics during normal human pregnancy. BJOG An Int J Obstet Gynaecol. 1981;88(1):1–9. doi: 10.1111/j.1471-0528.1981.tb00929.x [DOI] [PubMed] [Google Scholar]
- 30.Levy G Predicting effective drug concentrations for individual patients: Determinants of pharmacodynamic variability. Clin Pharmacokinet. 1998;34(4):323–333. doi: 10.2165/00003088-199834040-00005 [DOI] [PubMed] [Google Scholar]
Associated Data
This section collects any data citations, data availability statements, or supplementary materials included in this article.