

Abstract
Maternal nutrition is an important factor for infant neurodevelopment. However, prior magnetic resonance imaging (MRI) studies on maternal nutrients and infant brain have focused mostly on preterm infants or on few specific nutrients and few specific brain regions. We present a first study in term-born infants, comprehensively correlating 73 maternal nutrients with infant brain morphometry at the regional (61 regions) and voxel (over 300 000 voxel) levels. Both maternal nutrition intake diaries and infant MRI were collected at 1 month of life (0.9 ± 0.5 months) for 92 term-born infants (among them, 54 infants were purely breastfed and 19 were breastfed most of the time). Intake of nutrients was assessed via standardized food frequency questionnaire. No nutrient was significantly correlated with any of the volumes of the 61 autosegmented brain regions. However, increased volumes within subregions of the frontal cortex and corpus callosum at the voxel level were positively correlated with maternal intake of omega-3 fatty acids, retinol (vitamin A) and vitamin B12, both with and without correction for postmenstrual age and sex (P < 0.05, q < 0.05 after false discovery rate correction). Omega-3 fatty acids remained significantly correlated with infant brain volumes after subsetting to the 54 infants who were exclusively breastfed, but retinol and vitamin B12 did not. This provides an impetus for future larger studies to better characterize the effect size of dietary variation and correlation with neurodevelopmental outcomes, which can lead to improved nutritional guidance during pregnancy and lactation.
Keywords: brain morphometry, infant brain, maternal nutrition, omega-3 fatty acid
Introduction
Neurodevelopmental outcomes can be positively and negatively influenced by a myriad of both static and modifiable factors including levels of macro- and micronutrients (Dobbing 1977; Walker et al. 2011; Prado and Dewey 2014). Infant nutrition in the first months of life is derived either from maternal milk, infant formula, or a combination of the two. Previous studies have demonstrated qualitative relationships between changes in maternal diet and expressed milk content (Innis 2014). For example, the fatty acids in human milk are both sensitive to maternal diet and important in development of the nervous system (Innis 2014). Maternal or infant dietary intake of docosahexaenoic acid (DHA) is associated with improved neurodevelopmental outcomes in observational studies, although questions remain on whether such findings hold true in randomized control studies (Meldrum and Simmer 2016; Jasani et al. 2017). The power of such studies to detect a true association is reduced by multiple coexisting modifiers of neurodevelopmental outcome and the time that elapses between early supplementation and measurement of outcomes. However, these are important barriers to overcome as identifying dietary factors that influence infant neurodevelopment offers the opportunity to improve health and outcomes, as has been successful with routine supplementation of folic acid and iron (Anjos et al. 2013; Krebs et al. 2017).
Brain magnetic resonance imaging (MRI) is utilized as an important proximal biomarker for neurodevelopment to allow for assessment of changes in brain structure that may precede clinically observable outcomes. Given the multiple nutritional and non-nutritional components that influence neurodevelopment, using a proximal measure such as brain MRI could allow for more precise understanding of the influence that single or combined nutritional factors have on early brain structure and growth (Dobbing 1977; Isaacs 2013). Randomized control trials have confirmed previously demonstrated correlations between early quantitative MRI measures and neurodevelopmental outcomes in the first year of life (Tan et al. 2008). Such proximal measures of developmental trajectory are essential for identification of patients for whom intervention may improve later functional outcomes in coming years and to identify critical periods of development for specific interventions. Further, identification of regional or connectivity changes on MRI that are associated with intervention can generate specific hypotheses about the neural mechanisms of action. However, studies focused on single or few selected nutrients (e.g., lutein (Leermakers et al. 2016; Perrone et al. 2016; Zamroziewicz et al. 2016), B12 (Pepper and Black 2011; Ekici et al. 2016), iodine (Laurberg and Andersen 2014), folate (McGarel et al. 2015; Catena et al. 2016), or fatty acids (Almaas et al. 2015; Catena et al. 2016; Zamroziewicz et al. 2017a)), and few brain regions in MRI (e.g., hippocampus (Zamroziewicz et al. 2016), gray matter (GM) (Luby et al. 2016; Coviello et al. 2018), white matter (WM) (Deoni et al. 2013), and basal ganglia and thalami (Coviello et al. 2018)), leave the question how various nutrients impact brain anatomy at the regional or voxel scale largely unexplored (Sizonenko et al. 2013; Goyal et al. 2015). More importantly, existing studies, including the ones above, are primarily focused on the effects of nutrition in infants born preterm (e.g., see recent surveys (Georgieff 2007; Perrone et al. 2016; Belfort and Ehrenkranz 2017; Kumar et al. 2017; Miller et al. 2018)) or in the elderly population (>65 years of age, e.g., (Gu et al. 2016; Zamroziewicz et al., 2017; Moore et al. 2018)), leaving the study of term-born infants an unmet need.
Here, we describe a detailed quantitative assessment of the relationship of maternal macro- and micro-nutrient intake with regional and voxel-wise MRI volumes. Term infants from uncomplicated pregnancies with majority mother’s milk feeding were characterized by MRI at approximately 1 month of age, and maternal food frequency questionnaires (FFQs) were employed to determine specific nutrient intake. Our study is the first such study to focus on term-born infants without known risk factors for neurodevelopmental abnormalities.
Materials and Methods
Data
Study Population
A cohort of 92 typically developing late-preterm and full-term neonates, whose mothers had no known medical conditions or complications during pregnancy, was prospectively recruited from the well-baby nurseries at Brigham and Women’s Hospital and Beth Israel Deaconess Medical Center between 2014 and 2017 within the first week of life. Among them, 7 (7.6%) neonates did not have records for feeding patterns, 9 (9.8%) neonates were breastfed 1–25% of the times they were fed, 3 (3.3%) neonates were breastfed 26–50% of the time they were fed, 7 (7.6%) neonates were breastfed 51–75% of the time they were fed, 12 (13.0%) were breastfed 76–99% of the time they were fed, and 54 (58.7%) neonates were breastfed 100% of the time they were fed. The protocol was reviewed and approved by the institutional review board at Boston Children’s Hospital and written informed consent of the parent or legal guardian was obtained. This protocol corresponds to clinicaltrials.gov Identifier: NCT02058225 (“Developing Advanced MRI Methods for Detecting the Impact of Nutrients on Infant Brain Development,” https://clinicaltrials.gov/ct2/show/NCT02058225). Data sharing was not part of the approved Institutional Review Board. The population characteristics are described in Table 1. Gestational age at birth (GA) ranged from 35.7 to 42.0 weeks, with a median at 39.2 weeks; chronological age at time of MRI (CA, age after birth) ranged between 1.4 and 7.1 weeks, with a median at 3.8 weeks; and postmenstrual age at time of MRI (PA = GA + CA) ranged between 38.3 and 47.1 weeks, with a median at 43.1 weeks. The detailed distributions of these ages can be found in Supplementary Figure 1. Figure 1 shows distribution of whole brain volumes in patients grouped by sex (P < 0.05). Correlations between nutrients and MRI factors were corrected for postmenstrual age and sex (details in Results section).
Table 1 .
Cohort characteristics
| Demographics (N = 92) | Mean ± SD (range) or N (%) |
|---|---|
| Female | 44/92 (47.8%) |
| Gestational age (weeks) | 39.04 ± 1.20 (35.7–42.0) |
| Birth weight (kg) | 3.27 ± 0.03 |
| Age at scan (days) | 27.00 ± 14.85 (10–52) |
| Mother’s age (years) | 32.08 ± 2.12 |
| Mother’s ethnicity | |
| Hispanic or Latino | 14/92 (15.2%) |
| Non-Hispanic or Latino | 77/92 (83.7%) |
| Unknown | 1/92 (1.1%) |
| Mother’s race | |
| White | 57/92 (62.0%) |
| Black or African/American | 16/92 (17.4%) |
| Asian | 6/92 (6.5%) |
| More than one race | 3/92 (3.3%) |
| Unknown | 10/92 (10.9%) |
| Mother’s education | |
| Less than high school | 1/92 (1.1%) |
| High school diploma or equivalency (GED) | 13/92 (14.1%) |
| Associate degree (junior college) | 10/92 (10.9%) |
| Bachelor’s degree | 30/92 (32.6%) |
| Master’s degree | 25/92 (27.1%) |
| Doctorate professional | 11/92 (12.0%) |
| Other | 2/92 (2.2%) |
| Family income | |
| Less than $24 999 | 8/92 (8.7%) |
| $25 000 through $49 999 | 8/92 (8.7%) |
| $50 000 through $99 999 | 26/92 (28.3%) |
| $100 000 and greater | 46/92 (50.0%) |
| Don’t know/no response | 4/92 (4.3%) |
Figure 1.
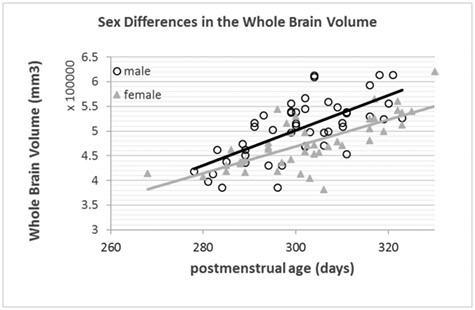
Relationship between whole-brain volume and postmenstrual age by subject sex.
Dietary Intake Assessment and Nutrient Measurements
Self-administered FFQs were completed by mothers to survey maternal intake via recording of foods consumed, the frequency of consumption and the portion size (Cade et al. 2002). The FFQs were filled within 30 days of the MRI scan (all postpartum, with the median and mean age for FFQ on day 30.0 and day 31.7 after birth, standard deviation = 18.1 days, and median and mean at 0 and 4.7 days after the MRI, standard deviation of differences in time = 16.3 days). Many FFQs used today are extensions from either the Block FFQ that was originally developed in 1986 at the National Cancer Institute (Block et al. 1986) or the Willet FFQ that was originally developed in 1987 (Willet et al. 2017). This study used the proprietary 139-item modified version of the Block 2005 FFQ (NutritionQuest) that has been extensively validated (Block et al. 1990; Subar et al. 2001; Potischman et al. 2006; Hartert et al. 2010; Plumptre et al. 2018) to survey mother’s food intake and multivitamin intake. In general, the 139 questions were used to query the volume and frequency of mother’s food intake in the past 3 months, including all meals or snacks as well as any supplements. To convert the FFQ into nutrient measurements, we used the standardized commercial software and service from NutritionQuest (http://www.nutritionquest.com) (Apovian et al. 2010; Freedman et al. 2011; Payne et al. 2012). We thus obtained 73 nutrient measurements that were classified into 6 nutrient categories: total energy, carbohydrates, fats, minerals, vitamins and antioxidants, and fibers (Table 2).
Table 2 .
The 73 FFQ-converted nutrients
| Category | Explanation | Category | Explanation |
|---|---|---|---|
| Total energy | Fat, g | Vitamins and antioxidants | Vitamin E as alpha-tocopherol, mg |
| Carbohydrate, g | Selenium, mcg | ||
| Food energy, kcals | Vitamin A, RAE (mcg) | ||
| Protein, g | Vitamin D, IU | ||
| Carbohydrates | Sugars, total, g | Vitamin K as phylloquinone, mcg | |
| Glycemic Index (glucose), average daily | Dietary arginine, mg | ||
| Glycemic Load (glucose), average daily | Thiamin (Vitamin B1), mg | ||
| Fructose, g | Riboflavin (Vitamin B2), mg | ||
| Lactose, g | Niacin, mg | ||
| Maltose, g | Food folate, mcg | ||
| Galactose, g | Vitamin B6, mg | ||
| Sucrose, g | Folic acid, mcg | ||
| Glucose, g | Vitamin B-12, mcg | ||
| Fats | Saturated fat, g | Total choline, mg | |
| Monounsaturated fatty acids, g | Free choline, mg | ||
| Polyunsaturated fatty acids (PUFA), g | Phosphocholine, mg | ||
| Cholesterol, mg | Glycerophosphocholine, mg | ||
| Trans fats, total, g | Phosphatidylcholine, mg | ||
| Dietary PUFA (~N-6) 18:2, g | Betaine, mg | ||
| Dietary PUFA (~N-3) 18:3, g | Glutathione, total, mg | ||
| Dietary PUFA (~N-3; SDA) 18:4, g | Glutathione, reduced, mg | ||
| Dietary PUFA (~N-6) 20:4, g | Vitamin C, mg | ||
| Dietary N-3 PUFA 20:5 (EPA), g | Retinol, mcg | ||
| Dietary N-3 PUFA 22:5 (DPA), g | Alpha-carotene, mcg | ||
| Dietary N-3 PUFA 22:6 (DHA), g | Beta-carotene, mcg | ||
| Avg. daily omega-6 FA, g | Cryptoxanthin, beta, mcg | ||
| Avg. daily omega-3 FA, g | Lutein-Zeaxanthin, mcg | ||
| Sphingomyelin (SM), mg | Lycopene, mcg | ||
| Minerals | Calcium, mg | Isoflavones, total, mg | |
| Phosphorus, mg | Quercetin, mg | ||
| Iron, mg | Cysteine (S-containing), mg | ||
| Sodium, mg | Methionine (S-containing), mg | ||
| Potassium, mg | Cystine (S-containing), mg | ||
| Zinc, total, mg | Average daily Dietary Folate Equivalents, mcg | ||
| Copper, mg | |||
| Zinc, animal sources only, mg | Fibers | Dietary fiber, g | |
| Magnesium, mg | Dietary soluble fiber, g |
MRI Protocols
Structural MRI acquisition with T1-weighted magnetization-prepared rapid-acquisition gradient-echo (MPRAGE) was performed for all subjects on a Siemens Trio 3T scanner at Boston Children’s Hospital with a 32-channel head coil. Imaging parameters consisted of repetition time = 2520 ms, echo time = 1.74 ms, flip angle = 7o, field of view = 160 cm, voxel size = 1.00 × 1.00 × 1.00 mm3, and field-of-view 160 × 160 × 128 mm3.
MRI Analysis
All MPRAGE structural MRI images went through the N4 bias correction (Tustison et al. 2010; http://insight-journal.org/browse/publication/640), field-of-view normalization (Ou et al. 2018; https://www.nitrc.org/projects/normalizefov), automated multiatlas-based skull stripping (Doshi et al. 2013; Ou et al. 2015; https://www.med.upenn.edu/sbia/mass.html), and structural segmentation into 61 nonoverlapping neonatal-specific regions of interests (ROIs) that cover the full brain (Doshi et al. 2016; https://www.med.upenn.edu/sbia/muse.html) (see the list of ROIs in Table 3). The 61 ROIs for infant MRI were based on nonrigidly transferring adult MRI atlases with 151 expert-defined ROIs (Wang and Yushkevich 2013) into neonatal atlases (Ou et al. 2017), from which an expert pediatric neuroradiologists checked and merged into 61 ROIs specifically for the use in the neonatal and early pediatric population. The pipeline has been extensively validated in clinical pediatric and infant MRI analysis (Ou et al. 2015, 2017; Lauer et al. 2017; Pinto et al. 2018).
Table 3.
The 61 ROIs in each brain MRI
| Corpus callosum | Left insula | Parietal lateral GM right |
|---|---|---|
| Right ventral DC | Frontal lateral GM right | Parietal lateral GM left |
| Left ventral DC | Frontal lateral GM left | Parietal medial GM right |
| Vermis | Frontal medial GM Right | Parietal medial GM left |
| Right cerebellum | Frontal medial GM left | Parietal WM right |
| Left cerebellum | Frontal opercular GM right | Parietal WM left |
| Right basal ganglia | Frontal opercular GM left | Temporal inferior GM right |
| Left basal ganglia | Frontal WM right | Temporal inferior GM left |
| Right thalamus | Frontal WM left | Temporal lateral GM right |
| Left thalamus | Limbic cingulate GM right | Temporal lateral GM Left |
| Anterior limb IC right | Limbic cingulate GM left | Temporal supratemporal GM Right |
| Anterior limb IC left | Limbic medial temporal GM right | Temporal supratemporal GM left |
| PLIC right | Limbic medial temporal GM left | Temporal WM right |
| PLIC left | Occipital inferior GM right | Temporal WM left |
| Right amygdala | Occipital inferior GM left | Third ventricle |
| Right hippocampus | Occipital lateral GM right | Fourth ventricle |
| Left amygdala | Occipital lateral GM left | Right ventricle |
| Left hippocampus | Occipital medial GM right | Left ventricle |
| Right inferior GM | Occipital medial GM left | Brainstem |
| Left inferior GM | Occipital WM right | |
| Right insula | Occipital WM left |
Abbreviations: DC, diencephalon; IC, internal capsule; PLIC, posterior limb of the internal capsule.
In addition, we measured volume ratios at the voxel level. Voxel-wise volume ratio analysis was employed to avoid errors introduced by boundary creation in the segmentation process and to enable subregional analysis that may not necessarily coincide with the ROI parcellation. Specifically, we used the Deformable Registration via Attribute Matching and Mutual-Saliency Weighting algorithm (Ou et al. 2011), which has been extensively validated (Ou et al. 2014, 2017) and is available at https://www.nitrc.org/projects/dramms, to nonrigidly transform each subject’s structural MRI into a normative infant atlas (Ou et al. 2017). The subject-to-atlas registration generated a Regional Analysis of Volumes Examined in Normalized Space (RAVENS) density map for each subject. The RAVENS value at a voxel quantified the volume ratio, which is > 1, =1, and <1 for volume expansion, preservation, and shrinkage, respectively, compared to the same anatomy in the atlas (Davatzikos et al. 2001). Thus, when each brain’s MRPAGE is warped to match the atlas, deformations at a voxel level are recorded for the deformations necessary to match the atlas. Voxel-wise analysis is a counterpart of regional volume measurement but at the voxel level, and hence can be used to represent voxel-wise morphometry patterns of brains (Erus et al. 2015; Hartung et al. 2015), and has been widely used to study subregional and voxel level morphometric properties in various diseased or vulnerable populations in adults and childhood (Tisserand et al. 2002; Ashburner et al. 2003; Resnick et al. 2003; Rojas et al. 2006; Koutsouleris et al. 2009; Davatzikos et al. 2014; Hartung et al. 2015). The atlas provides a standard reference for comparison across patients and therefore remains constant across all comparisons to minimize bias. We used the 0- to 3-month normative T1-weighted MPRAGE atlas that was generated in-house, an extension of our previous work (Ou et al. 2017). We smoothed the RAVENS maps with a 3D Gaussian kernel of 8 mm in each direction to encourage similar properties in neighboring voxels. The smoothing kernel size has been used in many other adult and pediatric studies referred above. Despite smoothing, multiple comparisons at the voxel level were still regarded as pseudo-independent, and the correction was done at the voxel level with strict parameters, to reduce the chance of false-positive findings as previously reported (Koutsouleris et al. 2009; Hartung et al. 2015; Nassar et al. 2018).
Nutrient-MRI Correlation
Regional Nutrient-MRI Correlation
We generated a correlation matrix, where each element was a Pearson’s correlation coefficient between the values of a nutrient and the volumes of an ROI across subjects. We computed both the direct correlation between an ROI and a nutrient and the partial correlation controlling for postmenstrual age and sex. All ROI volumes have been normalized by the participant’s intracranial volume. To reduce type I error or false-positive findings, we used false discovery rate (FDR) correction on the multiple comparisons. Nutrient-region pairs with P < 0.05 and q < 0.05 after correction are considered significantly correlated.
Voxel-wise Nutrient-MRI Correlation
We hypothesized that certain voxels, or cluster of voxels, which may constitute only part of the ROIs or may span across ROIs, may have their morphometry (relative volume) significantly associated with certain nutrients. Therefore, we calculated the Pearson’s correlation coefficient between the values of a nutrient and RAVENS value at a voxel in the atlas space. This generated a correlation map in the atlas space for each of the nutrients, which went through FDR correction. We computed both direct correlations between nutrients and voxels and partial correction controlling for postmenstrual age and sex. Those voxels with P < 0.05, q < 0.05 and with more than 1250 connected voxels in their clusters are considered significantly correlated with a nutrient. Clusters with fewer than 1250 connected voxels were considered as false positive, since a typical 1-month-old brain contains ~ 500 000 voxels at 1 mm3/voxel, which will have a default false-positive rate of 1250 voxels (P and q both at 0.05).
Results
Correlation between Nutrient Intake and Regional Brain Volume
The intake of all 73 micronutrients was assessed for correlation with 61 regional brain volumes, both directly (no covariates, Fig. 2, top row) and indirectly (controlling for postmenstrual age and sex as covariates, Fig. 2, bottom row). Across the cohort, there were similar patterns of association between maternal nutrient intake and infant brain volumes. Volume was positively correlated across most brain regions with maternal omega-3 fatty acid intake. However, after correction for multiple testing, none of the nutrient-ROI pairs was significantly correlated, which provided an additional motivation for us to search at the voxel level.
Figure 2.
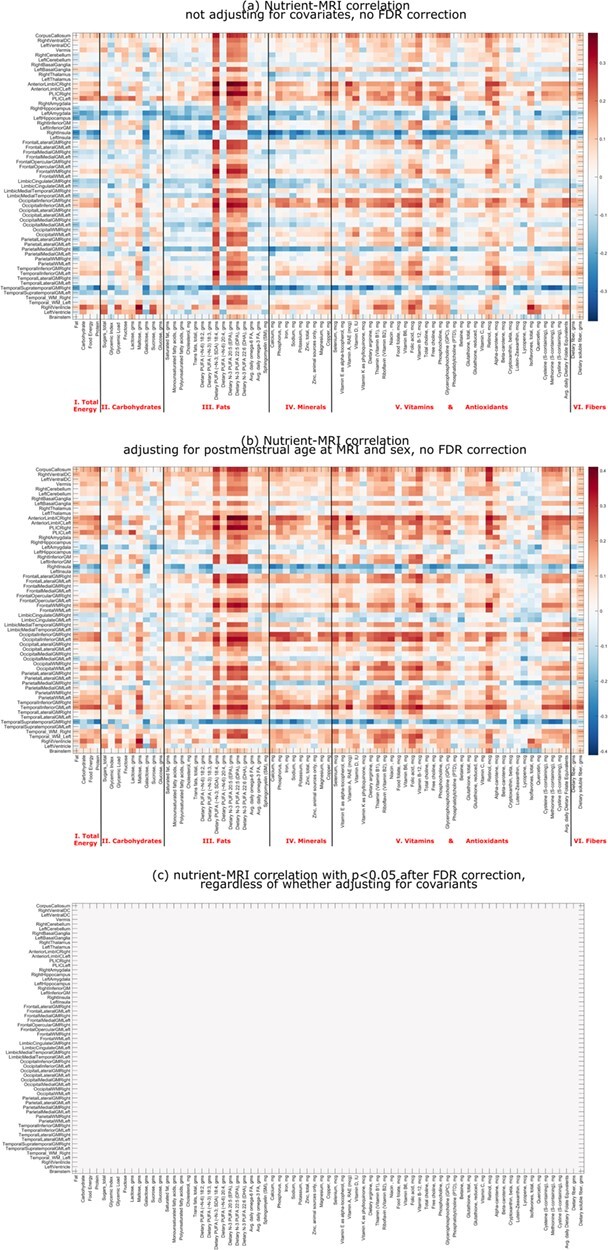
Correlations between maternal nutrient intake and infant regional brain volumes in unadjusted (a) and partially adjusted (b; adjusted for postmenstrual age at MRI scan and sex) models, both before correction and after FDR correction for multiple testing (c). Brain regions are listed in rows and nutrients in columns. The nutrients are grouped into seven categories. Red for positive correlation and blue for negative correlation, and the darkness for the magnitude of correlation (see the color bar to the right of the correlation matrix).
Nutrient Intake Correlation with Voxel-level Tissue Density
Correlation maps were generated between voxel-based relative volume (RAVENS) and maternal nutrient intake. Figure 3 shows 6 randomly selected, uncorrected correlation maps between voxel-wise tissue densities and representative nutrients in each of the 6 nutrient categories based on the type of macromolecule. The correlation was after controlling for sex and postmenstrual age. Fat intake demonstrated distinct spatial distribution of volume effects compared to other nutrients such as iron or soluble fiber. After FDR correction of multiple comparisons, only 6 nutrients—including 4 individual omega-3 fatty acids (stearidonic acid [SDA], eicosapentaenoic acid [EPA], docosapentaenoic acid [DPA], and DHA) and 2 vitamins/antioxidants (retinol, which is also known as Vitamin A, and vitamin B12)—were positively correlated, with statistical significance, with voxel-wise tissue densities (Fig. 4). Of those 6 nutrients, all 4 omega-3 fatty acids demonstrated similar spatial patterns; retinol, the predominant form of vitamin A, and vitamin B12 had smaller net volume effects. No nutrients were found negatively correlated, with statistical significance, with RAVENS values at any brain locations.
Figure 3.
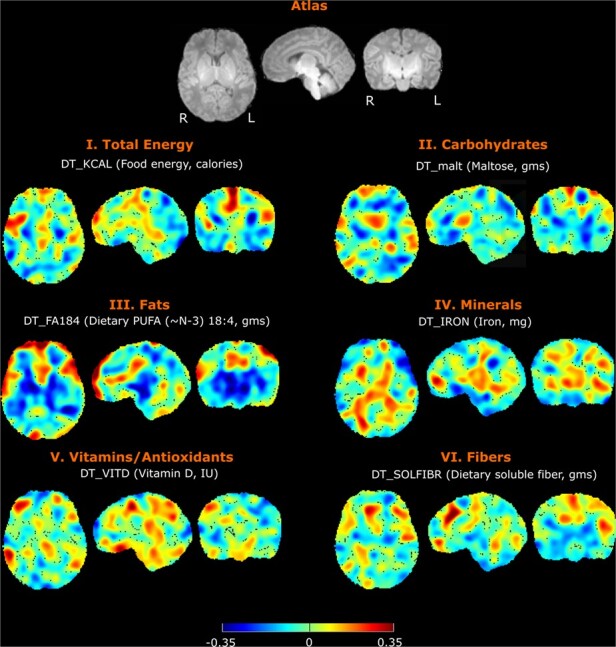
Correlation between infant brain voxel-wise tissue densities and maternal intake of example nutrients from each category. Note that the correlations in the figure are examples before the FDR correction for multiple testing. Results that remain significant after FDR correction will be shown in Figure 4. Total calories, maltose, SDA, iron, vitamin D, and soluble fiber correlations are depicted. For each nutrient, there are representative axial, sagittal, and coronal views at the same level. Directionality and strength of nominal correlations are denoted by color, with key at the bottom of the figure.
Figure 4.
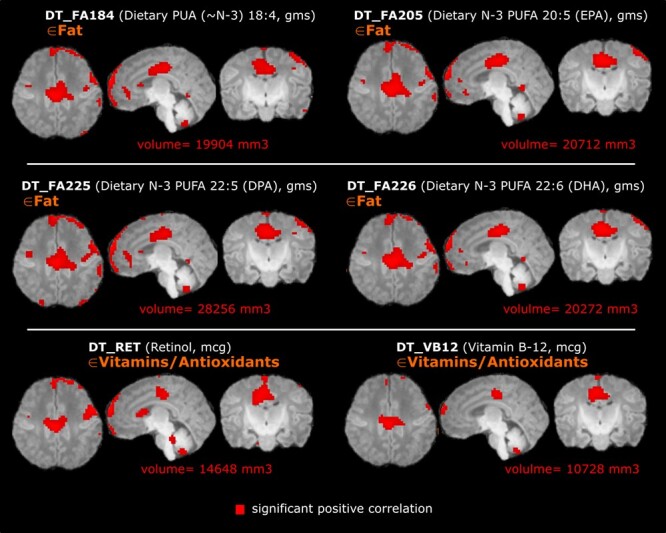
Infant brain voxel-wise relative volumes (RAVENS values, normalized by the intracranial volume) positively correlated with maternal nutrient intake, after the FDR correction and after controlling for postmenstrual age and sex. For each nutrient there are representative axial, sagittal, and coronal views at the same level. Four omega-3 fatty acids—SDA (FA184), EPA (FA205), DPA (FA225), and DHA (FA226)—as well as retinol (RET, aka Vitamin A) and Vitamin B12 (VB12) were positively correlated with absolute brain volume in the regions highlighted in red. Total volume increase is listed below each series of images; there were no significantly negatively correlated volumes.
Discussion
Our goal was to identify nutrients that are significantly associated with early-life brain morphometry. Such nutrients would be candidates to optimize in maternal or infant diets in order to improve neurodevelopment. We examined correlations between 73 major nutrients from 6 major nutrient categories and 61 autosegmented brain regions in 3D that cover the full brain. This regional analysis identified no significant correlations between nutrients and regional brain volumes after correction for multiple comparisons, suggesting that the effect of nutrients may exist in subregions or smaller clusters of voxels potentially across regions. To test this hypothesis, we used relative volume ratios at the voxel level (RAVENS values) to avoid segmentation error or arbitrary regional assignments. Using this approach, increased relative volume (RAVENS value) was observed in the subregions of frontal cortex and corpus callosum in subjects whose mothers had higher omega-3 fatty acid, retinol (vitamin A), and vitamin B12 acid intake. This statistically significant correlation persisted after correction for postmenstrual age and sex, as well as correction for testing of multiple nutrients and multiple brain regions. DHA is the most abundant omega-3 fatty acid in the neonatal brain, and prior to routine supplementation of formula with DHA, it was found that breastfed infants accumulated greater amounts of DHA in frontal cortex than those fed formula (Martinez 1992; Makrides et al. 1994). While DHA is obtained from the diet, it can be synthesized from other omega-3 fatty acids including ALA, SDA, EPA, and DPA. There has been particular attention to the potential benefit of dietary or supplemental omega-3 fatty acids on neurodevelopment. Initial studies in term infants suggested a benefit of omega-3 fatty acid supplementation on visual acuity, but more recent systematic reviews emphasize the lack of consistent demonstration of benefit (Simmer 2001; Jasani et al. 2017). Although a recent randomized control study of 53 infants at risk for developmental delay identified no statistically significant benefit from 2 years of supplementation (Andrew et al. 2018), another randomized study of omega-3 supplementation in toddlers demonstrated a positive correlation between red blood cell levels of omega-3 fatty acid and cognitive scores at 24 months in males (Devlin et al. 2017). This may be mediated in part by genetic influences on the efficacy of omega-3 fatty acids, or because of different forms of omega-3 fatty acids administered to mothers or directly to infants (Innis 2014; Cheatham et al. 2015; Lupu et al. 2015; Scholtz et al. 2015; Yeates et al. 2015; Ding et al. 2016; Tam et al., 2016a; Devlin et al. 2017). Here, the positive correlation between maternal omega-3 fatty acid intake and regional brain volume in breastfed infants supports the efficacy of supplementation to breastfeeding mothers. Importantly, the omega-3 fatty acids remained significantly correlated with infant brain volumes though the quantitative and spatial effects were reduced for all omega-3 fatty acids other than SDA. Future studies in the area are planned, reflecting a fundamental expectation that nutritional optimization can improve neurodevelopment (Gould et al. 2018)
Nutrition has a profound impact on infant development, though our understanding of the precise impact of maternal diet on infant development remains incomplete. It is known that dietary macronutrient intake such as that of protein has a significant effect on overall growth in very low birth-weight infants (Tonkin et al. 2014). Deficiency of micronutrients, such as vitamin D or iron, is associated with infantile disorders such as rickets and neurodevelopmental impairment (Morse 2012; Angulo-Barroso et al. 2016; Algarin et al. 2017; Santos et al. 2018). Improved knowledge of the role that specific nutrients have in neurodevelopment of term infants without a specific dietary deficiency would allow for population-based interventions to improve health and outcomes on a large scale. To best design future studies, use of a proximal marker, such as brain volumes on MRI, may be helpful in determining the necessary dose and timing of supplementation. MRI biomarkers have great potential to identify specific effects of nutrient dose and timing by providing brain structure and growth measures before nuanced neurodevelopmental testing is age appropriate. For example, if nutrients such as omega-3 fatty acids are beneficial for frontal cortex growth during the first month of life, that effect may be difficult to identify at 5 years of age after many other modifiers of brain growth have subsequently modified frontal cortex development. MRI-based identification of critical periods for the effect of specific nutrients will result in a more complete understanding of the temporally specific roles that dietary nutrients play in the complex process of brain development. Additionally, in the above example, patients who already have decreased frontal cortex thickness may be more likely to benefit from omega-3 supplementation, such that MRI characterization of brain phenotypes can help with population risk stratification. Finally, there are likely to be genetic or other factors that modify the ability of a specific nutrient to change brain structure, and delineation of responsive and nonresponsive cohorts will allow for determination of such factors.
Existing nutrition-MRI studies are mostly confined to either older adults (>65 years of age) or preterm infants, but not term-born infants. The older populations are outside the critical period of infantile neurodevelopment and do not inform approaches for optimizing neurodevelopmental outcomes. In preterm infants, who face nutritional deficits in combination with other risks to neurodevelopment, early postnatal growth failure has been associated with decreased fractional anisotropy on MRI, reflecting a reduction in brain microstructure (Keunen et al. 2015). Observational studies of preterm infant born at 24–32 weeks of gestational age correlated higher omega-3 fatty acid concentrations with lower rates of intraventricular hemorrhage and improved neurodevelopmental outcomes at 30–36 months (Tam et al. 2016b). Early enrichment of preterm infant diets with high-nutrient supplements was associated with improved verbal intelligence and significant increases in brain volume as adolescents (Isaacs et al. 2008). However, supplementation of maternal or infant diets with omega-3 fatty acids has not demonstrated consistent neurodevelopmental benefits at school age (Smith and Rouse 2017). Other specific nutrients have also been implicated as modulators of neurodevelopment in preterm infants, as those supplemented with glutamine were found to have increased fractional anisotropy and increased brain volumes compared to controls (de Kieviet et al. 2012). However, the effect of glutamine was believed to be indirect and due to a lower infection rate in the treated cohort. Many additional candidate supplements have failed to have demonstrable benefits to neurodevelopment on meta-analysis of studies, likely due to the complex neurodevelopmental risks faced by the many preterm infants.
Term infants can face many of the same risks to neurodevelopment as preterm infants, such as infection or nutrient deficiency, but have different trajectories of brain development (Georgieff 2007; Deoni 2018). Despite these differences, many of the same factors have been shown to affect MRI measures of brain growth. For example, term infants with intrauterine growth restriction have reduced hippocampal volumes (Lodygensky et al. 2008). However, a comprehensive study of the effects of maternal diet on neonatal brain development in term infant via MRI has not been reported. This is an important gap in our knowledge of neurodevelopment as the vast majority of infants are born at term. The current cross-sectional and structural MRI study is the first step toward future time-series and multiparametric MRI studies of the effects of nutrition on neurodevelopment.
Additional studies to delineate the relative contributions of in utero and postnatal maternal nutrition to fetal brain development are necessary to better understand when maternal nutritional interventions could be effective in improving infant neurodevelopment. To begin to address the potential role of postnatal maternal nutrient transfer, we performed a subcohort analysis of the 54 mother–infant dyads that were 100% breastfed, which validated the positive correlation between maternal intake of omega-3 fatty acids—SDA (FA184), EPA (FA205), DPA (FA225), and DHA (FA226)—and infant brain volumes in the frontal cortex and corpus callosum. However, the magnitude of volume effects was smaller for this subcohort, indicating that maternal omega-3 intake may have larger effects among infants receiving some formula in their diet. By contrast, vitamin A and vitamin B12 were no longer significant among exclusively breastfed individuals. Though maternal vitamin A deficiency is known to affect breast milk concentration of Vitamin A, early breast milk has very high concentrations of vitamins A and B12 so the effects of maternal intake may be less likely to affect milk concentrations in the first months of breastfeeding (Stoltzfus and Underwood 1995; Dror and Allen 2018). Conversely, maternal intake of vitamin B12 has not been demonstrated to be consistently correlated with breast milk concentrations, such that maternal intake may have less influence during breastfeeding compared to during gestation (Dror and Allen 2018). We anticipate future larger scale studies to quantify how the proportion of breast milk modifies the correlation between maternal nutrition and infant development, correlations between maternal diet and breast milk contents, as well as the relative influences of nutrition during pregnancy and postnatal maternal nutrition.
Strengths of the current study include hypothesis-free, data-driven, large-scale exploration of MRI-nutrition correlations; the use of automated MRI segmentation; the relatively large cohort size; and the homogenous patient population. Our analysis thoroughly examined the correlations of values of 73 nutrients and volumes of 61 brain regions, whereas existing studies typically quantified the association between a single or just few nutrients with only very few ROIs. The subsequent exploration of correlation between 73 nutrients and relative volumes (RAVENS values) at ~ 500 000 voxels in the brain MRI, which has not been previously reported in MRI-nutrient studies, allowed us to avoid segmentation error and arbitrariness and to find significantly correlated subregions or cluster of voxels that span several brain anatomical regions.
It is worthwhile to clarify some components in the approach. RAVENS value is a measure of relative density or relative volume at a voxel. It is relative to an atlas. Loosely speaking, when the subject image is deformed into the atlas, it quantifies how many voxels in the subject image will be mapped into a unit voxel in the atlas image at every voxel in the atlas image. Due to its sensitivity at the voxel level and its being free from regional segmentations, RAVENS values have found successful applications in many childhood and adult morphometry studies (Tisserand et al. 2002; Ashburner et al. 2003; Resnick et al. 2003; Rojas et al. 2006; Koutsouleris et al. 2009; Davatzikos et al. 2014; Hartung et al. 2015). Also, our data include gestational age, mother age, mother ethnicity/race, mother race, family income, and other socioeconomic status (SES) factors, which will be accounted for as covariates in our future studies. Combining all these factors in a unified multivariate machine learning framework, our future work will identify how to change nutrition at the individual level to affect MRI-manifested brain development.
Limitations include the use of reported diet, as discrepancies have been noted between reported nutritional intake and prevalence of associated nutrient deficiencies (Bailey et al. 2017). However, these approaches have been validated in the past to be both accurate and reliable over time. Furthermore, we examined only single correlations between nutrients and MRI features, though it may be that nutrients act in combination to enact biological changes during brain development. Future multivariate analysis will further explore the more likely scenario that multiple nutrients affect multiple brain regions. As infant nutrition is also influenced by in utero nutrient transfer, assessment of maternal nutrition during pregnancy is an important area for future study. Maternal nutritional status has many well-defined effects on birth outcomes and fetal growth (Abu-Saad and Fraser 2010). Future work also includes correlating among maternal dietary patterns, maternal milk nutrients, and infant brain MRI. This will help establish a pathway to better understand how to optimize diet to impact on milk components that are key to infant brain development. Also, our measures were obtained at a single point in time, though ongoing work will include using time-series to better understand the temporal effects of nutrients in the brain development trajectory. Next, socioeconomic factors are potential modifiers for the maternal nutrient and infant brain relationship. In this study, we did not find significant correlation of maternal race, maternal ethnicity, maternal education, and family income with any of the nutrients or any of the volume measurement in the regional or voxel level. Adding these SES variables as covariates did not change the findings in Figures 3, 4 or Supplementary Figure 2. This might be because that our cohort was more homogenous in many features than the national population. The demographics of our cohort (>80% non-Hispanic including ~ 60% Caucasian in the whole cohort; > 40% with Master’s or Doctoral degrees; delivery at an average of 32 years of age; ~ 50% with a family income $100 000 or more) differ from the national average. Next steps will include application of our analytical method to a more representative cohort. In addition, we only found significant correlation between nutrition and MRI morphometry, but it is not yet clear how morphometry patterns (e.g., greater or smaller subregional volume) correlate with neurocognitive development. Also morphometry (volume) of brain MRI is only one metric, our future study will more thoroughly study maternal diet’s effects on surface area, cortical thickness, as well as diffusion directionality and magnitude at the regional level, voxel level, and along whiter matter fiber tracts and major fiber bundles. Finally, in our partial correlation, we controlled for postmenstrual age and sex but not for parental intelligence quotient or SES measures, as these measures were fairly consistent throughout this cohort. In future studies, we will also consider other covariates previously demonstrated to impact neurodevelopment.
Conclusions
We found that increased maternal intake of omega-3 fatty acids was positively correlated with increased infant brain voxel volumes predominantly in the frontal lobes and corpus callosum in term infants. This finding indicates that providing mothers with supplemental omega-3 fatty acids might positively influence development in these brain regions. Future studies are needed to determine if these volumetric differences are associated with differences in neurodevelopmental outcomes. In addition, future studies that include more diverse socioeconomic and ethnic groups are needed to elucidate the relative contributions of, and interactions between, nutrition and non-nutritional factors in infant neurodevelopment.
Funding
Abbott Nutrition provided funding for this study through the Center for Nutrition, Learning, and Memory at the University of Illinois at Urbana-Champaign.
Notes
We thank Thrasher Research Fund Career Development Award and Boston Children’s Hospital Faculty Development Award to Y.O. We thank Marie Drottar, Thea Francel, Alana Matos, and Clarissa Carruthers for assistance with study management and subject recruitment. Conflict of Interest: MJK and JBL are employees of the study sponsor. No other authors have any conflicts of interest to declare.
Supplementary Material
References
- Abu-Saad K, Fraser D. 2010. Maternal nutrition and birth outcomes. Epidemiol Rev. 32:5–25. doi: 10.1093/epirev/mxq001. [DOI] [PubMed] [Google Scholar]
- Algarin C, Karunakaran KD, Reyes S, Morales C, Lozoff B, Peirano P, Biswal B. 2017. Differences on brain connectivity in adulthood are present in subjects with iron deficiency anemia in infancy. Front Aging Neurosci. 9:54. doi: 10.3389/fnagi.2017.00054. [DOI] [PMC free article] [PubMed] [Google Scholar]
- Almaas AN, Tamnes CK, Nakstad B, Henriksen C, Walhovd KB, Fjell AM, Due-Tonnessen P, Drevon CA, Iversen PO. 2015. Long-chain polyunsaturated fatty acids and cognition in VLBW infants at 8 years: an RCT. Pediatrics. 135:972–980. doi: 10.1542/peds.2014-4094. [DOI] [PubMed] [Google Scholar]
- Andrew MJ, Parr JR, Montague-Johnson C, Laler K, Holmes J, Baker B, Sullivan PB. 2018. Neurodevelopmental outcome of nutritional intervention in newborn infants at risk of neurodevelopmental impairment: the dolphin neonatal double-blind randomized controlled trial. Dev Med Child Neurol. 60:897–905. doi: 10.1111/dmcn.13914. [DOI] [PubMed] [Google Scholar]
- Angulo-Barroso RM, Li M, Santos DCC, Bian Y, Sturza J, Jiang Y, Kaciroti N, Richards B, Lozoff B. 2016. Iron supplementation in pregnancy or infancy and motor development: a randomized controlled trial. Pediatrics. 137:e20153547. doi: 10.1542/peds.2015-3547. [DOI] [PMC free article] [PubMed] [Google Scholar]
- Anjos T, Altmäe S, Emmett P, Tiemeier H, Closa-Monasterolo R, Luque V, Wiseman S, Pérez-García M, Lattka E, Demmelmair Het al. 2013. Nutrition and neurodevelopment in children: focus on NUTRIMENTHE project. Eur J Nutr. 52(8):1825–1842. doi: 10.1007/s00394-013-0560-4. [DOI] [PubMed] [Google Scholar]
- Apovian CM, Murphy MC, Cullum-Dugan D, Lin PH, Gilbert KM, Coffman G, Jenkins M, Bakun P, Tucker KL, Moore TJ. 2010. Validation of a web-based dietary questionnaire designed for the DASH (dietary approaches to stop hypertension) diet: the DASH online questionnaire. Public Health Nutr. 13:615–622. doi: 10.1017/S1368980009991996. [DOI] [PMC free article] [PubMed] [Google Scholar]
- Ashburner J, Csernansky JG, Davatzikos C, Fox NC, Frisoni GB, Thompson PM. 2003. Computer-assisted imaging to assess brain structure in healthy and diseased brains. Lancet Neurol. 2(2):79–88. doi: 10.1016/S1474-4422(03)00304-1. [DOI] [PubMed] [Google Scholar]
- Bailey RL, Fulgoni VL, Taylor CL, Pfeiffer CM, Thuppal SV, McCabe GP, Yetley EA. 2017. Correspondence of folate dietary intake and biomarker data. Am J Clin Nutr. 105:1336–1343. doi: 10.3945/ajcn.116.148775. [DOI] [PMC free article] [PubMed] [Google Scholar]
- Belfort MB, Ehrenkranz RA. 2017. Neurodevelopmental outcomes and nutritional strategies in very low birth weight infants. Semin Fetal Neonatal Med. 22:42–48. doi: 10.1016/j.siny.2016.09.001. [DOI] [PubMed] [Google Scholar]
- Block G, Hartman AM, Dresser CM, Carroll MD, Gannon J, Gardner L. 1986. A data-based approach to diet questionnaire design and testing. Am J Epidemiol. 124:453–469. doi: 10.1093/oxfordjournals.aje.a114416. [DOI] [PubMed] [Google Scholar]
- Block G, Woods M, Potosky A, Clifford C. 1990. Validation of a self-administered diet history questionnaire using multiple diet records. J Clin Epidemiol. 43:1327–1335. doi: 10.1016/0895-4356(90)90099-B. [DOI] [PubMed] [Google Scholar]
- Cade J, Thompson R, Burley V, Warm D. 2002. Development, validation and utilisation of food-frequency questionnaires—a review. Public Health Nutr. 5:567–587. doi: 10.1079/PHN2001318. [DOI] [PubMed] [Google Scholar]
- Catena A, Angela Muñoz-Machicao J, Torres-Espínola FJ, Martínez-Zaldívar C, Diaz-Piedra C, Gil A, Haile G, Gyorei E, Molloy AM, Decsi Tet al. 2016. Folate and long-chain polyunsaturated fatty acid supplementation during pregnancy has long-term effects on the attention system of 8.5-y-old offspring: a randomized controlled trial. Am J Clin Nutr. 103:115–127. doi: 10.3945/ajcn.115.109108. [DOI] [PubMed] [Google Scholar]
- Cheatham CL, Lupu DS, Niculescu MD. 2015. Genetic and epigenetic transgenerational implications related to omega-3 fatty acids. Part II: maternal FADS2 rs174575 genotype and DNA methylation predict toddler cognitive performance. Nutr Res. 35:948–955. doi: 10.1016/j.nutres.2015.09.005. [DOI] [PubMed] [Google Scholar]
- Coviello C, Keunen K, Kersbergen KJ, Groenendaal F, Leemans A, Peels B, Isgum I, Viergever MA, De Vries LS, Buonocore Get al. 2018. Effects of early nutrition and growth on brain volumes, white matter microstructure, and neurodevelopmental outcome in preterm newborns. Pediatr Res. 83:102–110. doi: 10.1038/pr.2017.227. [DOI] [PubMed] [Google Scholar]
- Davatzikos C, Da X, Toledo JB, Zee J, Wolk DA, Xie SX, Ou Y, Shacklett A, Parmpi P, Shaw Let al. 2014. Integration and relative value of biomarkers for prediction of MCI to AD progression: spatial patterns of brain atrophy, cognitive scores, APOE genotype and CSF biomarkers. NeuroImage Clin. 4:164–173. doi: 10.1016/j.nicl.2013.11.010. [DOI] [PMC free article] [PubMed] [Google Scholar]
- Davatzikos C, Genc A, Xu D, Resnick SM. 2001. Voxel-based morphometry using the RAVENS maps: methods and validation using simulated longitudinal atrophy. Neuroimage. 14:1361–1369. doi: 10.1006/nimg.2001.0937. [DOI] [PubMed] [Google Scholar]
- de Kieviet JF, Oosterlaan J, Vermeulen RJ, Pouwels PJW, Lafeber HN, Elburg RM. 2012. Effects of glutamine on brain development in very preterm children at school age. Pediatrics. 130:e1121–e1127. doi: 10.1542/peds.2012-0928. [DOI] [PubMed] [Google Scholar]
- Deoni SCL. 2018. Neuroimaging of the developing brain and impact of nutrition. Nestle Nutrition Institute workshop series. S. Karger AG, Basel, 155–174. doi: 10.1159/000486500. [DOI] [PubMed] [Google Scholar]
- Deoni SCL, Dean DC, Piryatinsky I, O’Muircheartaigh J, Waskiewicz N, Lehman K, Han M, Dirks H. 2013. Breastfeeding and early white matter development: a cross-sectional study. Neuroimage. 82:77–86. doi: 10.1016/j.neuroimage.2013.05.090. [DOI] [PMC free article] [PubMed] [Google Scholar]
- Devlin A, Chau C, Dyer R, Matheson J, McCarthy D, Yurko-Mauro K, Innis S, Grunau R. 2017. Developmental outcomes at 24 months of age in toddlers supplemented with Arachidonic acid and Docosahexaenoic acid: results of a double blind randomized, controlled trial. Nutrients. 9:975. doi: 10.3390/nu9090975. [DOI] [PMC free article] [PubMed] [Google Scholar]
- Ding Z, Liu G-L, Li X, Chen X-Y, Wu Y-X, Cui C-C, Zhang X, Yang G, Xie L. 2016. Association of polyunsaturated fatty acids in breast milk with fatty acid desaturase gene polymorphisms among Chinese lactating mothers. Prostaglandins Leukot Essent Fat Acids. 109:66–71. doi: 10.1016/j.plefa.2016.03.009. [DOI] [PubMed] [Google Scholar]
- Dobbing J. 1977. Nutrition and the developing brain. Nature. 266:751–751. doi: 10.1038/266751a0. [DOI] [Google Scholar]
- Doshi J, Erus G, Ou Y, Gaonkar B, Davatzikos C. 2013. Multi-atlas skull-stripping. Acad Radiol. 20:1566–1576. doi: 10.1016/j.acra.2013.09.010. [DOI] [PMC free article] [PubMed] [Google Scholar]
- Doshi J, Erus G, Ou Y, Resnick SM, Gur RC, Gur RE, Satterthwaite TD, Furth S, Davatzikos C. 2016. MUSE: multi-atlas region segmentation utilizing ensembles of registration algorithms and parameters, and locally optimal atlas selection. Neuroimage. 127:186–195. doi: 10.1016/j.neuroimage.2015.11.073. [DOI] [PMC free article] [PubMed] [Google Scholar]
- Dror DK, Allen LH. 2018. Vitamin B-12 in human Milk: a systematic review. Adv Nutr Int Rev J. 9:358S–3665S. doi: 10.1093/advances/nmx019. [DOI] [PMC free article] [PubMed] [Google Scholar]
- Ekici F, Tekbas G, Hattapoğlu S, Yaramış A, Önder H, Bilici A. 2016. Brain MRI and MR spectroscopy findings in children with nutritional vitamin B12 deficiency. Clin Neuroradiol. 26:215–220. doi: 10.1007/s00062-014-0351-1. [DOI] [PubMed] [Google Scholar]
- Erus G, Battapady H, Satterthwaite TD, Hakonarson H, Gur RE, Davatzikos C, Gur RC. 2015. Imaging patterns of brain development and their relationship to cognition. Cereb Cortex. 25:1676–1684. doi: 10.1093/cercor/bht425. [DOI] [PMC free article] [PubMed] [Google Scholar]
- Freedman ND, Curto TM, Lindsay KL, Wright EC, Sinha R, Everhart JE, HALT-C TRIAL GROUP . 2011. Coffee consumption is associated with response to peginterferon and ribavirin therapy in patients with chronic hepatitis C. Gastroenterology. 140:1961–1969. doi: 10.1053/j.gastro.2011.02.061. [DOI] [PMC free article] [PubMed] [Google Scholar]
- Georgieff MK. 2007. Nutrition and the developing brain: nutrient priorities and measurement 1-3 Michael K Georgieff. Am J Clin Nutr. 85:614–620. doi: 10.1093/ajcn/85.2.614S. [DOI] [PubMed] [Google Scholar]
- Gould JF, Colombo J, Collins CT, Makrides M, Hewawasam E, Smithers LG. 2018. Assessing whether early attention of very preterm infants can be improved by an omega-3 long-chain polyunsaturated fatty acid intervention: a follow-up of a randomised controlled trial. BMJ Open. 8:e020043. doi: 10.1136/bmjopen-2017-020043. [DOI] [PMC free article] [PubMed] [Google Scholar]
- Goyal MS, Venkatesh S, Milbrandt J, Gordon JI, Raichle ME. 2015. Feeding the brain and nurturing the mind: linking nutrition and the gut microbiota to brain development. Proc Natl Acad Sci USA. 112:14105–14112. doi: 10.1073/pnas.511465112. [DOI] [PMC free article] [PubMed] [Google Scholar]
- Gu Y, Vorburger RS, Gazes Y, Habeck CG, Stern Y, Luchsinger JA, Manly JJ, Schupf N, Mayeux R, Brickman AM. 2016. White matter integrity as a mediator in the relationship between dietary nutrients and cognition in the elderly. Ann Neurol. 79:1014–1025. doi: 10.1002/ana.24674. [DOI] [PMC free article] [PubMed] [Google Scholar]
- Hartert TV, Carroll K, Gebretsadik T, Woodward K, Minton P. 2010. The Tennessee children’s respiratory initiative: objectives, design and recruitment results of a prospective cohort study investigating infant viral respiratory illness and the development of asthma and allergic diseases. Respirology. 15:691–699. doi: 10.1111/j.1440-1843.2010.01743.x. [DOI] [PMC free article] [PubMed] [Google Scholar]
- Hartung EA, Laney N, Kim JY, Ruebner RL, Detre JA, Liu HS, Davatzikos C, Erus G, Doshi JJ, Schultz RTet al. 2015. Design and methods of the NiCK study: neurocognitive assessment and magnetic resonance imaging analysis of children and young adults with chronic kidney disease. BMC Nephrol. 16:66. doi: 10.1186/s12882-015-0061-1. [DOI] [PMC free article] [PubMed] [Google Scholar]
- Innis SM. 2014. Impact of maternal diet on human milk composition and neurological development of infants. Am J Clin Nutr. 99:734S–741S. doi: 10.3945/ajcn.113.072595. [DOI] [PubMed] [Google Scholar]
- Isaacs EB. 2013. Neuroimaging, a new tool for investigating the effects of early diet on cognitive and brain development. Front Hum Neurosci. 7:1–12. doi: 10.3389/fnhum.2013.00445. [DOI] [PMC free article] [PubMed] [Google Scholar]
- Isaacs EB, Gadian DG, Sabatini S, Chong WK, Quinn BT, Fischl BR, Lucas A. 2008. The effect of early human diet on caudate volumes and IQ. Pediatr Res. 63:308–314. doi: 10.1203/PDR.0b013e318163a271. [DOI] [PubMed] [Google Scholar]
- Jasani B, Simmer K, Patole SKS, Rao SCS. 2017. Long chain polyunsaturated fatty acid supplementation in infants born at term. Cochrane Database Syst Rev. 3, Art. No.: CD000376). doi: 10.1002/14651858.CD000376.pub4.www.cochranelibrary.com. [DOI] [PMC free article] [PubMed] [Google Scholar]
- Keunen K, Elburg RM, Bel F, Benders MJNLNL. 2015. Impact of nutrition on brain development and its neuroprotective implications following preterm birth. Pediatr Res. 77:148–155. doi: 10.1038/pr.2014.171. [DOI] [PMC free article] [PubMed] [Google Scholar]
- Koutsouleris N, Meisenzahl EM, Davatzikos C, Bottlender R, Frodl T, Scheuerecker J, Schmitt G, Zetzsche T, Decker P, Reiser Met al. 2009. Use of neuroanatomical pattern classification to identify subjects in at-risk mental states of psychosis and predict disease transition. Arch Gen Psychiatry. 66:700–712. doi: 10.1001/archgenpsychiatry.2009.62. [DOI] [PMC free article] [PubMed] [Google Scholar]
- Krebs NF, Lozoff B, Georgieff MK. 2017. Neurodevelopment: the impact of nutrition and inflammation during infancy in low-resource settings. Pediatrics. 139:S50–S58. doi: 10.1542/peds.2016-2828G. [DOI] [PubMed] [Google Scholar]
- Kumar RK, Singhal A, Vaidya U, Banerjee S, Anwar F, Rao S. 2017. Optimizing nutrition in preterm low birth weight infants—consensus summary. Front Nutr. 4:20. doi: 10.3389/fnut.2017.00020. [DOI] [PMC free article] [PubMed] [Google Scholar]
- Lauer A, Da X, Hansen MB, Boulouis G, Ou Y, Cai X, Liberato Celso Pedrotti A, Kalpathy-Cramer J, Caruso P, Hayden DLet al. 2017. ABCD1 dysfunction alters white matter microvascular perfusion. Brain. 140:3139–3152. doi: 10.1093/brain/awx262. [DOI] [PMC free article] [PubMed] [Google Scholar]
- Laurberg P, Andersen SL. 2014. Nutrition: breast milk—a gateway to iodine-dependent brain development. Nat Rev Endocrinol. 10:134–135. doi: 10.1038/nrendo.2014.3. [DOI] [PubMed] [Google Scholar]
- Leermakers ET, Darweesh SK, Baena CP, Moreira EM, Melo van Lent D, Tielemans MJ, Muka T, Vitezova A, Chowdhury R, Bramer WMet al. 2016. The effects of lutein on cardiometabolic health across the life course: a systematic review and meta-analysis. Am J Clin Nutr. 103(2):481–494. doi: 10.3945/ajcn.115.120931. [DOI] [PubMed] [Google Scholar]
- Lodygensky GA, Seghier ML, Warfield SK, Tolsa CB, Sizonenko S, Lazeyras F, Hüppi PS. 2008. Intrauterine growth restriction affects the preterm infant’s hippocampus. Pediatr Res. 63:438–443. doi: 10.1203/PDR.0b013e318165c005. [DOI] [PubMed] [Google Scholar]
- Luby JL, Belden AC, Whalen D, Harms MP, Barch DM. 2016. Breastfeeding and childhood IQ: the mediating role of Gray matter volume. J Am Acad Child Adolesc Psychiatry. 55:367–375. doi: 10.1016/j.jaac.2016.02.009. [DOI] [PMC free article] [PubMed] [Google Scholar]
- Lupu DS, Cheatham CL, Corbin KD, Niculescu MD. 2015. Genetic and epigenetic transgenerational implications related to omega-3 fatty acids. Part I: maternal FADS2 genotype and DNA methylation correlate with polyunsaturated fatty acid status in toddlers: an exploratory analysis. Nutr Res. 35:939–947. doi: 10.1016/j.nutres.2015.09.004. [DOI] [PubMed] [Google Scholar]
- Makrides M, Neumann MA, Byard RW, Simmer K, Gibson RA. 1994. Fatty acid composition of brain, retina, and erythrocytes in breast- and formula-fed infants. Am J Clin Nutr. 60:189–194. doi: 10.1093/ajcn/60.2.189. [DOI] [PubMed] [Google Scholar]
- Martinez M. 1992. Tissue levels of polyunsaturated fatty acids during early human development. J Pediatr. 120:S129–S138. [DOI] [PubMed] [Google Scholar]
- McGarel C, Pentieva K, Strain JJ, McNulty H. 2015. Emerging roles for folate and related B-vitamins in brain health across the lifecycle. Proc Nutr Soc. 74:46–55. doi: 10.1017/S0029665114001554. [DOI] [PubMed] [Google Scholar]
- Meldrum S, Simmer K. 2016. Docosahexaenoic acid and neurodevelopmental outcomes of term infants. Ann Nutr Metab. 69:23–28. doi: 10.1159/000448271. [DOI] [PubMed] [Google Scholar]
- Miller J, Tonkin E, Damarell RA, McPhee AJ, Suganuma M, Suganuma H, Middleton PF, Makrides M, Collins CT. 2018. A systematic review and meta-analysis of human milk feeding and morbidity in very low birth weight infants. Nutrients. 10(6):707. doi: 10.3390/nu10060707. [DOI] [PMC free article] [PubMed] [Google Scholar]
- Moore K, Hughes CF, Ward M, Hoey L, McNulty H. 2018. Diet, nutrition and the ageing brain: current evidence and new directions. Proc Nutr Soc. 77:152–163. doi: 10.1017/S0029665117004177. [DOI] [PubMed] [Google Scholar]
- Morse NL. 2012. Benefits of docosahexaenoic acid, folic acid, vitamin D and iodine on foetal and infant brain development and function following maternal supplementation during pregnancy and lactation. Nutrients. 4(7):799–840. doi: 10.3390/nu4070799. [DOI] [PMC free article] [PubMed] [Google Scholar]
- Nassar R, Kaczkurkin AN, Xia CH, Sotiras A, Pehlivanova M, Moore TM, Garcia de La Garza A, Roalf DR, Rosen AFG, Lorch SAet al. 2018. Gestational age is dimensionally associated with structural brain network abnormalities across development. Cereb. Cortex. . doi: 10.1093/cercor/bhy091. [DOI] [PMC free article] [PubMed] [Google Scholar]
- Ou Y, Akbari H, Bilello M, Da X, Davatzikos C. 2014. Comparative evaluation of registration algorithms in different brain databases with varying difficulty: results and insights. IEEE Trans Med Imaging. 33:2039–2065. doi: 10.1109/TMI.2014.2330355. [DOI] [PMC free article] [PubMed] [Google Scholar]
- Ou Y, Gollub RL, Retzepi K, Reynolds N, Pienaar R, Pieper S, Murphy SN, Grant PE, Zöllei L. 2015. Brain extraction in pediatric ADC maps, toward characterizing neuro-development in multi-platform and multi-institution clinical images. Neuroimage. 122:246–261. doi: 10.1016/j.neuroimage.2015.08.002. [DOI] [PMC free article] [PubMed] [Google Scholar]
- Ou Y, Sotiras A, Paragios N, Davatzikos C. 2011. DRAMMS: deformable registration via attribute matching and mutual-saliency weighting. Med Image Anal. 15:622–639. doi: 10.1016/j.media.2010.07.002. [DOI] [PMC free article] [PubMed] [Google Scholar]
- Ou Y, Zöllei L, Da X, Retzepi K, Murphy SN, Gerstner ER, Rosen BR, Grant PE, Kalpathy-Cramer J, Gollub RL. 2018. Field of view normalization in multi-site brain MRI. Neuroinformatics. 16:431–444. doi: 10.1007/s12021-018-9359-z. [DOI] [PMC free article] [PubMed] [Google Scholar]
- Ou Y, Zöllei L, Retzepi K, Castro V, Bates SV, Pieper S, Andriole KP, Murphy SN, Gollub RL, Grant PE. 2017. Using clinically acquired MRI to construct age-specific ADC atlases: quantifying spatiotemporal ADC changes from birth to 6-year old. Hum Brain Mapp. 38:3052–3068. doi: 10.1002/hbm.23573. [DOI] [PMC free article] [PubMed] [Google Scholar]
- Payne ME, Steck SE, George RR, Steffens DC. 2012. Fruit, vegetable, and antioxidant intakes are lower in older adults with depression. J Acad Nutr Diet. 112:2022–2027. doi: 10.1016/j.jand.2012.08.026. [DOI] [PMC free article] [PubMed] [Google Scholar]
- Pepper MR, Black MM. 2011. B12 in fetal development. Semin Cell Dev Biol. 22(6):619–623. doi: 10.1016/j.semcdb.2011.05.005. [DOI] [PubMed] [Google Scholar]
- Perrone S, Tei M, Longini M, Buonocore G. 2016. The multiple facets of lutein: a call for further investigation in the perinatal period. Oxid Med Cell Longev. 2016, 5381540 doi: 10.1155/2016/5381540. [DOI] [PMC free article] [PubMed] [Google Scholar]
- Pinto ALR, Ou Y, Sahin M, Grant PE. 2018. Quantitative apparent diffusion coefficient mapping may predict seizure onset in children with Sturge-weber syndrome. Pediatr Neurol. 84:32–38. doi: 10.1016/j.pediatrneurol.2018.04.004. [DOI] [PMC free article] [PubMed] [Google Scholar]
- Plumptre L, Masih SP, Sohn K-J, Kim D, Visentin CE, Ly A, Berger H, Croxford R, O’Connor DL, Kim Y-I. 2018. Suboptimal maternal and cord plasma pyridoxal 5′ phosphate concentrations are uncommon in a cohort of Canadian pregnant women and newborn infants. Matern Child Nutr. 14:e12467. doi: 10.1111/mcn.12467. [DOI] [PMC free article] [PubMed] [Google Scholar]
- Potischman N, Cohen BE, Picciano MF. 2006. Dietary recommendations and identified research needs for the National Children’s study. J Nutr. 136:686–689. doi: 10.1093/jn/136.3.686. [DOI] [PubMed] [Google Scholar]
- Prado EL, Dewey KG. 2014. Nutrition and brain development in early life. Nutr Rev. 72:267–284. doi: 10.1111/nure.12102. [DOI] [PubMed] [Google Scholar]
- Resnick SM, Pham DL, Kraut MA, Zonderman AB, Davatzikos C. 2003. Longitudinal magnetic resonance imaging studies of older adults: a shrinking brain. J Neurosci. 23:3295–3301. 23/8/3295 [pii]. [DOI] [PMC free article] [PubMed] [Google Scholar]
- Rojas DC, Peterson E, Winterrowd E, Reite ML, Rogers SJ, Tregellas JR. 2006. Regional gray matter volumetric changes in autism associated with social and repetitive behavior symptoms. BMC Psychiatry. 6(56). doi: 10.1186/1471-244X-6-56. [DOI] [PMC free article] [PubMed] [Google Scholar]
- Santos DCC, Angulo-Barroso RM, Li M, Bian Y, Sturza J, Richards B, Lozoff B. 2018. Timing, duration, and severity of iron deficiency in early development and motor outcomes at 9 months. Eur J Clin Nutr. 72:332–341. doi: 10.1038/s41430-017-0015-8. [DOI] [PMC free article] [PubMed] [Google Scholar]
- Scholtz SA, Kerling EH, Shaddy DJ, Li S, Thodosoff JM, Colombo J, Carlson SE. 2015. Docosahexaenoic acid (DHA) supplementation in pregnancy differentially modulates arachidonic acid and DHA status across FADS genotypes in pregnancy. Prostaglandins Leukot Essent Fat Acids. 94:29–33. doi: 10.1016/j.plefa.2014.10.008. [DOI] [PMC free article] [PubMed] [Google Scholar]
- Simmer K. 2001. Baycol label 2000.pdf. Cochrane Database Syst Rev. 4, CD000376. doi: 10.1002/14651858.CD000376. [DOI] [Google Scholar]
- Sizonenko SV, Babiloni C, De Bruin EA, Isaacs EB, Jönsson LS, Kennedy DO, Latulippe ME, Hasan Mohajeri M, Moreines J, Pietrini Pet al. 2013. Brain imaging and human nutrition: which measures to use in intervention studies? Br J Nutr. 110(S1):S1–S30. doi: 10.1017/S0007114513001384. [DOI] [PubMed] [Google Scholar]
- Smith SL, Rouse CA. 2017. Docosahexaenoic acid and the preterm infant. Matern Heal Neonatol Perinatol. 3:22. doi: 10.1186/s40748-017-0061-1. [DOI] [PMC free article] [PubMed] [Google Scholar]
- Stoltzfus RJ, Underwood BA. 1995. Breast-milk vitamin a as an indicator of the vitamin a status of women and infants. Bull World Health Organ. 73:703–711. [PMC free article] [PubMed] [Google Scholar]
- Subar AF, Thompson FE, Kipnis V, Midthune D, Hurwitz P, McNutt S, McIntosh A, Rosenfeld S. 2001. Comparative validation of the Block, Willett, and National Cancer Institute food frequency questionnaires: the eating at America’s table study. Am J Epidemiol. 154:1089–1099. doi: 10.1093/aje/154.12.1089. [DOI] [PubMed] [Google Scholar]
- Tam EWY, Chau V, Barkovich AJ, Ferriero DM, Miller SP, Rogers EE, Grunau RE, Synnes AR, Xu D, Foong Jet al. 2016. Early postnatal docosahexaenoic acid levels and improved preterm brain development. Pediatr Res. 79:723–730. doi: 10.1038/pr.2016.11. [DOI] [PMC free article] [PubMed] [Google Scholar]
- Tan M, Abernethy L, Cooke R. 2008. Improving head growth in preterm infants—a randomised controlled trial II: MRI and developmental outcomes in the first year. Arch Dis Child Fetal Neonatal Ed. 93:342–346. doi: 10.1136/adc.2007.124255. [DOI] [PubMed] [Google Scholar]
- Tisserand DJ, Pruessner JC, Sanz Arigita EJ, Van Boxtel MPJ, Evans AC, Jolles J, Uylings HBM. 2002. Regional frontal cortical volumes decrease differentially in aging: an MRI study to compare volumetric approaches and voxel-based morphometry. Neuroimage. 17:657–669. doi: 10.1016/S1053-8119(02)91173-0. [DOI] [PubMed] [Google Scholar]
- Tonkin EL, Collins CT, Miller J. 2014. Protein intake and growth in preterm infants. Glob Pediatr Heal. 1:1–20. doi: 10.1177/2333794X14554698. [DOI] [PMC free article] [PubMed] [Google Scholar]
- Tustison NJ, Avants BB, Cook PA, Zheng Y, Egan A, Yushkevich PA, Gee JC. 2010. N4ITK: improved N3 bias correction. IEEE Trans Med Imaging. 29:1310–1320. doi: 10.1109/TMI.2010.2046908. [DOI] [PMC free article] [PubMed] [Google Scholar]
- Walker SP, Wachs TD, Grantham-Mcgregor S, Black MM, Nelson CA, Huffman SL, Baker-Henningham H, Chang SM, Hamadani JD, Lozoff Bet al. 2011. Inequality in early childhood: risk and protective factors for early child development. Lancet. 378:1325–1338. doi: 10.1016/S0140-6736(11)60555-2. [DOI] [PubMed] [Google Scholar]
- Wang H, Yushkevich PA. 2013. Multi-atlas segmentation with joint label fusion and corrective learning-an open source implementation. Front Neuroinform. 7:27. doi: 10.3389/fninf.2013.00027. [DOI] [PMC free article] [PubMed] [Google Scholar]
- Willet WC, Sampson L, Stampfer MJ, Rosner B, Bain C, Witschi J, Hennekens CH, Speizer FE. 2017. Reproducibility and validity of a semiquantitative food frequency questionnaire. Am J Epidemiol. 185:1109–1123. doi: 10.1093/aje/kwx107. [DOI] [PubMed] [Google Scholar]
- Yeates AJ, Love TM, Engström K, Mulhern MS, McSorley EM, Grzesik K, Alhamdow A, Wahlberg K, Thurston SW, Davidson PWet al. 2015. Genetic variation in FADS genes is associated with maternal long-chain PUFA status but not with cognitive development of infants in a high fish-eating observational study. Prostaglandins Leukot Essent Fat Acids. 102–103:13–20. doi: 10.1016/j.plefa.2015.08.004. [DOI] [PMC free article] [PubMed] [Google Scholar]
- Zamroziewicz MK, Paul EJ, Zwilling CE, Johnson EJ, Kuchan MJ, Cohen NJ, Barbey AK. 2016. Parahippocampal cortex mediates the relationship between lutein and crystallized intelligence in healthy, older adults. Front Aging Neurosci. 8:297. doi: 10.3389/fnagi.2016.00297. [DOI] [PMC free article] [PubMed] [Google Scholar]
- Zamroziewicz MK, Paul EJ, Zwilling CE, Barbey AK. 2017a. Predictors of memory in healthy aging: polyunsaturated fatty acid balance and fornix white matter integrity. Aging Dis. 8:372–383. doi: 10.14336/AD.2017.0501. [DOI] [PMC free article] [PubMed] [Google Scholar]
- Zamroziewicz MK, Talukdar MT, Zwilling CE, Barbey AK. 2017b. Nutritional status, brain network organization, and general intelligence. Neuroimage. 161:241–250. doi: 10.1016/j.neuroimage.2017.08.043. [DOI] [PubMed] [Google Scholar]
Associated Data
This section collects any data citations, data availability statements, or supplementary materials included in this article.