

SUMMARY
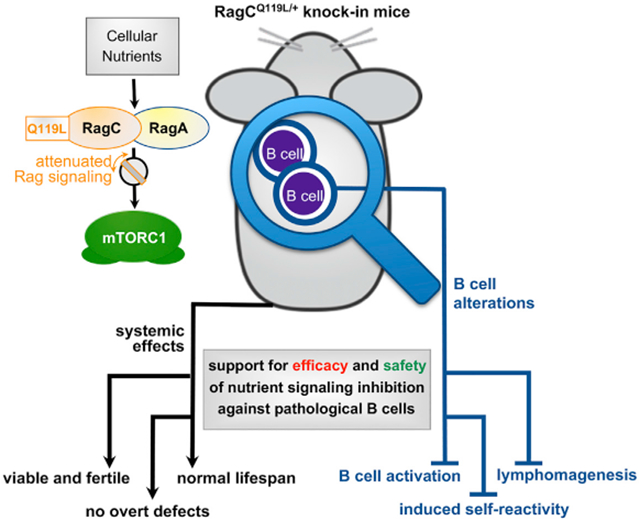
B lymphocytes are exquisitely sensitive to fluctuations in nutrient signaling by the Rag GTPases, and 15% of follicular lymphomas (FLs) harbor activating mutations in RRAGC. Hence, a potential therapeutic approach against malignant B cells is to inhibit Rag GTPase signaling, but because such inhibitors are still to be developed, efficacy and safety remain unknown. We generated knockin mice expressing a hypomorphic variant of RagC (Q119L); RagCQ119L/+ mice are viable and show attenuated nutrient signaling. B lymphocyte activation is cell-intrinsically impaired in RagCQ119L/+ mice, which also show significant suppression of genetically induced lymphomagenesis and autoimmunity. Surprisingly, no overt systemic trade-offs or phenotypic alterations caused by partial suppression of nutrient signaling are seen in other organs, and RagCQ119L/+ mice show normal longevity and normal age-dependent health decline. These results support the efficacy and safety of moderate inhibition of nutrient signaling against pathological B cells.
Graphical abstract
In brief
By generating knockin mice expressing a hypomorphic variant of the RagC GTPase, Ortega-Molina et al. show that partial inhibition of nutrient signaling may be a safe and efficacious approach against pathogenic B cells and B cell lymphomas.
INTRODUCTION
Activation of B lymphocytes during the humoral response elicits a sudden proliferation with multiple rounds of division (Mesin et al., 2016; Victora and Nussenzweig, 2012). Such bursts are energetically onerous, and the master regulator of anabolism, mechanistic target of rapamycin complex 1 (mTORC1), is activated immediately after B cell activation, enabling cellular biomass accumulation before proliferation (Ersching et al., 2017). mTORC1 integrates inputs from growth factors and cytokines via the phosphatidylinositol 3-kinase (PI3K)-Akt signaling pathway and from cellular nutrient sufficiency via the Rag family of GTPases (Saxton et al., 2016; Shimobayashi and Hall, 2014; Valvezan and Manning, 2019). We have shown previously that B cells are particularly sensitive to dynamic control of nutrient signaling during activation, presumably because adequate sensing of nutrient sufficiency is key to ensure accomplishment of these onerous rounds of proliferation (Ersching et al., 2017). The exquisite effect and relevance of nutrient signaling for B cells is best exemplified by the exclusivity of nutrient signaling mutations in B cell lymphomas, particularly in follicular lymphoma (FL) (Green et al., 2015; Okosun et al., 2016; Ying et al., 2016).
FL is the second most frequent form of non-Hodgkin’s lymphoma and remains incurable (Kahl and Yang, 2016; Matasar et al., 2019). FL cells derive from B cells that have participated in a transient anatomical structure involved in the humoral response, known as the germinal center (GC) reaction, which enables production of high-affinity antibodies by iterative rounds of a two-step process consisting of affinity-based selective activation of antibody-producing B cells, followed by proliferation and antibody diversification (Bannard and Cyster, 2017; Mesin et al., 2016; Shlomchik and Weisel, 2012; Tas et al., 2016). Most FLs harbor a reciprocal translocation that juxtaposes the gene encoding the anti-apoptotic protein Bcl2 under the regulatory sequences of IGH, and additional genetic lesions include recurrent mutations in epigenetic modulators, in genes involved in interaction with the microenvironment (Huet et al., 2018; Matasar et al., 2019), and in genes responsible for signaling of cellular nutrient sufficiency to mTORC1 (Green et al., 2015; Kridel et al., 2016; Okosun et al., 2016; Ying et al., 2016). Mutations in nutrient signaling components upstream of mTORC1 occur in approximately 15% of individuals with FL and most frequently consist of point activating mutations in RRAGC, encoding the RagC GTPase. Rag GTPases exist in the cell as obligate heterodimeric complexes composed of RagA (or RagB) and RagC (or RagD), and in the presence of plentiful nutrient levels, RagA undergoes guanosine triphosphate (GTP) loading, and RagC loads guanosine diphosphate (GDP). This nucleotide configuration allows binding and recruitment of mTORC1 to the outer lysosomal surface, an essential step for kinase activation.
Ever since identification of the Rag GTPase pathway, there has been a relentless interest in potential therapeutic targeting of nutrient signaling as a strategy to selectively control mTORC1 activity (Chung et al., 2019; Kang et al., 2019; Sengupta et al., 2019). However, several questions regarding therapeutic targeting of nutrient signaling remain unanswered. (1) What would be a suitable indication for use of nutrient signaling inhibitors? (2) What extent of nutrient signaling inhibition would be efficacious and safe? In this regard, genetic elimination of Rag GTPase complexes is incompatible with embryonic development (Efeyan et al., 2014; Kim et al., 2014), and acute deletion causes rapid loss of the B cell lineage and also affects rapidly proliferative epithelial cells. But small-molecule-mediated targeting would result in partial inhibition, in contrast to acute genetic deletion. Whether a milder inhibition of nutrient signaling would result in effective versus on-target toxic and in what cell type or organ has not yet been determined.
We generated mice endogenously expressing a mutant variant of RagC (RagCQ119L) that signals low levels of nutrients to mTORC1. Endogenous, heterozygous expression of RagCQ119L shows a modest inhibitory effect in mTORC1 but impairs B cell activation upon immunization, GC formation, and plasma cell (PC) production. In the FL-prone background VavP-Bcl2 (Egle et al., 2004), expression of RagCQ119L suppresses lymphomagenesis and autoreactivity. Although efficacious to restrain B cell lymphomagenesis, expression of RagCQ119L appears to be innocuous because whole-body expression of the RagCQ119L variant did not compromise survival; neither did it affect age-dependent health decline or the prevalence or severity of aging-related pathologies.
RESULTS
RagCQ119L/+ knockin mice show a mild reduction in mTORC1 activity
We used CRISPR-Cas9 genome engineering (Wang et al., 2013) to generate Rragc knockin mice with a point mutation in the Rragc gene encoding a hypomorphic RagC GTPase variant locked in a GTP-like state (RagCQ119L) (Sancak et al., 2008; Shen et al., 2017; Figure S1A). Homozygous RagCQ119L/Q119L mice were never found by breeding heterozygous progenitors (Figure S1B and S1C), consistent with the in utero lethality observed in mice with genetic loss of the Rag GTPase complex (Efeyan et al., 2014; Kim et al., 2014). Heterozygous RagCQ119L/+ mice were obtained at Mendelian ratios (Figure S1D), were macroscopically normal, and showed no overt differences in body weight or in organ weight after sacrifice (Figure 1A).
Figure 1. RagCQ119L/+ knockin mice show a mild reduction in mTORC1 activity in vitro and in vivo.

(A) Left: body weight of RagC+/+ (n = 11) and RagCQ119L/+ (n = 10) males, and RagC+/+ (n = 9) and RagCQ119L/+ (n = 12) females. Center: tissue weights of RagC+/+ (n = 5) and RagCQ119L/+ (n = 4) males and RagC+/+ (n = 4) and RagCQ119L/+ (n = 5) females. Right: spleen weights of RagC+/+ (n = 5) and RagCQ119L/+ (n = 4) males and RagC+/+ (n = 16) and RagCQ119L/+ (n = 17) females. All mice were 7–8 week old.
(B) Percentage of the indicated cell populations in the spleen of 2- to 3-month-old RagC+/+ (n = 9) and RagCQ119L/+ (n = 9) males. Neu, neutrophil; Mon, monocyte; NK, natural killer; Eos, eosinophil; DC, dendritic cell; Macroph, macrophage.
(C) MEFs from RagC+/+ and RagCQ119L+ mice were deprived of all amino acids in RPMI medium for 45 min and re-stimulated with amino acids for 5, 10, and 20 min.
(D) Primary hepatocytes from RagC+/+ and RagCQ119L+ females were deprived of all amino acids in DMEM/F12 for 1 h and re-stimulated with amino acids for the indicated times.
(C and D) Whole-cell protein lysates were immunoblotted for the indicated proteins.
(E) Quantification of mTORC1 activity in naive B cells (B220+ GL7−CD95−), GC B cells (B220+ gated, GL7+, and CD95+), and PCs (B220low and CD138+ gated), revealed by intracellular phospho-S6 staining 10 days after immunization with SRBCs of 7- to 8-week-old RagC+/+ (n = 11) and RagCQ119L/+ (n = 13) mice. MFI, median florescence intensity.
(F) Graphical representation of the false discovery rates (FDRs) from the indicated KEGG, Hallmark, REACTOME, and curated gene sets depleted (blue) and enriched (red) in RagCQ119L/+ (n = 4) versus RagC+/+ (n = 4) GC B cells.
Bars in (A), (B), and (E) indicate the mean ± SD. Statistical significance in (A), (B), and (E) was calculated by two-tailed Student’s t test.
To assess potential consequences of the expression of this mutation in bone marrow (BM)-derived cells, we quantified the proportions of mature populations of the hematopoietic lineage in the blood and spleen. Lymphoid and myeloid populations were present in RagCQ119L/+ mice at frequencies similar to those of wild-type counterparts in the blood (Figure S1E) and spleen (Figure 1B; Figure S1F). In addition, similar numbers of stem cells and lymphoid and myeloid progenitors were found in BM from RagC+/+ and RagCQ119L/+ mice (Figure S1G). Together with analysis of subpopulations of splenic B cells (marginal zone, transitional, and follicular B cells; Figure S1H), these data show that heterozygous expression of RagCQ119L/+ has no effect on maturation of BM-derived cells.
We next assessed the effect of endogenous expression of RagCQ119L on nutrient-mediated regulation of the mTORC1 pathway in mouse embryonic fibroblasts (MEFs). Amino acid starvation followed by acute stimulation with amino acids at different times (Figure 1C; quantification in Figure S1I) resulted in a minimal but evident decrease in phosphorylation of the canonical mTORC1 target S6K1 in RagCQ119L/+ MEFs compared with RagC+/+ cells. A modest impairment of activation of mTORC1 in RagCQ119L/+ cells is also seen as a decreased fraction of the up-shifted (phosphorylated) band of Transcription Factor EB (TFEB), another target of mTORC1, upon re-stimulation (Figure 1C; Figure S1I). Similarly, primary hepatocytes derived from RagCQ119L/+ mice showed a similar mild but consistent decrease in mTORC1 activity (Figure 1D; Figure S1J).
We next determined mTORC1 activity in different subpopulations of B cells (naive, GC B cells, and PCs) in vivo from RagC+/+ and RagCQ119L/+ mice immunized with sheep red blood cells (SRBCs). MTORC1 activity was reduced significantly in naive B cells, GC B cells, and PCs (Figure 1E; Figures S1K and S1L) from RagCQ119L/+ mice, as revealed by intracellular staining of S235/236-phospho-S6. RNA sequencing of GC B cells from immunized RagC+/+ and RagCQ119L/+ mice showed minimal differences in gene expression (Table S1), which included signatures associated with reduced mTORC1 activity in RagCQ119L/+ mice, such as reduced translation and ribosome signatures, a reduction in c-myc target genes, depletion of genes upregulated in RRAGCmut individuals with FL, and enrichment of genes downregulated in RagCS74C/+ GC B cells (Figure 1F; Figure S1M).
We conclude that suppression of mTORC1 signaling by heterozygous expression of RagCQ119L is innocuous or at least of minimal effect in vivo and causes a modest decrease in activation of mTORC1 by nutrients.
RagCQ119L/+ mice show a B-cell-intrinsic impaired humoral response in vitro and in vivo
We have determined previously that genetic activation of the Rag GTPase pathway has different effects in the humoral response, depending on the strength of signaling activation (Ersching et al., 2017; Ortega-Molina et al., 2019). Thus, the effect of heterozygous expression of the hypomorphic RagCQ119L mutation could have on B cell functions was unpredictable. We induced GC formation in RagCQ119L/+ mice by intraperitoneal injection of SRBC, followed by analysis of several markers of the humoral response (Figure S2A). We observed a two-thirds reduction in GC cells and GC size in vivo (Figures 2A and 2B; Figures S2B and S2C) in RagCQ119L/+ mice, with normal GC B cell proliferation in vivo (Figure S2D) and a negligible effect on the GC dark zone/light zone ratio (Figure S2E). Such an impaired GC response correlated with decreased PC production (Figure 2C; Figure S2F), and also decreased was the abundance of class-switched immunoglobulin G1 (IgG1)+-producing RagCQ119L/+ PCs and total IgG1+ GC B cells (Figure 2D; Figure S2G). As expected by the reduction in PC numbers, titers of IgM and IgG1 antibodies were decreased in sera from immunized RagCQ119L/+ mice (Figures 2E and 2F). Marginal zone, transitional, and follicular B cell subpopulations remained unchanged in immunized RagQ119L/+ mice (Figure S2H). Follicular helper T and follicular regulatory T cell numbers were normal in immunized RagCQ119L/+ mice (Figure S2I and S2J), suggesting that inhibition of nutrient signaling does not compromise B cell activation indirectly by affecting the GC T cell microenvironment. Consistently, ex vivo activation of isolated naive B cells with anti-CD40 and interleukin-4 (IL-4) replicated the impaired B cell activation observed in vivo: RagCQ119L/+ B cells showed reduced class-switch recombination (CSR) (Figure 2G; Figure S2K) and reduced cell proliferation in vitro, measured by decay of Carboxyfluorescein succinimidyl ester (CFSE) (Figure 2H; Figure S2L). In contrast, in vitro stimulation of T cells with anti-CD3 and anti-CD28 yielded identical percentages of activated T cells (Figures S2M and S2N).
Figure 2. Diminished humoral response in RagCQ119L/+ mutant mice.

(A) Representative flow cytometry plots (left; B220+ gated, GL7+, and CD95+) and their quantification (right) of GC B cells in spleens harvested from 7- 13-week-old RagC+/+ (n = 6) and RagCQ119L/+ (n = 7) females 10 days after immunization with SRBCs.
(B) Immunohistochemistry (IHC) staining of anti-Bcl6 (left) and quantification of GC area (right) in spleens harvested from immunized 7- to 8-week-old RagC+/+and RagCQ119L/+ mice. Scale bar, 200 μm.
(C) Representative flow cytometry plots (top; B220low and CD138+) and quantification (bottom) of PCs from 7- to 13-week-old RagC+/+ (n = 6) and RagCQ119L/+ (n = 6) females 10 days after immunization.
(D) Quantification of IgG1+ cells in GC B cells (left) and PCs (right) in spleens harvested from 7- to 13-week-old RagC+/+ (n = 8) and RagCQ119L/+ (n = 12) mice 10 days after immunization.
(E and F) IgG1 (E) and IgM (F) quantification of sera from RagC+/+ (n = 10) and RagCQ119L/+ (n = 10) females before and 10 days after immunization, measured by ELISA.
(G) In vitro IgG1 CSR in B220+ cells from 2- to 4-month-old RagC+/+ (n = 5) and RagCQ119L/+ (n = 7) mice 4 days after stimulation with anti-CD40 and IL-4.
(H) Proliferation by CFSE decay in CD43− cells isolated from 2- to 3.5-month-old RagC+/+ (n = 7) and RagCQ119L/+ (n = 7) mice labeled with CFSE dye and cultured in the presence of anti-CD40 and IL-4 for 3 days. (B220+ gated).
(I and J) Quantification of CD45.2/.2:CD45.1/.2 ratio (I) and phosphorylation (J) of S6 (S235/236) in naive B cells (B220+CD95−GL7− gated), GC B cells (B220+CD95+GL7+gated), PCs (B220lowCD138+gated), and Tfh cells (CD4+PD1+CXCR5+ gated) in splenocytes harvested from mixed BM chimeras 10 days after immunization (n = 5 mice per genotype).
(K and L) Quantification of CD45.2/.2 gated GC B cells (B220+CD95+GL7+) (K) and PCs (B220lowCD138+) (L) in spleens collected from IghmμMT/μMT:RagC+/+ or IghrnμMT/μMT:RagCQ119L/+ mice 10 days after immunization (n = 4 mice per genotype).
Bars indicate the mean ± SD. Statistical significance in (A)–(I) and (J)–(L) was calculated by two-tailed Student’s t test. Statistical significance in (H) was determined using two-way ANOVA.
To provide additional support for the cell-intrinsic inability of RagCQ119L/+ B cells to unleash a humoral response and to assess whether RagCQ119L/+ B cells have a competitive disadvantage compared with RagC+/+, we performed competitive reconstitution of lethally irradiated hosts by co-injection of CD45.1/.2 RagC+/+ mixed with RagC+/+ or RagCQ119L/+ CD45.2/.2 BM cells at a 1:1 ratio (Figure S2O). Eight weeks after reconstitution, we monitored the relative abundance of CD45.2/.2 RagC+/+ and RagCQ119L/+ naive B cells, which was at a 45:55 proportion with the competing CD45.1/.2 RagC+/+ cells, mildly but significantly different from the expected 50:50 proportion when assuming neutral competitiveness (Figure S2P). The RagCQ119L/+ monocytic population was also reduced in this competitive setting, whereas CD4+ and CD8+ T cells, neutrophils, and eosinophils showed a 1:1 ratio. Ten days after immunization with SRBCs, the relative abundance of RagCQ119L/+ GC B cells and PCs dropped to 20:80, whereas the T follicular helper (Tfh) cell population remained unaffected (Figure 2I). This result demonstrates the intrinsic inability of RagCQ119L/+ B cells to become activated, with normal responses of the RagC+/+ B cells coinhabiting the same immunized wild-type host. Importantly, the reduction in PC and GC RagCQ119L/+ populations occurred with decreased mTORC1 activity (Figure 2J). The in vitro activation and in vivo competition experiments show that heterozygous expression of RagCQ119L is inconsequential for B cell lineage development but confers on RagCQ119L/+ B cells a cell-intrinsic inability to become activated upon immunization.
To further confirm the B-cell-intrinsic nature of the decreased humoral response by expression of RagCQ119L, we undertook another genetic approach consisting of BM reconstitution of irradiated hosts with 90% IghmμMT/μMT hematopoietic stem cells (HSCs), which are unable to produce a B cell lineage (Kitamura et al., 1991), plus 10% of RagC+/+ or RagCQ119L/+ HSCs (Figure S2Q). With this approach, non-B cell populations derive almost exclusively from IghmμMT/μMT HSCs, whereas the B cell lineage is contributed entirely by RagCQ119L/+ progenitors (or RagC+/+, in control mice). When immunized with SRBCs, we observed that restricted expression of RagCQ119L/+ to B cells sufficed to impair GC development (Figure 2K) and PC production (Figure 2L), mirroring the impairment seen in RagCQ119L/+ mice. The in vitro and in vivo experiments show that the compromised humoral response in RagCQ119L/+ mice is B cell intrinsic.
RagCQ119L/+ mice exhibit delayed follicular lymphomagenesis
We next sought to determine whether moderate suppression of nutrient signaling could also suppress the oncogenicity caused by expression of VavP-Bcl2 (Egle et al., 2004). Indeed, FL and high-grade lymphoma development was delayed significantly in VavP-Bcl2Tg; RagCQ119L/+ mice (Figures 3A-3C), which correlated with smaller spontaneous GC formation and reduced SRBC-induced GC populations in young mice (Figures 3D and 3E; Figures S3A-S3C) and reduced incidence of FL measured at 250 days (Figure 3F). All tumors showed pathognomonic features of FL (Figure S3D) and a similar Ki67 proliferative index (Figure S3E).
Figure 3. Delayed lymphomagenesis by heterozygous expression of mutant RagC Q119L in mice.

(A) Kaplan-Meier survival curve of VavP-Bcl2tg; RagC+/+ (n = 23) and VavP-Bcl2tg; RagCQ119L/+ (n = 20) mice.
(B) Kaplan-Meier lymphoma survival curve of VavP-Bcl2tg; RagC+/+ (n = 23) and VavP-Bcl2tg; RagCQ119L/+ (n = 20) mice. All mice that developed FL were scored as 1.
(C) Kaplan-Meier high-grade lymphoma survival curve of VavP-Bcl2tg; RagC+/+ (n = 23) and VavP-Bcl2tg; RagCQ119L/+ (n = 20) mice. FL grade II, FL grade III, and diffused tumors were scored as 1, and mice bearing no FL, early FL, and FL grade I were scored as 0.
(D and E) Quantification of GC B cells in spleens harvested from unimmunized (D) and SRBC-immunized (E) RagC+/+ (n = 9 and 9) and RagCQ119L/+ (n = 9 and 9) mice.
(F) Incidence of FL in VavP-Bcl2tg; RagC+/+ (n = 15) and VavP-Bcl2tg; RagCQ119L/+ (n = 16) mice sacrificed at 250 days.
(G) Incidence of FL in cohorts at the humane endpoint (h.e.p.) shown in (B).
(H) Kaplan-Meier autoimmunity survival curves of VavP-Bcl2tg; RagC+/+ (n = 23) and VavP-Bcl2tg; RagCQ119L/+ (n = 20) mice. All mice that developed autoimmunity were scored as 1.
(I) Quantification of IgG1+ deposits in kidneys of VavP-Bcl2tg; RagC+/+ (n = 17) and VavP-Bcl2tg; RagCQ119L/+ (n = 17) mice.
(J) Enrichment of gene signatures related to genes involved in NF-κB signaling (left) and JAK-STAT signaling (right) in VavP-Bcl2tg; RagC+/+ (n = 4) versus VavP-Bcl2tg; RagCQ119L/+ (n = 5) FL B220+ sorted cells.
Statistical significance in (A)–(C) and (H) was calculated with a log-rank test. Statistical significance in (D) and (E) was calculated by two-tailed Student’s t test and in (F), (G), and (I) by Chi-square test. In (A-C) and (H): m, median survival
Although with delayed manifestation, the incidence and grade of FL at euthanasia were unaffected by endogenous heterozygous expression of the RagCQ119L variant in the presence of VavP-Bcl2Tg (Figure 3G), and so were the tumor burden (Figure S3F) and PD1+ microenvironment (Figure S3G), compared with VavP-Bcl2Tg ; RagC+/+ mice.
Importantly, not only was FL delayed by expression of the Q119L mutation but also the concomitant development of autoimmune disease (Figures 3H and 3I; Figure S3H), so both pathological outcomes of B cells expressing the Bcl2 transgene are partially prevented by mild impairment of nutrient signaling.
RNA sequencing analysis of sorted FL cells from VavP-Bcl2Tg; RagC+/+ and VavP-Bcl2Tg; RagCQ119L/+ tumor-bearing mice revealed changes in VavP-Bcl2Tg; RagCQ119L/+ samples of reduced mTORC1 activity, increased expression levels of TFEB targets, and depletion of genes upregulated in GCs and FLs from mice expressing the RagC mutant variants T89N and S74C, plus a reduction in glycolysis and robust signatures of suppressed activity of the oncogenic pathways nuclear factor κB (NF-κB) and Janus kinase (JAK)-signal transducer and activator of transcription (STAT) pathway (JAK-STAT) (Table S2; Figure 3J; Figures S3I-S3M).
These results show that moderate genetic inhibition of nutrient signaling suppresses pathological B cell activation and lymphomagenesis and suggest that mild inhibition of nutrient signaling achieved by restricting intake or with a pharmacological inhibitor targeting the nutrient signaling pathway could be efficacious to delay FL development and to restrain autoreactivity.
RagCQ119L/+ mice have a normal lifespan
The delayed lymphomagenesis in VavP-Bcl2Tg; RagCQ119L/+ mice suggests that even mild inhibition of the nutrient signaling pathway could be conceived as an intervention against aberrant B cell function, but its long-term effect or pleiotropic negative trade-off in other cells and organs could limit potential therapeutic benefits. Hence, to search for potential negative effects related to mild and chronic inhibition of nutrient signaling that may not manifest obviously early on but could affect health or survival later in life, we aged colonies of RagC+/+ and RagCQ119L/+ mice and determined their longevity, the probable cause of death, prevalence of common pathologies, and any unexpected phenotypic alterations. RagCQ119L/+ mice had a normal lifespan (Figure 4A; Figure S4A). Interestingly, the mean longevity of the oldest 20% of RagCQ119L/+ females was increased significantly (+9%, p = 0.035) (Figure S4A). Exhaustive anatomopathological examination of aged cohorts of RagC+/+ and RagCQ119L/+ mice revealed no differences in malignant tumor incidence or severity at euthanasia (Figure 4B). Excluding all mice that developed cancer, the longevity of RagCQ119L/+ mice was equal to that of RagC+/+ mice (Figure 4C). Furthermore, we measured well-known aging-related features and parameters of health decline in old RagCQ119L/+ mice (Bellantuono et al., 2020). RagCQ119L/+ mice presented equivalent increases in body weight during aging (Figure S4B) and similar glucose levels at old age compared with aged-matched RagC+/+ mice (Figure S4C), a similar decline in neuromuscular coordination as measured by tightrope assay and rotarod test (Figures 4D and 4E), and similar dermal skin thickness (Figure 4F). No changes in peripheral blood composition or differences in inflammatory cells in the spleen, with the exception of a small decrease in dendritic cells (DCs), were observed in old RagCQ119L/+ versus old RagC+/+ mice (Figure 4G; Figures S4D and S4E). RagCQ119L/+ 500-day-old males showed a slight increase in bone mineral density compared with old RagC+/+ mice (Figure 4H). Surrogate biochemical parameters of liver damage revealed no differences between genotypes at old age (Figure S4F) or differences in BM stem cell populations (Figure S4G). Finally, markers of age-associated senescence and a senescence-associated secretory phenotype (SASP) in kidneys from old RagCQ119L/+ and RagC+/+ mice were similar (Figures 4I and 4J). Thus, the multiparameter analysis of aged cohorts of RagCQ119L/+ mice revealed no effects of mild systemic chronic reduction of Rag GTPase signaling on longevity and age-related pathologies.
Figure 4. RagCQ119L/+ mice have a normal lifespan.

(A) Kaplan-Meier survival curves of RagC+/+ (n = 53) and RagCQ119L/+ (n = 69) mice (left), RagC+/+ (n = 27) and RagCQ119L/+ (n = 30) males (center), and RagC+/+ (n = 26) and RagCQ119L/+ (n = 39) females (right).
(B) Percentage of mice with no tumors, one malignant tumor, 2 tumors, and more than 2 tumors (from A).
(C) Kaplan-Meier survival curve of RagC+/+ (n = 17) and RagCQ119L/+ (n = 11) mice that were free of detectable malignant tumors at the time of death.
(D) Tightrope assay in 5-month-old (young) and 16- to 25-month-old RagC+/+ and RagCQ119L/+ mice.
(E) Time on the rotarod test, measured in the same mice as in (D).
(F) Dermal thickness in back skin from 25-month-old RagC+/+ (n = 4) and RagCQ119L/+ (n = 6) males.
(G) Percentage of the indicated cell populations in spleens of 25-month-old RagC+/+ (n = 4) and RagCQ119L/+ (n = 6) males.
(H) Bone mineral density (BMD) measured in 17- to 25-month-old RagC+/+ (n = 5) and RagCQ119L/+ (n = 5) males.
(I) Quantification of senescence associated-β-galactosidase (SA-β-gal)+ area within the kidney area of the mice shown in (H).
(J) qRT-PCR analysis of senescence-associated secretory phenotype (SASP) genes in the kidneys of the mice in (H) Statistical significance was determined using the Holm-Sidak method, with α = 0.05.
Statistical significance in (A) and (C) was calculated with a log rank test, in (B) by Chi-square test, in (D) by two-sided Fisher’s exact test, and in (E)–(I) by two-tailed Student’s t test. Bars in (E)–(J) indicate the mean ± SD.
The strong suppressive effects on pathogenic B cells without obvious negative trade-off effects in RagCQ119L/+ mice strongly support the efficacy and safety of nutrient signaling inhibitors against B cell pathologies.
DISCUSSION
Our results show that mild suppression of nutrient signaling, driven by expression of a hypomorphic mutant variant of the RagC GTPase under endogenous regulation in mice, has a significant suppressive effect on B cell activation and lymphomagenesis without compromising mouse physiology and longevity.
RagCQ119L/Q119L mice are not viable, consistent with the failure of embryonic development seen in RagA knockout and RagA/B double knockout mice (Efeyan et al., 2014; Kim et al., 2014). In contrast, RagCQ119L/+ mice showed minimal phenotypic alterations. This work and several previous efforts by us and others have shown that alterations in nutrient signaling preferentially affect B cells with minimal consequences for other cell types and organs. Acute genetic elimination of the heterodimeric Rag GTPase complex selectively suppresses B cell maturation without mirrored negative effects on T cell maturation (Do et al., 2020; Efeyan et al., 2014; Kalaitzidis et al., 2017; Kim et al., 2014). Conversely, genetic activation of RagA, conferring complete insensitivity to nutrient deprivation (de la Calle Arregui et al., 2021, Efeyan et al., 2013), results in compromised B cell activation upon immunization (Ersching et al., 2017). Milder activation of Rag GTPases in mice by heterozygous expression of mutant variants of RagC found in human B cell lymphomas results in accelerated lymphomagenesis and hyperactive B cells (Ortega-Molina et al., 2019). Sequencing efforts have identified that activating mutations in Rag GTPases are detected exclusively in GC lymphomas (Green et al., 2015; Kridel et al., 2016; Okosun et al., 2016; Ying et al., 2016). Although speculative, an appealing explanation for this uniqueness resides in the fact that naive B cells are among the smallest cells in the body, with minimal cytoplasmic content and, hence, limited anabolic capacity. Activation of the humoral response demands a rapid proliferative burst of GC B cells (Mesin et al., 2016; Victora and Nussenzweig, 2012). Only when a B cell has the building blocks and energy required for enduring the onerous process of anabolism can it successfully accomplish the rapid proliferative burst. Thus, nutrient sensing is critical to ensure that the anabolic demand is met by cellular nutrients.
Although rapalogs and ATP-competitive inhibitors can block mTORC1, partial blockade of some targets of mTORC1 by rapalogs and the on-target toxicity of blocking mTORC1 and mTORC2 by ATP-competitive inhibitors of mTOR demand additional approaches to selectively target all functions of mTORC1 (Saxton and Sabatini, 2017; Zoncu et al., 2011). Moderate suppression of mTORC1 signaling by expression of this hypomorphic variant suggests that even moderate pharmacological inhibition of Rag GTPases may be efficacious to functionally and selectively block mTORC1 activity in activated B cells. Such moderate suppression may be well-tolerated by other cells and organs and be efficacious and safe. Although suppressive effects of the Q119L variant of RagC on FL are consistent with potential efficacy of nutrient signaling inhibitors in B cell lymphomas, no acute genetic inhibition of RagC was feasible with this genetic system, so a tumor-suppressive function of decreased RagC signaling may also be related to a decreased pool of activated B cells susceptible to transformation.
The mTOR signaling pathway plays a significant role in longevity by regulating several hallmarks of aging (López-Otín et al., 2013; Singh et al., 2019). Work in yeast, worms, and mice with pharmacologic and genetic inhibition of mTORC1 supports a beneficial effect on longevity (Saxton and Sabatini, 2017; Singh et al., 2019). Hence, therapeutic inhibition of mTORC1 signaling has gathered a lot of attention as a promising anti-aging intervention. Moreover, one of the most efficient interventions against aging is restriction of dietary intake (dietary restriction, DR), and the beneficial effects of DR are thought to be, at least in part, due to inhibition of mTOR (Anderson et al., 2018; Gems and Partridge, 2013). Here we have shown that RagCQ119L/+ mice have normal longevity and similarly develop age-dependent health decline, according to several markers of aging (Bellantuono et al., 2020). We believe that these results do not contradict the notion of inhibition of mTORC1 to combat human aging. The effect of expression of RagCQ119L in heterozygosity results in only mild inhibition of nutrient signaling, and it is conceivable that a certain threshold of inhibition of mTORC1 signaling must be reached to reveal its longevity-promoting effects, as seen genetically in mice expressing a mTOR hypomorph allele (Wu et al., 2013) or in S6K1 homozygous knockout female mice (Selman et al., 2009). The life-extending effects of caloric restriction in C57BL/6 mice are only seen when the limitation exceeds 20% of the ad-libitum-ingested calories (Ingram and de Cabo, 2017; Liao et al., 2010; Mitchell et al., 2016). Hence, we postulate that mild inhibition of nutrient signaling has large consequences for active and pathological B cells, which are exquisitely sensitive, but may not reach the threshold of an inhibitory effect on mTORC1 for a systemic effect.
RagCQ119L/+ mice revealed that aberrant B cell activation and its pathological outcomes can be modulated by systemic moderate inhibition of nutrient signaling without prominent physiological trade-offs or undesired side effects.
STAR★METHODS
RESOURCE AVAILABILITY
Lead contact
Further information and requests for resources and reagents should be directed to and will be fulfilled by the Lead Contact, Alejo Efeyan (aefeyan@cnio.es).
Materials availability
Mouse lines generated in this study are available from the Lead Contact with a completed Materials Transfer Agreement.
Data and code availability
Sequence data that support the findings of this study have been deposited in GEO, with the accession codes GEO: GSE174004, GSE174003 and GSE173619. This work does not report original code. Any additional information required to reanalyze the data reported in this paper is available from the lead contact upon request.
EXPERIMENTAL MODEL AND SUBJECT DETAILS
All animal procedures carried out at the CNIO were performed according to protocols approved by the CNIO-ISCIII Ethics Committee for Research and Animal Welfare (CEIyBA). IghmμMT mice (Kitamura et al., 1991) were obtained from Jackson Laboratories (JAX stock #002288). VavP-Bcl2 mice (Egle et al., 2004) were obtained from Suzanne Cory Lab. The age and gender of all experimental mice are stated in each figure legend. Unless otherwise stated in the figure legends, males and females were used for the same experiment. Mice were housed under specific pathogen-free (SPF) conditions, at 22°C, and with 12-hr dark/light cycles (light cycle from 8:00am to 8:00pm). Mice were fed with a standard chow diet (Harlan Teklad 2018). All mice were observed weekly by trained personnel. Upon signs of morbidity, mice were closely inspected daily until application of Humane End Point (HEP) criteria (https://www.nationalacademies.org/global/ilar/Guide). From our experience, the humane end point is applied when the life expectancy of the mice is on average shorter than one week.
METHOD DETAILS
Generation of RagC Crispr-edited KI mice
To introduce the Q119L RRAGC mutation, mouse blastocysts were injected with the Cas9 mRNA, a single-guide RNA (sgRNA) targeting the sequence of interest (mouse Rragc), and a single-stranded DNA oligo (ssDNA) containing the desired mutation flanked by 40–60 bases homologous to the sequence adjoining the DNA double-strand break (DSB). Following clone selection, genotyping was performed by specific PCR followed by restriction fragment length polymorphisms (RFLP) or Sanger sequencing. For introducing the CAG to CTC mutation, translating into Q119L, we utilized a gRNA with the following sequence (in minus orientation): TCAAAGAAGTCCATCTGCCCAGG. A repair oligo consisted of single-stranded DNA with the CTC mutation plus additional silent mutations within the sequence used for the gRNA: ACTCATGGATTTTTTTGA.
Mouse experimentation
Immunizations
For the generation of GC response, 8-10 week old mice were immunized by intraperitoneal (i.p.) injection of (1x10⁹) Sheep Red Blood Cells (SRBC, Oxoid, #SR0053B) in PBS and analyzed at day 10. To measure proliferation in GC B cells, mice were immunized by intraperitoneal injection of (1x10⁹) SRBC, and after 10d, 2 hours prior to sacrifice, mice were intraperitoneal injected with 0.5 mg of EdU. Analysis of EdU incorporation was performed using the Click-iT® Plus EdU Alexa Fluor® 647 Flow Cytometry Assay Kit (Life Technologies, #C10634) following manufacturer instructions.
Metabolic parameters
Blood was collected from the tail tip to determine glucose levels using Accu-check Aviva glucose strips. Blood was collected from the sub-mandibular vein to measure white blood count determined by a blood cell counter (CVM LaserCell) and to measure ALT, BUN and cholesterol using VetScan mammalian liver profile rotors (Abaxis, # 500-0040-12).
Behavioral tests
For the tightrope assay, mice were placed on a bar of circular section (60 cm long and 1.5 cm diameter) and the test was considered successful when a mouse stayed on the bar for 60 s in a least one trial out of 5 consecutive trials (Ortega-Molina et al., 2012). The rotarod test was used to evaluate motor coordination and balance in mice. Tests were performed in a rotarod apparatus (Panlab model LE 8200) using a continuous acceleration protocol from 4 to 40 rpm in a period of 120 s. Time to fall was recorded, and the average of three trials was used in the quantification (Whittemore et al., 2019).
Signaling in mouse embryonic fibroblasts
Sub-confluent cell cultures were rinsed three times and were placed in RPMI without amino acids, supplemented with 10% dialyzed FBS, during 45 minutes. Re-stimulation with amino acids was performed for the indicated times with the concentration of amino acids present in RPMI.
Signaling in primary hepatocytes
Primary hepatocytes were cultured at a confluence of 300000 cells per well in collagen-coated (Sigma-Aldrich #C3867) multi six-well plates. After 6 hours the media was changed, and hepatocytes were cultured overnight before any experimental procedure. The next day, cells were rinsed three times and placed in DMEM:F12 without amino acids (USBiological Life Science #D9807-10) supplemented with 6mM NaHCO3 (Sigma #1063291000), 18mM HEPES pH 7.4 (Lonza #17-737E), 25 mM glucose (Sigma-Aldrich #G8769) and 10% dialyzed FBS during 1 hour. Re-stimulation with amino acids was performed for the indicated times.
Class-switch recombination in vitro
To study the process of class-switch recombination (CSR), we isolated CD43− resting B cells from non-immunized mice using magnetic beads, (Miltenyi Biotech #130-049-801) following manufacturer instructions. Cells were washed and resuspended in B cell medium (RPMI (Sigma #R8758) +10% FBS (Hyclone #SV30160.03) +55 μM β-mercaptoethanol (GIBCO, #31350-010) +10mM HEPES (Lonza #BE17-737E) +100ug/mL penicillin/streptomycin (GIBCO, #15070-063) containing 1ug/mL anti-CD40, (R&D Systems, #MAB440) and 25ng/mL mouse Interleukin-4 (R&D Systems, #404-ML). The culture medium was replenished every two days to avoid exhaustion. Four days later, cells were harvested and processed for flow cytometry analysis.
B cell proliferation
To study cell proliferation in activated B cells, CD43− resting B cells were labeled with 1.2 μM CFSE for 10 minutes (Life Technologies #C34554) following manufacturer instructions. This reagent monitors distinct generations of proliferating cells by a fluorescent dye dilution. Data were acquired at days 1 to 4 on a FACSCanto II (BD Biosciences) flow cytometer with 488nm excitation and an emission filter in the 530/30nm.
T cell activation and proliferation
To study T cell activation and proliferation, T cells were isolated from spleen of non-immunized mice using magnetic beads (Miltenyi Biotech, #130-104-454) following manufacturer instructions. To study T cell activation, 2x10⁶cells/ml of CD4+ T cells were seeded in an anti-CD3 (5 μg/ml; Tonbo Biosciences #40-0031) -coated plate and in the presence of anti-CD28 antibody (2 μg/ml; (Tonbo Biosciences, #40-0281) in culture medium (RPMI (Sigma #R8758) +10% FBS (Hyclone #SV30160.03) +55 μM β-mercaptoethanol (GIBCO, #31350-010) +10mM HEPES (Lonza #BE17-737E) +100 μg/mL penicillin/streptomycin (GIBCO, #15070-063)). To study cell proliferation in activated T cells, isolated CD4+ cells were labeled with 1.2 μM CFSE for 5 minutes (Life Technologies, #C34554) following manufacturer instructions. CD4+ T cells were analyzed at day 3 for activation and proliferation by flow cytometry.
Staining and flow cytometry analysis
Mononuclear cell pools were isolated from mouse spleens at the indicated times post-immunization. Cells were separated by crushing the spleens through a 70-micron mesh (Corning) in ice-cold PBS +0.1% BSA +3mM EDTA, and red blood cells were lysed using Erythrocyte Lysis Buffer (QIAGEN, #79217). Cell staining was performed on ice in PBS +0.1% BSA +3mM EDTA. We included a prior step of incubation with Fc-block Reagent (Anti-CD16/CD32, BD Pharmigen, #553142). GC B cells were identified within the B cell fraction (B220+) as GL7+ CD95+. Alternatively, GC B cells were identified within the CD19+ cell fraction, as CD95+CD38−. Plasma cells were identified by gating on CD138+, B220lo cells. T follicular helper cells (Tfh) were identified as B220−/CD4+/CXCR5+/PD-1+/Foxp3− and T follicular regulatory cells (Tfr) were identified as B220−/CD4+/CXCR5+/PD-1+/Foxp3+. DZ GC B cells were identified as CD19+/CD95+/CD38−/CXCR4+CD86lo while LZ GC B cells were identified as CD19+/CD95+/CD38−/CXCR4loCD86+. Follicular B cells were identified as Tcrb−/CD19+B220+/IgDhiIgMlo. Marginal zone and transitional type 1 (T1) B cells were identified (as one population) as Tcrb−/CD19+B220+/IgDloIgMhi, according to Béguelin et al. (2013). Transitional type 2 (T2) B cells were identified as Tcrb−/CD19+B220+/IgDhiIgMhi. Macrophages were identified as F/480+SSChi. NK cells were identified as F/480−B220−/CD3−/NK.1.1+. Dendritic cells were identified as F/480−B220−/CD3−/NK.1.1−/MHCII+/CD11c+. Neutrophils were identified as F/480−/B220−/CD3−/NK.1.1−/MHCII−/CD11c−CD11b+/Ly6G+. Monocytes were identified as F/480−/B220−/CD3−/NK.1.1−/MHCII−/CD11c−/CD11b+/Ly6G−/Ly6Clow or high. Eosinophils were identified as F/480−/B220−/CD3−/NK.1.1−/MHCII−/CD11c−/CD11b+Ly6G−/Ly6Cmed. For the detection of phosphorylated S235/236 of S6 with intracellular staining, cell suspensions were fixed and permeabilized using the Cytofix-Cytoperm and Cytoperm-Wash buffers (BD Biosciences, #554714) and subsequently stained for 120min at RT.
To investigate the hematopoietic stem cell populations in the bone marrow (BM), cells were collected from one femur and one tibiae. LT-HSCs were identified as Lineage−/IL7ra−/cKIT+/Sca1+/CD150+/CD48−. MPP1 cells were identified as Lineage−/IL7ra−/cKIT+/Sca1+/CD150−/CD48−. MPP2 cells were identified as Lineage−/IL7ra−/cKIT+/Sca1+/CD150+/CD48+. MPP3/4 cells were identified as Lineage−/IL7ra−/cKIT+/Sca1+/CD150−/CD48+.GMPcells were identified as Lineage−/IL7ra−/cKIT+/Sca1−/FcgRIIb+/CD34+. CMPcells were identified as Lineage−/IL7ra−/cKIT+/Sca1−/FcgRIIblo/CD34+. MEP cells were identified as Lineage−/IL7ra−/cKIT+/Sca1−/FcgRIIb−/CD34−.
All flow cytometry analyses were done at the Flow Cytometry Facility (CNIO), using BD LSR-Fortessa or BD CantoB cell analyzers, running BD FACSDiva software (BD Biosciences). FlowJo software (v 9.8.1 and v.10; TreeStar) was used for data analyses and plot rendering. See details on the gating strategies in Data S1.
Immunoblotting
Cells were rinsed once with ice-cold PBS and lysed in ice-cold lysis buffer (50 mM HEPES [pH 7.4], 40mM NaCl, 2mM EDTA, 1.5mM sodium orthovanadate, 50mM NaF, 10mM pyrophosphate, 10mM glycerophosphate, and 1% Triton X-100, and one tablet of EDTA-free complete protease inhibitors [Roche] per 25ml). Cell lysates were cleared by centrifugation at 13,000rpm for 10 min. Proteins extracts were denatured by the addition of sample buffer, boiled for 5min, resolved by SDS-PAGE, and analyzed by immunoblotting. Western blot analyses were performed according to standard procedures.
RNA extraction, cDNA synthesis and qRT-PCR
Total RNA was extracted from tissues or cells with TRIzol (Invitrogen, #15596026) according to manufactureŕs instructions. Isolated RNA was treated with DNase (QIAGEN, #79254) prior to cDNA synthesis. To perform cDNA synthesis, 1ug of RNA was retrotranscribed using SuperScript IV VILO Master Mix (Invitrogen, #11756500) following manufactureŕs instructions. Quantitative real time-PCR was performed using GoTaq® qPCR Master Mix (Promega #6001) in an QuantStudio 6 Flex Real-Time PCR System thermocycler (Applied Biosystems). Data were analyzed by the change-in-threshold (2−ΔΔCT) method, using β-actin as “housekeeping” reference gene. Results are represented as fold changes relative to the mean expression levels of the wild-type mice. Primers were designed using Primer3 Software (https://bioinfo.ut.ee/primer3-0.4.0/).
Gene expression profiling of GC B cells and FL
GC B cells (CD19+, CD95+,CD38−) were sorted from RagCQ119L/+ and RagC+/+ splenocytes after 12 d of SRBC immunization in a BD FACSAria Ilu (Becton Dickinson) and InFlux (Cytopeia-Becton Dickinson) cell sorters. For gene expression profiling of murine lymphomas, B220+ cells were isolated from mouse lymphoma tumors by immunomagnetic enrichment with CD45R (B220) microbeads (Miltenyi Biotech, #130-049-501).
Total RNA from sorted cells was extracted using TRIzol and PicoPure RNA Isolation kit (Arcturus, #12204-01) following the manufacturer’s instructions.
Total RNA samples were processed into cDNA sequencing libraries with the “QuantSeq 3’ mRNA-Seq Library Prep Kit (FWD) for Illuminaȝ (Lexogen, Cat.No. 015). Library generation is initiated by reverse transcription with oligodT priming, followed by a random-primed second strand synthesis. Primers from both steps contain Illumina-compatible sequences. Libraries are completed by PCR, and sequenced on an Illumina NextSeq 550 (with v2.5 reagent kits) by following manufacturer’s protocols. This library preparation kit generates directional libraries stranded in the sense orientation: the read1 (the only read in single read format) has the sense orientation. Eighty six-base-pair single-end sequenced reads followed adaptor and polyA tail removal as indicated by Lexogen. 20-25 million reads per sample were analyzed with the nextpresso (Graña et al., 2017) pipeline as follows: sequencing quality was checked with FastQCv0.11.0 (https://www.bioinformatics.babraham.ac.uk/projects/fastqc/). Reads were aligned to the mouse genome (GRCm38) with TopHat2 (Trapnell et al., 2012) using Bowtie (Langmead et al., 2009) and Samtools (Li et al., 2009), allowing 3 mismatches and 20 multi hits. The Gencode vM25 gene annotation for GRCm38 was used. Read counts were obtained with HTSeq (Anders et al., 2015). Differential expression and normalization was performed with DESeq2 (Love et al., 2014), keeping only those genes where the normalized count value was higher than 2 in at least 10% of the samples. Finally, those genes that had an adjusted p value below 0.05 FDR were selected. GSEA Preranked (Subramanian et al., 2005) was used to perform gene set enrichment analysis for the selected gene signatures on a pre-ranked gene list, setting 1000 gene set permutations. Only those gene sets with significant enrichment levels (FDR q-value < 0.05) were considered.
Diagnose of murine lymphomas and autoimmunity
Lymphoproliferative diseases developing in the VavP-Bcl2tg; RagCQ119L/+ cohort were diagnosed based on morphology according to the following criteria, in analogy to the classification of human lymphoma: (i) early stages of FL (FL in situ), defined by the presence of oversized follicles with partial or absent mantle zone and loss of confinement in the context of a yet preserved tissue architecture; (ii) overt FL of various grades, characterized by the effacement of the nodal and/or splenic architecture by a proliferation of follicle center B cells with a follicular growth pattern occupying the medullary and/or paracortical areas; (iii) DLBCL, defined by the effacement of the lymphoid organ architecture due to the expansion of large cells, with occasional infiltration beyond the capsule into surrounding soft tissues (Zhang et al., 2017). FL was classified into the following three histological grades: grade I, 0-5 centroblasts in 40x field; grade II, 6-15 centroblasts in 40x field; grade III, > 15 centroblasts in 40x field. Lymph nodes, spleen, BM and other tissues with abnormal mononuclear infiltrate were evaluated. Mice showing numerous grossly enlarged and fused germinal centers replete with more than 5 germinal centers per nodule of white pulp in the spleen were considered lymphoma. Bcl6 stain was used in doubtful cases to highlight the follicular pattern. The genotype of the animal was not disclosed to the pathologist (E. Caleiras). Autoimmunity was scored by perivascular inflammatory infiltrate, predominantly mononuclear of lymphoid aspect, with or without necrosis of the vessel wall, and was most prevalently seen in salivary glands and kidney. Autoimmune glomerulonephritis was defined by hypercellular glomeruli containing eosinophilic deposits, generally accompanied by Bowman epithelium hyperproliferation
Histological and immunohistochemical analysis of mouse tissues
Tissue samples were fixed in 10% neutral buffered formalin (4% formaldehyde in solution), paraffin-embedded and cut at 3 μm, mounted in superfrost®plus slides and dried overnight. For different staining methods, slides were deparaffinized in xylene and re-hydrated through a series of graded ethanol until water. Consecutive sections were stained with hematoxylin and eosin (H&E), and several immunohistochemistry reactions were performed in an automated immunostaining platform (Ventana Discovery XT). Antigen retrieval was first performed with the appropriate pH buffer, (CC1m, Ventana, Roche) and endogenous peroxidase was blocked (peroxide hydrogen at 3%). Then, slides were incubated with the appropriate primary antibody as detailed: mouse monoclonal anti-Bcl6 (1/30 dilution; CNIO Monoclonal Antibodies Core Unit #AM191E/A8), anti-Ki67 (clone D3B5, Cell Signaling Technology, #12202), After the primary antibody, slides were incubated with the visualization systems (Omni Map anti-Rabbit, Ventana, Roche) conjugated with horseradish peroxidase. Immunohistochemical reaction was developed using 3, 30-diaminobenzidine tetrahydrochloride (DAB) (Chromo Map DAB, Ventana, Roche; DAB Dako) and nuclei were counterstained with Carazzi’s hematoxylin. Finally, the slides were dehydrated, cleared and mounted with a permanent mounting medium for microscopic evaluation. Positive control sections known to be primary antibody positive were included for each staining run. For KI67 quantification, whole slides were acquired with a slide scanner (AxioScan Z1, Zeiss). After ROI (Regions Of Interest) selection (lymph nodes and spleen), areas for quantification were selected and exported as subsets of images in TIFF format. All images were then checked and those with staining or cutting artifacts were eliminated. Different images from different slides were chosen for quantification program training (AxioVision 4.6 software package, Zeiss) and an appropriate script for KI67 quantification was created: positivity was evaluated in one phase (phase 1, positive cells) and compared with tumor area (phase 2, tumor area). After training and script optimization, the quantification program was run and results exported as excel files with scoring data for each TIFF file. Data obtained was then compiled and appropriately assessed.
QUANTIFICATION AND STATISTICAL ANALYSIS
The n, indicating the total number of animals per group, as well as the definition of center, dispersion and precision measures are indicated in each Figure and Figure legend. Unless otherwise stated, two-tailed Student’s t test or Chi square test were performed as depicted in the Figures. Survival in mouse experiments was represented with Kaplan–Meier curves, and significance was estimated with the log-rank test. Statistical analyses were performed with Prism 9 software (GraphPad).
Supplementary Material
KEY RESOURCES TABLE
| REAGENT or RESOURCE | SOURCE | IDENTIFIER |
|---|---|---|
| Antibodies | ||
| PE-Cy7 Rat Anti-Mouse CD45R/B220 | BD Biosciences | Clone RA3-6B2; Cat#561881; RRID:AB_10893024 |
| BUV737 Rat Anti-Mouse CD45R/B220 | BD Biosciences | Clone RA3-6B2; Cat#564449; RRID:AB_2738813 |
| APC Rat Anti-Mouse CD45R/B220 | BD Biosciences | Clone RA3-6B2; Cat#553092; RRID:AB_398531 |
| PE Rat Anti-Mouse CD19 | BD Biosciences | Clone 1D3; Cat#557399; RRID:AB_396682 |
| BV786 Rat Anti-Mouse CD19 | BD Biosciences | Clone 1D3; Cat#563333; RRID:AB_2738141 |
| PE Rat Anti-Mouse T- and B Cell Activation Antigen | BD Biosciences | Clone GL7; Cat#561530; RRID:AB_10715834 |
| FITC Hamster Anti-Mouse CD95 | BD Biosciences | Clone Jo2; Cat#561979; RRID:AB_10892808 |
| BV421 Rat Anti-Mouse CD138 | BD Biosciences | Clone 281-2; Cat#562610; RRID:AB_11153126 |
| CD38 Monoclonal Antibody, Alexa Fluor 700 | Thermo Fisher Scientific | Clone 90; Cat#56-0381-82; RRID:AB_657740 |
| CD184 (CXCR4) Monoclonal Antibody, PE | Thermo Fisher Scientific | Clone 2B11; Cat#12-9991-82; RRID:AB_891391 |
| PE-Cy7 Rat Anti-Mouse CD86 | BD Biosciences | Clone GL1; Cat#560582; RRID:AB_1727518 |
| CD4 Monoclonal Antibody, FITC | Thermo Fisher Scientific | Clone GK1.5; Cat#11-0041-81; RRID:AB_464891 |
| PE-Cy7 Rat Anti-CD11b | BD Biosciences | Clone M1/70; Cat#561098; RRID:AB_2033994 |
| F4/80 Monoclonal Antibody, APC-eFluor 780 | Thermo Fisher Scientific | Clone BM8; Cat#47-4801-80; RRID:AB_2637188 |
| BUV395 Hamster Anti-Mouse CD3e | BD Biosciences | Clone 145-2C11; Cat#563565; RRID:AB_2738278 |
| PE Anti-Mouse NK1.1 (CD161) | Tonbo Biosciences | Clone PK136; Cat#50-5941; RRID:AB_2621804 |
| FITC Anti-Mouse MHC Class II (I-A/I-E) | Tonbo Biosciences | Clone M5/114.15.2; Cat#35-5321; RRID:AB_2621715 |
| APC Anti-Mouse CD11c | Tonbo Biosciences | Clone N418; Cat#20-0114; RRID:AB_2621557 |
| PerCP-Cyanine5.5 Anti-Mouse Ly-6G | Tonbo Biosciences | Clone 1A8; Cat#65-1276; RRID:AB_2621899 |
| Alexa Fluor700 anti-mouse Ly-6C Antibody | Biolegend | Clone HK1.4; Cat#128024; RRID:AB_10643270 |
| PerCP-Cy5.5 Mouse Lineage Antibody Cocktail | BD Biosciences | Cat#561317; RRID:AB_10612020 |
| APC/Cyanine7 anti-mouse CD117 (c-kit) Antibody | Biolegend | Clone 2B8; Cat#105826; RRID:AB_1626278 |
| Pacific Blue anti-mouse Ly-6A/E (Sca-1) Antibody | Biolegend | Clone E13-161.7; Cat#122520; RRID:AB_2143237 |
| APC anti-mouse CD150 (SLAM) Antibody | Biolegend | Clone TC15-12F12.2; Cat#115910; RRID:AB_493460 |
| PE Hamster Anti-Mouse CD48 | BD Biosciences | Clone HM48.1; Cat#557485; RRID:AB_396725 |
| BUV737 Rat Anti-Mouse CD127 | BD Biosciences | Clone SB/199; Cat#612841; RRID:AB_2870163 |
| CD34 Monoclonal Antibody, FITC | Thermo Fisher Scientific | Clone RAM34; Cat#11-0341-82; RRID:AB_465021 |
| PE-Cy7 Rat Anti-Mouse CD16/CD32 | BD Biosciences | Clone 2.4G2; Cat#560829; RRID:AB_10563207 |
| Phospho-S6 Ribosomal Protein (Ser235/236) Rabbit mAb (Alexa Fluor® 647 Conjugate) | Cell Signaling Technology | Clone D57.2.2E; Cat#4851; RRID:AB_10695457 |
| APC Rat anti-Mouse IgG1 | BD Biosciences | Clone A85-1; Cat#560089; RRID:AB_1645625 |
| CD45.1 Monoclonal Antibody, PerCP-Cyanine5.5 | Thermo Fisher Scientific | Clone A20; Cat#45-0453-82; RRID:AB_1107003 |
| CD45.2 Monoclonal Antibody, APC | Thermo Fisher Scientific | Clone 104; Cat#17-0454-81; RRID:AB_469399 |
| APC/Cyanine7 anti-mouse CD45.2 Antibody | Biolegend | Clone 104; Cat#109824; RRID:AB_830789 |
| Biotin Rat Anti-Mouse CD185 (CXCR5) | BD Biosciences | Clone 2G8; Cat#551960; RRID:AB_394301 |
| PE Streptavidin-Phycoerythrin antibody | BD Biosciences | Cat#554061; RRID:AB_10053328 |
| CD279 (PD-1) Monoclonal Antibody, PE-Cyanine7 | Thermo Fisher Scientific | Clone J43; Cat#25-9985-80; RRID:AB_10853672 |
| Phospho-p70 S6 Kinase (Thr389) Rabbit mAb | Cell Signaling Technology | Clone 108D2; Cat#9234; RRID:AB_2269803 |
| p70 S6 Kinase Rabbit mAb | Cell Signaling Technology | Clone 49D7; Cat#2708; RRID:AB_390722 |
| CD4 Monoclonal Antibody, FITC | Thermo Fisher Scientific | Clone GK1.5; Cat#11-0041-81; RRID:AB_464891 |
| BUV395 Rat Anti-Mouse CD4 | BD Biosciences | Clone GK1.5; Cat#563790; RRID:AB_2738426 |
| APC-Cyanine7 Anti-Human/Mouse CD44 | Tonbo Biosciences | Clone IM7; Cat#25-0441; RRID:AB_2621628 |
| PE Rat Anti-Mouse CD62L | BD Biosciences | Clone MEL-14; Cat#553151; RRID:AB_394666 |
| PE-Cy7 Hamster Anti-Mouse CD69 | BD Biosciences | Clone H1.2F3; Cat#552879 |
| PerCP-Cy5.5 Rat Anti-Mouse CD25 . | BD Biosciences | Clone PC61; Cat#551071; RRID:AB_394031 |
| Mouse CD40/TNFRSF5 Antibody | R&D Systems | Cat#MAB440; RRID:AB_358378 |
| In Vivo Ready Anti-Mouse CD3e | Tonbo Biosciences | clone 145-2C11; Cat#40-0031; RRID:AB_2621436 |
| In Vivo Ready Anti-Mouse CD28 | Tonbo Biosciences | clone 37.51; Cat#40-0281; RRID:AB_2621445 |
| Rabbit anti-TFEB Antibody | Bethyl Lab. | Cat#A303-673A; RRID:AB_11204751 |
| Chemicals, peptides, and recombinant proteins | ||
| Live/Dead AQUA dead cell stain | Life Technologies | Cat#L34957 |
| Sheep Red Blood Cells | Oxoid | Cat#SR0053B |
| CD43 (Ly-48) MicroBeads, mouse | Miltenyi Biotec | Cat#130-049-801; RRID:AB_2861373 |
| RPMI-1640 Medium | Sigma-Aldrich | Cat#R8758 |
| HyClone Fetal Bovine Serum | Hyclone | SV30160.03 |
| β-mercaptoethanol | GIBCO | Cat#31350-010 |
| HEPES | Lonza | Cat#BE17-737E |
| Penicillin/Streptomycin (5.000 U/ml) | GIBCO | Cat#15070-063 |
| Recombinant Mouse IL-4 Protein | R&D Systems | Cat#404-ML |
| CellTrace CFSE Cell Proliferation Kit, for flow cytometry | Life Technologies | Cat#C34554 |
| Erythrocyte Lysis Buffer (Buffer EL) | QIAGEN | Cat#79217 |
| Fixation/Permeabilization Solution Kit | BD Biosciences | Cat#554714; RRID:AB_2869008 |
| Click-iT® Plus EdU Alexa Fluor® 647 Flow Cytometry Assay Kit | Life Technologies | Cat#C10634 |
| TRIzol Reagent | Invitrogen | Cat#15596026 |
| RNase-Free DNase Set. | QIAGEN | Cat#79254 |
| SuperScript IV VILO Master Mix | Invitrogen | Cat#11756500 |
| GoTaq® qPCR Master Mix | Promega | Cat#6001 |
| Arcturus PicoPure RNA Isolation kit | Applied Biosystems | Cat#12204-01 |
| CD4+ T Cell Isolation Kit, mouse | Miltenyi Biotec | Cat#130-104-454 |
| CD45R (B220) MicroBeads, mouse | Miltenyi Biotec | Cat#130-049-501 |
| Collagen, Type I solution | Sigma-Aldrich | Cat#C3867 |
| Dulbecco’s MEM (DMEM) F-12 w/o Amino Acids | US Biological Life Science | Cat#D9801-10 |
| Sodium hydrogen carbonate (NaHCO3) | Sigma-Aldrich | Cat#1063291000 |
| D-(+)-Glucose solution | Sigma-Aldrich | Cat#G8769 |
| Critical commercial assays | ||
| Mouse IgM ELISA kit | Abcam | Cat#ab133047 |
| Mouse IgG1 ELISA Kit | Abcam | Cat#ab133045 |
| Deposited data | ||
| RNaseq from RagCQ119L/+ GC B cells | This paper | GEO: GSE174003 |
| RNaseq from VavPBcl2/RagCQ119L/+ lymphomas | This paper | GEO: GSE173619 |
| Gene expression profiling in RagC Q119L murine germinal center B cells and B220+ lymphoma cells | This paper | GEO: GSE174004 |
| Experimental models: Cell lines | ||
| primary B cells | RagCQ119L mice | N/A |
| primary T cells | RagCQ119L mice | N/A |
| primary MEFs | RagCQ119L mice | N/A |
| primary hepatocyes | RagCQ119L mice | N/A |
| Experimental models: Organisms/strains | ||
| RragcQ119L/+ | This Paper | N/A |
| B6.129S2-Ighmtm1Cgn/J (IghmμMT) | The Jackson Laboratory | Cat#002288 |
| VavP-Bcl2 | Susanne Cory lab; Walter and Eliza Hall Institute of Medical Research, Melbourne, Victoria, Australia | N/A |
| Oligonucleotides | ||
| Il-6-FW: TACCCCGATTCAGGTGAT. | Ortega-Molina et al., 2015 | N/A |
| Il-6-RV: TTGAGCAGAAGAGCTGCTACGT. | Ortega-Molina et al., 2015 | N/A |
| p21-FW: GTGGGTCTGACTCCAGCCC. | Lopez-Guadamillas et al., 2016 | N/A |
| p21-RV: CCTTCTCGTGAGACGCTTAC | Lopez-Guadamillas et al., 2016 | N/A |
| p16-FW: TACCCCGATTCAGGTGAT. | Lopez-Guadamillas et al., 2016 | N/A |
| p16-RV: TTGAGCAGAAGAGCTGCTACGT | Lopez-Guadamillas et al., 2016 | N/A |
| Il-1b-FW: TCTTTGAAGTTGACGGACCC. | This paper | N/A |
| Il-1b-RV: TCCACGGGAAAGACACAGGT | This paper | N/A |
| Ccl2-FW: GGTCCCTGTCATGCTTCTGG | This paper | N/A |
| Ccl2-RV: GAGTAGCAGCAGGTGAGTGG. | This paper | N/A |
| Cxcl1-FW: CGCCTATCGCCAATGAGCT. | This paper | N/A |
| Cxcl1-RV: ATGACTTCGGTTTGGGTGCA | This paper | N/A |
| Cxcl2-FW: GTGAACTGCGCTGTCAATGC. | This paper | N/A |
| Cxcl2-RV: ACTTCTGTCTGGGCGCAG. | This paper | N/A |
| Timp1-FW: CTTCTGCAACTCGGACCTGG. | This paper | N/A |
| Timp1-RV: CGCTGGTATAAGGTGGTCTCG | This paper | N/A |
| Mmp3-FW: GACTCAAGGGTGGATGCTGT. | De Cecco et al., 2019 | N/A |
| Mmp3-RV: CCAACTGCGAAGATCCACTG | De Cecco et al., 2019 | N/A |
| Actin-FW: GGCACCACACCTTCTACAATG. | Ortega-Molina et al., 2015 | N/A |
| Actin-RV: GTGGTGGTGAAGCTGTAGCC | Ortega-Molina et al., 2015 | N/A |
| Software and algorithms | ||
| Prism 9 (version 9.1.0) | GraphPad | https://www.graphpad.com |
| ImageJ | NIH | https://imagej.nih.gov/ij/ |
| FACS DIVA | BD Biosciences | N/A |
| GSEA software | Subramanian et al., 2005 | http://www.gsea-msigdb.org/gsea/index.jsp |
| Nextpresso pipeline | Graña et al., 2017 | http://ubio.bioinfo.cnio.es/people/ograna/nextpresso/. |
| TopHat2 | Trapnell et al., 2012 | https://ccb.jhu.edu/software/tophat/index.shtml |
| SAMTOOLS v.1.9 | Li et al., 2009 | http://samtools.sourceforge.net/ |
| Bowtie | Langmead et al., 2009 | http://bowtie-bio.sourceforge.net/index.shtml |
| HTSeq | Anders et al., 2015 | https://www-huber.embl.de/HTSeq |
| DESeq2 | Love et al., 2014 | http://www.bioconductor.org/packages/release/bioc/html/DESeq2.html. |
| FlowJo | TreeStar | https://www.flowjo.com |
| Other | ||
| Flow Cytometry Gating strategy | This paper | Data S1 |
| Uncropped western blots | This paper | Data S2 |
Highlights.
Knockin mice expressing a hypomorphic form of the RagC GTPase (Q119L) are viable
RagCQ119L/+ mice show attenuated nutrient signaling-mTORC1 activity
Lymphomagenesis and self-reactivity are delayed when induced in RagCQ119L/+ mice
Aside from B cells, RagCQ119L/+ mice show minimal defects and a normal lifespan
ACKNOWLEDGMENTS
We are indebted to D.M. Sabatini (NIH grants R01 CA129105, R01 CA103866, and R37 AI047389) and thank R. Jaenisch, S. Markoulaki, and the Whitehead Institute for Biomedical Research CRISPR facility for zygote injections. We thank the CNIO Flow Cytometry, Histopathology, Animal Facility and Genomics Core Units for excellent technical support. Research was supported by the RETOS Projects Program of the Spanish Ministry of Science, Innovation and Universities, the Spanish State Research Agency (AEI/10.13039/501100011033) co-funded by the European Regional Development Fund (SAF2015-67538-R and PID2019-104012RB-I00), the EU-H2020 Program (ERC-2014-STG-638891), an Excellence Network Grant from MICIU/AEI (SAF2016-81975-REDT), a Ramon y Cajal Award from MICIU/AEI (RYC-2013-13546), a Spanish Association Against Cancer Research Scientific Foundation laboratory grant (LABAE16001EFEY/AECC), Beca de Investigación en Oncología Olivia Roddom, a FERO Grant for Research in Oncology. This work was also supported by a Miguel Servet fellowship and grant award (MS16/00112 and CP16/00112) and Project PI18/00816 within the Health Strategic Action from the Instituto de Salud Carlos III (ISCIII) (to A.O.-M.), both co-funded by the European Regional Development Fund. The CNIO Bioinformatics Unit is supported by ISCIII a Spanish National Bioinformatics Institute (ELIXIR-ES, INB) grant (PT17/0009/0011-ISCIII-SGEFI/ERDF-EU). N.D.-S. and A.B.P.-G. are recipients of Ayudas de contratos predoctorales para la formación de doctores from MICIU/AEI (BES-2016-077410 and BES-2017-081381). A.E. is an EMBO Young Investigator. A.E. dedicates this work to the memory of Diego Armando Maradona.
Footnotes
SUPPLEMENTAL INFORMATION
Supplemental information can be found online at https://doi.org/10.1016/j.celrep.2021.109372.
DECLARATION OF INTERESTS
The authors declare no competing interests.
REFERENCES
- Anders S, Pyl PT, and Huber W (2015). HTSeq–a Python framework to work with high-throughput sequencing data. Bioinformatics 31, 166–169. [DOI] [PMC free article] [PubMed] [Google Scholar]
- Anderson RM, Le Couteur DG, and De Cabo R (2018). Caloric restriction research: New perspectives on the biology of aging. J. Gerontol. A Biol. Sci. Med. Sci 73, 1–3. [DOI] [PMC free article] [PubMed] [Google Scholar]
- Bannard O, and Cyster JG (2017). Germinal centers: programmed for affinity maturation and antibody diversification. Curr. Opin. Immunol 45, 21–30. [DOI] [PubMed] [Google Scholar]
- Béguelin W, Popovic R, Teater M, Jiang Y, Bunting KL, Rosen M, Shen H, Yang SN, Wang L, Ezponda T, et al. (2013). EZH2 is required for germinal center formation and somatic EZH2 mutations promote lymphoid transformation. Cancer Cell 23, 677–692. [DOI] [PMC free article] [PubMed] [Google Scholar]
- Bellantuono I, de Cabo R, Ehninger D, Di Germanio C, Lawrie A, Miller J, Mitchell SJ, Navas-Enamorado I, Potter PK, Tchkonia T, et al. (2020). A toolbox for the longitudinal assessment of healthspan in aging mice. Nat. Protoc 15, 540–574. [DOI] [PMC free article] [PubMed] [Google Scholar]
- Chung CYS, Shin HR, Berdan CA, Ford B, Ward CC, Olzmann JA, Zoncu R, and Nomura DK (2019). Covalent targeting of the vacuolar H+-ATPase activates autophagy via mTORC1 inhibition. Nat. Chem. Biol 15, 776–785. [DOI] [PMC free article] [PubMed] [Google Scholar]
- De Cecco M, Ito T, Petrashen AP, Elias AE, Skvir NJ, Criscione SW, Caligiana A, Brocculi G, Adney EM, Boeke JD, et al. (2019). L1 drives IFN in senescent cells and promotes age-associated inflammation. Nature 566, 73–78. [DOI] [PMC free article] [PubMed] [Google Scholar]
- de la Calle Arregui C, Plata-Gomez AB, Deleyto-Seldas N, Garcia F, Ortega-Molina A, Abril-Garrido J, et al. (2021). Limited survival and impaired hepatic fasting metabolism in mice with constitutive Rag GTPase signaling. Nat. Commun 12, 3660. [DOI] [PMC free article] [PubMed] [Google Scholar]
- Do MH, Wang X, Zhang X, Chou C, Nixon BG, Capistrano KJ, Peng M, Efeyan A, Sabatini DM, and Li MO (2020). Nutrient mTORC1 signaling underpins regulatory T cell control of immune tolerance. J. Exp. Med 217, e20190848. [DOI] [PMC free article] [PubMed] [Google Scholar]
- Efeyan A, Zoncu R, Chang S, Gumper I, Snitkin H, Wolfson RL, Kirak O, Sabatini DD, and Sabatini DM (2013). Regulation of mTORC1 by the Rag GTPases is necessary for neonatal autophagy and survival. Nature 493, 679–683. [DOI] [PMC free article] [PubMed] [Google Scholar]
- Efeyan A, Schweitzer LD, Bilate AM, Chang S, Kirak O, Lamming DW, and Sabatini DM (2014). RagA, but not RagB, is essential for embryonic development and adult mice. Dev. Cell 29, 321–329. [DOI] [PMC free article] [PubMed] [Google Scholar]
- Egle A, Harris AW, Bath ML, O’Reilly L, and Cory S (2004). VavP-Bcl2 transgenic mice develop follicular lymphoma preceded by germinal center hyperplasia. Blood 103, 2276–2283. [DOI] [PubMed] [Google Scholar]
- Ersching J, Efeyan A, Mesin L, Jacobsen JT, Pasqual G, Grabiner BC, Dominguez-Sola D, Sabatini DM, and Victora GD (2017). Germinal Center Selection and Affinity Maturation Require Dynamic Regulation of mTORC1 Kinase. Immunity 46, 1045–1058.e6. [DOI] [PMC free article] [PubMed] [Google Scholar]
- Gems D, and Partridge L (2013). Genetics of longevity in model organisms: debates and paradigm shifts. Annu. Rev. Physiol 75, 621–644. [DOI] [PubMed] [Google Scholar]
- Graña O, Rubio-Camarillo M, Fdez-Riverola F, Pisano DG, and Glez-Peña D (2017). Nextpresso: Next Generation Sequencing Expression Analysis Pipeline. Curr. Bioinform 13, 583–591. [Google Scholar]
- Green MR, Kihira S, Liu CL, Nair RV, Salari R, Gentles AJ, Irish J, Stehr H, Vicente-Duerñas C, Romero-Camarero I, et al. (2015). Mutations in early follicular lymphoma progenitors are associated with suppressed antigen presentation. Proc. Natl. Acad. Sci. USA 112, E1116–E1125. [DOI] [PMC free article] [PubMed] [Google Scholar]
- Huet S, Sujobert P, and Salles G (2018). From genetics to the clinic: a translational perspective on follicular lymphoma. Nat. Rev. Cancer 18, 224–239. [DOI] [PubMed] [Google Scholar]
- Ingram DK, and de Cabo R (2017). Calorie restriction in rodents: Caveats to consider. Ageing Res. Rev 39, 15–28. [DOI] [PMC free article] [PubMed] [Google Scholar]
- Kahl BS, and Yang DT (2016). Follicular lymphoma: evolving therapeutic strategies. Blood 127, 2055–2063. [DOI] [PubMed] [Google Scholar]
- Kalaitzidis D, Lee D, Efeyan A, Kfoury Y, Nayyar N, Sykes DB, Mercier FE, Papazian A, Baryawno N, Victora GD, et al. (2017). Amino acid-insensitive mTORC1 regulation enables nutritional stress resilience in hematopoietic stem cells. J. Clin. Invest 127, 1405–1413. [DOI] [PMC free article] [PubMed] [Google Scholar]
- Kang SA, O’Neill DJ, Machl AW, Lumpkin CJ, Galda SN, Sengupta S, Mahoney SJ, Howell JJ, Molz L, Hahm S, et al. (2019). Discovery of Small-Molecule Selective mTORC1 Inhibitors via Direct Inhibition of Glucose Transporters. Cell Chem. Biol. 26, 1203–1213.e13. [DOI] [PubMed] [Google Scholar]
- Kim YC, Park HW, Sciarretta S, Mo JS, Jewell JL, Russell RC, Wu X, Sadoshima J, and Guan KL (2014). Rag GTPases are cardioprotective by regulating lysosomal function. Nat. Commun 5, 4241. [DOI] [PMC free article] [PubMed] [Google Scholar]
- Kitamura D, Roes J, Kühn R, and Rajewsky K (1991). A B cell-deficient mouse by targeted disruption of the membrane exon of the immunoglobulin mu chain gene. Nature 350, 423–426. [DOI] [PubMed] [Google Scholar]
- Kridel R, Chan FC, Mottok A, Boyle M, Farinha P, Tan K, Meissner B, Bashashati A, McPherson A, Roth A, et al. (2016). Histological Transformation and Progression in Follicular Lymphoma: A Clonal Evolution Study. PLoS Med. 13, e1002197. [DOI] [PMC free article] [PubMed] [Google Scholar]
- Langmead B, Trapnell C, Pop M, and Salzberg SL (2009). Ultrafast and memory-efficient alignment of short DNA sequences to the human genome. Genome Biol. 10, R25. [DOI] [PMC free article] [PubMed] [Google Scholar]
- Li H, Handsaker B, Wysoker A, Fennell T, Ruan J, Homer N, Marth G, Abecasis G, and Durbin R; 1000 Genome Project Data Processing Subgroup (2009). The Sequence Alignment/Map format and SAMtools. Bioinformatics 25,2078–2079. [DOI] [PMC free article] [PubMed] [Google Scholar]
- Liao CY, Rikke BA, Johnson TE, Diaz V, and Nelson JF (2010). Genetic variation in the murine lifespan response to dietary restriction: from life extension to life shortening. Aging Cell 9, 92–95. [DOI] [PMC free article] [PubMed] [Google Scholar]
- Lopez-Guadamillas E, Fernandez-Marcos PJ, Pantoja C, Muñoz-Martin M, Martínez D, Gómez-López G, Campos-Olivas R, Valverde AM, and Serrano M (2016). p21Cip1 plays a critical role in the physiological adaptation to fasting through activation of PPARα. Sci. Rep 6, 34542. [DOI] [PMC free article] [PubMed] [Google Scholar]
- López-Otín C, Blasco MA, Partridge L, Serrano M, and Kroemer G (2013). The hallmarks of aging. Cell 153, 1194–1217. [DOI] [PMC free article] [PubMed] [Google Scholar]
- Love MI, Huber W, and Anders S (2014). Moderated estimation of fold change and dispersion for RNA-seq data with DESeq2. Genome Biol. 15, 550. [DOI] [PMC free article] [PubMed] [Google Scholar]
- Matasar MJ, Luminari S, Barr PM, Barta SK, Danilov AV, Hill BT, Phillips TJ, Jerkeman M, Magagnoli M, Nastoupil LJ, et al. (2019). Follicular Lymphoma: Recent and Emerging Therapies, Treatment Strategies, and Remaining Unmet Needs. Oncologist 24, e1236–e1250. [DOI] [PMC free article] [PubMed] [Google Scholar]
- Mesin L, Ersching J, and Victora GD (2016). Germinal Center B Cell Dynamics. Immunity 45, 471–482. [DOI] [PMC free article] [PubMed] [Google Scholar]
- Mitchell SJ, Madrigal-Matute J, Scheibye-Knudsen M, Fang E, Aon M, González-Reyes JA, Cortassa S, Kaushik S, Gonzalez-Freire M, Patel B, et al. (2016). Effects of Sex, Strain, and Energy Intake on Hallmarks of Aging in Mice. Cell Metab. 23, 1093–1112. [DOI] [PMC free article] [PubMed] [Google Scholar]
- Okosun J, Wolfson RL, Wang J, Araf S, Wilkins L, Castellano BM, Escudero-Ibarz L, Al Seraihi AF, Richter J, Bernhart SH, et al. (2016). Recurrent mTORC1-activating RRAGC mutations in follicular lymphoma. Nat. Genet 48, 183–188. [DOI] [PMC free article] [PubMed] [Google Scholar]
- Ortega-Molina A, Efeyan A, Lopez-Guadamillas E, Muñoz-Martin M, Gómez-López G, Carñamero M, Mulero F, Pastor J, Martinez S, Romanos E, et al. (2012). Pten positively regulates brown adipose function, energy expenditure, and longevity. Cell Metab. 15, 382–394. [DOI] [PubMed] [Google Scholar]
- Ortega-Molina A, Lopez-Guadamillas E, Mattison JA, Mitchell SJ, Muñoz-Martin M, Iglesias G, Gutierrez VM, Vaughan KL, Szarowicz MD, González-García I, et al. (2015). Pharmacological inhibition of PI3K reduces adiposity and metabolic syndrome in obese mice and rhesus monkeys. Cell Metab. 21,558–570. [DOI] [PMC free article] [PubMed] [Google Scholar]
- Ortega-Molina A, Deleyto-Seldas N, Carreras J, Sanz A, Lebrero-Fernández C, Menéndez C, Vandenberg A, Fernández-Ruiz B, Marín-Arraiza L, de la Calle Arregui C, et al. (2019). Oncogenic Rag GTPase signaling enhances B cell activation and drives follicular lymphoma sensitive to pharmacological inhibition of mTOR. Nat. Metab 1, 775–789. [DOI] [PMC free article] [PubMed] [Google Scholar]
- Sancak Y, Peterson TR, Shaul YD, Lindquist RA, Thoreen CC, Bar-Peled L, and Sabatini DM (2008). The Rag GTPases bind raptor and mediate amino acid signaling to mTORC1. Science 320, 1496–1501. [DOI] [PMC free article] [PubMed] [Google Scholar]
- Saxton RA, and Sabatini DM (2017). mTOR Signaling in Growth, Metabolism, and Disease. Cell 169, 361–371. [DOI] [PubMed] [Google Scholar]
- Saxton RA, Knockenhauer KE, Wolfson RL, Chantranupong L, Pacold ME, Wang T, Schwartz TU, and Sabatini DM (2016). Structural basis for leucine sensing by the Sestrin2-mTORC1 pathway. Science 351, 53–58. [DOI] [PMC free article] [PubMed] [Google Scholar]
- Selman C, Tullet JMA, Wieser D, Irvine E, Lingard SJ, Choudhury AI, Claret M, Al-Qassab H, Carmignac D, Ramadani F, et al. (2009). Ribosomal protein S6 kinase 1 signaling regulates mammalian life span. Science 326, 140–144. [DOI] [PMC free article] [PubMed] [Google Scholar]
- Sengupta S, Giaime E, Narayan S, Hahm S, Howell J, O’Neill D, Vlasuk GP, and Saiah E (2019). Discovery of NV-5138, the first selective Brain mTORC1 activator. Sci. Rep 9, 4107. [DOI] [PMC free article] [PubMed] [Google Scholar]
- Shen K, Choe A, and Sabatini DM (2017). Intersubunit Crosstalk in the Rag GTPase Heterodimer Enables mTORC1 to Respond Rapidly to Amino Acid Availability. Mol. Cell 68, 552–565.e8. [DOI] [PMC free article] [PubMed] [Google Scholar]
- Shimobayashi M, and Hall MN (2014). Making new contacts: the mTOR network in metabolism and signalling crosstalk. Nat. Rev. Mol. Cell Biol 15, 155–162. [DOI] [PubMed] [Google Scholar]
- Shlomchik MJ, and Weisel F (2012). Germinal center selection and the development of memory B and plasma cells. Immunol. Rev 247, 52–63. [DOI] [PubMed] [Google Scholar]
- Singh PP, Demmitt BA, Nath RD, and Brunet A (2019). The Genetics of Aging: A Vertebrate Perspective. Cell 177, 200–220. [DOI] [PMC free article] [PubMed] [Google Scholar]
- Subramanian A, Tamayo P, Mootha VK, Mukherjee S, Ebert BL, Gillette MA, Paulovich A, Pomeroy SL, Golub TR, Lander ES, and Mesirov JP (2005). Gene set enrichment analysis: a knowledge-based approach for interpreting genome-wide expression profiles. Proc. Natl. Acad. Sci. USA 102, 15545–15550. [DOI] [PMC free article] [PubMed] [Google Scholar]
- Tas JMJJ, Mesin L, Pasqual G, Targ S, Jacobsen JT, Mano YM, Chen CSC, Weill J-CJC, Reynaud CAC-A, Browne EPE, et al. (2016). Visualizing antibody affinity maturation in germinal centers. Science 351, 1048–1054. [DOI] [PMC free article] [PubMed] [Google Scholar]
- Trapnell C, Roberts A, Goff L, Pertea G, Kim D, Kelley DR, Pimentel H, Salzberg SL, Rinn JL, and Pachter L (2012). Differential gene and transcript expression analysis of RNA-seq experiments with TopHat and Cufflinks. Nat. Protoc 7, 562–578. [DOI] [PMC free article] [PubMed] [Google Scholar]
- Valvezan AJ, and Manning BD (2019). Molecular logic of mTORC1 signalling as a metabolic rheostat. Nat. Metab 1, 321–333. [DOI] [PMC free article] [PubMed] [Google Scholar]
- Victora GD, and Nussenzweig MC (2012). Germinal centers. Annu. Rev. Immunol 30, 429–457. [DOI] [PubMed] [Google Scholar]
- Wang H, Yang H, Shivalila CS, Dawlaty MM, Cheng AW, Zhang F, and Jaenisch R (2013). One-step generation of mice carrying mutations in multiple genes by CRISPR/Cas-mediated genome engineering. Cell 153, 910–918. [DOI] [PMC free article] [PubMed] [Google Scholar]
- Whittemore K, Derevyanko A, Martinez P, Serrano R, Pumarola M, Bosch F, and Blasco MA (2019). Telomerase gene therapy ameliorates the effects of neurodegeneration associated to short telomeres in mice. Aging (Albany NY) 11,2916–2948. [DOI] [PMC free article] [PubMed] [Google Scholar]
- Wu JJ, Liu J, Chen EB, Wang JJ, Cao L, Narayan N, Fergusson MM, Rovira II, Allen M, Springer DA, et al. (2013). Increased mammalian lifespan and a segmental and tissue-specific slowing of aging after genetic reduction of mTOR expression. Cell Rep. 4, 913–920. [DOI] [PMC free article] [PubMed] [Google Scholar]
- Ying ZX, Jin M, Peterson LF, Bernard D, Saiya-Cork K, Yildiz M, Wang S, Kaminski MS, Chang AE, Klionsky DJ, and Malek SN (2016). Recurrent mutations in the MTOR regulator RRAGC in follicular lymphoma. Clin. Cancer Res 22, 5383–5393. [DOI] [PMC free article] [PubMed] [Google Scholar]
- Zhang J, Vlasevska S, Wells VA, Nataraj S, Holmes AB, Duval R, Meyer SN, Mo T, Basso K, Brindle PK, et al. (2017). The CREBBP acetyltransferase is a haploinsufficient tumor suppressor in B-cell lymphoma. Cancer Discov. 7, 322–337. [DOI] [PMC free article] [PubMed] [Google Scholar]
- Zoncu R, Efeyan A, and Sabatini DM (2011). mTOR: from growth signal integration to cancer, diabetes and ageing. Nat. Rev. Mol. Cell Biol 12, 21–35. [DOI] [PMC free article] [PubMed] [Google Scholar]
Associated Data
This section collects any data citations, data availability statements, or supplementary materials included in this article.
Supplementary Materials
Data Availability Statement
Sequence data that support the findings of this study have been deposited in GEO, with the accession codes GEO: GSE174004, GSE174003 and GSE173619. This work does not report original code. Any additional information required to reanalyze the data reported in this paper is available from the lead contact upon request.