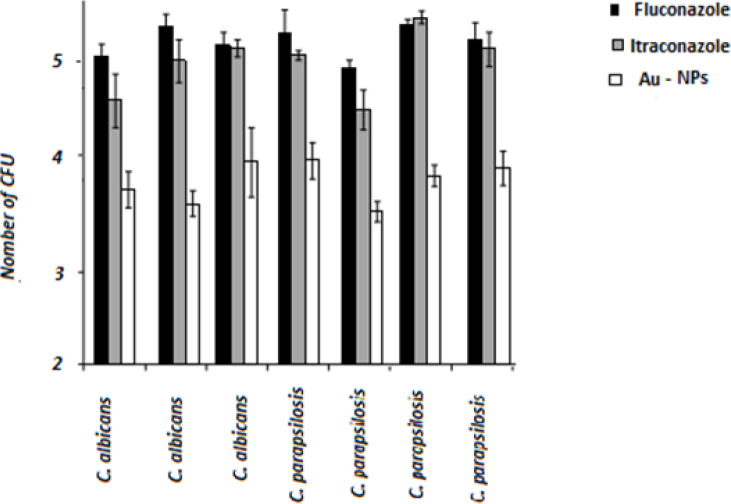
Figure 4.
Number of colony-forming units (logarithmic) per minimum inhibitory concentration of Candida cells in the presence of antifungals; black bars: cells treated with fluconazole; grey bars: cells treated with itraconazole; white bars: cells treated with gold nanoparticles; statistical analysis using Mann-Whitney U test showing significant differences in cells biomass between azole-treated and nanoliposome-treated for all tested strains (P<0.05), but not between fluconazole-treated and itraconazole-treated cells

