

Highlights
-
•
Dietary energy assessment does not require matching foods in cooked form.
-
•
Macronutrient dietary assessment does not require matching foods in cooked form.
-
•
Vitamin and mineral dietary assessment requires matching foods in cooked form.
Keywords: Food composition tables and databases, Household consumption and expenditure surveys, Dietary assessment, Yield factors, Retention factors, Vitamins, Minerals
Abstract
In many countries, statistics from household consumption and expenditure surveys are increasingly being used to inform policies and programs. In household surveys, foods are typically reported as they are acquired (the majority are raw). However, the micronutrient content of some foods diminishes during processing and cooking. Using food consumption data from the 2015/16 Kenya Integrated Household Budget Survey, this study analyzes whether mean consumption estimates of dietary energy, macronutrients, and eight micronutrients are equivalent (applying a two-side paired equivalence test) when matching foods: (1) considering the nutrient content in raw foods (as reported in the survey), and (2) considering the nutrient content in foods as typically consumed, thus applying yield and retention factors as needed. Both food matching approaches rendered statistically equivalent mean consumption estimates, at national and county levels, for dietary energy, protein, fats, available carbohydrates, total fiber, calcium and zinc. Non-equivalent means were found for iron, vitamins A, B1, B2, B12, and C. The higher differences between the means were, in percentage change, for vitamin C (47 %), B1 (34 %) and B12 (26 %).
1. Introduction
The use of reliable food consumption and food composition data has become increasingly important. There have been increased efforts to incorporate dietary intake indicators to baseline nutrition policies and programs aiming to improve nutrition outcomes as part of one of the multiple dimensions of national sustainable food systems (Eme et al., 2019).
The most suitable methods for assessing dietary intake are those assessing food intake at the individual level (FAO, 2018). A few high-income countries conduct periodic individual dietary intake surveys using standardized methods like 24-hr recalls, but most of the surveys are not representative at national level, as pointed out by Rippin and colleagues in their study of 53 WHO European countries (Rippin et al., 2018). In low- and middle-income countries these types of surveys are scarcely conducted due to their high costs, time burden and technical complexity to implement them (Coates et al., 2017a,b). National and international actors should advocate and promote strengthening and expanding nationally representative diet and nutrition surveys (World Health Organization, 2015). Meanwhile, researchers could optimize the use of food consumption data collected through alternative surveys, like Household Consumption and Expenditure Surveys (HCES) (Russell et al., 2018). HCES are conducted every 3–5 years in more than 125 countries, they are statistically representative at national and subnational levels and are much less costly than other dietary data sources (Fiedler, 2013). HCES collect information on households’ food acquisition and/or consumption; however, their use for dietary assessment is limited to complying with minimum reliability standards, such as considering all possible food sources, capturing the most relevant foods consumed by households and using a food recall period of two weeks or less (Smith et al., 2014). Furthermore, these surveys suffer from limitations such as the impossibility to assess individual intakes (Bromage et al., 2018), challenges in computing the nutrient content from foods consumed away from home (Moltedo et al., 2018), lack of specificity with regard to food use (consumption, waste, food given to pets), and lack of information on food preparation and cooking phases (Fabbri and Crosby, 2016).
Despite their limitations, HCES are increasingly being used in dietary assessments, like the estimation of the prevalence of dietary energy inadequacy (Moltedo et al., 2014; Rawal et al., 2019; Smith and Subandoro, 2007) and of the relative size of nutrient consumption to nutrient requirements (Fiedler and Mwangi, 2016; Sununtnasuk and Fiedler, 2017), as well as for planning food fortification programs (Fiedler, 2013) and producing national food security profiles (FAO, 2019).
To obtain nutrient consumption estimates from HCES data, the nutrient content of each food reported in the survey needs to be calculated. This is done by matching each food reported with an equivalent food in one or more Food Composition Tables and Databases (FCTs/FCDBs). Conducting an appropriate matching relies on following good practices for food matching and the reliability and good quality of FCTs/FCDBs (Micha et al., 2018).
Usually, food quantities reported in HCES refer to the weight of foods as acquired (i.e., before cooking and including non-edible portions). However, the nutrient content of a food varies depending on the form in which the food is consumed (i.e., raw or cooked). To address this limitation, analysts may use cooking yield factors to adjust portion size changes due to moisture loss, water absorption, or fat gains/losses during food preparation, and/or retention factors to correct for nutrient losses or changes during preparation.
Recent studies, based on HCES data, have correctly used cooking yield and/or retention factors to account for alterations in food composition during cooking (Bromage et al., 2018; Coates et al., 2017a,b; Karageorgou et al., 2018). Some FCTs/FCDBs (like the USDA, the Danish or the Canadian ones) include raw and cooked foods. However, others, especially from least developed countries, provide only the nutrient content of the raw form of foods, but not that of their cooked/ processed forms. According to Kapsokefalou et al. (2019), the latter are unsuitable for use in nutrient intake calculations.
The Kenya Food Composition Table (FAO and Government of Kenya, 2018) reports the nutrient content of foods in their raw, cooked and/or processed forms, thus allowing for the estimation of nutrient intake based on both the nutrient content in raw foods or in foods as they are consumed (i.e., raw, cooked/processed). The aim of this study is assessing whether, using the 2015/16 Kenya Integrated Household Budget Survey, nutrient intake estimates at national level and 47 counties differ with the type of food matching. We do this by analyzing if mean nutrient consumption estimates differ with the food matching approach used: (1) considering foods as reported in the survey (i.e., most are raw), (2) considering foods as they are typically consumed (most are cooked). To our knowledge, this is the first study of this kind using HCES data.
The outcomes of this study will contribute to improve the interpretation and comparison of national and/or regional nutrient consumption estimates when using HCES data; this is relevant, among other things, for national dietary energy consumption estimates, which are the basis of the computation of the Sustainable Development Goal (SDG) 2.1.1. indicator, the prevalence of undernourishment (Moltedo et al., 2014).
2. Materials and methods
2.1. Data sources
2.1.1. Kenya Integrated Household Budget Survey
We used data from the 2015/16 Kenya Integrated Household Budget Survey (KIHBS) (Kenya National Bureau of Statistics, 2015), which is representative at national and county level (Table 1). The survey was designed for monitoring progress in improving the living standards of the Kenyan population and providing with benchmark indicators for the government of Kenya’s third Medium Term Plan (Government of the Republic of Kenya, 2018). Data collection was conducted in four quarters between September 2015 and August 2016, with cluster enumeration being randomly allocated to each quarter. The survey response was used to adjust the design weights since the sample allocation was not proportional to the size of the strata (Kenya National Bureau Statistics, 2018).
Table 1.
| Population group | Sampled households n | Represented households n (in thousands) |
|---|---|---|
| National | 21756 | 11406.1 |
| Baringo | 437 | 152.3 |
| Bomet | 486 | 179.0 |
| Bungoma | 486 | 320.7 |
| Busia | 472 | 177.0 |
| Elgeyo/Marakwet | 440 | 99.2 |
| Embu | 454 | 164.3 |
| Garissa | 422 | 78.4 |
| Homa Bay | 479 | 224.5 |
| Isiolo | 399 | 33.7 |
| Kajiado | 392 | 249.6 |
| Kakamega | 494 | 391.2 |
| Kericho | 472 | 210.0 |
| Kiambu | 511 | 599.9 |
| Kilifi | 470 | 326.2 |
| Kirinyaga | 465 | 197.9 |
| Kisii | 533 | 290.0 |
| Kisumu | 502 | 284.4 |
| Kitui | 461 | 236.4 |
| Kwale | 466 | 174.3 |
| Laikipia | 462 | 135.3 |
| Lamu | 417 | 29.8 |
| Machakos | 483 | 327.6 |
| Makueni | 494 | 233.3 |
| Mandera | 421 | 111.0 |
| Marsabit | 346 | 62.0 |
| Meru | 534 | 393.4 |
| Migori | 469 | 230.2 |
| Mombasa | 459 | 395.9 |
| Murang'a | 485 | 323.1 |
| Nairobi City | 554 | 1503.3 |
| Nakuru | 493 | 578.2 |
| Nandi | 486 | 201.6 |
| Narok | 457 | 222.8 |
| Nyamira | 489 | 178.8 |
| Nyandarua | 448 | 191.4 |
| Nyeri | 502 | 271.1 |
| Samburu | 421 | 61.5 |
| Siaya | 485 | 245.8 |
| Taita/Taveta | 441 | 101.1 |
| Tana River | 435 | 56.1 |
| Tharaka-Nithi | 447 | 106.9 |
| Trans Nzoia | 485 | 209.9 |
| Turkana | 413 | 245.7 |
| Uasin Gishu | 489 | 269.6 |
| Vihiga | 456 | 143.8 |
| Wajir | 409 | 69.1 |
| West Pokot | 435 | 119.2 |
Households with complete data.
Inferred using household weights.
Data are from the 2015/16 Kenya Integrated Household Budget Survey.
For our analysis we used the food consumption module that contains data on food and beverages consumed by households, based on a pre-defined list of 210 foods, over the previous 7 days (from purchases, own production and other sources). Food quantities were reported for 202 non-composite foods, out of the 210 foods. The remaining 8 foods (representing 1.96 % of total food records reported by households) had a poorly defined description (e.g., “food from canteen”, “food from vendors”). For these 8 poorly defined foods, without information on food quantities, it was not possible to estimate the nutrient content applying a food matching approach. The apparent nutrient consumption provided by these foods could have been estimated using methodologies based on monetary values (Moltedo et al., 2014). However, as the scope of the paper is to compare food-matching approaches we considered that the inclusion of other methodologies would have introduced external variability to the analysis. Thus, the analysis was based only on foods consumed at-home (excluding take-away foods) with reported food quantities.
Reported food quantities were standardized into grams or liters; quantities in liters were then converted to grams using density factors (FAO/INFOODS, 2012a). Per capita food quantity outliers were detected for each food using the Median Absolute Deviation method (Leys et al., 2013). Outliers were imputed with the median per capita food quantity at county level.
2.1.2. Nutrients selection
We focused our analysis on dietary energy (in kilocalories), protein, fats, available carbohydrates (i.e., total carbohydrates excluding fiber) and total fiber in grams; vitamins B1, B2, and C, calcium, iron and zinc in mg; vitamin B12 in μg and vitamin A in μg of Retinol Equivalents (RE) and μg of Retinol Activity Equivalents (RAE). For dietary energy, results are also presented in kilojoules, as recommended by the International System of Units, which was adopted by all food composition organizations (Burlingame, 2004).
Nutrients were selected based on their public health relevance, wide availability of nutrient data in FCTs/FCDBs and the suitability of the type of data in HCES. Folate was not considered because FCTs/FCDBs not always include all folate forms (FAO/INFOODS, 2012b). Iodine was excluded because the best measure of intake is urinary iodine concentration and not dietary assessment (Brantsaeter et al., 2009). Sodium was not included because the recommended method to assess sodium intake is urine collection, and to a lesser extent individual dietary intake surveys given that results are likely to be underestimated (Hawkes and Webster, 2012).
2.1.3. Food composition tables/Food composition databases
We used six FCTs/FCDBs for the food matching. The majority of foods (71.8 %) were matched with the Kenya Food Composition Tables (FAO and Government of Kenya, 2018). Additional food composition databases were used for the remaining foods: The USDA Food Composition Databases (16.3 %) (U.S. Department of Agriculture Agricultural Research Service, 2019), The Tanzania Food Composition Table (5.9 %) (Muhimbili University of Health and Allied Sciences, 2008), the West African Food Composition Table (5.0 %) (Vincent et al., 2020), the Frida Food Database (0.5 %) (Technical University of Denmark National Food Institute, 2016) and the Indian Food Composition Tables (0.5 %) (Longvah et al., 2017) (Table 2).
Table 2.
Number and percentage of survey foodsa (out of a total of 202) that were matched with each of the six Food Composition Tables/Databases used.
| Food Composition Table/Database | Number of survey foods | Percentage of survey foods |
|---|---|---|
| Kenya Food Composition Tables | 145 | 71.8 |
| USDA Food Composition Databases | 33 | 16.3 |
| Tanzania Food Composition Table | 12 | 5.9 |
| West African Food Composition Table | 10 | 5.0 |
| Indian Food Composition Tables | 1 | 0.5 |
| Frida Food Database | 1 | 0.5 |
Foods with reported quantities.
2.2. Food matching
Reported food quantities were adjusted for non-edible portions when necessary. Cooking yield factors were applied to raw edible quantities, to match with the nutrient content in cooked foods. When necessary, retention factors were applied to the nutrient content in raw foods, which were then matched with raw edible quantities (Murphy et al., 1975). For single foods that are mixed prepared foods (e.g., “marmalade”, which includes fruit and sugar), quantities were matched 1:1 with nutrients in a correspondent mixed prepared food.
We applied two food matching approaches:
-
(i)
The AsAcquired-approach, considering foods as acquired (the majority of them in their raw form); and
-
(ii)
The AsConsumed-approach, considering foods as they are commonly consumed (raw or cooked).
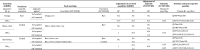
The procedures carried out for the AsAcquired and the AsConsumed food matching approaches are summarized below and depicted in Fig. 1 and Table 3 (which also contains a numeric example for Vitamin B1).
Fig. 1.

Flowchart of direct food matching approaches: AsAcquired and AsConsumed.
C, Cooked food form; KIHBS, Kenya Integrated Household Budget Survey; R, Raw food form.
The food matching of prepared/processed foods is not displayed in the figure. These were matched with the corresponding prepared/processed food in the FCT/FCDB as shown for the R-R matching.
Source: Authors’ own elaboration.
Table 3.
Examples of decisions made in the food matches in the AsAcquired and AsConsumed approaches, and an example for Vitamin B1 (in italics).
 |
Note: The food matching of prepared/processed foods is not displayed on the table. They were matched with the corresponding prepared/processed food in the FCT/FCDB.
KIHBS, Kenya Integrated Household Budget Survey.
FCT/FCDB, Food Composition/Food Composition Database.
EP, Edible Portion.
YF, Yield Factor.
RF, Retention Factor.
N/A, Not applicable.
2.2.1. AsAcquired-approach
Raw quantities of single foods were matched with the nutrient content in the raw form of the food, independently of the form the food is typically consumed (R-R matching in Fig. 1). Table 3 presents examples for “orange”, “maize flour” and “brown rice”.
2.2.2. AsConsumed-approach
In the AsConsumed-approach, we used different matching procedures according to the form in which the food is typically consumed, and on the information available in the FCTs/FCDBs. We assumed that all fruits are consumed raw and that vegetables are consumed cooked.
2.2.2.1. Food typically consumed raw
For foods typically consumed raw, we applied the same procedure as for the AsAcquired-approach (e.g., “orange” in Table 3; R-R matching in Fig. 1).
2.2.2.2. Food typically consumed cooked but information on the nutrient content in the cooked form is not available in the FCT(s)/FCDB(s)
When the cooked form of a single food was not available in the FCTs/FCDBs, the matching was done with its raw form. Raw quantities of single foods were then matched with the nutrient content in the raw form after being adjusted for the amount of nutrients lost after cooking using retention values (e.g., “maize, flour” in Table 3; C-R matching in Fig. 1).
2.2.2.3. Food typically consumed cooked and information on the nutrient content in the cooked form is available in the FCT(s)/FCDB(s)
Raw quantities of single foods were adjusted for weight change during processing using cooking yield factors and then matched with the respective nutrient content in the cooked form, namely boiled and drained, grilled and stewed (e.g., “brown rice” in Table 3; C-C matching in Fig. 1). To our knowledge, there are no guidelines on how to treat oil/fat consumption using HCES data. Thus, in the AsConsumed-approach we opted for treating the oil/fat foods as single foods. Consequently, we did not consider the frying cooking method to avoid double counting of their caloric contribution. An alternative AsConsumed-Approach could have been considering the frying cooking method and excluding the information on oil/fat foods. We call for further research to identify the best approach to be used when processing HCES food consumption data.
Foods in the food consumption module were matched to foods in the FCTs/FCDBs following FAO/INFOODS food matching guidelines (2012b). In this study we considered boiling and draining, stewing and grilling cooking methods. As explained by Greenfield and Southgate (2003) the boiling and draining cooking method leads to a loss of water-soluble vitamins and heat-labile nutrients. The stewing cooking methods produce a loss or gain of water, and a loss of water-soluble vitamins. The consequence of the grilling method is a loss of water and fat, and a loss of heat-labile and other micronutrients.
Table 4 presents the sources of non-edible portions, cooking yield factors and retention values used in the AsConsumed-approach. Non-edible portions were compiled from the Kenya, the USDA and the West African FCTs/FCDBs. Cooking yield factors were compiled from the Kenya and the USDA FCTs/FCDBs. Retention values were compiled from the Kenya and the USDA FCTs/FCDBs, and the European Food Information Resource (Vásquez-Caicedo et al., 2019), as suggested by FAO/INFOODS food matching guidelines.
Table 4.
Number and percentage of non-edible portions, retention values and yield factors used by source.
| Table/Database | Both methods | AsConsumed-approach |
|
|---|---|---|---|
| Non-edible portions | Retention values | Yield factors | |
| Kenya Food Composition Tables | 60 (30.0 %) | 18 (8.9 %) | 62 (30.7 %) |
| USDA Food Composition Databases | 1 (0.5 %) | 1 (0.5 %) | 1 (0.5 %) |
| West African Food Composition Table | 2 (1.0 %) | 0 (0.0 %) | 0 (0.0 %) |
| EUROFIR | 0 (0.0 %) | 5 (2.5 %) | 0 (0.0 %) |
| Assumed by authors based on similar food items a | 4 (8.0 %) | 0 (0.0 %) | 0 (0.0 %) |
Refuse factors assumed by authors: 90 % for coffee powder, 57 % for tea leaves, 95 % for sugarcane, and 32 % for beef with bones.
Out of the 202 reported foods, 143 were matched directly with single foods, while 59 were matched to more than one single food of the same type (e.g., “apples” was matched with “apple, green skin, unpeeled, raw” and “apple, red, unpeeled, raw”) and arithmetic means were computed to estimate their nutrient content. In total, in the AsAcquired-approach nutrient values were compiled from 269 foods and in the AsConsumed-approach from 338 foods, from the six FCTs/FCDBs. Appendix A, Supplementary Table 1 and Supplementary Table 2 show, respectively, the food matching applied in the AsAcquired-approach and the AsConsumed-approach. Based on the labels of the foods in the survey and the labels of the foods in the FCTs/FCDBs both matching approaches could be considered of medium quality according to FAO/INFOODS (2012b) quality criteria of food matching.
2.3. Comparison of approaches
The data analysis was performed in Stata version 14, using the SVY module to adjust for the complex sampling survey design. Mean daily per capita dietary energy and nutrient consumption, and confidence intervals were estimated for Kenya and its 47 counties, 48 population groups in total, for each of the two food matching approaches. Therefore, for each of the 48 population groups, we produced two mean consumption estimates (one using the AsAcquired-approach and one using the AsConsumed-approach). We used population weights (i.e., household weight multiplied by the number of household members) to infer estimates at national and county levels.
We used a two-side paired equivalence test, with equivalence margins of 5 % of the AsAcquired-approach mean estimates, to evaluate whether the two mean consumption estimates were equivalent (Walker and Nowacki, 2011). The two-side test provides two p-values based on a 95 % confidence interval; if the maximum of the two p-values was lower than 0.025 (i.e., both p-values passed the test), we rejected the null hypothesis and concluded that the mean consumption estimates were equivalent.
For each population group, we also estimated the difference between the two mean consumption estimates by subtracting the AsConsumed-approach estimate from the AsAcquired-approach estimate.
3. Results and discussion
This study examined the influence of the type of food matching, AsAcquired (considering the nutrient content in raw foods) and AsConsumed (considering the nutrient content in cooked foods) on mean nutrient consumption estimates. Results show that the influence on the estimates differ by nutrient. The two approaches rendered statistically equivalent mean consumption estimates for dietary energy, protein, fats, available carbohydrates, total fiber and calcium in Kenya at national level and for the 47 counties surveyed. However, this was not the case for vitamins A, B1, B2, B12, C and iron, for which mean consumption estimates were not equivalent in most of the populations studied. Table 5 presents the maximum p-value from the two-side equivalence testing.
Table 5.
Maximum p-value from the two-side paired mean-equivalence tests using an equivalence margin of 5% with a 95 % confidence interval.
 |
The light gray cells highlight the nutrient and population groups found to have equivalent means.
Vit., Vitamin.
Estimates of mean consumption, standard deviations and confidence intervals by food matching approach, are presented in Appendix A, Supplementary Table 3, for national and 47 counties.
At national level, the AsAcquired and AsConsumed daily per capita mean consumption estimates were: 2004 kcals (8385 kJ) compared to 2006 kcals (8393 kJ), 57.7 g compared to 57.9 g for protein, 45.2 g compared to 45.0 g for fats, 318 g in both cases for available carbohydrates, 45.1 g compared to 45.3 g for total fiber, and 668 mg compared to 656 mg for calcium. For zinc, the means were equivalent at national level and all counties except for Tharaka-Nithi (14.0 mg with the AsAcquired-approach compared to 13.3 mg with the AsConsumed-approach); the plausible reason is that this county has a high consumption of beans and peas, which present a high loss of zinc when boiled.
As expected, the two approaches estimated non-equivalent means for iron and vitamins A, B1, B2, B12 and C in most population groups. AsConsumed mean consumption estimates were systematically lower for iron and both water-soluble and heat-labile vitamins compared to those estimated with the AsAcquired-approach.
In the case of iron, the means were non-equivalent at national level (20.3 mg with the AsAcquired-approach compared to 18.7 mg with the AsConsumed-approach) and in almost all counties. For vitamins A (expressed in RAE and RE), B1, B2, B12 and C, none of the mean estimates were equivalent. At national level, the AsAcquired and AsConsumed mean estimates were: 361 μg compared to 334 μg of RAE, and 562 μg compared to 516 μg of RE for vitamin A, 1.6 mg compared to 1.2 mg for vitamin B1, 1.4 mg compared to 1.2 mg for vitamin B2, 3.3 μg compared to 2.9 μg for Vitamin B12 and 119 mg compared to 75 mg for Vitamin C. Our findings are in agreement with Zhang et al. (2019), who found that the type of cooking method might not have an impact on estimates of population intake distributions of dietary energy, macronutrients and certain micronutrients.
Statistics of the differences in mean consumption estimates between the two approaches are presented in Table 6, Table 7, Table 8 for dietary energy and macronutrients, vitamins, and minerals, respectively. The variability levels (SD) in households’ daily per capita consumption, which are shown in the tables, confirm that estimates at the household level are prone to measurement error. However, when performing the average estimate at the population level the random error effects are expected to cancel out; therefore, we present the differences in absolute term and percentage changes. The absolute term differences represent the change in the mean consumption estimate obtained with the AsAcquired-approach as compared to the mean consumption estimate obtained with the AsConsumed-approach (i.e., AsAcquired-approach – AsConsumed-approach).
Table 6.
Differences in mean daily per capita consumption estimates for dietary energy and macronutrientsa between the AsAcquired and AsConsumed food matching approaches at national level and in 47 counties in Kenya.
| Dietary energy |
Protein |
Fats |
Available carbohydrates |
Total fiber |
||||||
|---|---|---|---|---|---|---|---|---|---|---|
| Diff in mean, kcal (SD) | PC (%) | Diff in mean, g (SD) | PC (%) | Diff in mean, g (SD) | PC (%) | Diff in mean, g (SD) | PC (%) | Diff in mean, g (SD) | PC (%) | |
| National | –2 (7) | –0.1 | –0.2 (0.2) | –0.3 | 0.2 (0.7) | 0.4 | –0.6 (0.8) | –0.2 | –0.2 (0.7) | –0.3 |
| Baringo | –2 (5) | –0.1 | –0.2 (0.1) | –0.3 | 0.1 (0.5) | 0.1 | –0.6 (0.7) | –0.2 | 0.1 (0.6) | 0.1 |
| Bomet | –3 (4) | –0.1 | –0.1 (0.1) | –0.2 | 0.0 (0.3) | 0.1 | –0.6 (0.6) | –0.2 | –0.2 (0.6) | –0.3 |
| Bungoma | –2 (5) | –0.1 | –0.2 (0.1) | –0.3 | 0.1 (0.4) | 0.4 | –0.5 (0.7) | –0.2 | –0.2 (0.6) | –0.3 |
| Busia | 1 (5) | 0.0 | –0.1 (0.1) | –0.3 | 0.3 (0.6) | 0.9 | –0.3 (0.4) | –0.1 | –0.1 (0.3) | –0.4 |
| Elgeyo/Marakwet | –3 (4) | –0.1 | –0.1 (0.1) | –0.2 | 0.0 (0.4) | –0.1 | –0.5 (0.5) | –0.2 | 0.1 (0.5) | 0.1 |
| Embu | –2 (6) | –0.1 | –0.2 (0.2) | –0.4 | 0.2 (0.6) | 0.5 | –0.7 (0.7) | –0.2 | –0.3 (0.7) | –0.5 |
| Garissa | 1 (4) | 0.0 | –0.1 (0.1) | –0.2 | 0.2 (0.4) | 0.5 | –0.2 (0.5) | –0.1 | 0.0 (0.2) | –0.2 |
| Homa Bay | –1 (4) | 0.0 | –0.2 (0.1) | –0.3 | 0.2 (0.4) | 0.4 | –0.4 (0.5) | –0.1 | –0.2 (0.5) | –0.3 |
| Isiolo | 0 (5) | 0.0 | –0.2 (0.1) | –0.3 | 0.3 (0.6) | 0.5 | –0.3 (0.3) | –0.1 | 0.0 (0.3) | 0.1 |
| Kajiado | 0 (5) | 0.0 | –0.2 (0.1) | –0.4 | 0.3 (0.5) | 0.7 | –0.4 (0.5) | –0.2 | –0.2 (0.4) | –0.6 |
| Kakamega | 0 (4) | 0.0 | –0.1 (0.1) | –0.2 | 0.2 (0.4) | 0.5 | –0.4 (0.4) | –0.1 | –0.1 (0.4) | –0.3 |
| Kericho | –2 (4) | –0.1 | –0.2 (0.1) | –0.3 | 0.1 (0.3) | 0.2 | –0.5 (0.5) | –0.2 | –0.1 (0.5) | –0.3 |
| Kiambu | –2 (8) | –0.1 | –0.3 (0.2) | –0.5 | 0.4 (0.7) | 0.7 | –0.8 (1.0) | –0.2 | –0.4 (0.9) | –1.1 |
| Kilifi | 0 (9) | 0.0 | –0.1 (0.3) | –0.2 | 0.1 (0.5) | 0.3 | –0.3 (1.5) | –0.1 | 0.2 (0.8) | 0.4 |
| Kirinyaga | –4 (7) | –0.2 | –0.3 (0.2) | –0.5 | 0.3 (0.7) | 0.6 | –1.0 (0.8) | –0.3 | –0.6 (0.7) | –1.3 |
| Kisii | –2 (3) | –0.1 | –0.1 (0.1) | –0.3 | 0.0 (0.3) | 0.0 | –0.3 (0.3) | –0.1 | 0.0 (0.4) | 0.1 |
| Kisumu | 0 (5) | 0.0 | –0.2 (0.1) | –0.3 | 0.3 (0.4) | 0.7 | –0.4 (0.5) | –0.1 | –0.1 (0.4) | –0.4 |
| Kitui | –3 (6) | –0.2 | –0.2 (0.1) | –0.3 | –0.1 (0.6) | –0.3 | –0.6 (0.7) | –0.2 | 0.3 (0.8) | 0.6 |
| Kwale | 0 (4) | 0.0 | –0.1 (0.1) | –0.2 | 0.2 (0.4) | 0.5 | –0.3 (0.4) | –0.1 | –0.1 (0.3) | –0.3 |
| Laikipia | –3 (8) | –0.1 | –0.2 (0.2) | –0.4 | 0.2 (0.8) | 0.4 | –0.8 (0.8) | –0.2 | –0.2 (0.8) | –0.4 |
| Lamu | 2 (5) | 0.1 | –0.1 (0.1) | –0.2 | 0.4 (0.6) | 0.7 | –0.2 (0.3) | –0.1 | 0.1 (0.4) | 0.2 |
| Machakos | –3 (6) | –0.1 | –0.2 (0.2) | –0.3 | 0.1 (0.7) | 0.1 | –0.7 (0.7) | –0.2 | 0.0 (0.8) | 0.0 |
| Makueni | –4 (6) | –0.2 | –0.2 (0.2) | –0.3 | –0.1 (0.6) | –0.2 | –0.8 (0.7) | –0.2 | 0.2 (0.9) | 0.2 |
| Mandera | –1 (2) | –0.1 | 0.0 (0.1) | –0.1 | –0.1 (0.3) | –0.2 | –0.1 (0.2) | –0.1 | 0.2 (0.2) | 0.9 |
| Marsabit | 1 (9) | 0.0 | –0.1 (0.1) | –0.2 | 0.2 (1.0) | 0.4 | –0.2 (0.2) | –0.1 | 0.4 (0.5) | 1.2 |
| Meru | –4 (7) | –0.2 | –0.3 (0.2) | –0.4 | 0.1 (0.7) | 0.2 | –0.8 (0.8) | –0.2 | 0.0 (0.8) | 0.0 |
| Migori | –1 (4) | 0.0 | –0.2 (0.1) | –0.2 | 0.1 (0.4) | 0.2 | –0.3 (0.6) | –0.1 | 0.0 (0.4) | 0.0 |
| Mombasa | 2 (5) | 0.1 | –0.2 (0.2) | –0.4 | 0.5 (0.6) | 1.0 | –0.3 (0.3) | –0.1 | –0.1 (0.3) | –0.5 |
| Murang'a | –5 (6) | –0.2 | –0.2 (0.1) | –0.4 | 0.1 (0.5) | 0.2 | –1.0 (0.7) | –0.3 | –0.5 (0.7) | –1.2 |
| Nairobi City | 0 (8) | 0.0 | –0.3 (0.3) | –0.4 | 0.5 (0.8) | 0.9 | –0.6 (1.0) | –0.2 | –0.4 (0.6) | –1.0 |
| Nakuru | –3 (7) | –0.2 | –0.3 (0.2) | –0.4 | 0.1 (0.7) | 0.2 | –0.8 (0.7) | –0.2 | –0.3 (0.7) | –0.6 |
| Nandi | –3 (4) | –0.2 | –0.1 (0.1) | –0.3 | 0.0 (0.3) | 0.1 | –0.6 (0.6) | –0.2 | –0.2 (0.5) | –0.5 |
| Narok | –4 (8) | –0.2 | –0.2 (0.2) | –0.4 | 0.2 (0.7) | 0.4 | –0.9 (1.0) | –0.3 | –0.5 (0.7) | –1.0 |
| Nyamira | –1 (4) | –0.1 | –0.1 (0.1) | –0.2 | 0.1 (0.4) | 0.2 | –0.4 (0.4) | –0.1 | –0.2 (0.4) | –0.3 |
| Nyandarua | –5 (7) | –0.2 | –0.3 (0.2) | –0.4 | 0.1 (0.6) | 0.3 | –0.9 (0.8) | –0.3 | –0.5 (0.7) | –0.9 |
| Nyeri | –5 (10) | –0.2 | –0.3 (0.2) | –0.5 | 0.4 (0.9) | 0.8 | –1.4 (1.3) | –0.4 | –0.9 (1.0) | –1.8 |
| Samburu | 1 (7) | 0.1 | –0.1 (0.1) | –0.2 | 0.3 (0.8) | 1.0 | –0.3 (0.3) | –0.1 | 0.1 (0.3) | 0.4 |
| Siaya | –1 (5) | 0.0 | –0.2 (0.1) | –0.3 | 0.2 (0.5) | 0.5 | –0.4 (0.5) | –0.1 | –0.1 (0.5) | –0.2 |
| Taita/Taveta | 1 (5) | 0.0 | –0.1 (0.1) | –0.3 | 0.3 (0.6) | 0.7 | –0.3 (0.3) | –0.1 | –0.1 (0.3) | –0.3 |
| Tana River | 1 (4) | 0.0 | –0.1 (0.1) | –0.3 | 0.2 (0.4) | 0.5 | –0.2 (0.2) | –0.1 | 0.0 (0.3) | 0.1 |
| Tharaka–Nithi | –2 (8) | –0.1 | –0.2 (0.2) | –0.3 | 0.1 (0.9) | 0.4 | –0.7 (0.8) | –0.2 | 0.1 (0.8) | 0.2 |
| Trans Nzoia | –2 (5) | –0.1 | –0.2 (0.1) | –0.3 | 0.1 (0.4) | 0.2 | –0.6 (0.6) | –0.2 | –0.1 (0.6) | –0.3 |
| Turkana | 3 (19) | 0.2 | –0.1 (0.1) | –0.2 | 0.4 (2.1) | 0.9 | –0.2 (0.3) | –0.1 | 0.5 (0.7) | 1.3 |
| Uasin Gishu | –3 (7) | –0.2 | –0.2 (0.1) | –0.3 | 0.1 (0.5) | 0.2 | –0.7 (0.9) | –0.2 | –0.3 (0.7) | –0.7 |
| Vihiga | –2 (4) | –0.1 | –0.1 (0.1) | –0.3 | 0.1 (0.3) | 0.3 | –0.5 (0.6) | –0.2 | –0.3 (0.5) | –0.5 |
| Wajir | 0 (3) | 0.0 | –0.1 (0.1) | –0.2 | 0.1 (0.3) | 0.2 | –0.2 (0.2) | –0.1 | 0.0 (0.2) | 0.0 |
| West Pokot | –1 (6) | 0.0 | –0.1 (0.1) | –0.2 | 0.1 (0.5) | 0.4 | –0.3 (0.7) | –0.1 | –0.1 (0.5) | –0.2 |
Diff, Difference, AsAcquired – AsConsumed.
SD, Standard Deviation of the mean differences.
PC, Percentage change, 100*((AsAcquired – AsConsumed)/AsAcquired).
Estimated mean consumption, standard deviations and confidence intervals by food matching approach are presented in Appendix A for all the nutrients in the 48 population groups.
Table 7.
Differences in mean, daily per capita, consumption estimates for vitaminsa between the AsAcquired and AsConsumed food matching approaches at national level and in 47 counties in Kenya.
| Vitamin A |
Vitamin A |
Vitamin B1 |
Vitamin B2 |
Vitamin B12 |
Vitamin C |
|||||||
|---|---|---|---|---|---|---|---|---|---|---|---|---|
| Diff in mean, μg RAE (SD) | PC (%) | Diff in mean, μg RE (SD) | PC (%) | Diff in mean, mg (SD) | PC (%) | Diff in mean, mg (SD) | PC (%) | Diff in mean, μg (SD) | PC (%) | Diff in mean, mg (SD) | PC (%) | |
| National | 28 (22) | 7.6 | 46 (40) | 8.2 | 0.4 (0.3) | 27.7 | 0.1 (0.1) | 8.8 | 0.4 (0.6) | 12.6 | 43 (42) | 36.4 |
| Baringo | 21 (18) | 5.8 | 37 (32) | 7.0 | 0.5 (0.3) | 32.1 | 0.1 (0.1) | 9.0 | 0.3 (0.5) | 12.2 | 33 (24) | 33.6 |
| Bomet | 23 (15) | 6.3 | 46 (29) | 7.7 | 0.4 (0.2) | 32.3 | 0.1 (0.1) | 7.4 | 0.1 (0.3) | 4.5 | 58 (40) | 45.4 |
| Bungoma | 20 (13) | 7.6 | 35 (24) | 8.4 | 0.4 (0.2) | 30.3 | 0.1 (0.1) | 10.3 | 0.5 (0.7) | 11.2 | 34 (22) | 33.7 |
| Busia | 15 (11) | 8.5 | 24 (19) | 8.6 | 0.3 (0.2) | 29.3 | 0.1 (0.0) | 12.3 | 0.6 (0.6) | 11.6 | 30 (22) | 31.3 |
| Elgeyo/Marakwet | 16 (13) | 6.0 | 29 (25) | 7.6 | 0.5 (0.2) | 33.2 | 0.1 (0.1) | 8.5 | 0.2 (0.3) | 8.7 | 32 (26) | 39.5 |
| Embu | 28 (24) | 8.3 | 51 (45) | 8.8 | 0.5 (0.3) | 28.8 | 0.1 (0.1) | 9.2 | 0.1 (0.2) | 9.2 | 44 (44) | 35.6 |
| Garissa | 11 (7) | 6.2 | 12 (9) | 6.0 | 0.3 (0.1) | 18.9 | 0.1 (0.1) | 5.9 | 0.4 (0.5) | 23.9 | 3 (6) | 24.8 |
| Homa Bay | 33 (17) | 8.2 | 59 (34) | 9.0 | 0.5 (0.2) | 28.0 | 0.1 (0.1) | 11.3 | 1.5 (1.3) | 12.6 | 65 (39) | 35.5 |
| Isiolo | 13 (11) | 5.9 | 20 (17) | 6.7 | 0.3 (0.2) | 22.2 | 0.1 (0.0) | 6.2 | 0.3 (0.4) | 13.6 | 15 (17) | 35.2 |
| Kajiado | 22 (18) | 6.4 | 31 (32) | 6.1 | 0.3 (0.2) | 23.0 | 0.1 (0.1) | 5.8 | 0.2 (0.4) | 8.1 | 24 (26) | 32.7 |
| Kakamega | 33 (20) | 9.8 | 60 (37) | 10.5 | 0.5 (0.2) | 31.0 | 0.2 (0.1) | 12.8 | 0.4 (0.4) | 12.9 | 71 (45) | 44.4 |
| Kericho | 19 (12) | 5.6 | 33 (21) | 6.9 | 0.4 (0.2) | 29.3 | 0.1 (0.1) | 7.1 | 0.4 (0.4) | 11.0 | 38 (22) | 33.6 |
| Kiambu | 32 (22) | 7.2 | 56 (43) | 7.8 | 0.4 (0.2) | 24.5 | 0.1 (0.1) | 5.8 | 0.2 (0.4) | 9.7 | 49 (40) | 37.5 |
| Kilifi | 30 (19) | 9.9 | 41 (33) | 10.2 | 0.5 (0.4) | 26.3 | 0.1 (0.1) | 10.5 | 0.5 (0.5) | 17.6 | 19 (19) | 29.3 |
| Kirinyaga | 34 (24) | 7.2 | 60 (44) | 7.7 | 0.4 (0.2) | 26.1 | 0.1 (0.1) | 6.5 | 0.2 (0.2) | 8.6 | 50 (38) | 34.1 |
| Kisii | 32 (16) | 8.0 | 62 (33) | 9.4 | 0.4 (0.2) | 30.4 | 0.1 (0.1) | 10.3 | 0.5 (0.5) | 10.7 | 94 (46) | 47.2 |
| Kisumu | 23 (15) | 7.9 | 34 (26) | 8.3 | 0.4 (0.2) | 26.0 | 0.1 (0.1) | 9.9 | 0.8 (0.7) | 13.3 | 31 (31) | 38.8 |
| Kitui | 20 (13) | 8.7 | 33 (22) | 9.5 | 0.8 (0.4) | 34.1 | 0.1 (0.1) | 12.7 | 0.2 (0.3) | 25.4 | 19 (19) | 28.8 |
| Kwale | 24 (21) | 8.3 | 34 (33) | 8.0 | 0.4 (0.2) | 24.6 | 0.1 (0.1) | 9.9 | 0.4 (0.5) | 15.0 | 21 (26) | 23.2 |
| Laikipia | 26 (23) | 7.2 | 45 (40) | 8.0 | 0.5 (0.3) | 28.4 | 0.1 (0.1) | 7.3 | 0.4 (0.6) | 15.7 | 34 (33) | 34.5 |
| Lamu | 28 (21) | 8.9 | 36 (28) | 8.6 | 0.5 (0.3) | 25.2 | 0.1 (0.1) | 8.2 | 0.7 (0.7) | 25.3 | 20 (28) | 28.8 |
| Machakos | 27 (17) | 8.4 | 44 (30) | 9.0 | 0.6 (0.4) | 29.9 | 0.1 (0.1) | 10.5 | 0.2 (0.4) | 16.4 | 33 (29) | 32.3 |
| Makueni | 23 (16) | 9.1 | 39 (27) | 9.8 | 0.8 (0.5) | 33.1 | 0.2 (0.1) | 11.7 | 0.2 (0.3) | 21.2 | 27 (30) | 30.5 |
| Mandera | 3 (3) | 5.3 | 5 (4) | 6.8 | 0.3 (0.2) | 27.8 | 0.0 (0.0) | 8.4 | 0.1 (0.3) | 14.4 | 1 (2) | 15.8 |
| Marsabit | 9 (7) | 6.8 | 15 (12) | 8.9 | 0.4 (0.2) | 28.3 | 0.1 (0.1) | 9.1 | 0.2 (0.4) | 16.9 | 6 (11) | 38.1 |
| Meru | 28 (20) | 7.8 | 50 (38) | 8.6 | 0.6 (0.4) | 30.5 | 0.1 (0.1) | 8.4 | 0.2 (0.2) | 9.6 | 39 (31) | 33.9 |
| Migori | 23 (15) | 9.4 | 38 (25) | 9.4 | 0.4 (0.2) | 29.8 | 0.1 (0.0) | 12.2 | 1.0 (1.0) | 11.6 | 41 (28) | 30.1 |
| Mombasa | 30 (21) | 8.1 | 44 (33) | 8.0 | 0.3 (0.2) | 20.9 | 0.1 (0.1) | 8.3 | 0.6 (0.7) | 14.3 | 29 (24) | 31.5 |
| Murang'a | 33 (19) | 7.4 | 54 (35) | 7.9 | 0.5 (0.2) | 25.8 | 0.1 (0.1) | 6.6 | 0.3 (0.3) | 13.0 | 45 (34) | 33.8 |
| Nairobi City | 45 (30) | 7.5 | 71 (57) | 7.5 | 0.3 (0.2) | 20.5 | 0.1 (0.1) | 7.8 | 0.5 (0.7) | 14.2 | 61 (58) | 36.9 |
| Nakuru | 37 (24) | 7.7 | 63 (46) | 8.1 | 0.5 (0.3) | 26.9 | 0.1 (0.1) | 7.7 | 0.4 (0.5) | 14.3 | 66 (49) | 40.0 |
| Nandi | 21 (13) | 6.5 | 40 (23) | 8.1 | 0.4 (0.2) | 30.7 | 0.1 (0.1) | 7.6 | 0.2 (0.2) | 5.9 | 45 (28) | 36.8 |
| Narok | 30 (24) | 6.5 | 53 (46) | 7.5 | 0.5 (0.3) | 27.9 | 0.1 (0.1) | 6.9 | 0.4 (0.6) | 12.2 | 50 (44) | 38.6 |
| Nyamira | 28 (20) | 6.9 | 52 (39) | 7.9 | 0.4 (0.2) | 28.1 | 0.1 (0.1) | 10.0 | 0.3 (0.4) | 11.8 | 77 (62) | 40.9 |
| Nyandarua | 37 (29) | 7.7 | 65 (56) | 8.5 | 0.5 (0.3) | 26.0 | 0.1 (0.1) | 6.7 | 0.2 (0.3) | 12.6 | 40 (29) | 34.8 |
| Nyeri | 48 (31) | 7.5 | 79 (58) | 7.8 | 0.4 (0.2) | 24.1 | 0.1 (0.1) | 6.5 | 0.4 (0.4) | 13.6 | 61 (48) | 34.9 |
| Samburu | 7 (8) | 6.4 | 13 (13) | 8.4 | 0.3 (0.2) | 32.1 | 0.1 (0.0) | 8.5 | 0.2 (0.4) | 14.6 | 8 (13) | 36.4 |
| Siaya | 25 (17) | 8.2 | 40 (27) | 8.0 | 0.5 (0.2) | 30.2 | 0.1 (0.1) | 12.2 | 1.1 (1.0) | 11.6 | 40 (31) | 29.5 |
| Taita/Taveta | 28 (17) | 8.0 | 46 (30) | 8.7 | 0.4 (0.2) | 26.4 | 0.1 (0.1) | 9.7 | 0.6 (0.7) | 15.5 | 47 (36) | 37.7 |
| Tana River | 13 (10) | 7.3 | 20 (17) | 8.0 | 0.3 (0.2) | 24.9 | 0.1 (0.0) | 7.0 | 0.1 (0.3) | 10.3 | 17 (21) | 37.6 |
| Tharaka-Nithi | 24 (20) | 8.1 | 43 (36) | 8.8 | 0.7 (0.4) | 32.6 | 0.1 (0.1) | 10.4 | 0.3 (0.4) | 17.9 | 27 (28) | 28.8 |
| Trans Nzoia | 27 (16) | 7.0 | 46 (32) | 8.0 | 0.5 (0.3) | 30.4 | 0.1 (0.1) | 9.9 | 0.3 (0.5) | 12.7 | 57 (41) | 41.0 |
| Turkana | 15 (17) | 12.1 | 22 (25) | 13.3 | 0.4 (0.4) | 32.8 | 0.1 (0.1) | 12.5 | 0.5 (1.0) | 26.5 | 9 (17) | 38.2 |
| Uasin Gishu | 22 (17) | 6.1 | 37 (32) | 7.0 | 0.4 (0.2) | 28.7 | 0.1 (0.1) | 7.1 | 0.3 (0.4) | 9.8 | 37 (29) | 37.1 |
| Vihiga | 27 (16) | 8.5 | 50 (29) | 9.2 | 0.4 (0.2) | 28.9 | 0.1 (0.1) | 11.3 | 0.4 (0.4) | 11.0 | 66 (42) | 29.9 |
| Wajir | 5 (5) | 4.7 | 6 (5) | 5.0 | 0.3 (0.1) | 19.1 | 0.0 (0.0) | 4.9 | 0.2 (0.3) | 13.7 | 2 (3) | 26.0 |
| West Pokot | 11 (8) | 4.6 | 20 (15) | 6.3 | 0.3 (0.2) | 32.5 | 0.1 (0.0) | 7.6 | 0.1 (0.3) | 7.2 | 26 (23) | 42.1 |
Diff, Difference, AsAcquired – AsConsumed.
SD, Standard Deviation of the mean differences.
PC, Percentage change, 100*((AsAcquired – AsConsumed)/AsAcquired).
Estimated mean consumption, standard deviations and confidence intervals by food matching approach, are presented in Appendix A, for all the nutrients in the 48 population groups.
Table 8.
Differences in mean, daily per capita, consumption estimates for mineralsa between the AsAcquired and AsConsumed food matching approaches at national level and in 47 counties in Kenya.
| Calcium |
Iron |
Zinc |
||||
|---|---|---|---|---|---|---|
| Diff in mean, mg (SD) | PC (%) | Diff in mean, mg (SD) | PC (%) | Diff in mean, mg (SD) | PC (%) | |
| National | 12 (16) | 1.8 | 1.5 (1.2) | 7.6 | 0.3 (0.3) | 2.9 |
| Baringo | 8 (10) | 1.3 | 1.5 (0.9) | 6.3 | 0.4 (0.3) | 3.5 |
| Bomet | 17 (16) | 2.1 | 1.5 (1.1) | 7.5 | 0.3 (0.3) | 2.4 |
| Bungoma | 8 (8) | 1.3 | 1.3 (0.8) | 7.1 | 0.3 (0.2) | 2.4 |
| Busia | 7 (7) | 1.3 | 0.9 (0.6) | 6.1 | 0.2 (0.1) | 1.8 |
| Elgeyo/Marakwet | 10 (10) | 1.5 | 1.5 (0.9) | 6.8 | 0.3 (0.2) | 3.0 |
| Embu | 16 (16) | 2.8 | 2.1 (1.4) | 9.7 | 0.5 (0.3) | 4.3 |
| Garissa | –2 (4) | –0.5 | 0.3 (0.4) | 3.1 | 0.1 (0.1) | 1.4 |
| Homa Bay | 13 (13) | 1.3 | 1.7 (0.9) | 6.8 | 0.2 (0.2) | 1.6 |
| Isiolo | 1 (7) | 0.1 | 0.8 (0.5) | 5.4 | 0.3 (0.2) | 2.6 |
| Kajiado | 6 (10) | 1.0 | 0.9 (0.7) | 6.3 | 0.2 (0.2) | 2.4 |
| Kakamega | 23 (18) | 3.5 | 2.3 (1.5) | 10.1 | 0.3 (0.2) | 3.2 |
| Kericho | 10 (9) | 1.4 | 1.3 (0.7) | 6.4 | 0.3 (0.2) | 2.4 |
| Kiambu | 10 (13) | 1.3 | 1.4 (0.9) | 7.5 | 0.3 (0.3) | 2.7 |
| Kilifi | 5 (10) | 1.2 | 1.2 (1.0) | 5.4 | 0.3 (0.3) | 2.3 |
| Kirinyaga | 13 (16) | 1.9 | 1.9 (1.2) | 9.2 | 0.4 (0.3) | 3.3 |
| Kisii | 26 (16) | 2.7 | 2.0 (1.2) | 9.6 | 0.3 (0.2) | 2.9 |
| Kisumu | 7 (13) | 1.1 | 1.1 (0.9) | 6.7 | 0.2 (0.2) | 1.7 |
| Kitui | 8 (19) | 1.9 | 2.0 (1.3) | 8.1 | 0.6 (0.4) | 4.7 |
| Kwale | 9 (13) | 2.2 | 1.1 (1.0) | 6.3 | 0.3 (0.2) | 2.1 |
| Laikipia | 7 (13) | 1.1 | 1.5 (1.1) | 7.4 | 0.4 (0.3) | 3.3 |
| Lamu | 6 (14) | 1.2 | 1.3 (1.2) | 6.4 | 0.3 (0.3) | 3.3 |
| Machakos | 16 (26) | 2.7 | 2.0 (1.5) | 7.9 | 0.6 (0.5) | 3.9 |
| Makueni | 10 (17) | 1.9 | 2.0 (1.4) | 7.7 | 0.6 (0.5) | 4.1 |
| Mandera | –2 (4) | –0.9 | 0.4 (0.4) | 4.9 | 0.2 (0.1) | 3.4 |
| Marsabit | –3 (7) | –1.0 | 0.9 (0.6) | 6.3 | 0.4 (0.2) | 3.9 |
| Meru | 12 (15) | 1.9 | 2.3 (1.4) | 9.2 | 0.6 (0.4) | 4.3 |
| Migori | 7 (13) | 1.0 | 1.3 (1.0) | 6.9 | 0.2 (0.2) | 1.6 |
| Mombasa | 8 (9) | 1.4 | 1.2 (0.9) | 6.4 | 0.2 (0.2) | 2.1 |
| Murang'a | 11 (13) | 1.5 | 1.7 (1.0) | 8.5 | 0.4 (0.3) | 2.8 |
| Nairobi City | 15 (18) | 1.8 | 1.6 (1.2) | 7.7 | 0.4 (0.3) | 3.1 |
| Nakuru | 18 (17) | 2.1 | 1.9 (1.3) | 7.9 | 0.4 (0.3) | 3.4 |
| Nandi | 13 (11) | 1.9 | 1.6 (0.9) | 7.9 | 0.3 (0.2) | 2.4 |
| Narok | 13 (16) | 1.6 | 1.6 (1.0) | 7.4 | 0.3 (0.3) | 2.6 |
| Nyamira | 21 (18) | 2.6 | 1.7 (1.1) | 6.7 | 0.3 (0.2) | 2.8 |
| Nyandarua | 14 (14) | 2.1 | 1.8 (1.1) | 8.0 | 0.5 (0.4) | 3.5 |
| Nyeri | 16 (17) | 1.9 | 2.3 (1.5) | 9.6 | 0.5 (0.4) | 3.6 |
| Samburu | 0 (6) | 0.1 | 0.7 (0.5) | 6.2 | 0.2 (0.2) | 3.2 |
| Siaya | 8 (11) | 0.9 | 1.4 (0.9) | 6.5 | 0.3 (0.2) | 1.9 |
| Taita/Taveta | 16 (13) | 2.4 | 1.6 (0.9) | 8.6 | 0.3 (0.2) | 3.3 |
| Tana River | 3 (9) | 0.8 | 0.8 (0.7) | 5.9 | 0.2 (0.2) | 2.3 |
| Tharaka-Nithi | 15 (24) | 2.5 | 2.4 (1.8) | 7.5 | 0.7 (0.5) | 4.9 |
| Trans Nzoia | 19 (15) | 2.7 | 1.9 (1.2) | 9.1 | 0.3 (0.3) | 3.2 |
| Turkana | 0 (12) | 0.0 | 1.0 (1.0) | 6.9 | 0.3 (0.3) | 4.1 |
| Uasin Gishu | 11 (12) | 1.6 | 1.4 (1.0) | 7.7 | 0.3 (0.2) | 2.6 |
| Vihiga | 20 (13) | 3.0 | 1.7 (0.9) | 9.2 | 0.3 (0.2) | 2.6 |
| Wajir | –3 (4) | –0.9 | 0.4 (0.3) | 3.2 | 0.1 (0.1) | 1.8 |
| West Pokot | 8 (8) | 1.5 | 0.9 (0.6) | 6.4 | 0.2 (0.2) | 2.2 |
Diff, Difference, AsAcquired – AsConsumed.
SD, Standard Deviation of the mean differences.
PC, Percentage change, 100*((AsAcquired – AsConsumed)/AsAcquired.).
Estimated mean consumption, standard deviations and confidence intervals by food matching approach, are presented in Appendix A, for all the nutrients in the 48 population groups.
Among the 48 population groups considered, the maximum differences were for vitamin C (94 mg/capita/day and 47.2 % change in Kisii county) and vitamin A (48 μg/capita/day RAE and 79 μg/capita/day RE in Nyeri county). Vitamins B1 and B12 presented the second and third highest differences, in mean consumption estimates, in terms of percentage change (34.1 % in Kitui county and 26.5 % in Turkana county, respectively). The high percentage change for Vitamin C could be explained by its double loss effect during cooking, its solubility in water and being a heat-labile nutrient (Lee et al., 2018).
The extent of the difference in mean consumption estimates between the two approaches depended also on the diet typically consumed by the population. That is, populations with a considerable consumption of foods high in a specific micronutrient, such as vitamin A or vitamin B12, were expected to have higher differences for that micronutrient. For instance, the high differences in percentage change for vitamins A and B12 reflected the consumption of offal, which is high in both vitamins, and of Dagaa fish (omena) high in vitamin B12 (FAO and Government of Kenya, 2018).
It is important to note that the results obtained in this study are based on the foods consumed in Kenya, the cooking methods selected, and the criteria used to elaborate the FCTs/FCDBs. For instance, in the Kenya FCT all nutrient values of cooked foods were calculated from the analytical data of their raw form using cooking yield and nutrient retention factors (FAO and Government of Kenya, 2018), instead of being based on analyses of cooked food samples (which would be preferable).
The effectiveness of dietary assessments, crucial to avoid providing incorrect evidence for informing and developing nutrition-based programs and policies, depends (among other things) on following good practices for food matching, and the reliability and good quality of FCTs/FCDBs (Micha et al., 2018). Most published FCTs/FCDBs, especially from low- and middle-income countries, contain mostly or only nutrient content in raw foods. Efforts should be stepped up to support and fund the inclusion of cooked and processed foods in FCTs/FCDBs (Ene-Obong et al., 2019). Until national FCTs/FCDBs are updated to inform on cooked and processed foods, as consumed in the country, analysts in charge of producing dietary energy, macronutrients, calcium and/or zinc average consumption estimates, at national level using HCES data, could consider matching survey foods with raw foods in FCTs/FCDBs. However, caution should be taken when interpreting and using vitamins and iron statistics from dietary assessments (such as the level of inadequacy).
This study did not look at consumption estimates for particular foods or food groups; however, no difference is expected between the two food matching approaches for average estimates of dietary energy and macronutrient consumption at the food level, if food quantities are adjusted using cooking yield factors, because there are no nutrient losses/changes during processing and cooking (i.e., their retention factor value is 1).
4. Conclusions
The impact of the food matching approach (i.e., nutrient content in raw vs cooked food) on the average consumption estimates, using food consumption data collected in Kenya, varies depending on the nutrient of interest. Matching foods from the 2015/16 Kenyan IHBS with foods in their raw form in FCTs/FCDBs produced equivalent mean consumption estimates for dietary energy, macronutrients, calcium and zinc compared to matching them with foods as they are commonly consumed (having adjusted raw food quantities for changes due to moisture loss, water absorption, or fat gains/losses during food preparation). One implication of our results is the possibility of using HCES data, based on a raw food matching, to estimate a country’s national dietary energy consumption, which is one of the two parameters needed for computing the SDG 2.1.1. indicator, the prevalence of undernourishment.
However, in the case of vitamins A, B1, B2, B12, C and iron, the mean consumption estimates were not equivalent; a food matching based on nutrient composition in foods as consumed produces systematically lower mean estimates of these nutrients. Caution should be taken when producing and interpreting dietary nutrient consumption estimates, at national and subnational levels, based on HCES data; especially, indicators such as the level of inadequacy.
Author statement
Ana Moltedo: Conceptualization, Methodology, Software, Validation, Formal Analysis, Drafting – Original Draft, Visualization, Project Administration. Cristina Álvarez-Sánchez: Conceptualization, Methodology, Formal Analysis, Writing - Review & Editing. Talent Manyani: Software, Formal Analysis. Sofía Jiménez: Formal Analysis, Writing - Review & Editing. María Priscilla Ramos: Formal Analysis, Writing - Review & Editing. Estefanía Custodio: Formal Analysis, Writing - Review & Editing.
Funding
This work was supported by the European Commission Joint Research Centre and, through the Statistics Division of the Food and Agriculture Organization of the United Nations, by the Bill & Melinda Gates Foundation [MTF-GLO-707-BMG] and the European Commission (DEVCO) [GCP/INT/245/EC].
Declaration of Competing Interest
None.
Acknowledgments
The authors gratefully acknowledge Mr. Josiah Waithaka Kaara and his team, from the Kenya National Bureau of Statistics (KNBS), for giving access to the data and their expert advice; the KNBS Poverty Analysis Unit for their expert advice on county level statistics; and Ms. Fernanda Grande, for her expert advice on food composition and food matching.
Footnotes
Supplementary material related to this article can be found, in the online version, at doi:https://doi.org/10.1016/j.jfca.2021.103879.
Contributor Information
Ana Moltedo, Email: anamoltedo@gmail.com.
Sofía Jiménez, Email: sjimenez@unizar.es.
Cristina Álvarez-Sánchez, Email: cristina.alvarez@tc.columbia.edu.
Talent Manyani, Email: talentk89@yahoo.com.
María Priscila Ramos, Email: mpramos@economicas.uba.ar.
Estefanía Custodio, Email: estefania.custodio@ec.europa.eu, ecustodio2014@gmail.com.
Appendix A. Supplementary data
The following are Supplementary data to this article:
References
- Brantsaeter A.L., Haugen M., Julshamn K., Alexander J., Meltzer H.M. Evaluation of urinary iodine excretion as a biomarker for intake of milk and dairy products in pregnant women in the Norwegian Mother and Child Cohort Study (MoBa) Eur. J. Clin. Nutr. 2009;63:347–354. doi: 10.1038/sj.ejcn.1602952. [DOI] [PubMed] [Google Scholar]
- Bromage S., Rosner B., Rich-Edwards Jw., Ganmaa D., Tsolmon S., Tserendejid Z., Odbayar T.-O., Traeger M., Fawzi Ww. Comparison of methods for estimating dietary food and nutrient intakes and intake densities from household consumption and expenditure data in Mongolia. J. Nutr. 2018;10:703. doi: 10.3390/nu10060703. [DOI] [PMC free article] [PubMed] [Google Scholar]
- Burlingame B. Fostering quality data in food composition databases: visions for the future. J. Food Anal. 2004;17:251–258. doi: 10.1016/j.jfca.2004.03.026. [DOI] [Google Scholar]
- Coates J., Rogers B.L., Blau A., Lauer J., Roba A. Filling a dietary data gap? Validation of the adult male equivalent method of estimating individual nutrient intakes from household-level data in Ethiopia and Bangladesh. Food Policy. 2017;72:27–42. doi: 10.1016/j.foodpol.2017.08.010. [DOI] [Google Scholar]
- Coates J.C., Colaiezzi B.A., Bell W., Charrondiere U.R., Leclercq C. Overcoming dietary assessment challenges in low-income countries: technological solutions proposed by the international dietary data expansion (INDDEX) project. J. Nutr. 2017;9:289. doi: 10.3390/nu9030289. [DOI] [PMC free article] [PubMed] [Google Scholar]
- Eme P.E., Douwes J., Kim N., Foliaki S., Burlingame B. Review of methodologies for assessing sustainable diets and potential for development of harmonised indicators. Int. J. Environ. Res. Public Health. 2019;16:1184. doi: 10.3390/ijerph16071184. [DOI] [PMC free article] [PubMed] [Google Scholar]
- Ene-Obong H., Schönfeldt H.C., Campaore E., Kimani A., Mwaisaka R., Vincent A., El Ati J., Kouebou P., Presser K., Finglas P., Charrondiere U.R. Importance and use of reliable food composition data generation by nutrition/dietetic professionals towards solving Africa’s nutrition problem: constraints and the role of FAO/INFOODS/AFROFOODS and other stakeholders in future initiatives. Proc. Nutr. Soc. 2019;78:496–505. doi: 10.1017/S0029665118002926. [DOI] [PubMed] [Google Scholar]
- Fabbri A.D.T., Crosby G.A. A review of the impact of preparation and cooking on the nutritional quality of vegetables and legumes. Int. J. Gastron. Food Sci. 2016;3:2–11. doi: 10.1016/j.ijgfs.2015.11.001. [DOI] [Google Scholar]
- FAO . 2018. Dietary Assessment: a Resource Guide to Method Selection and Application in Low Resource Settings. Rome. [Google Scholar]
- FAO . 2019. Tonga Food Security Profile [WWW Document] URL www.fao.org/documents/card/en/c/CA6039EN (accessed 2.9.21) [Google Scholar]
- FAO, Government of Kenya . 2018. Kenya Food Composition Tables. Nairobi. [Google Scholar]
- FAO/INFOODS . 2012. Density Database (version 2.0). Rome (Italy) [Google Scholar]
- FAO/INFOODS . Guidelines for Food Matching, Version 1. FAO; Rome: 2012. ed. [Google Scholar]
- Fiedler J.L. Towards overcoming the food consumption information gap: strengthening household consumption and expenditures surveys for food and nutrition policymaking. J. Glob. Food Secur. 2013;2:56–63. [Google Scholar]
- Fiedler J.L., Mwangi D.M. 2016. Using Household Consumption and Expenditure Surveys to Make Inferences About Food Consumption, Nutrient Intakes and Nutrition Status: How Important Is It to Adjust for Meal Partakers? (No. 1571), Discussion Paper. Washington, D.C. [Google Scholar]
- Government of the Republic of Kenya . The National Treasury and Planning; Nairobi: 2018. THIRD MEDIUM TERM PLAN 2018 – 2022. [Google Scholar]
- Greenfield H., Southgate D.A.T. 2nd ed. FAO; Rome: 2003. Food Composition Data. Production, Management and Use. [Google Scholar]
- Hawkes C., Webster J. National approaches to monitoring population salt intake: a trade-off between accuracy and practicality? PLoS One. 2012;7 doi: 10.1371/journal.pone.0046727. [DOI] [PMC free article] [PubMed] [Google Scholar]
- Kapsokefalou M., Roe M., Turrini A., Costa H.S., Martinez-Victoria E., Marletta L., Berry R., Finglas P. Food composition at present: new challenges. Nutrients. 2019;11 doi: 10.3390/nu11081714. [DOI] [PMC free article] [PubMed] [Google Scholar]
- Karageorgou D., Imamura F., Zhang J., Shi P., Mozaffarian D., Micha R. Assessing dietary intakes from household budget surveys: a national analysis in Bangladesh. J. Public Libr. Sci. One. 2018;13 doi: 10.1371/journal.pone.0202831. [DOI] [PMC free article] [PubMed] [Google Scholar]
- Kenya National Bureau of Statistics . 2015. Kenya Integrated Household Survey Data 2015/2016 [WWW Document] URL http://54.213.151.253/nada/index.php/catalog/88 (Accessed 12.15.19) [Google Scholar]
- Kenya National Bureau Statistics . Kenya National Bureau of Statistics; 2018. Basic Report 2015/16 Kenya Integrated Household Budget Survey. [Google Scholar]
- Lee S., Choi Y., Jeong H.S., Lee J., Sung J. Effect of different cooking methods on the content of vitamins and true retention in selected vegetables. Food Sci. Biotechnol. 2018;27:333–342. doi: 10.1007/s10068-017-0281-1. [DOI] [PMC free article] [PubMed] [Google Scholar]
- Leys C., Ley C., Klein O., Bernard P., Licata L. Detecting outliers: do not use standard deviation around the mean, use absolute deviation around the median. J. Exp. Soc. Psychol. 2013;49:764–766. doi: 10.1016/j.jesp.2013.03.013. [DOI] [Google Scholar]
- Longvah T., Ananthan R., Bhaskarachary K., Venkaiah K. 2017. Indian Food Composition Tables. National Institute of Nutrition, Indian Council of Medical Research, Department of Health Research, Ministry of Health and Family Welfare, Government of India. [Google Scholar]
- Micha R., Coates J., Leclercq C., Charrondiere U.R., Mozaffarian D. Global dietary surveillance: data gaps and challenges. Food Nutr. Bull. 2018;39:175–205. doi: 10.1177/0379572117752986. [DOI] [PubMed] [Google Scholar]
- Moltedo A., Troubat N., Lokshin M., Sajaia Z. World Bank; Washington (DC): 2014. Analyzing Food Security Using Household Survey Data: Streamlined Analysis with ADePT Software. [DOI] [Google Scholar]
- Moltedo A., Álvarez-Sánchez C., Troubat N., Cafiero C. 2018. Optimizing the Use of ADePT-Food Security Module for Nutrient Analysis: ADePT-FSM Version 3. Rome (Italy) [Google Scholar]
- Muhimbili University of Health and Allied Sciences . Tanzania Food Composition Tables. 1st ed. MUHAS- TFNC, HSPH; Dar es Salaam: 2008. Tanzania food and nutrition center, harvard school of public health. [Google Scholar]
- Murphy E.W., Criner P.E., Gray B.C. Comparisons of methods for calculating retentions of nutrients in cooked foods. J. Agric. Food Chem. 1975;23:1153–1157. doi: 10.1021/jf60202a021. [DOI] [PubMed] [Google Scholar]
- Rawal V., Bansal V., Bansal P. Econ. Polit. Wkly; 2019. Prevalence of Undernourishment in Indian States Explorations Based Data, NSS 68th Round [WWW Document] URL https://www.epw.in/journal/2019/15/special-articles/prevalence-undernourishment-indian-states.html (Accessed 2.19.21) [Google Scholar]
- Rippin H.L., Hutchinson J., Evans C.E.L., Jewell J., Breda J.J., Cade J.E. National nutrition surveys in Europe: a review on the current status in the 53 countries of the WHO European region. Food Nutr. Res. 2018;62 doi: 10.29219/fnr.v62.1362. [DOI] [PMC free article] [PubMed] [Google Scholar]
- Russell J., Lechner A., Hanich Q., Delisle A., Campbell B., Charlton K. Assessing food security using household consumption expenditure surveys (HCES): a scoping literature review. Public Health Nutr. 2018;21:2200–2210. doi: 10.1017/S136898001800068X. [DOI] [PMC free article] [PubMed] [Google Scholar]
- Smith L.C., Subandoro A. International Food Policy Research Institute (IFPRI); Washington D.C: 2007. Measuring Food Security Using Household Expenditure Surveys, Food Security in Practice Technical Guide Series. [DOI] [Google Scholar]
- Smith L.C., Dupriez O., Troubat N. 2014. Assessment of the Reliability and Relevance of the Food Data Collected in National Household Consumption and Expenditure Surveys (No. 008) [Google Scholar]
- Sununtnasuk C., Fiedler J.L. Can household-based food consumption surveys be used to make inferences about nutrient intakes and inadequacies? A Bangladesh case study. J. Food Policy. 2017;72:121–131. doi: 10.1016/j.foodpol.2017.08.018. [DOI] [Google Scholar]
- Technical University of Denmark National Food Institute . 2016. Database Frida Food Data (version 2) [WWW Document] URL https://frida.fooddata.dk/disclaimer?lang=en (accessed 5.1.19) [Google Scholar]
- U.S. Department of Agriculture Agricultural Research Service . 2019. Food Data Central [WWW Document] URL https://fdc.nal.usda.gov/ (accessed 5.3.20) [Google Scholar]
- Vásquez-Caicedo A.L., Bell S., Hartmann B. European Food Information Resource; 2019. Report ON Collection of Rules on Use of Recipe Calculation Procedures Including the Use of Yield And Retention Factors for Imputing Nutrient Values for Composite Foods. [Google Scholar]
- Vincent A., Grande F., Compaoré E., Amponsah Annor G., Addy P.A., Aburime L.C., Ahmed D., Bih Loh A.M., Dahdouh Cabia S., Deflache N., Dembélé F.M., Dieudonné B., Edwige O.B., Ene-Obong H.N., Fanou Fogny N., Ferreira M., Omaghomi Jemide J., Kouebou P.C., Muller C., Nájera Espinosa S., Ouattara F., Rittenschober D., Schönfeldt H., Stadlmayr B., van Deventer M., Razikou Yiagnigni A., Charrondière U.R. FAO; Rome (Italy): 2020. FAO/INFOODS Food Composition Table for Western Africa (2019) User Guide & Condensed Food Composition Table. [Google Scholar]
- Walker E., Nowacki A.S. Understanding equivalence and noninferiority testing. J. Gen. Intern. Med. 2011;26:192–196. doi: 10.1007/s11606-010-1513-8. [DOI] [PMC free article] [PubMed] [Google Scholar]
- World Health Organization . World Health Organization; Copenhagen: 2015. European Food and Nutrition Action Plan 2015–2020. [Google Scholar]
- Zhang L., Geelen A., Boshuizen H.C., Ferreira J., Ocké M.C. Importance of details in food descriptions in estimating population nutrient intake distributions. Nutr. J. 2019;18:17. doi: 10.1186/s12937-019-0443-5. [DOI] [PMC free article] [PubMed] [Google Scholar]
Associated Data
This section collects any data citations, data availability statements, or supplementary materials included in this article.