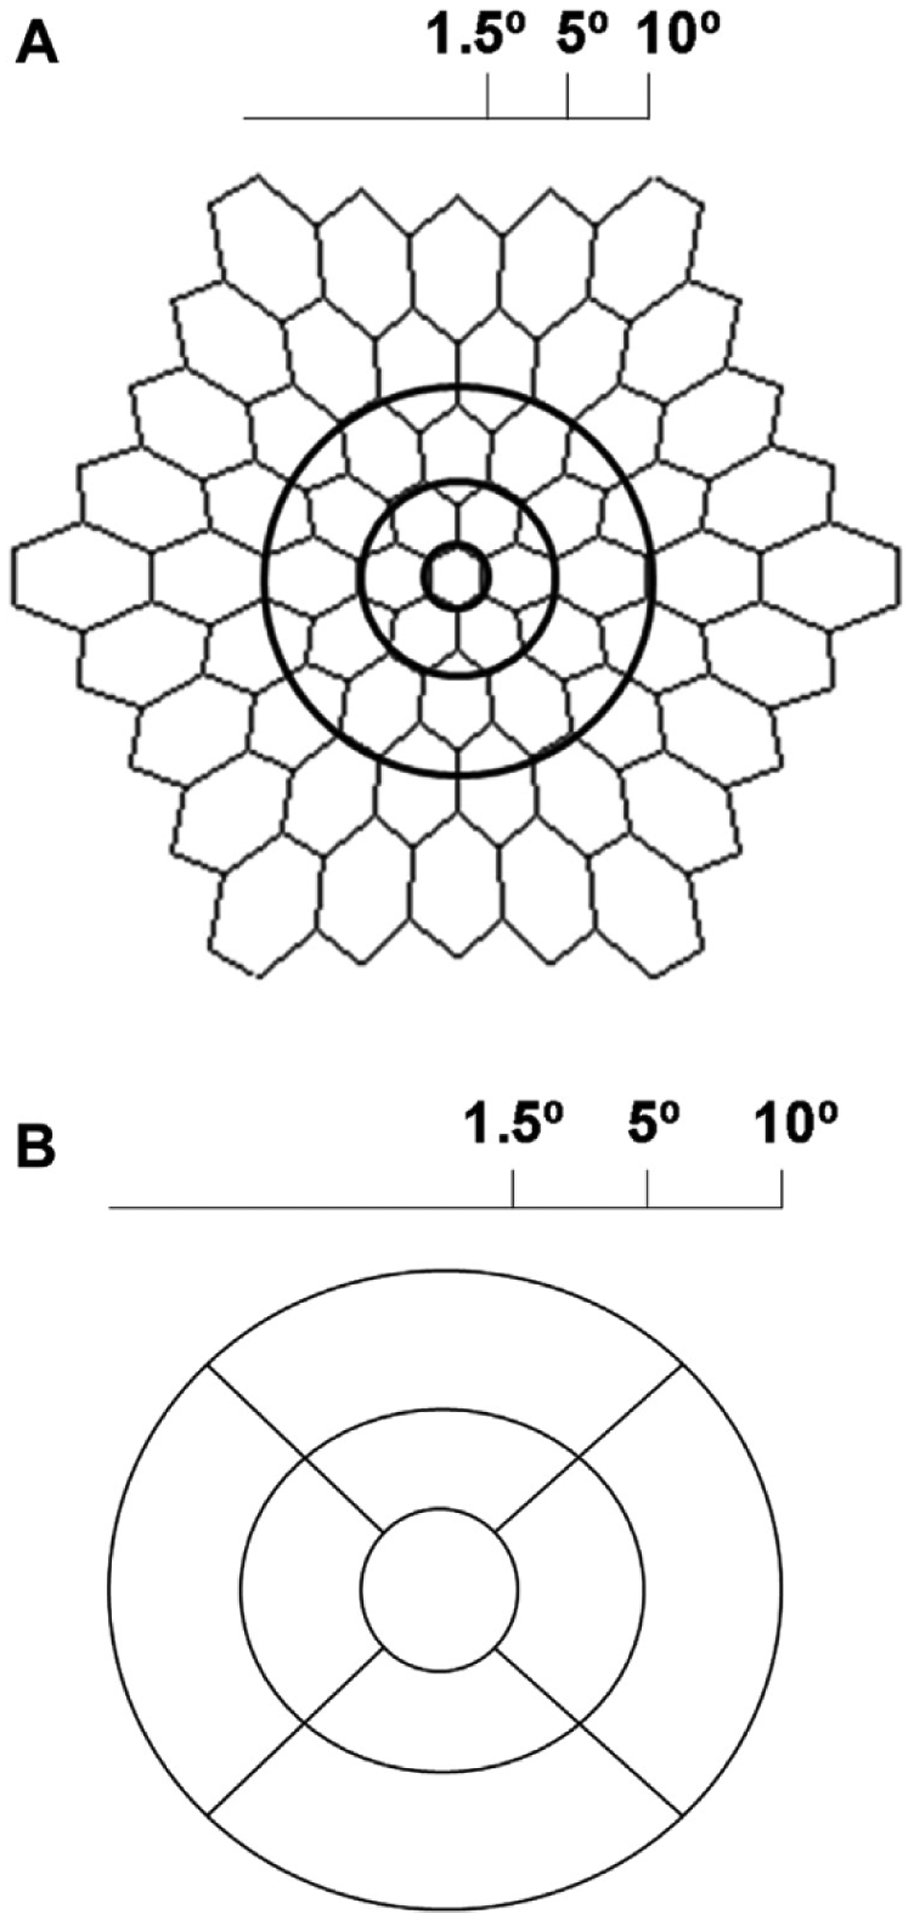
Figure 1.

A, Multifocal electroretinography image demonstrating anatomic location for generation of ring ratios. Ring 1 corresponds to the central 3°, ring 2 represents the area from 3° to 10°, and ring 3 covers the area from 10° to 20°. B, Diagram showing the anatomic location of the optical coherence tomography subfields. The central subfield represents the central 3°, the inner subfield represents the area from 5° to 10°, and the outer subfield corresponds to the area from 10° to 20°.
