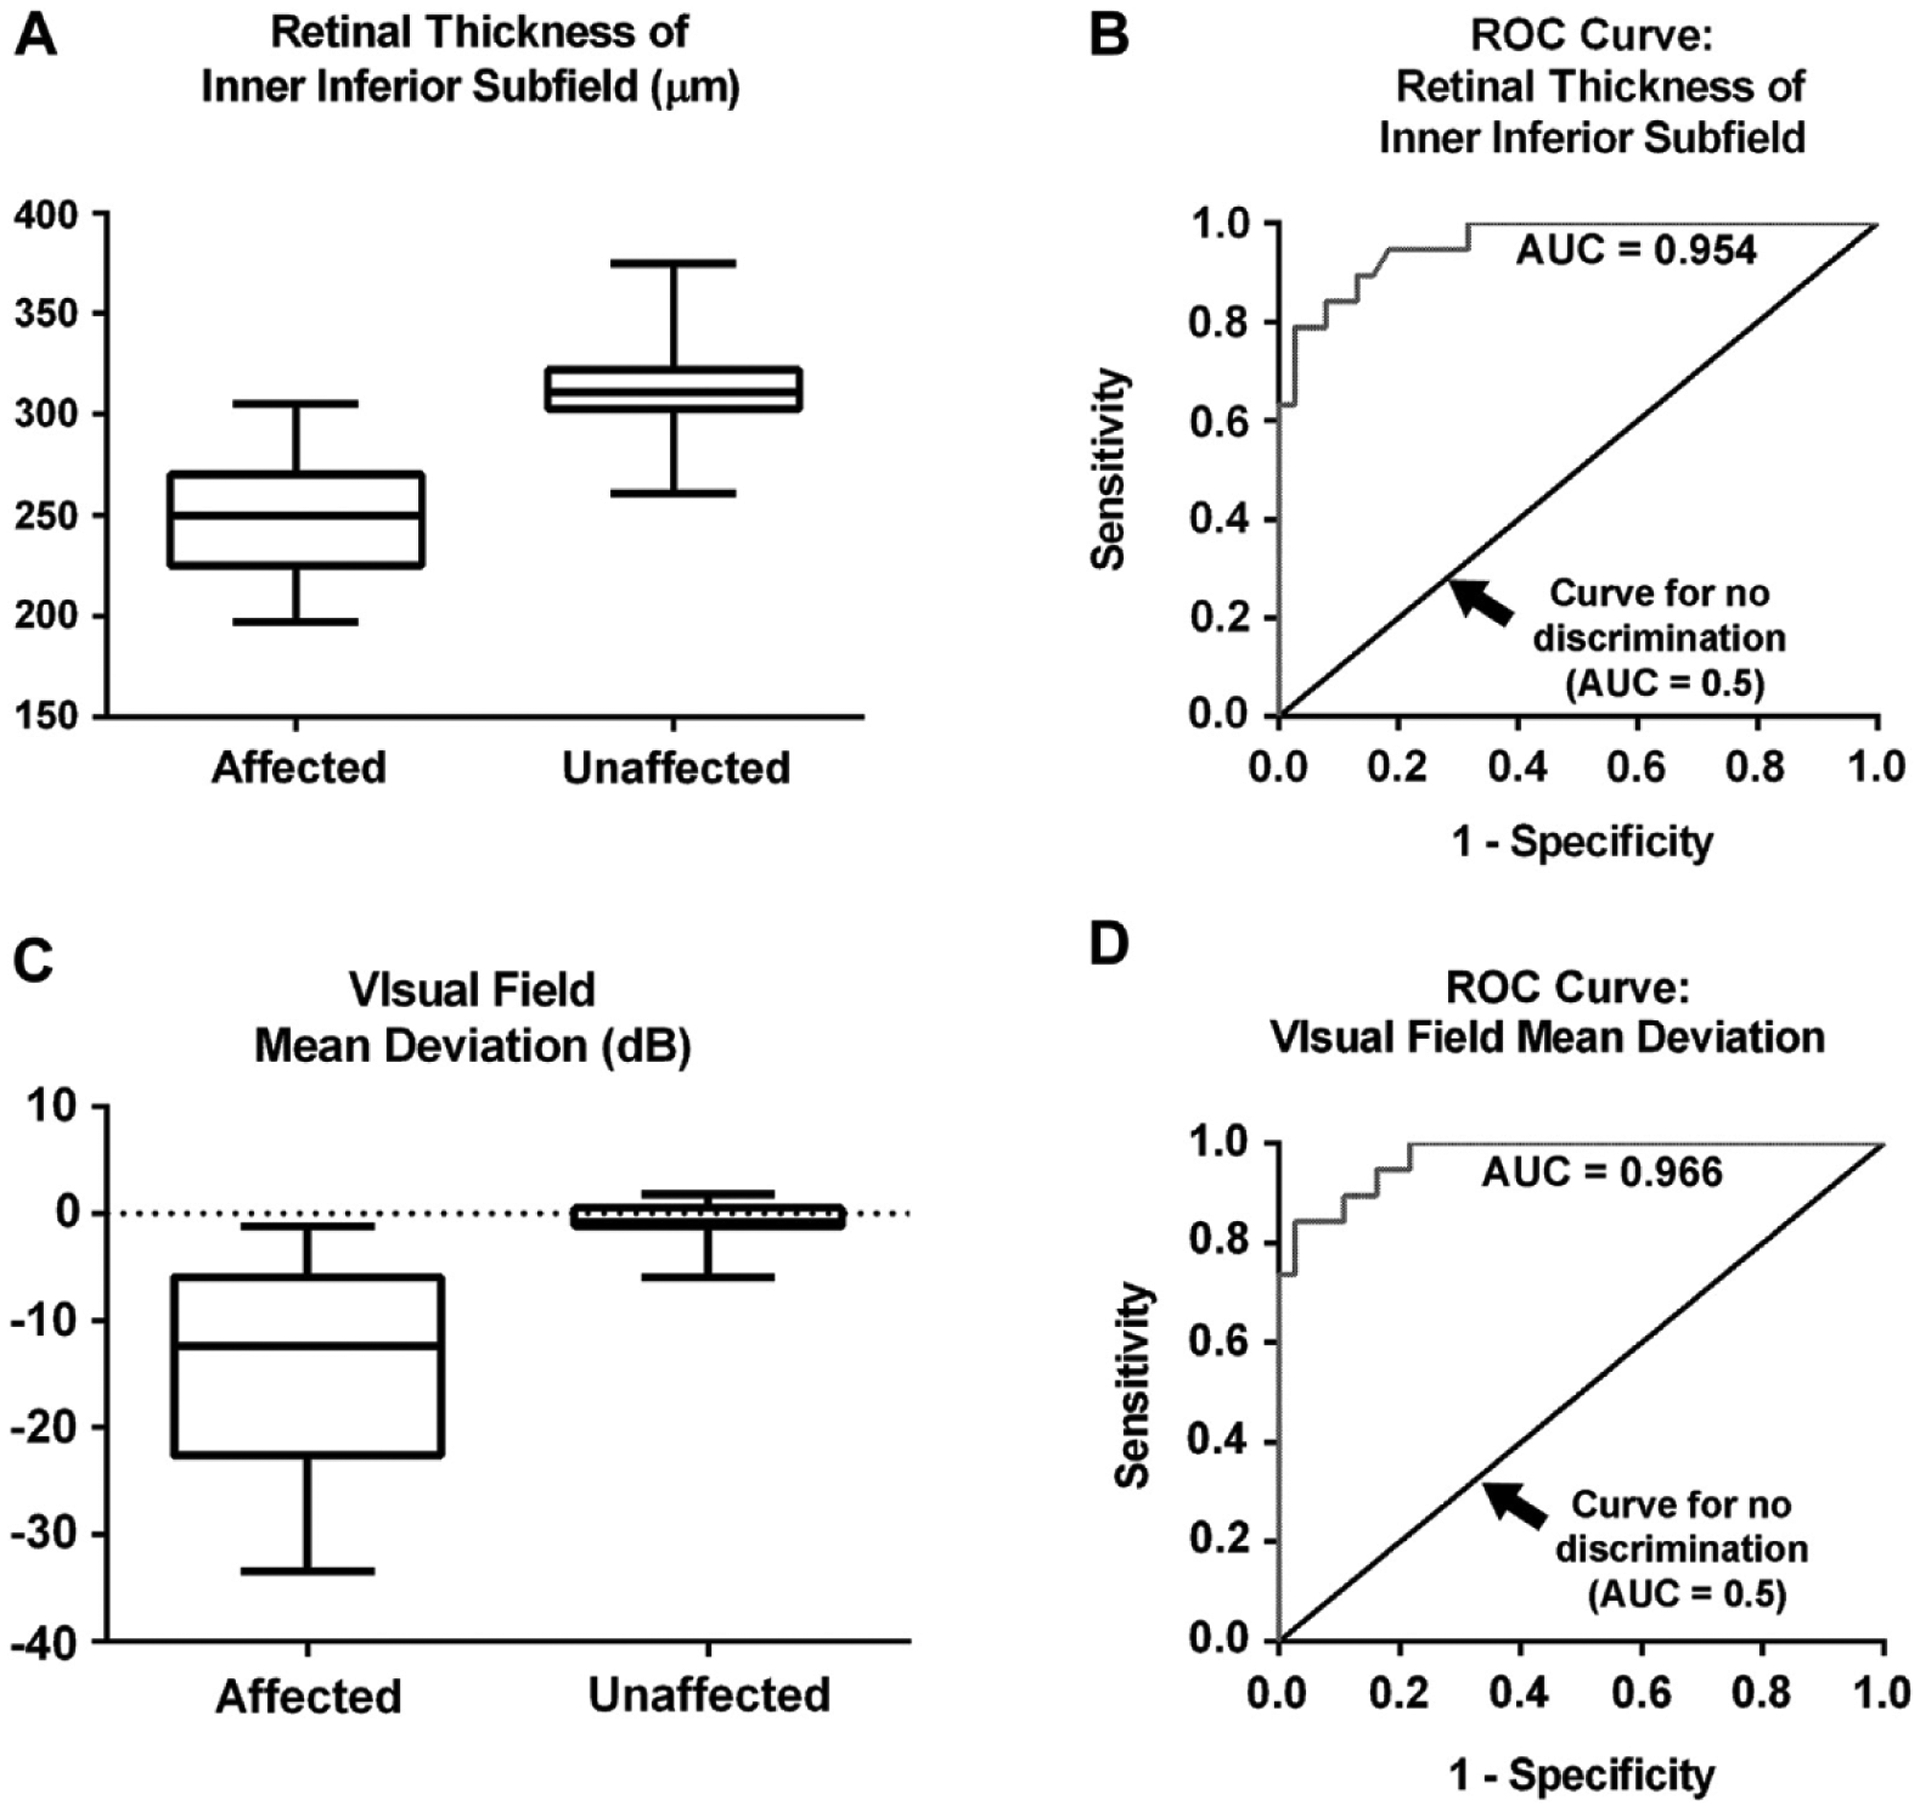
Figure 6.

Rox-and-whisker plot for affected and unaffected patients showing (A) optical coherence tomography (OCT) inner inferior subfield retinal thickness and (B) the retinal thickness of inner inferior subfield from the OCT. Shaded boxes represent values from the 25th to 75th percentile with whiskers extending to the 1st percentile and 99th percentile. Receiver operating characteristic (ROC) curves for (C) OCT inner inferior subfield retinal thickness and (D) visual field mean deviation. AUC = area under the ROC curve.
