

Abstract
During aging humans lose midbrain dopamine neurons, but not all dopamine regions exhibit vulnerability to neurodegeneration. Microglia maintain tissue homeostasis and neuronal support, but microglia become senescent and likely lose some of their functional abilities. Since aging is the greatest risk factor for Parkinson’s disease, we hypothesized that aging-related changes in microglia and neurons occur in the vulnerable substantia nigra pars compacta (SNc) but not the ventral tegmental area (VTA). We conducted stereological analyses to enumerate microglia and dopaminergic neurons in the SNc and VTA of 1-, 6-, 9-, 18-, and 24-month-old C57BL/J6 mice using sections double-stained with tyrosine hydroxylase (TH) and Iba1. Both brain regions show an increase in microglia with aging, whereas numbers of TH+ cells show no significant change after 9 months of age in SNc and 6 months in VTA. Morphometric analyses reveal reduced microglial complexity and projection area while cell body size increases with aging. Contact sites between microglia and dopaminergic neurons in both regions increase with aging, suggesting increased microglial support/surveillance of dopamine neurons. To assess neurotrophin expression in dopaminergic neurons, BDNF and TH mRNA were quantified. Results show that the ratio of BDNF to TH decreases in the SNc, but not the VTA. Gait analysis indicates subtle, aging-dependent changes in gait indices. In conclusion, increases in microglial cell number, ratio of microglia to dopamine neurons, and contact sites suggest that innate biological mechanisms compensate for the aging-dependent decline in microglia morphological complexity (senescence) to ensure continued neuronal support in the SNc and VTA.
Keywords: aging-dependent neurodegeneration, dopamine neurons, microglia complexity, Parkinson’s disease, stereological analyses, tyrosine hydroxylase, microglia senescence
1 |. INTRODUCTION
Aging of the central nervous system (CNS) is one of the major risk factors for the development of the second most prevalent neurodegenerative disorder, Parkinson’s disease (PD) (Bennett et al., 1996; Reeve, Simcox, & Turnbull, 2014). The incidence of PD increases sharply in humans toward the end of the fifth decade of life (Driver, Logroscino, Gaziano, & Kurth, 2009). Degeneration of dopamine neurons is considered a hallmark of PD, but neuronal loss also occurs with normal aging (Beach et al., 2007; Buchman et al., 2012). Age-dependent loss of dopamine neurons is exacerbated in PD, and neuronal loss is more severe in the substantia nigra pars compacta (SNc) than in the neighboring ventral tegmental area (VTA) (Lebowitz & Khoshbouei, 2019). In addition to differential sensitivity to neurodegeneration, there are fundamental functional differences between SNc and VTA dopamine neurons. In mice, SNc and VTA dopamine neurons exhibit differences in tonic firing rates, with the highest firing rate in SNc neurons, and the lowest in VTA (Krashia et al., 2017). The higher pacemaker activity of SNc dopamine neurons is implicated in their heightened vulnerability profile (Courtney, Mamaligas, & Ford, 2012; Cragg & Greenfield, 1997; Keath, Iacoviello, Barrett, Mansvelder, & McGehee, 2007). It is unknown whether neuroanatomical features of SNc versus VTA contribute to their differential vulnerability in aging. Understanding why substantia nigra dopamine neurons exhibit greater vulnerability to age-related neurodegeneration has been puzzling. A number of theories, such as different levels of dopamine transporter in the VTA versus SNc, differential calcium buffering capacities, or variations in reducing oxidative stress are proposed to describe the differential sensitivity of SNc dopamine neurons in aging (Butler et al., 2015; Lebowitz & Khoshbouei, 2019). However, it is likely that the aging-associated loss of dopamine is not the result of one single cause, but instead due to a general decline of innate neuroprotective mechanisms in the SNc versus VTA (Reeve et al., 2014).
Microglia are the resident CNS immune cells and involved in a multifaceted range of physiological functions (Kettenmann, Hanisch, Noda, & Verkhratsky, 2011). A common denominator for all microglial surveillance activities is neuroprotection, that is, microglia, like all glial cells, support and protect neurons from damage and infection, and help injured neurons recover from injury (Streit, 2002). Studies in human brain have shown that with normal aging microglia undergo characteristic changes in their morphology that are indicative of cell senescence (Streit, Sammons, Kuhns, & Sparks, 2004). These morphological abnormalities involving microglial cytoplasmic processes are grouped under the term microglial dystrophy. Dystrophy involves a number of morphological changes, such as formation of shortened, tortuous, or beaded processes, formation of spheroidal swelling, and even cytoplasmic fragmentation into numerous small pieces. Interestingly, dystrophic morphology of microglia is conspicuous only in human brain, and has been difficult to detect in aged rodents (Streit, Xue, Tischer, & Bechmann, 2014; Tischer et al., 2016). While the functionality of dystrophic microglia is likely compromised, the cells may still be viable, as suggested by presence of an intact nucleus. Also, some of the apparently disconnected microglial cytoplasmic fragments often retain continuity with one another via very thin cytoplasmic bridges, and thus should be called “pseudo-fragmented” (Tischer et al., 2016). It has been shown that microglial dystrophy becomes extensive in cases of Alzheimer’s disease and Down syndrome (Streit, Braak, Xue, & Bechmann, 2009; Xue & Streit, 2011) and that it often colocalizes with neurofibrillary degeneration, supporting the idea that microglial senescence contributes to neurodegeneration (Bussian et al., 2018). Presumably microglia lose at least some of their neuroprotective abilities as a result of senescence-related functional deterioration.
A major goal of the current study was to determine whether or not age-related changes in microglial morphology can be detected in the VTA and SNc of normal mouse brain. Of particular interest to this laboratory was the midbrain, and the question of whether the known decline in dopamine neurons that occurs with aging in humans and in rodents is accompanied by deterioration of microglial morphology in dopaminergic regions. We investigated the hypothesis that an aging-related decline in SNc dopamine neurons, which in humans leads to PD, involves dystrophic changes in microglia, which would support the idea that microglial senescence also drives the progression of age-related neurodegenerative pathologies in PD. Understanding the effects of aging on microglia in the SNc and VTA may be important for dopaminergic neurodegeneration in aging.
2 |. MATERIALS AND METHODS
2.1 |. Animals
Except for measurement of gait parameters, all experiments and data analyses were performed double-blinded, meaning both tissue processing/staining and data analyses were done in a blinded manner. The gait analyses were performed under single-blind condition. The experiments were approved by the Institutional Animal Care and Use Committee at the University of Florida and all efforts were made to minimize the number of animals used. Wild-type male C57BL/6 mice at the ages of 1-, 6-, 9-, 18- and 24-month-old were maintained under standardized condition of 12 hr light/dark cycle and given ad libitum access to food and water. Aged C57BL/6 mice were obtained from National Institute on Aging.
2.2 |. Chemicals
All chemicals were purchased from Sigma-Aldrich (St Louis, MO), unless stated otherwise.
2.3 |. Immunohistochemistry
Tissue processing and staining were performed for all age groups simultaneously. Immunohistochemical staining, imaging and data analyses were performed under double-blind condition. Mice were anesthetized with isoflurane and perfused transcardially with phosphate buffered saline (PBS, pH 7.4) followed by 4% paraformaldehyde (PFA). Brains were then postfixed in 4% PFA for 24–48 hr at 4°C and stored in PBS. Brains were sliced at 40 μm using a vibratome (Leica Biosystems, Wetzlar, Germany). For immunohistochemical staining, sections were heated in 10 mM sodium citrate (pH 6) at 95–99°C for 20 min followed by two rinses in PBS. Free-floating sections were blocked and permeabilized in 10% normal goat serum (Lampire Biological Products, Pipersville, PA) and 0.3% Triton X-100 (Sigma) in PBS and incubated at 37°C for 1 hr. Sections were then transferred to primary antibody solution containing 0.3% Triton X-100, 5% normal goat serum, and rabbit anti- Ionized calcium binding adaptor molecule 1 (Iba1) and mouse anti-TH, or mouse anti-HuC/D and rabbit anti-TH, or chicken anti-Ki67 and rabbit anti-Iba1 (Table 1). Sections were incubated with primary antibodies at 4°C overnight, and then washed in PBS three times, 20 min each. Sections were incubated with secondary antibodies for 1 hr at room temperature in the dark and then washed with PBS. Sections were mounted on slides and cover slipped with Flouromount G (Southern Biotechnology, Birmingham, AL). Negative controls (2ndry only staining) verified antibody specificities.
TABLE 1.
Antibody information
| Primary antibody | Dilution | Vendor |
|---|---|---|
| Mouse anti-TH monoclonal | 1:400 | Cat #: MCA-4H2; EnCor Biotechnology |
| Rabbit anti-Iba1 | 1:800 | Cat #: 019-19741; Wako Chemicals |
| Rabbit anti-TH polyclononal | 1:500 | Cat #: RPCA-TH; EnCor Biotechnology |
| Mouse anti-HuC/HuD | 1:500 | Cat #: A-21271; Thermofisher Scientific |
| Chicken anti-Ki67 | 1:500 | Cat #: CPCA-Ki67; EnCor Biotechnology |
| Secondary antibody | Dilution | Vendor |
| Goat anti-mouse, Alexa Fluor 488 | 1:400 | Cat #: A21121; Life Technologies |
| Goat anti-rabbit, Alexa Fluor 568 | 1:800 | Cat #: A11011; Life Technologies |
| Goat anti-rabbit, Alexa Fluor 488 | 1:500 | Cat #: A11034; Life Technologies |
| Goat anti-mouse, Alexa Fluor 568 | 1:500 | Cat #: A21144; Life Technologies |
| Goat anti-chicken, Alexa Fluor 488 | 1:500 | Cat #: A-11039; Life Technologies |
2.4 |. TUNEL assay
The Terminal deoxynucleotidyl transferase dUTP nick end labeling (TUNEL) assay was perfrmed under double-blind conditions using the ApopTag Peroxidase in Situ Apoptosis Detection Kit (Millipore Sigma, Billerica, MA) to detect DNA fragmentation in cells undergoing end-stage apoptosis. Briefly, 10-μm frozen sections were incubated with Proteinase K to digest proteins, and then quenched with 3% hydrogen peroxide to deactivate endogenous peroxidases. Sections were incubated in equilibrium buffer, terminal deoxynucleotidyl transferase reaction buffer and anti- digoxigenin-peroxidase. Finally, sections were incubated with 3,3′-diaminobenzidine solution in the dark and counterstained with cresyl violet. The sections then were coverslipped with mounting medium. Postnatal day 5 (PND5) brain was used as a positive control for TUNEL staining. To ensure consistent comparisons, tissue processing, and staining were performed for all age groups simultaneously.
2.5 |. Image acquisition and morphometric analyses
Image acquisition and morphometric analyses were performed double-blinded. SNc and VTA Z-stacked images were captured using a ×60 oil immersion objective on a confocal laser scanning microscope equipped with a Nikon A1 system (Nikon, Japan). SNc and VTA regions were defined using the Paxinos and Franklin Mouse Brain Atlas and areas occupied by TH positive neurons. For all morphometric analyses, the Image J software was used. Maximum intensity projections of the cells were thresholded to create a binary mask. Binary images of 30–86 individual microglial cells per region for each mouse brain were used to perform morphometric analysis (incomplete microglia and microglia with processes on the margin were excluded). For Sholl analysis, a line was drawn from the center of the soma extending to the endpoint of the longest branch. The Sholl analysis plugin was used to draw concentric circles starting from 0 μm followed by 1 μm successive shells in order to identify the number of intersections along the Sholl radii (Heindl et al., 2018; Xu et al., 2016). For skeleton analysis, images of individual microglia were prepared by noise de-speckling to remove pixelated background fluorescence. Using the skeleton plugin, images were skeletonized to quantify the number of branches and the sum of the processed lengths of each individual microglia (Morrison & Filosa, 2013). Territories covered by individual microglial cells were calculated in ImageJ software using a convex hull bounding. Regions of interest (ROIs) were drawn manually around the soma of microglia and the area was quantified in ImageJ.
2.6 |. Stereological analysis
Stereological analyses were performed double-blinded. Tissue processing and staining were performed for all age groups simultaneously. Forty-micron coronal sections were used for stereological analysis. Based on the optical fractionator method (using a Zeiss fluorescent microscope), total numbers of TH positive neurons and Iba1 positive microglia were counted in the VTA and SNc. ROIs were out-lined at ×5 magnification for the entire rostral to caudal extent of the midbrain in one hemisphere. The total number of sections for stereological analyses from each hemisphere was 12. To account for ~10% tissue shrinkage in the z-plane, the mean section thickness for counting was set to 36 μm in the Stereo Investigator software (MBF Bioscience, Williston, VT). TH, Iba1, and HuC/D immunolabeled cells were counted at a ×20 magnification in the z-axis. Sampling grid sizes and counting frames (80 × 80 μm) were used in order to have a Gundersen coefficient error of 0.1 or less (Banuelos et al., 2013; Miller et al., 2018). TH positive neurons were included if the cytoplasm of the cell was clearly labeled and contained an unstained nucleus. Microglial cells were counted if the soma of the microglia cells were stained with Iba1. HuC/D immunolabeled neurons were identified as stained cell bodies. The total number of cells was estimated by multi-plying the sum of the cells by the reciprocal of the region sample.
2.7 |. Facial nerve axotomy
Animals (4–6 weeks of age) were anesthetized with isoflurane. The foot of each mouse was pinched to ensure depth of anesthesia. A skin incision was made behind the right ear, and the main trunk of the facial nerve was identified and transected near the stylomastoid foramen. Following axotomy, the wound was closed with sutures. The animal was then allowed to recover, and facial nerve transection was verified by observing lack of whisker movement on the ipsilateral side. The contralateral unlesioned side served as a control. Animals were euthanized three or 4 days after axotomy.
2.8 |. Gait parameters
Experiments were performed for all age groups simultaneously. The analyses were performed under blind condition. Mice underwent behavioral testing to assess differences in gait indices. Mice were weighed and observed for any abnormalities or health issues. Their paws were painted with red finger paint; then allowed to dry. Before each behavioral experiment, the treadmill was briefly turned on for each mouse to get habituated to the environment and proper direction of walking. The mice then walked at a speed of 10 cm/s and ventral videography recording began once they were stable. Gait analyses were processed using Digi Gait Imaging System (Mouse Specifics, Inc., Framingham, MA) to collect data on the animals’ stride length, stride frequency per second, paw angle variability, and limb loading. Max dA/dT were defined as the maximum paw area placed on the treadmill surface over time.
2.9 |. RNAscope assay
The RNAscope assay and analyses were performed double-blinded. Experiments were performed for all age groups simultaneously. Immediately following behavioral testing, animals were perfused in RNase free conditions. The brains were submerged in 10% sucrose, followed by 20 and 30% sucrose in RNase free PBS until they were equilibrated with the solution. The tissues were embedded in tissue freezing medium and stored at −80°C. Fixed-frozen brains were sectioned at 10 μm using a cryostat and mounted on Superfrost Plus slides (Fisher Scientific, Hampton, NH). Sections were stored at −80°C until use for RNAscope assay. Under RNase free conditions, sections were rehydrated with PBS for 5 min, then incubated in citrate buffer at 95–100°C for 5 min. After heat-antigen retrieval, sections were washed with molecular grade RNase free water and dehydrated with 100% ethanol. Sections were then treated with protease inhibitor (Cat No. 322337, Advance Cell Diagnostics, Newark, CA) and placed in a humidified chamber for 30 min at 40°C. Sections were incubated for 2 hr at 40°C with the following probes: TH and brain-derived neurotrophic factor (BDNF) (Table 2). Sections were then washed twice with wash buffer for 2 minutes. Thereafter, sections underwent a series of amplification steps, followed by another wash and subsequent staining with DAPI. Sections were coverslipped for imaging. RNAscope multiplex fluorescent assay (Cat No. 320850; Advanced Cell Diagnostics) was utilized. Z-stack images were acquired under a 60X oil immersion objective using confocal microscopy, and density of TH signal and area, and mRNA counts of BDNF were defined using the ImageJ software.
TABLE 2.
RNAscope probes, source and catalog numbers
| RNAscope probe | Catalog number | Species | Target region |
|---|---|---|---|
| 3-plex positive control probe-Mm | 320881 | Mouse | N/A |
| 3-plex negative control probe | 320871 | Any | N/A |
| Mm-Bdnf | 424821 | Mouse | 729-1974 bp |
| Mm-Th-C3 | 317621-C3 | Mouse | 483-1603 bp |
2.10 |. Contact sites
The imaging and analyses were performed under blind condition. 3D confocal stacks of SNc and VTA were captured using a ×40 oil immersion objective on the confocal laser scanning microscope (Nikon, Japan) from 3 to 4 sections for each brain. Immunofluorescence signals in each image were visualized by color look-up tables to emphasize different structures and thresholded by a macro in Element software. Cell–cell contacts were identified by the overlap of Iba1 and neuronal TH immunofluorescence signals using the Element software. Overlap areas were identified using the intersection process tool in Element on 3D binary masks of the two immunofluorescent signals Iba1 and TH. The 3D mask of TH positive cells was used to calculate TH areas. To avoid noise caused by image processing, particles smaller than 3 μm were removed from the analyses (Lana et al., 2019). For data normalization, microglia-TH positive neuron contact areas were calculated and shown per TH areas.
2.11 |. Mathematical modeling
The goal for the mathematical modeling was to project for several traits at 30 months of age. Projecting datasets describing various traits requires flexible but uniform methodology for projections. Continuous functions were considered based on polynomials, exponentials, rational functions, and their combinations. For each data set describing a trait, 5–10 functional models specific for the dataset were defined so that the functions fit the data and do not exhibit singularities in the domain of definition from 1 to 30. The functional models were fitted to the data using Poisson distribution with mean given by the value of the functional model at each time point. Instead of maximizing the likelihood, the negative log-likelihood were minimized. The best parameters for each model were computed that minimize the negative log-likelihood for that model and the data. Corrected Akaike Information Criterion (AICc) were further computed for each model and each data set. A model that has the smallest AICc were determined for each data set. AICc for reference was used to compute the Akaike weight of each model for each data set. Finally, for each data set and each trait, a function was computed, which is a linear combination of the functional models in the modeling set with coefficients given by the corresponding Akaike weights. The computed function was used to project the values of the trait to 30 months (Burnham & Anderson, 2002).
2.12 |. Statistical analysis
To detect for significant differences among three or more age groups, a one-way ANOVA with Tukey’s post hoc analysis was performed. To test for differences between regions at three or more different ages, a two-way ANOVA was used. Unpaired t-test (two-tailed) was used to detect differences between the SNc and VTA. Differences are significant if p-value was less than 0.05. All experimental data are presented as mean ± SEM.
For correlation of BDNF expression with morphological features of microglia, BDNF and microglial measurements were imported into MATLAB (MathWorks, Natick, MA) and processed using custom code (available upon request). BDNF measurements were correlated with microglia properties using Pearson’s correlation coefficient that was used subsequently to determine R2 values.
3 |. RESULTS
3.1 |. Aging increases the ratio of microglia to TH-positive (TH+) neurons in both dopaminergic midbrain areas, SNc and VTA
To understand the spatiotemporal distribution, numbers, and heterogeneity of microglia in dopaminergic regions, we evaluated numbers of Iba1+ and TH+ cells in five different age groups of male C57BL/6 mice using an optical fractionator technique (Figure 1). Our data show that numbers of microglia in the SNc increase as mice age and this increase is significant in 18- and 24-month-old mice compared to 9-month-old mice (Figure 2c). While numbers of Iba1-positive cells also show a significant decrease in 9-month- old mice compare to 1- and 6-month-old mice, they increased with aging in the VTA in 18-month-old brain. There is no statistically significant change in the number of microglia in 24-month-old mice compared to the other age groups. The changes in TH+ neurons in both SNc and VTA regions are shown in Figure 2d. Numbers of TH+ cells in SNc significantly decrease in 9-month-old brains and reach a steady-state level thereafter. In the VTA, a decline in the number of TH+ neurons starts at 6-months of age and reaches the lowest number in 24-month-old mice. We also calculated the ratio of Iba1+ to TH+ cells in both regions from young to aged mice. A two way ANOVA indicated a significant increase in the ratio of microglial cells/ TH+ cells in older animals [F(4, 40) = 30.8, p < .001]. Importantly, no difference in the ratio of Iba1+ to TH+ cells was observed across the SNc versus VTA in mice of the same age. The results confirm the homogeneity of the microglia population in these two adjacent dopaminergic areas of the midbrain [F(1, 40) = .3402, p = .5630] (Figure 2e).
FIGURE 1.
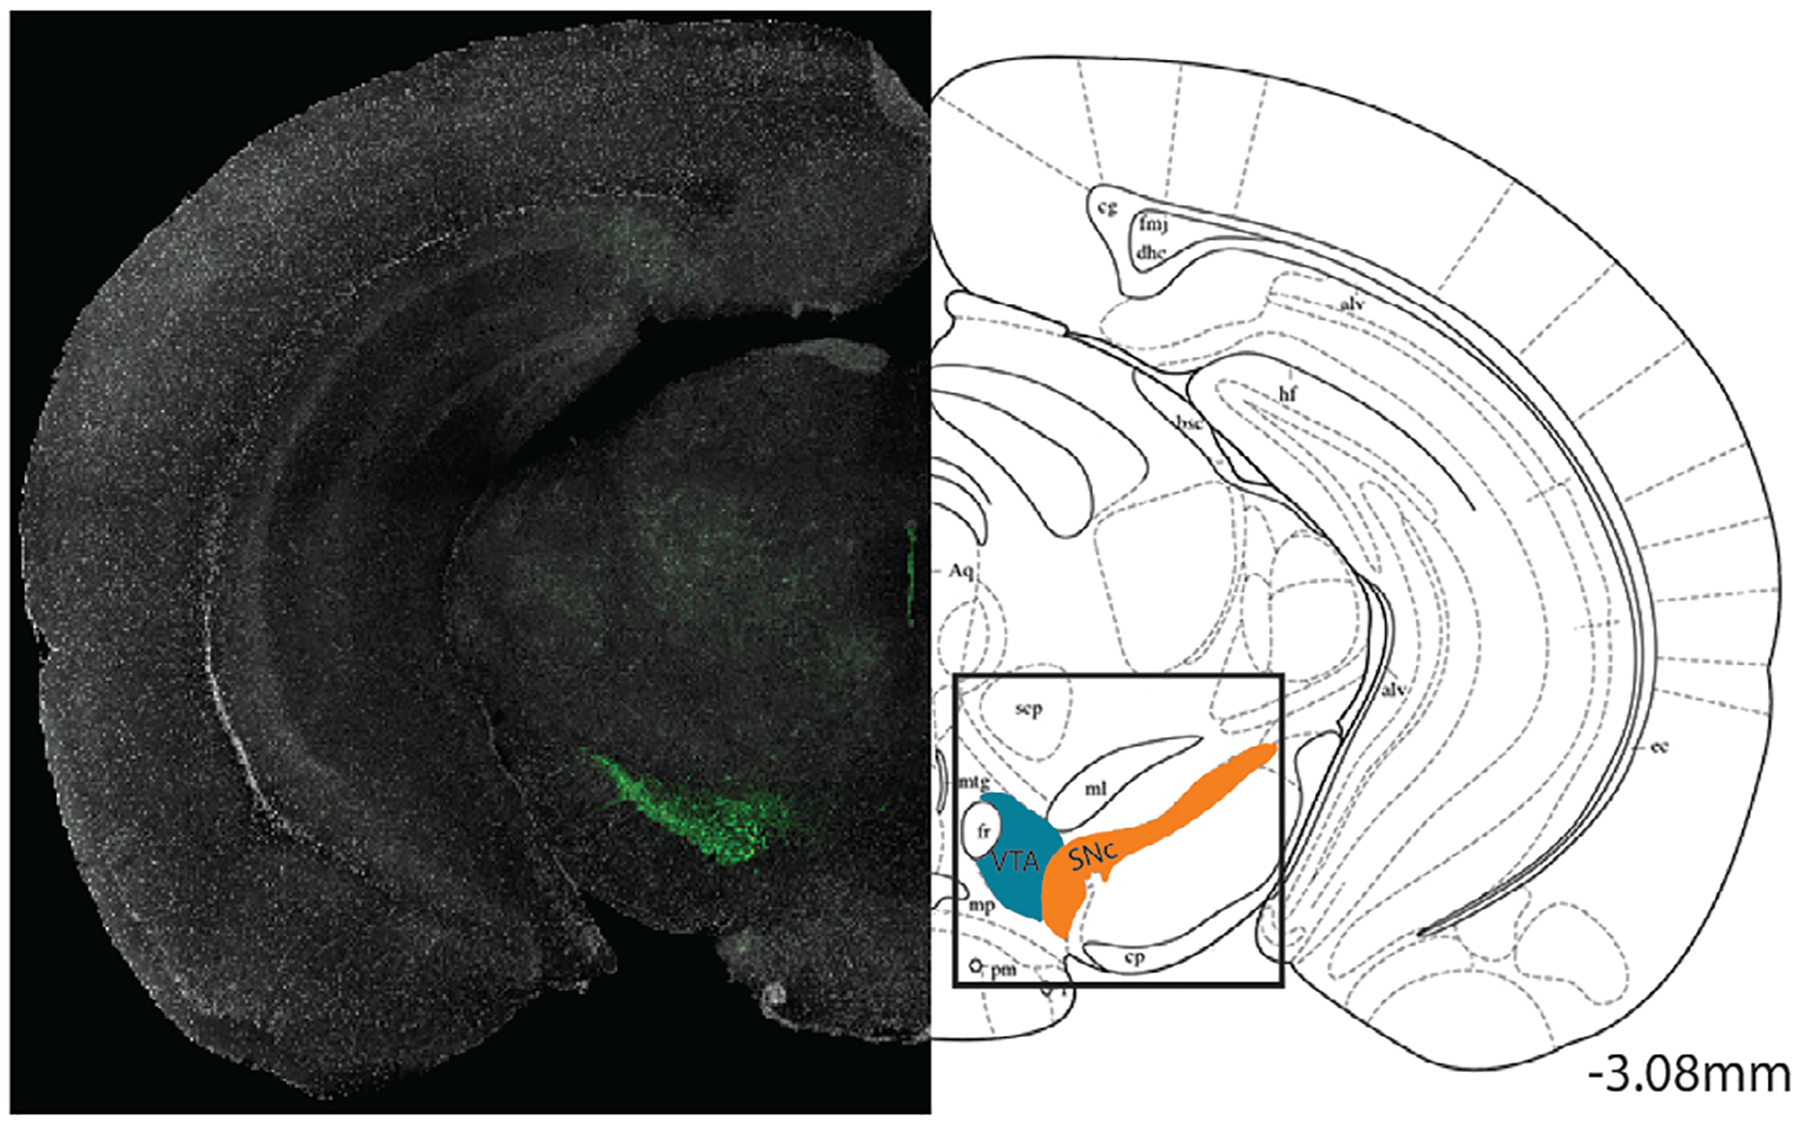
Coronal section of the SNc and VTA. Confocal image of dopaminergic neurons in the midbrain (green) with the corresponding coronal plane distinguishing the SNc (orange) and VTA (blue) (taken from Paxinos and Franklin’s mouse brain atlas)
FIGURE 2.
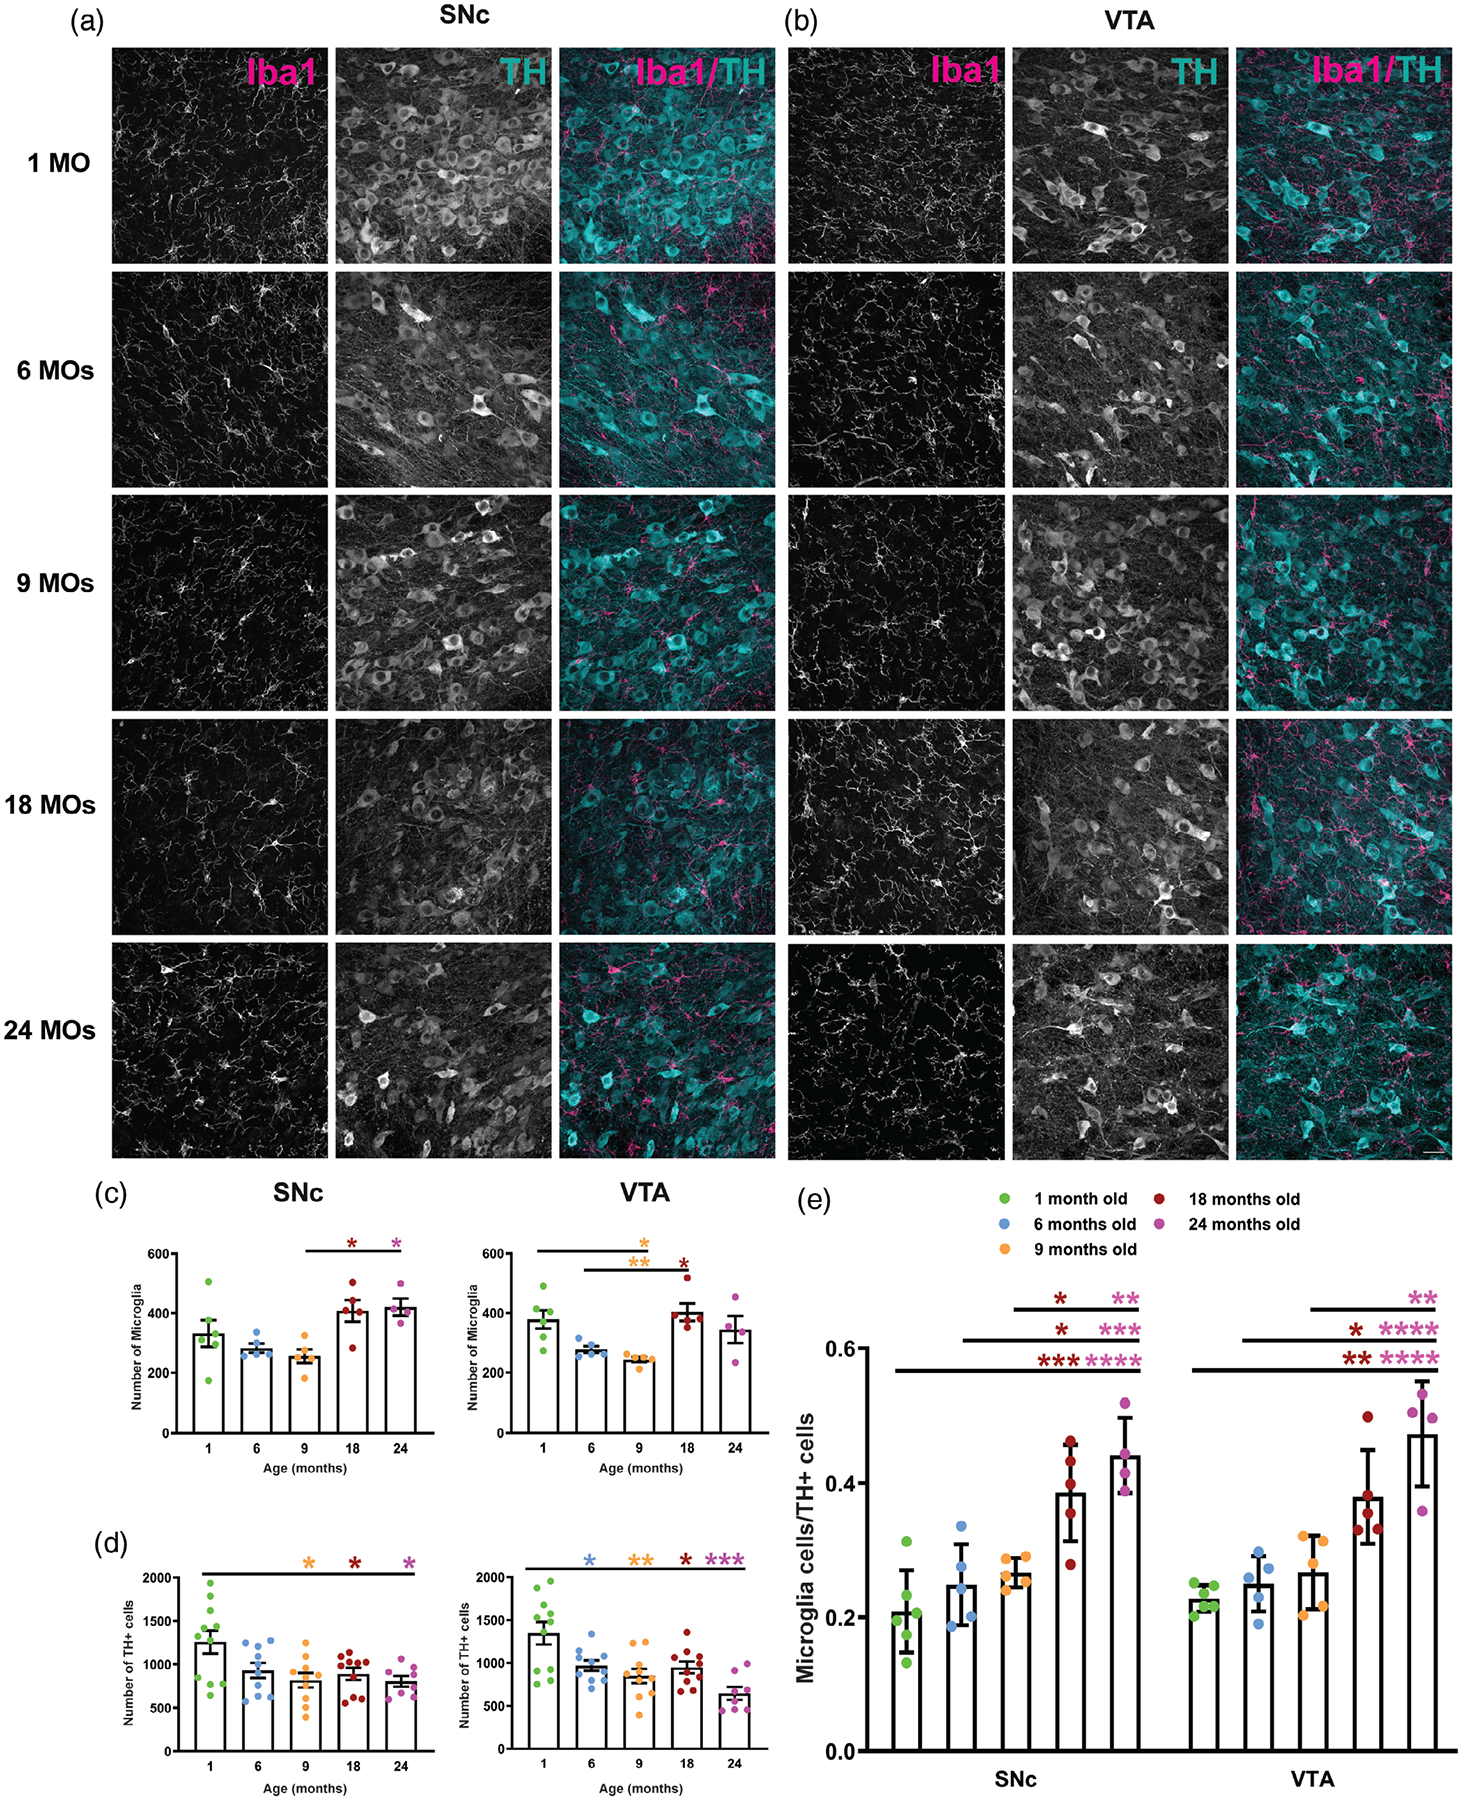
Aging increases the ratio of microglia to TH-positive (TH+) neurons in the SNc and VTA. (a) Representative confocal images of Iba1+ and TH+ cells in the SNc of 1-, 6-, 9-, 18-, and 24-month-old mice. (b) Iba1+ microglial cells and TH+ neurons in the VTA of different age groups. (c) Stereology analysis of the number of microglia in young to old age mice in the SNc and VTA. (d) TH+ neurons were counted in the SNc and VTA of five different age groups using an optical fractionator technique. (e) The ratio of microglia to TH+ neurons increases in aged mice in both regions of interest. All error bars are represented as mean ± SEM, n = 4–5 animals (12–24 slices), one-way (c and d) and two- way (e) ANOVAs followed by post hoc Tukey’s Test, *p < .5,**p < .01,***p < .001, ****p < .0001. Scale bar is set to 50 μm
3.2 |. Increases in the numbers of microglia with aging are not due to increased proliferation or decreased apoptosis
To understand the spatiotemporal distribution, numbers, and heterogeneity of microglia in dopaminergic regions, we evaluated whether increased numbers of microglia with aging shown in Figure 2 are due to an induction of cell proliferation or to a suppression of apoptotic cell death. Facial nerve axotomy and postnatal day 5 brains were used as positive controls for cell proliferation and apoptosis, respectively (Figure S1a). As shown in Figure S1b, Ki67 immunostaining shows no proliferating cells in the midbrain of 1-, 6-, 9-, 18-, and 24-month-old mice. The nuclear protein Ki67 expresses during all active phases of the cell cycle but not in the G0 phase (Scholzen & Gerdes, 2000; Shirendeb et al., 2009). Also, brightfield images of TUNEL staining showed that increased numbers of microglia with aging were not due to changes in the rate of apoptosis (Figure S1c).
Moreover, results from stereological counting of total numbers of neurons stained with a neuronal specific marker, HuC/D antibody, in SNc and VTA showed no change in the total number of neurons in the SNc and VTA in 6-, 9-, and 18-month-old mice despite of the significant decrease in the number of TH+ neurons in dopaminergic regions of midbrain (Figure S1d). The total number of neurons significantly decreased in SNc and VTA in 24- month-old mice.
3.3 |. Microglial complexity declines in dopaminergic areas of mouse midbrain with aging
As the resident immune cells of the CNS, microglial cell morphology is closely related to their functional state (Davis, Foster, & Thomas, 1994). Highly ramified cytoplasmic extensions allow microglia to survey continuously their microenvironment. We have used Sholl analysis to assess the cytoplasmic complexity and functional state of microglia in SNc and VTA in five age groups. As shown in Figure 3b, numbers of intersections in the SNc of 1-month-old mice is higher than in the other age groups. We have found a 25% ± 6.7 decline in the number of intersections at 6, 9, and 18 months of age, followed by a sharp decrease (75% ± 5.1) in 24-month-old mice. Similarly, the area under the curve (AUC) significantly decreases in 24-month-old mice in comparison to all other age groups (Figure 3c). As shown in Figure 3d, the number of intersections in 1-month-old mice in the VTA is higher than in any other age group. Microglia in the VTA of 6-month-old mice appear to be more ramified in comparison to the 6-month-old microglia in the SNc. Similar to the SNc, in the VTA the AUC for 24-month-old mice is dramatically less than in other age groups (Figure 3e). Collectively these data suggest the patterns of microglia arborization are the same in microglia from all five age groups in both ROIs (Figure 3b,d). In 1-month-old mice, there is a sharp increase in the number of intersections for short radii (0–10 μm), a peak of intersections at 10–25 μm radii, and decreases thereafter.
FIGURE 3.
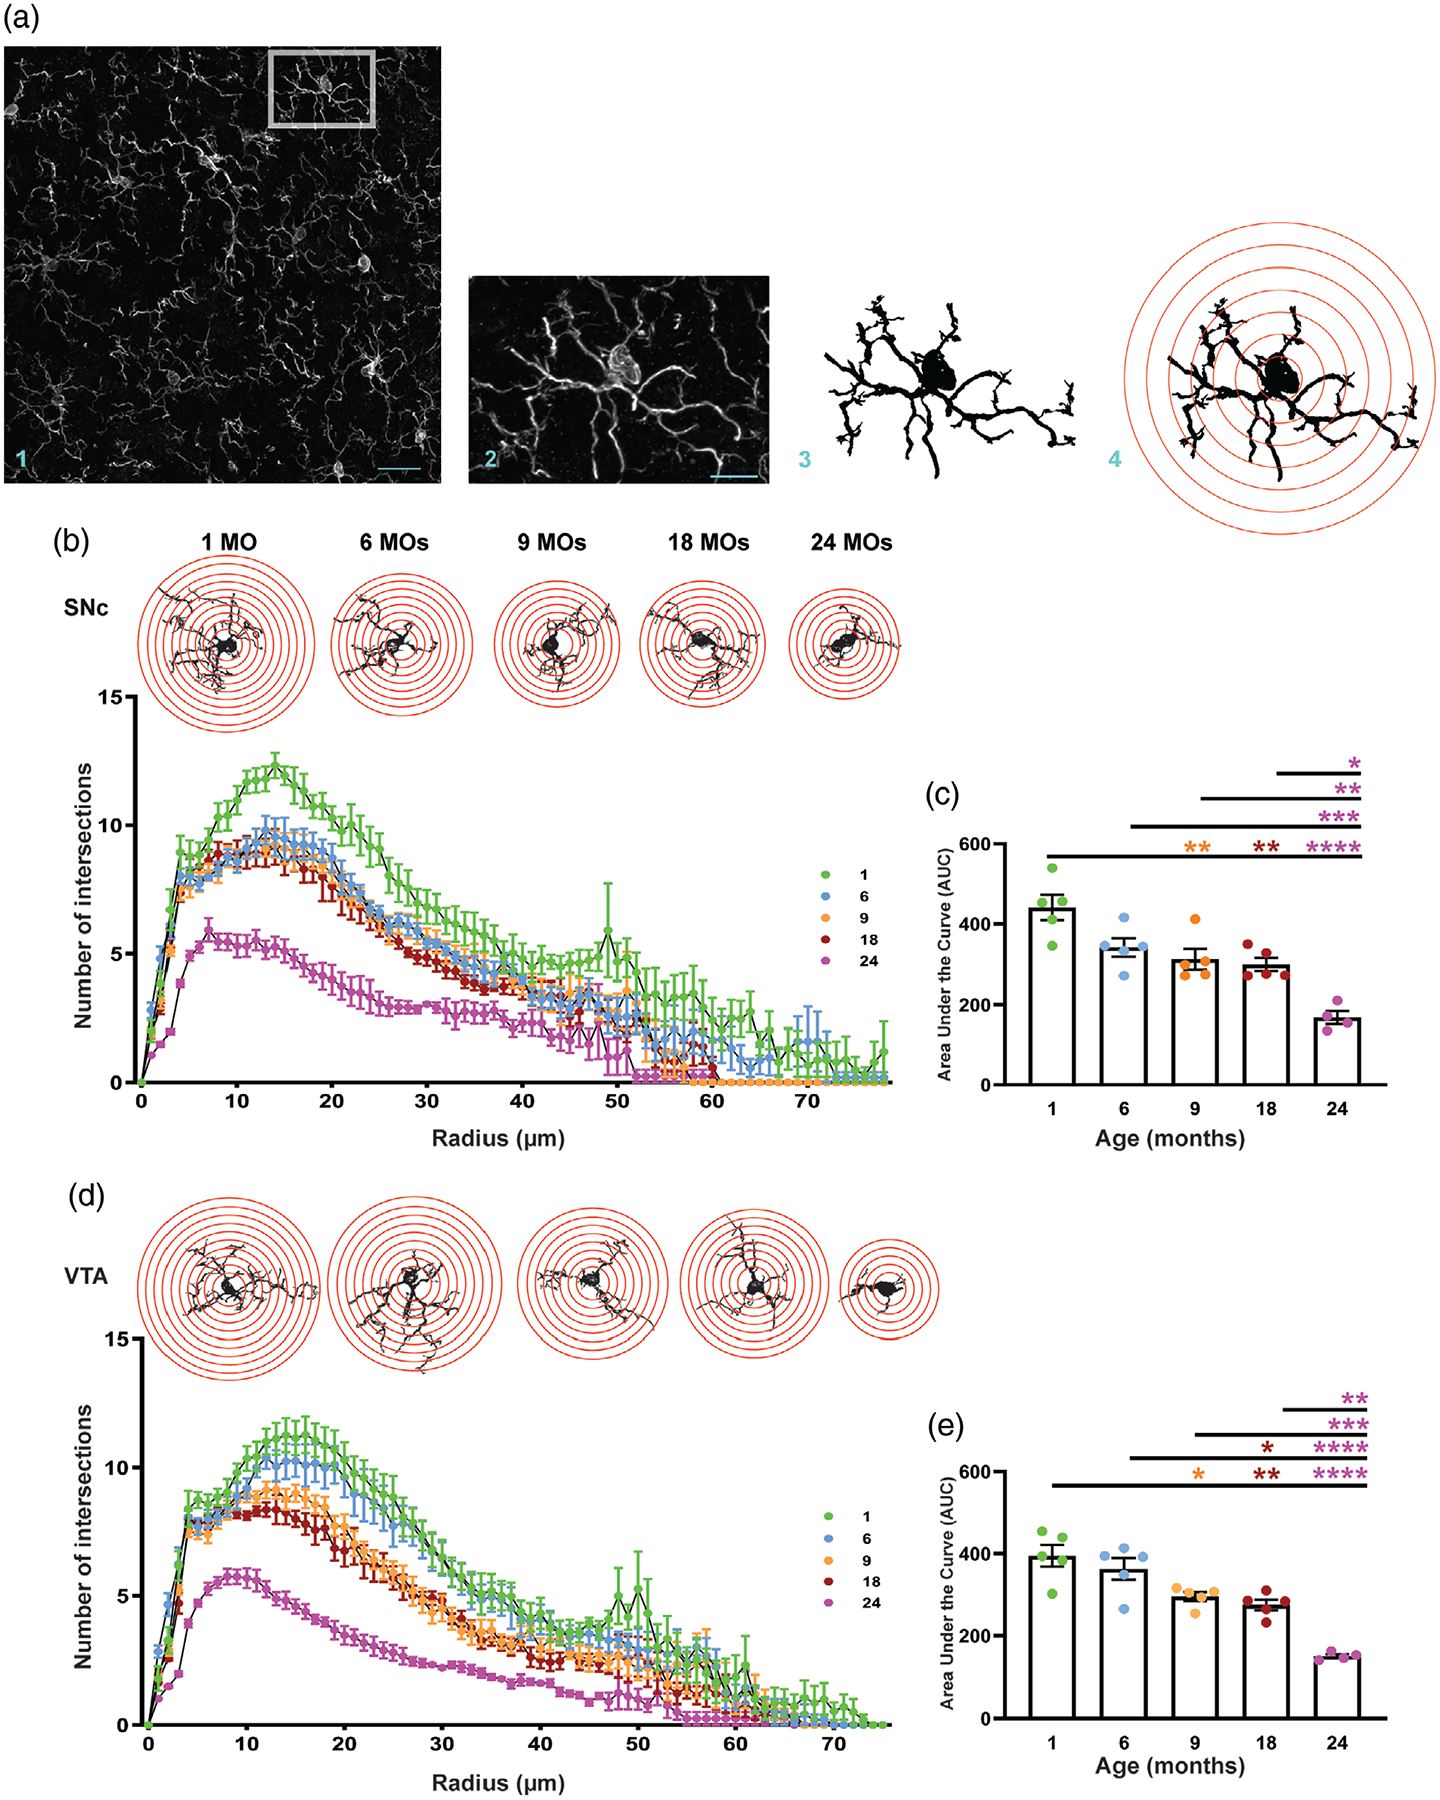
Microglial complexity declines with aging in dopaminergic areas of mouse brain. (a) Schematic acquisition of image processing for Sholl analysis. (b) Binary images of 1-, 6-, 9-, 18-, and 24-month-old microglia with the concentric circles and Sholl analysis plot for microglia from different age groups in the SNc. (c) Area under the curve for Sholl analysis graphs of microglia in the SNc of different age groups. (d) Binary images of young to old mice microglia with the concentric circles and Sholl analysis plot for microglia from different age groups in the VTA. (e) Area under the curve for Sholl analysis graphs of microglia in the VTA of different age groups. All error bars are represented as mean ± SEM, n = 4–5 animals (30–86 microglia per animal), one-way ANOVA followed by post hoc Tukey’s Test, *p < .5,**p < .01,***p < .001, ****p < .0001. Scale bar is set to 35 μm (a1) and 10 μm (a2)
3.4 |. Skeleton analysis shows decrease in total length of processes in addition to decline in complexity
To confirm the decline in microglia complexity with aging in SNc and VTA, we used the quantitative spatiotemporal analysis of microglia morphology described in Morrison et al (Morrison & Filosa, 2013). Using this established approach, we measured the number of branches and the sum of the process lengths of each individual microglia in SNc and VTA in five different age groups. Skeletonized microglia shown in Figure 4a confirm the decrease in complexity of microglia with aging in both regions. Specifically, the number of branches decreased with aging in both dopaminergic regions with the least number of branches present in 24-month-old mice (Figure 4b,c). Total length of processes also shows a significant decrease in 9-, 18-, and 24-month-old mice in both SNc and VTA in comparison to 1- and 6-month-old mice.
FIGURE 4.
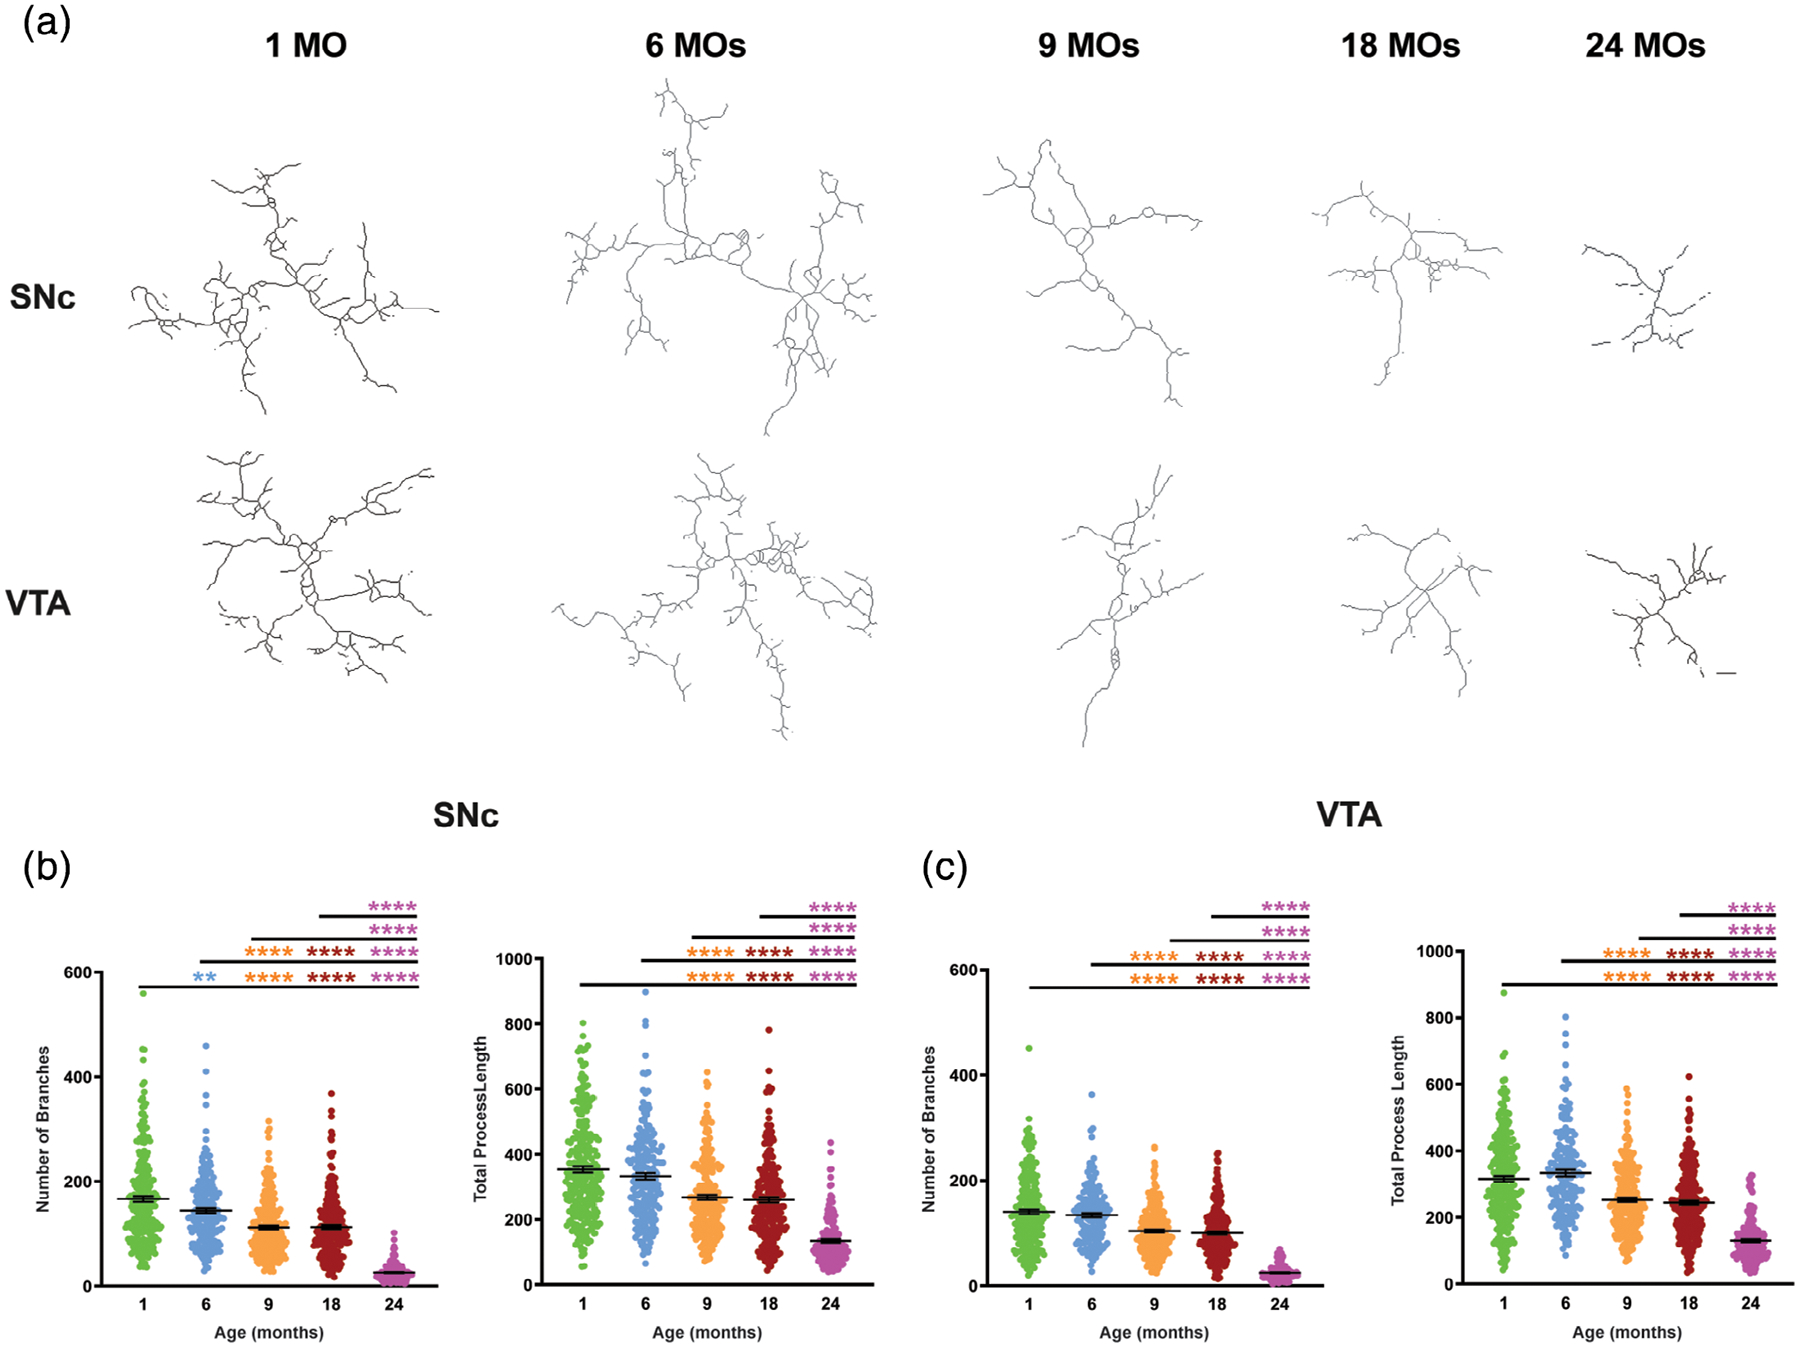
Skeleton analysis of microglial morphology confirms microglial complexity declines with aging. (a) Skeletonized representative images of microglia in the SNc and VTA from young to aged mice. (b) In the SNc, total branch length and number of branches decrease with aging. (c) Total length and number of branches of microglia from VTA also decrease in aged mice. All error bars are represented as mean ± SEM, n = 4–5 animals (30–86 microglia per animal), one-way ANOVA followed by post hoc Tukey’s Test, *p < .5,**p < .01,***p < .001, ****p < .0001. Scale bar is set to 10 μm
3.5 |. Microglia in aged mice have larger cell bodies with fewer processes
Morphologically, microglial senescence is characterized by expansion of the cell bodies probably due to a vacuolated cytoplasm and lipofuscin accumulation (Conde & Streit, 2006b; Streit & Xue, 2013). Accordingly, we measured the cell body area of microglia in SNc and VTA regions of five different age groups to see if there is any change in soma size with aging. As shown in Figure 5c, cell bodies expand significantly with aging so that microglia at ages 18 and 24 months in both areas have the largest cell body in comparison to the other groups (it is also distinguishable in representative images, Figure 5a). Also, we measured the arborization area of individual microglia to define whether decreased complexity is accompanied by a decline in territory occupied by each microglial cell. Our results show that the surveillance area of microglia decreases with aging not only due to decreased numbers of branches, but also due to a decrease in projection area around cell body of individual microglia (Figure 5c,d), suggesting that increased microglia numbers in aged brains shown in Figure 2 represent a compensatory response. The most significant decrease in the projection area of microglia in both areas is seen in 9-, 18-, and 24-month-old mice.
FIGURE 5.
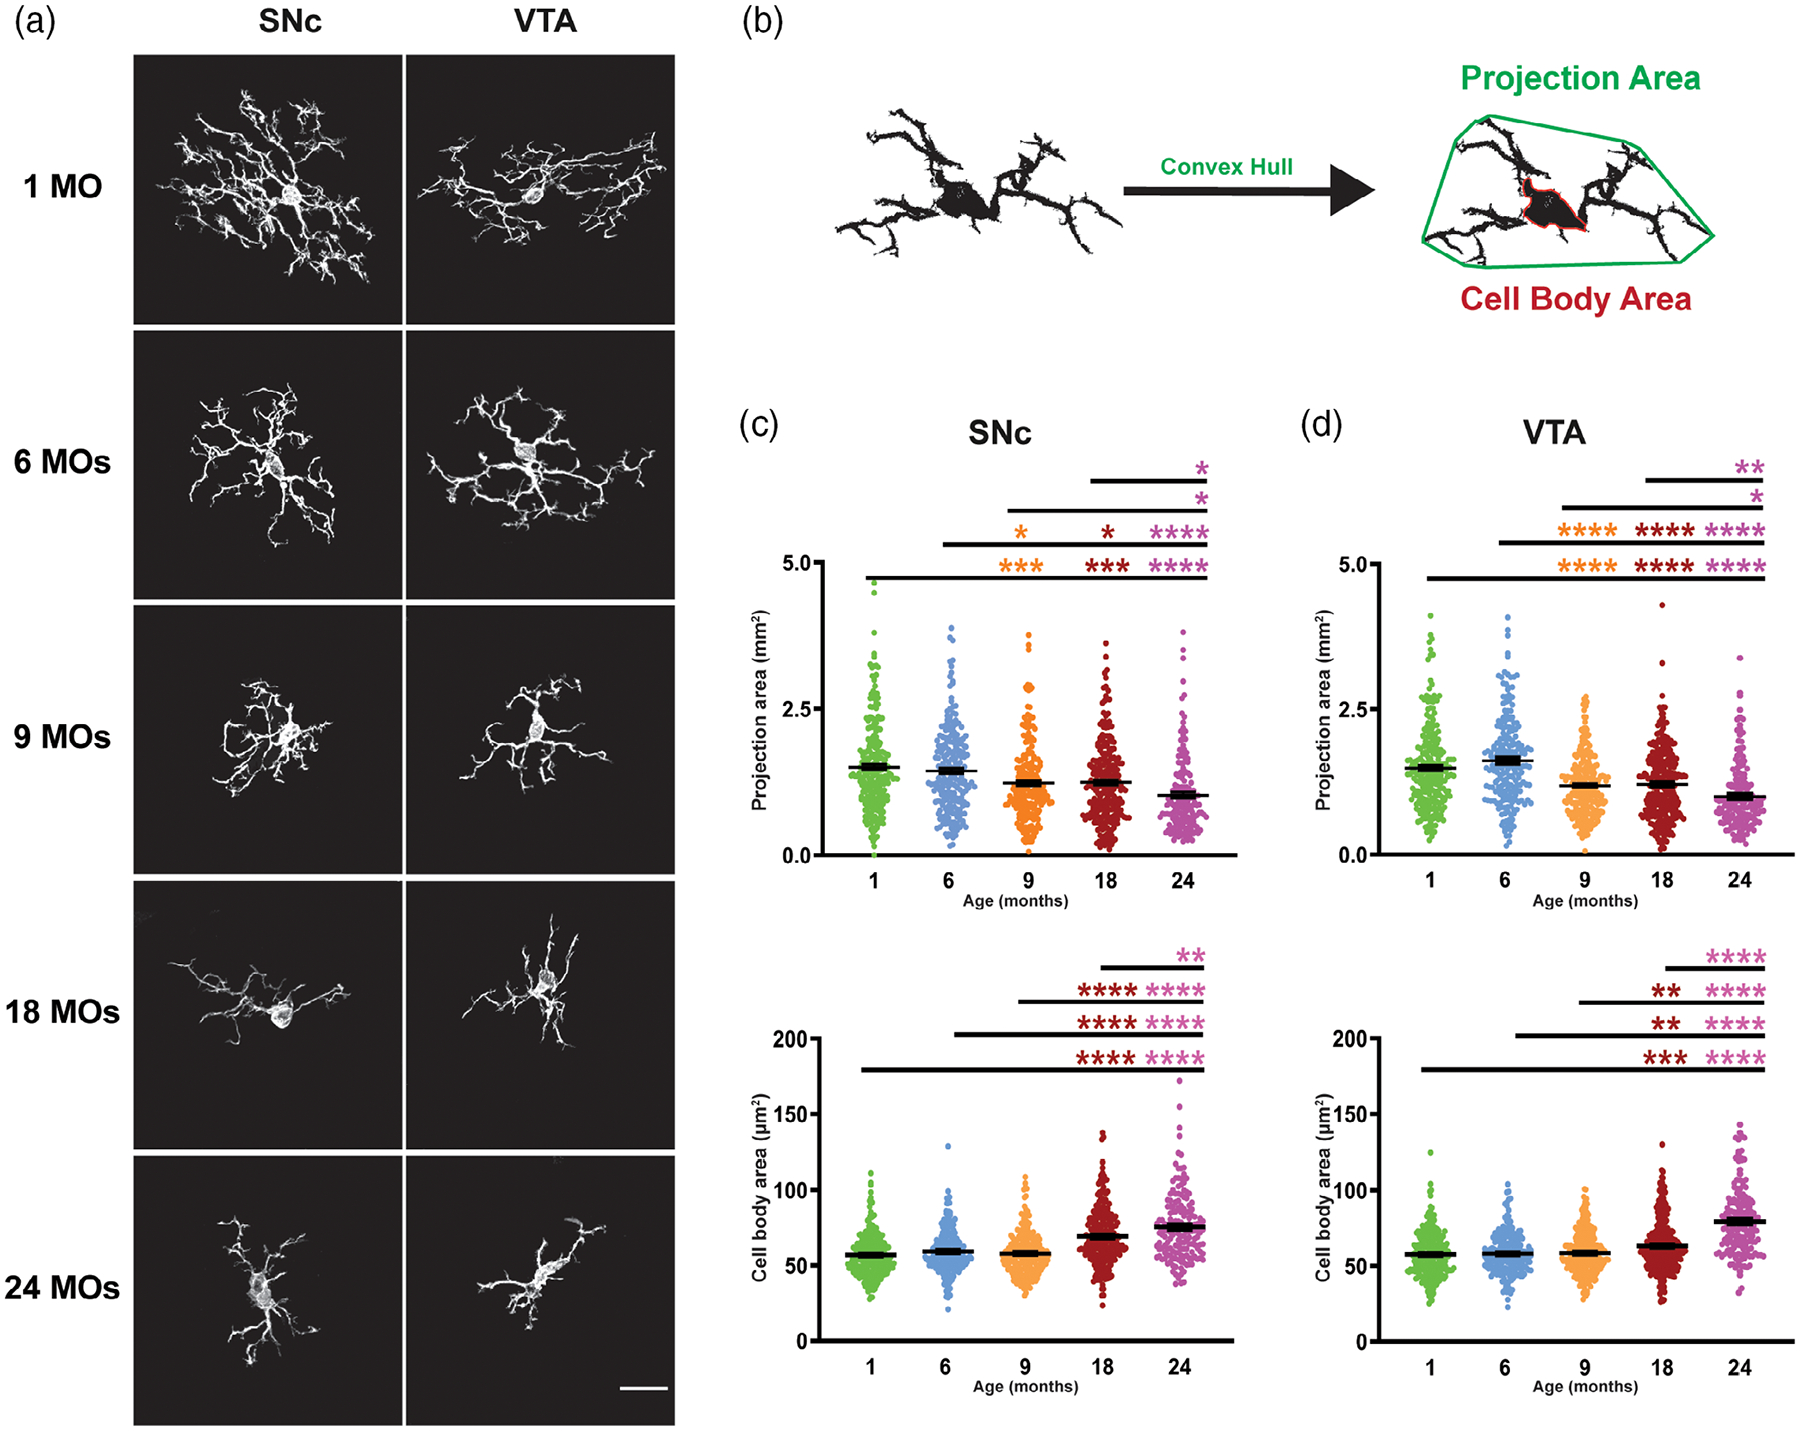
Brain aging is associated with the shrinkage in arborization areas of microglia and increase in cell body size. (a) Representative images of individual microglia isolated from SNc and VTA of different age groups. (b) As mice age, projection area of microglia decreases, while the soma expands starting from 9 month in the SNc of aged mice. (c) Similar trends are also observed in the VTA of young to aged mice. All error bars are represented as mean ± SEM, n = 4–5 animals (30–86 microglia per animal), one-way ANOVA followed by post hoc Tukey’s Test, *p < .5,**p < .01,***p < .001, ****p < .0001. Scale bar is set to 20 μm
3.6 |. Microglia senescence index is predicted to increase sharply after 24 months of age in mice
Using mathematical modeling, we have calculated a microglia senescence index in 24- month-old mice to compare to the corresponding age (~69 years) in humans (Figure 6a). The mathematical model uses raw data sets obtained from stereology (number of microglia) and morphometrics (Sholl analysis) to predict the senescence index of microglia in SNc and VTA. Based on this model, it appears that in aged mice (24–30-month-old), numbers of microglia remain high in SNc (Figure 6b) but decrease slightly in VTA (Figure 6c). In the context of morphology, the model predicts a continuous decline in microglia complexity with aging resulting in less ramified microglia in both ROIs at 30 months of age, which approximates a human 80 years of age (Figure 6b,c).
FIGURE 6.
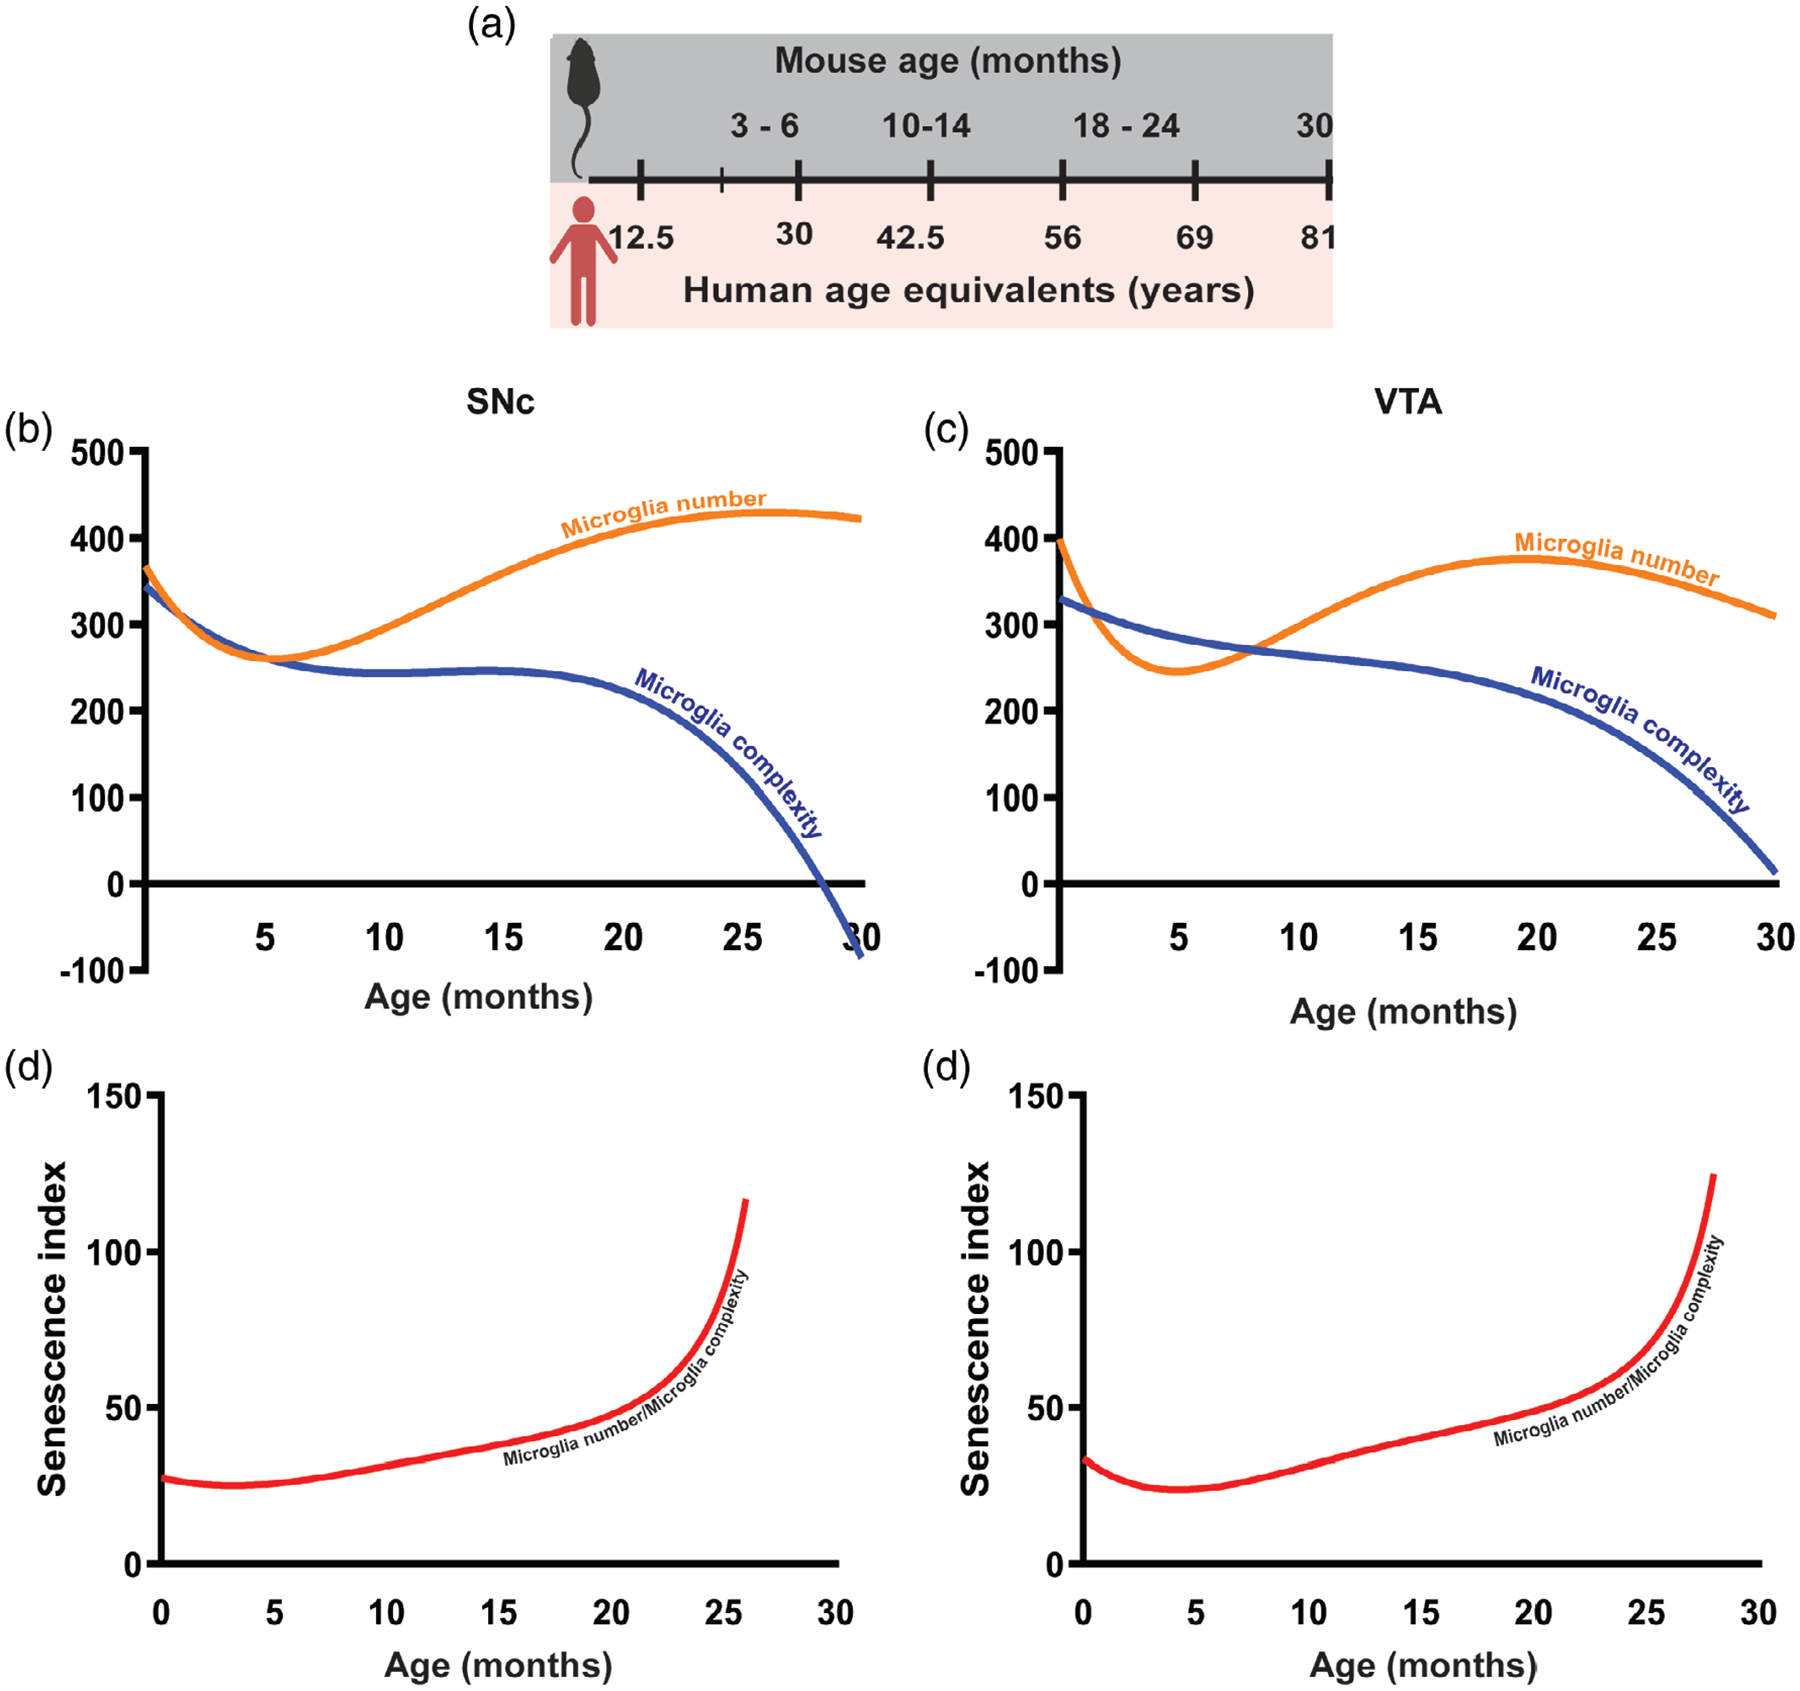
Mathematical modeling predicts that microglia senescence index dramatically increases after 24 months. (a) Mouse age in months and its equivalent in year for human being age. (b) Mathematical model prediction of changes in microglia complexity and number in 30-month-old within SNc. The blue and orange curves represent complexity and number of microglia, respectively. (c) Prediction of the microglia complexity and number in 30-month-old mice by the mathematical modeling in VTA. The blue and orange curves represent complexity and number of microglia, respectively. (d) Senescence index calculated as the ratio of the number of microglia to complexity in SNc of young to aged mice with the prediction of senescence index in over aged mice (30-month-old mice). (e) Senescence index predicted in over aged mice (30-month-old mice) in the VTA based on the obtained result from 1- to 24-month-old mice
As shown in Figure 6d,e, the senescence index of microglia, defined as the ratio of number of microglia over microglial complexity, gradually increases during aging. Our mathematic model predicts a dramatic increase in the senescence index after 24 months, which is due to the significant decrease in microglial ramification and other morphological changes shown in this study.
3.7 |. Contact sites between microglia and dopamine neurons increase with age
Microglia express numerous membrane receptors to sense their environment, and to communicate with neurons and other cell types. In addition to neurochemical interactions via ligands and receptors, direct contact sites between microglia and neurons likely mediate fast and precise communication although the exact nature of this crosstalk still needs to be elucidated. To measure the age-dependent changes (or lack thereof) in contact sites between microglia and dopamine neurons we used 3D binary masks reconstruction image analysis (Lana et al., 2019; Figure 7a). As shown in Figure 7b,c, contact sites between microglia and TH+ neurons significantly increase with aging. Neuron–microglia communication, as measured by contact sites, increase in 6-month-old brains in SNc and VTA followed by a decrease in 9-month-old mice in SNc. The contact areas are greater in the SNc and VTA of 18- and 24-month-old brains. In comparison, microglial-neuronal contacts are significantly less in SNc in comparison to the VTA in age-matched mice (Figure 7d).
FIGURE 7.
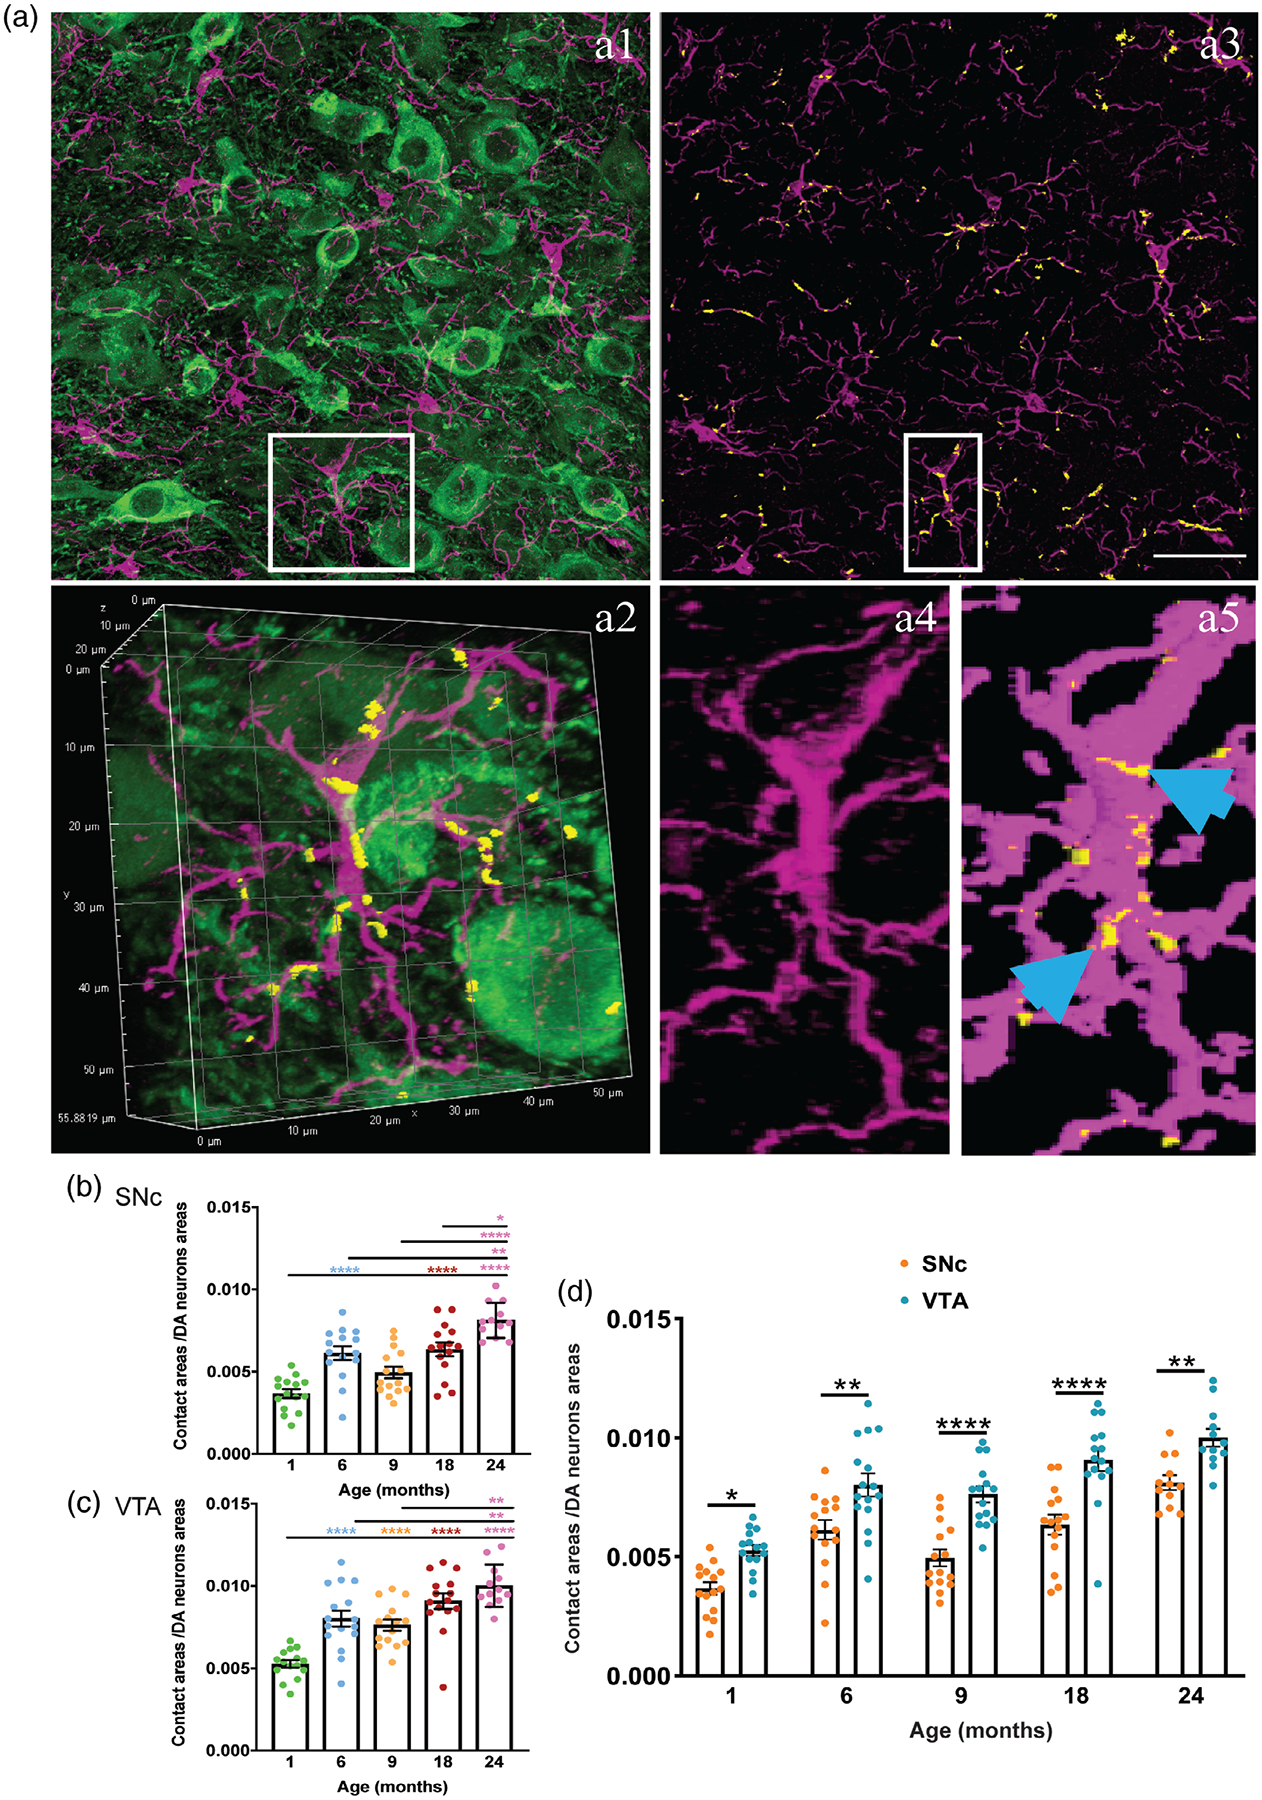
Interactions between microglia and dopaminergic neurons increase in the midbrain with aging. (a1) Confocal image of VTA of 1-month-old mouse brain immunelabeled for TH-positive (TH+) neurons (green) and Iba1+ microglia (magenta). Single microglia is shown in white box. (a2) higher magnification and 3D reconstructed of the indicated area in a1. (a3) Intensity projections of the fluorescence signal from Iba1; TH immunostaining was omitted to emphasize contact localization on microglia. Yellow spots represent the contacts between microglia and TH+ neurons. (a4) and (a5), higher magnification of the indicated area in a3 and its representative binary mask of Iba1 fluorescence and contact sites (pointed out with blue arrow). (b) Quantitative assessment of contact sites between microglia and TH+ neurons in the SNc of mice of 1-, 6-, 9-, 18-, and 24-month-old mice. (c) Quantitative assessment of contact sites between microglia and TH+ neurons in the VTA of mice of different age groups. (d) Microglial-neuronal contact sites in SNc in comparison to VTA in different age group. All error bars are represented as mean ± SEM, n = 4–5 animals (3–4 slides per animal), one-way ANOVA followed by post hoc Tukey’s Test, *p < .5, **p < .01, ***p < .001, ****p < .0001. Scale bar is set to 50 μm
3.8 |. Significant decrease in BDNF transcription during aging accompanies increase in TH mRNA level in SNc but not VTA
Survival of dopaminergic neurons in the midbrain depends on neurotrophic factors, such as BDNF and Glial cell-derived neurotrophic factor (GDNF). We used the RNAscope method to detect mRNA expression of BDNF in SNc and VTA during aging. A TH probe also was used to define those BDNF signals produced by dopamine neurons. As shown in Figure 8b,e, mRNA counts of BDNF in both ROIs decreases with aging, although in VTA changes in BDNF signal are statistically significant in 9- and 24-month-old mice but not 18-month-old. Interestingly, the density of TH mRNA signal significantly increases with aging in SNc but not VTA. As shown in Figure 8c,f, mRNA of TH has the highest level in SNc of the oldest age group. Ratio of BDNF signal to areas of TH signal was calculated in Figure 8d,g in SNc and VTA. The ratio of BDNF/TH mRNA signal significantly decreases in 6-, 9-, and 24-month-old in comparison to 1-month-old SNc. VTA ratio of BDNF to TH mRNA does not show any significant change in different age groups.
FIGURE 8.
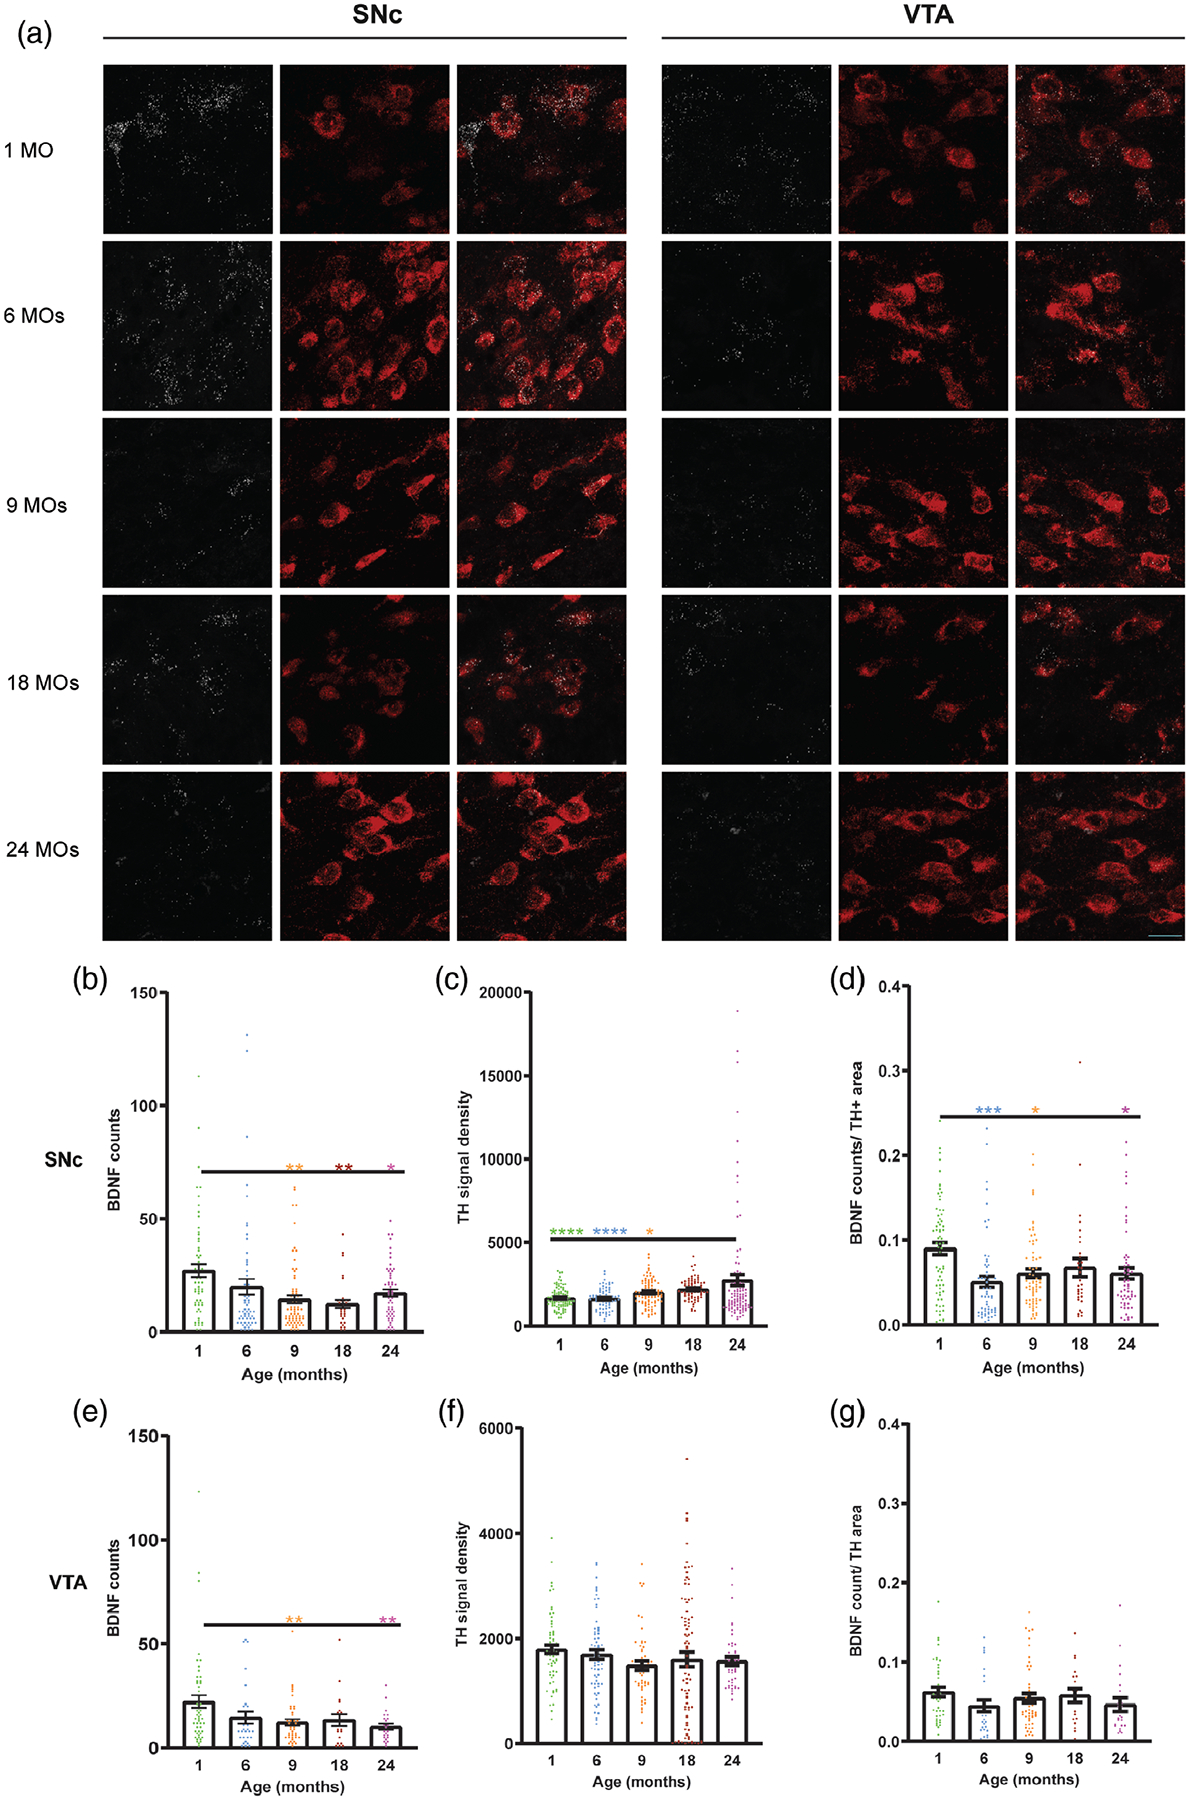
RNA in situ hybridization (RNA scope) shows a significant decrease in BDNF signal at the transcriptional level accompanied by significant increase in TH signal in SNc but not VTA. (a) Representative images of RNA signals of BDNF (white) and TH (red) in the midbrain of different aged groups. (b) Quantitative assessment of BDNF and TH RNAs signals in the SNc of 1-, 6-, 9-, 18-, and 24-month-old mice. (c) Quantitative assessment of BDNF and TH RNAs signals in VTA of different aged groups. All error bars are represented as mean ± SEM, n = 2 animals (2–5 images per region per animal), one-way ANOVA followed by post hoc Tukey’s Test, *p < .5, **p < .01, ***p < .001, ****p < .0001. Scale bar is set to 20 μm
The RNAscope experiments for all probes were performed simultaneously.
3.9 |. Microglia morphology remains homogenous in two adjacent dopaminergic areas of midbrain during aging
Since aging is the greatest risk factor for PD, we examined the possibility that aging may differentially affect microglia in the SNc versus the VTA. We compared the most significant morphometric results that we collected in the two regions. Figure 9a shows the peak area of Sholl analysis graphs comparing SNc and VTA microglia in different age groups, and it is apparent that aging affects complexity of microglia in both SNc and VTA in the same way. Comparing the area under the curve, numbers of branches and total lengths of branches confirm the similarity in age-related morphological changes in both SNc and VTA (Figure 9b,c). Similarly, age-associated changes also can be seen in the cell body size and projection areas of microglia from these two distinct dopaminergic areas of the midbrain (Figure 9d,e) confirming the homogeneity of microglia in the midbrain during adolescence, adulthood, and old age in mice.
FIGURE 9.
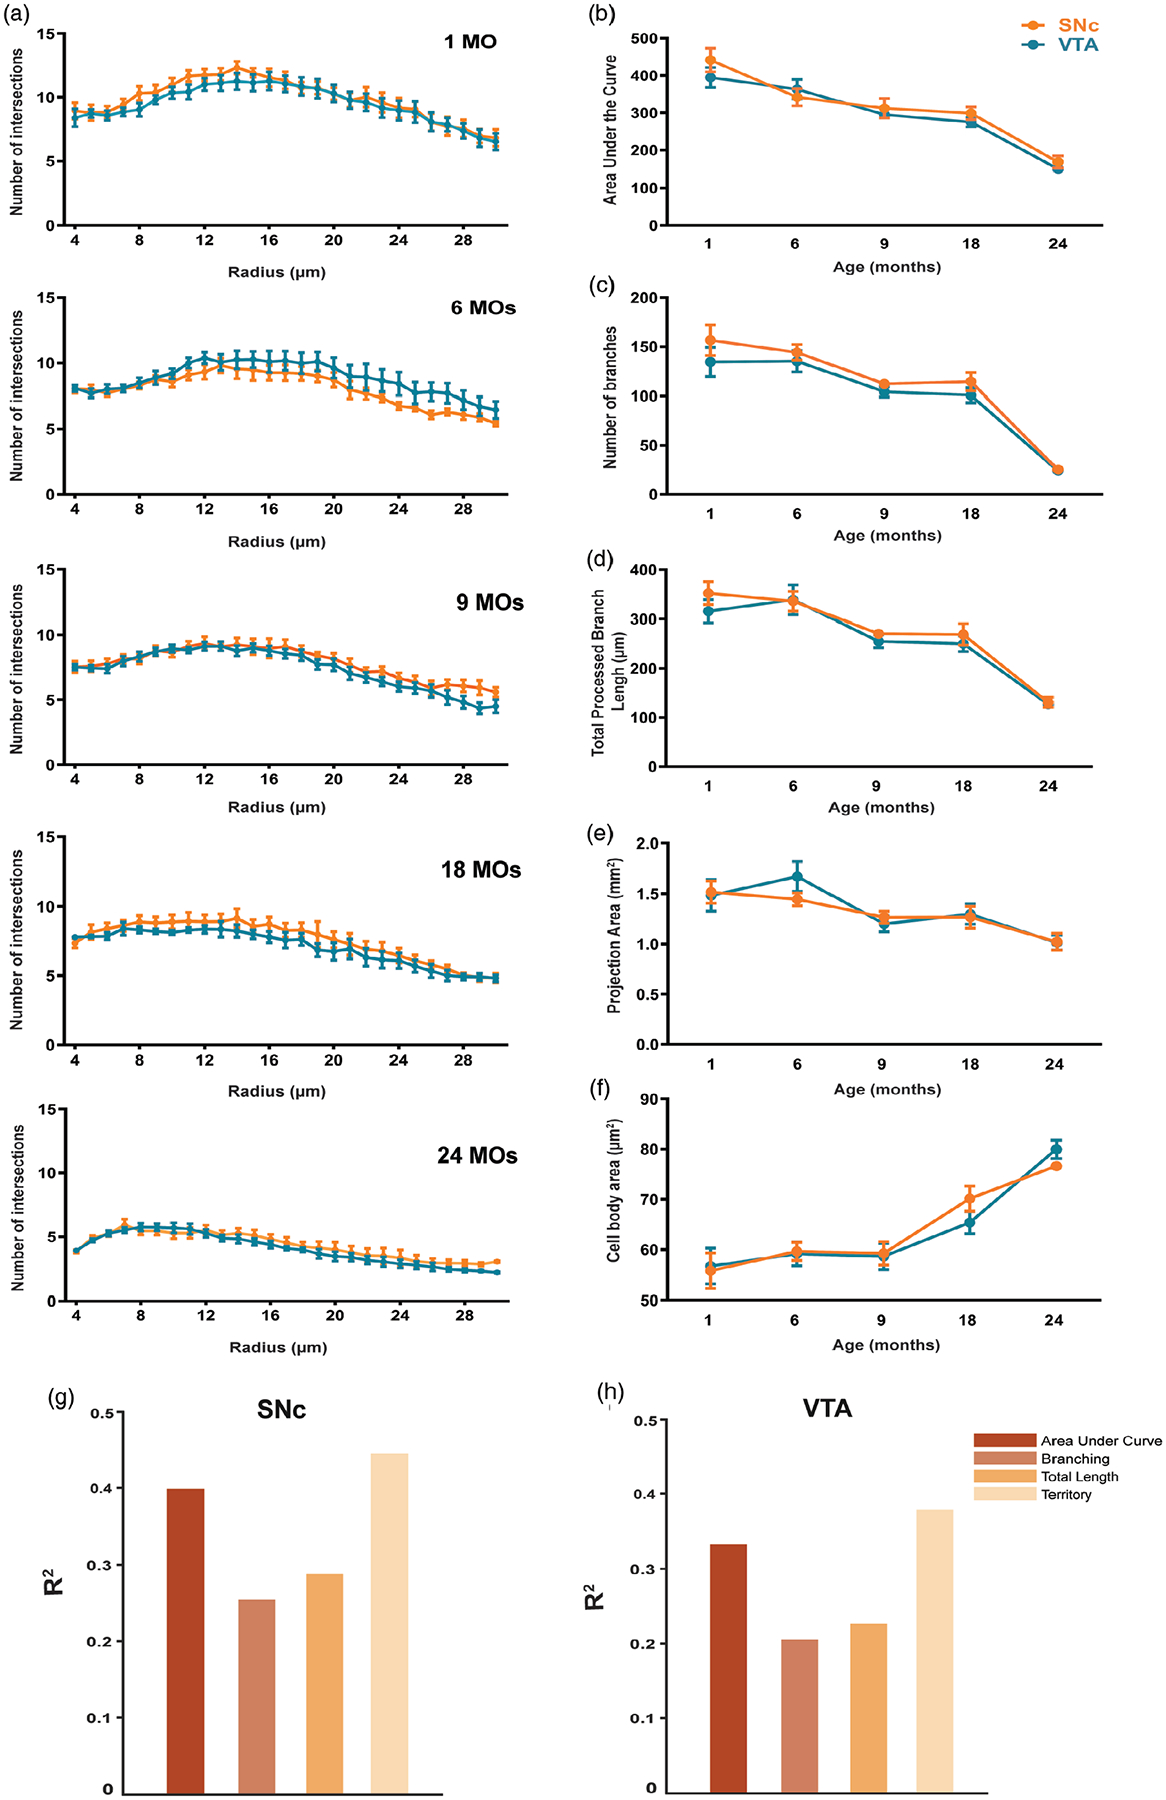
Microglial morphology is comparable in the SNc and VTA during aging. (a) Comparison of the peak number of intersections of microglial cell morphology in the SNc and VTA at 1-, 6-, 9-, 18-, and 24-month-old mice. (b) Area under the curve (AUC) of Sholl plots also appear similar in both regions. (c) Number of branches of SNc microglia in comparison to VTA microglia. (d) Likewise, in the total processed branch length. (e) Comparison of the projection areas of microglia in both dopaminergic regions of midbrain. (f) Cell body areas of microglia in SNc compared to VTA region. (g,h) In the SNc, BDNF expression is found to strongly correlate with AUC and microglial projection area. In the VTA, BDNF signal is moderately correlated with AUC and strongly correlated with projection area (Pearson’s correlation coefficient, SNc AUC r = .63, Territory r = .67; VTA AUC r = .58 Territory r = .61). Total branch length and number of branches were also found to moderately correlate with BDNF measurement in both regions (Pearson’s correlation coefficient, SNc Total length r = .50, Branching r = .54; VTA total length r = .45, Branching r = .47). Together, these results suggest a linear relationship between structural complexity of microglia and BDNF levels. All error bars are represented as mean ± SEM, n = 4–5 animals (12–24 slices), two-way ANOVA followed by post hoc Tukey’s Test, n.s. is p > .5
3.10 |. Gait analysis indicates subtle changes with aging
As the temporal parameters of locomotion, we measured the stride frequency and maximum paw area placed on the treadmill over times (Max dA/dT) among the different age groups. Based on the result shown in Figure 10c, frequency of stride significantly decreased in 18- and 24-month-old mice [F(4, 163) = 6.688, p < .0001], accompanied by significant increases in Max dA/dT (Figure 10d). Stride frequency decreases 15.87% and 13.91% in 18- and 24-month-old mice respectively in comparison to the 1-month-old mice. We also measured the stride length, which is defined by dividing the speed over the stride frequency. As shown in Figure 10e, stride length significantly changes in 9- and 24-month-old mice. Our result from gait analysis shows no significant variability in paw angle and this parameter remains nearly constant between young and old mice [F(4, 163) = 1.211, p = .3081], as shown in Figure 10f.
FIGURE 10.
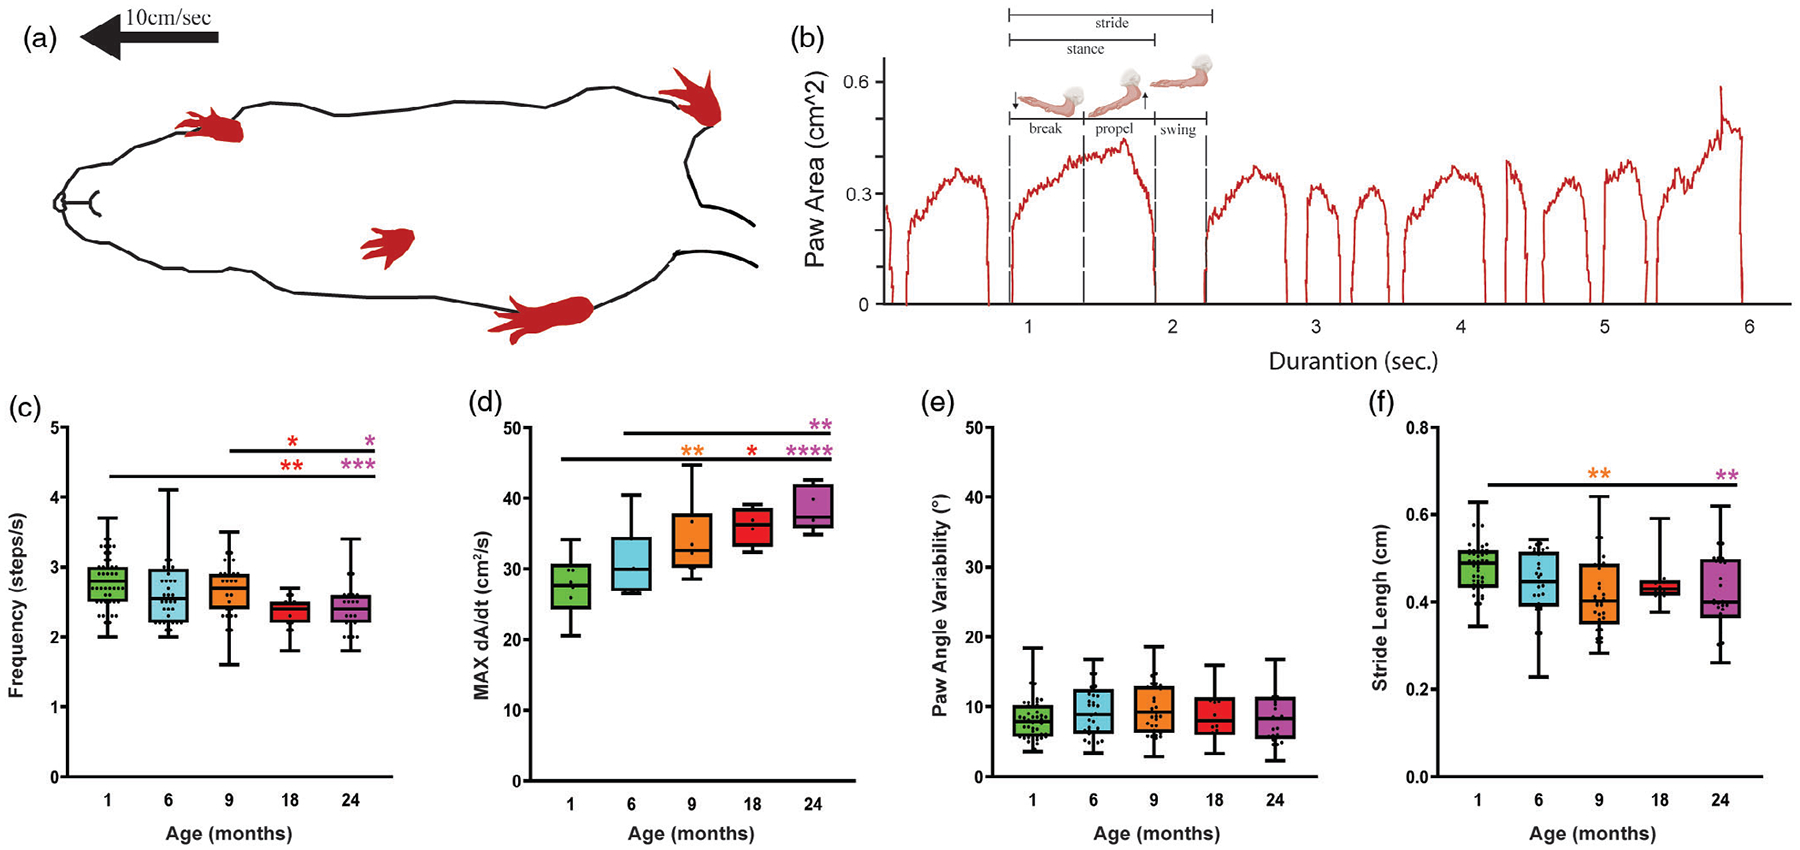
Gait analysis indicates subtle changes with aging. (a) Ventral plane videography captured mice walking on the treadmill at a rate of 10 cm/sec. (b) Time plot of a single paw area in contact with the treadmill, subdivided into different stride indices. Cartoon was taken from BioRender. (c) Gait analysis shows a significant decrease in stride length, and (d) stride frequency. (e) Limb loading time increases with aging. (f) There were no significant changes with paw angle variability. All error bars are represented as mean ± SEM, n = 5–14 animals, one-way ANOVA followed by post hoc Tukey’s Test, *p < .5, **p < .01, ***p < .001, ****p < .0001
4 |. DISCUSSION
Aging is the greatest risk factor for loss of SNc dopaminergic neurons in idiopathic PD. Microglia are implicated in PD pathogenesis (Barcia et al., 2004; Gerhard et al., 2006; Ouchi et al., 2005). In order to better understand how interactions between microglia and dopaminergic neurons may change with aging, we studied microglial morphology and numbers in the disease-prone SNc and disease-resistant VTA regions of aged mice. We found that while microglial numbers increased slightly, morphological complexity declined during aging suggesting occurrence of microglial senescence. There was no evidence for microglial activation in the aging mouse midbrain, and there were no significant differences in microglial morphology between the SNc and VTA. However, biological differences were illustrated in these two regions at the level of TH transcript expression, which increased significantly in the SNc but not the VTA despite a decline of TH protein with aging. We also found that mRNA transcripts of BDNF decreased in the SNc and VTA of aged mice. Our data show that microglial senescence occurs in mice where it is reflected in a decline in microglial ramification. Decreased production of BDNF may be related to microglial senescence but could also reflect aging-related transcriptomic changes in other cells, including dopaminergic neurons (Nishio, Furukawa, Akiguchi, & Sunohara, 1998). The upregulation of TH mRNA indicates a neuronal response to aging that may help sustain neuronal viability and prevent spontaneous degeneration. In sum, the presence of slightly increased microglial numbers, mild de-ramification of processes, lack of microglial activation, together with an altered neuronal transcriptomic signature suggest that these factors are important in the survival of dopaminergic neurons with aging in mice.
In humans, both normal aging and PD involve death of dopaminergic neurons and consequent reductions of dopamine transmission (Beach et al., 2007; Buchman et al., 2012; Naoi & Maruyama, 1999). Neuronal death triggers a highly localized inflammatory response that involves obvious microglial activation, including hypertrophy and hyperplasia (Biber, Neumann, Inoue, & Boddeke, 2007; Pais, Figueiredo, Peixoto, Braz, & Chatterjee, 2008; Streit, 2002). In contrast, microglial senescence is diffusely spread in the aged human brain and involves abnormalities in microglial morphology, including cytoplasmic fragmentation (Streit et al., 2004). While microglial senescence may contribute toward neurodegeneration (Streit et al., 2009), microglial activation and brain macrophage formation are a consequence of it (Rodriguez-Pallares et al., 2007; Streit & Kreutzberg, 1988). Thus, the fate of dopaminergic neurons in the aged human brain is very different from that of dopaminergic cells in the aged mouse, and this is reflected by different microglial phenotypes in the two species. Microglial morphology reflects the state of neuronal viability/health because neurons and microglia communicate bidirectionally. Essentially, our current study shows that none of the neuronal and microglial changes affecting the aged human brain occur in the mouse, where dopaminergic neurons survive and microglia remain nonactivated and only mildly dystrophic. The most likely reason for this is the vast difference in lifespan and environmental exposures existing between humans and laboratory mice. Although others have reported that rodents undergo progressive microglial activation (“inflammaging” or “microglial priming”) with aging (Franceschi et al., 2007; Perry & Holmes, 2014; Sierra, Gottfried-Blackmore, McEwen, & Bulloch, 2007), our current results showing small changes in microglial soma size and mild de-ramification are insufficient to indicate true activation. The increase in microglial cell soma size we describe here is likely due to accumulation of lipofuscin, a pigment that accumulates in aging microglial cells (Conde & Streit, 2006a; Samorajski, 1976; Xu, Chen, Manivannan, Lois, & Forrester, 2008) possibly because of a decline in lysosomal degradation (Tremblay, Zettel, Ison, Allen, & Majewska, 2012; Xu et al., 2008), but is unrelated to activation. While it has been shown that aging remarkably increases microglia soma movement (Hefendehl et al., 2014) this may or may not be related to the age-related change in size. Changes characteristic of microglial activation are much more dramatic, and involve prominent microglial hypertrophy, as well as mitosis (Streit et al., 2014). We show that microglial mitosis was undetectable in the normal mouse midbrain, which leaves unexplained the slight increase in microglial numbers observed. However, missing the time of Ki67 expression could be a potential reason since the half-life of Ki67 protein is only ~1–1.5 hr (Shirendeb et al., 2009). Other investigators have shown that microglial proliferation occurs in different regions of the normal mouse brain at low levels (Askew et al., 2017), and so it is possible that in our small region of interest, proliferating microglia were simply not present at the time of sampling. Microglial apoptosis occurs prominently when microglial activation is subsiding (Conde & Streit, 2006a; Gehrmann & Banati, 1995), and occurs also in normal adult mouse brain at low levels, as determined indirectly in Vav/Bcl2 overexpressing mice (Askew et al., 2017). Thus, the same issue of a small midbrain sampling area may explain our inability to detect apoptotic microglia in the mouse.
Using detailed morphometric analyses, we observed an overall decline in complexity, branching, and arborization area of microglia in an age-dependent manner. Damani et al. (2011) have shown that microglial motility of processes in response to acute injury is much slower in aged microglia compared to young microglia. The decrease in the arborization that we have shown to occur with aging could explain the reduced mobility of aged microglia, as this would decrease their ability to survey the microenvironment. We suspect that in response to such a decrease in surveillance function, the number of microglia increases to compensate for this loss by making more cells available for performing surveillance. Our data also show an increase in microglial-neuronal contact sites with aging, which is significantly less in SNc compared to VTA of age matched mice. Microglial-neuronal interactions are dynamic and include synaptic remodeling, which enables microglia to modulate neuronal functions (Paolicelli et al., 2011). In comparison to young neurons, aged neurons likely need more support from the neighboring cells, including microglia, to function properly, and this might be why there are more contact sites between microglia and neurons in old mice. As mentioned, the support provided by microglia is significantly less in SNc than in VTA, which may be important for understanding differential susceptibilities to degeneration of dopaminergic neurons in these two regions (Dauer & Przedborski, 2003). These data combined with the functional differences between SNc and VTA dopamine neurons that are implicated in the differential vulnerability of these neurons in aging (Courtney et al., 2012; Cragg & Greenfield, 1997; Keath et al., 2007) suggest both functional and neuroanatomical features of SNc and VTA dopamine potentially contribute in their aging related susceptibilities.
Supplementary Material
ACKNOWLEDGMENTS
We would like to thank Adithya Gopinath, Brittney A. Yegla, and Sarah Bahsoun for technical support, Dr. Jennifer Bizon for lending her technical expertise and the generous contribution in providing access to the stereology facility. This work is supported in part by the UF-Fixel Institute Developmental Fund, DA043895, International Brain Research Organization (IBRO), and National Institutes of Health, DA026947, DA043895, NS071122, OD020026, NS10310.
Funding information
International Brain Research Organization; UF-Fixel Institute Developmental Fund, Grant/Award Number: DA043895; National Institutes of Health, Grant/Award Numbers: DA026947, DA043895, NS071122, OD020026, NS103108
Abbreviations:
- DAPI
4′,6-diamidino-2-phenylindole
- AICc
akaike information criterion
- ANOVA
analysis of variance
- AUC
area under the curve
- BDNF
brain-derived neurotrophic factor
- CNS
central nervous system
- GDNF
glial cell-derived neurotrophic factor
- Iba1
ionized calcium binding adaptor molecule 1
- PFA
paraformaldehyde
- PD
Parkinson’s disease
- PBS
phosphate buffered saline
- PND5
postnatal day 5
- ROI
region of interest
- SEM
standard error of the mean
- SNc
substantia nigra pars compacta
- TUNEL
terminal deoxynucleotidyl transferase dUTP nick end labeling
- TH
tyrosine hydroxylase
- VTA
ventral tegmental area
Footnotes
CONFLICT OF INTEREST
The authors declare that there is no conflict of interest.
SUPPORTING INFORMATION
Additional supporting information may be found online in the Supporting Information section at the end of this article.
DATA AVAILABILITY STATEMENT
The data supporting the findings are available from the corresponding author upon request.
REFERENCES
- Askew K, Li K, Olmos-Alonso A, Garcia-Moreno F, Liang Y, Richardson P, … Gomez-Nicola D (2017). Coupled proliferation and apoptosis maintain the rapid turnover of microglia in the adult brain. Cell Reports, 18(2), 391–405. 10.1016/j.celrep.2016.12.041 [DOI] [PMC free article] [PubMed] [Google Scholar]
- Banuelos C, LaSarge CL, McQuail JA, Hartman JJ, Gilbert RJ, Ormerod BK, & Bizon JL (2013). Age-related changes in rostral basal forebrain cholinergic and GABAergic projection neurons: Relationship with spatial impairment. Neurobiology of Aging, 34(3), 845–862. 10.1016/j.neurobiolaging.2012.06.013 [DOI] [PMC free article] [PubMed] [Google Scholar]
- Barcia C, Sanchez Bahillo A, Fernandez-Villalba E, Bautista V, Poza YPM, Fernandez-Barreiro A, … Herrero MT (2004). Evidence of active microglia in substantia nigra pars compacta of parkinsonian monkeys 1 year after MPTP exposure. Glia, 46(4), 402–409. 10.1002/glia.20015 [DOI] [PubMed] [Google Scholar]
- Beach TG, Sue LI, Walker DG, Lue LF, Connor DJ, Caviness JN, … Adler CH (2007). Marked microglial reaction in normal aging human substantia nigra: Correlation with extraneuronal neuromelanin pigment deposits. Acta Neuropathologica, 114(4), 419–424. 10.1007/s00401-007-0250-5 [DOI] [PubMed] [Google Scholar]
- Bennett DA, Beckett LA, Murray AM, Shannon KM, Goetz CG, Pilgrim DM, & Evans DA (1996). Prevalence of parkinsonian signs and associated mortality in a community population of older people. The New England Journal of Medicine, 334(2), 71–76. 10.1056/NEJM199601113340202 [DOI] [PubMed] [Google Scholar]
- Biber K, Neumann H, Inoue K, & Boddeke HW (2007). Neuronal ‘On’ and ‘Off’ signals control microglia. Trends in Neurosciences, 30(11), 596–602. 10.1016/j.tins.2007.08.007 [DOI] [PubMed] [Google Scholar]
- Buchman AS, Shulman JM, Nag S, Leurgans SE, Arnold SE, Morris MC, … Bennett DA (2012). Nigral pathology and parkinsonian signs in elders without Parkinson disease. Annals of Neurology, 71(2), 258–266. 10.1002/ana.22588 [DOI] [PMC free article] [PubMed] [Google Scholar]
- Burnham KP, & Anderson DR (2002). Model Selection and Multimodel Inference: A Practical Information-Theoretic Approach (2nd ed.) New York, NY: Springer-Verlag. [Google Scholar]
- Bussian TJ, Aziz A, Meyer CF, Swenson BL, van Deursen JM, & Baker DJ (2018). Clearance of senescent glial cells prevents tau-dependent pathology and cognitive decline. Nature, 562(7728), 578–582. 10.1038/s41586-018-0543-y [DOI] [PMC free article] [PubMed] [Google Scholar]
- Butler B, Goodwin S, Saha K, Becker J, Sambo D, Davari P, & Khoshbouei H (2015). Dopamine transporter activity is modulated by alpha-synuclein. The Journal of Biological Chemistry, 290, 19009. 10.1074/jbc.M115.639880 [DOI] [PMC free article] [PubMed] [Google Scholar]
- Conde JR, & Streit WJ (2006a). Effect of aging on the microglial response to peripheral nerve injury. Neurobiology of Aging, 27(10), 1451–1461. 10.1016/j.neurobiolaging.2005.07.012 [DOI] [PubMed] [Google Scholar]
- Conde JR, & Streit WJ (2006b). Microglia in the aging brain. Journal of Neuropathology and Experimental Neurology, 65(3), 199–203. 10.1097/01.jnen.0000202887.22082.63 [DOI] [PubMed] [Google Scholar]
- Courtney NA, Mamaligas AA, & Ford CP (2012). Species differences in somatodendritic dopamine transmission determine D2-autoreceptor-mediated inhibition of ventral tegmental area neuron firing. The Journal of Neuroscience, 32(39), 13520–13528. 10.1523/JNEUROSCI.2745-12.2012 [DOI] [PMC free article] [PubMed] [Google Scholar]
- Cragg SJ, & Greenfield SA (1997). Differential autoreceptor control of somatodendritic and axon terminal dopamine release in substantia nigra, ventral tegmental area, and striatum. The Journal of Neuroscience, 17(15), 5738–5746. [DOI] [PMC free article] [PubMed] [Google Scholar]
- Damani MR, Zhao L, Fontainhas AM, Amaral J, Fariss RN, & Wong WT (2011). Age-related alterations in the dynamic behavior of microglia. Aging Cell, 10(2), 263–276. 10.1111/j.1474-9726.2010.00660.x [DOI] [PMC free article] [PubMed] [Google Scholar]
- Dauer W, & Przedborski S (2003). Parkinson’s disease: Mechanisms and models. Neuron, 39(6), 889–909. 10.1016/s0896-6273(03)00568-3 [DOI] [PubMed] [Google Scholar]
- Davis EJ, Foster TD, & Thomas WE (1994). Cellular forms and functions of brain microglia. Brain Research Bulletin, 34(1), 73–78. 10.1016/0361-9230(94)90189-9 [DOI] [PubMed] [Google Scholar]
- Driver JA, Logroscino G, Gaziano JM, & Kurth T (2009). Incidence and remaining lifetime risk of Parkinson disease in advanced age. Neurology, 72(5), 432–438. 10.1212/01.wnl.0000341769.50075.bb [DOI] [PMC free article] [PubMed] [Google Scholar]
- Franceschi C, Capri M, Monti D, Giunta S, Olivieri F, Sevini F, … Salvioli S (2007). Inflammaging and anti-inflammaging: A systemic perspective on aging and longevity emerged from studies in humans. Mechanisms of Ageing and Development, 128(1), 92–105. 10.1016/j.mad.2006.11.016 [DOI] [PubMed] [Google Scholar]
- Gehrmann J, & Banati RB (1995). Microglial turnover in the injured CNS: Activated microglia undergo delayed DNA fragmentation following peripheral nerve injury. Journal of Neuropathology and Experimental Neurology, 54(5), 680–688. [DOI] [PubMed] [Google Scholar]
- Gerhard A, Pavese N, Hotton G, Turkheimer F, Es M, Hammers A, … Brooks DJ (2006). In vivo imaging of microglial activation with [11C] (R)-PK11195 PET in idiopathic Parkinson’s disease. Neurobiology of Disease, 21(2), 404–412. 10.1016/j.nbd.2005.08.002 [DOI] [PubMed] [Google Scholar]
- Hefendehl JK, Neher JJ, Suhs RB, Kohsaka S, Skodras A, & Jucker M (2014). Homeostatic and injury-induced microglia behavior in the aging brain. Aging Cell, 13(1), 60–69. 10.1111/acel.12149 [DOI] [PMC free article] [PubMed] [Google Scholar]
- Heindl S, Gesierich B, Benakis C, Llovera G, Duering M, & Liesz A (2018). Automated morphological analysis of microglia after stroke. Frontiers in Cellular Neuroscience, 12, 106. 10.3389/fncel.2018.00106 [DOI] [PMC free article] [PubMed] [Google Scholar]
- Keath JR, Iacoviello MP, Barrett LE, Mansvelder HD, & McGehee DS (2007). Differential modulation by nicotine of substantia nigra versus ventral tegmental area dopamine neurons. Journal of Neurophysiology, 98(6), 3388–3396. 10.1152/jn.00760.2007 [DOI] [PubMed] [Google Scholar]
- Kettenmann H, Hanisch UK, Noda M, & Verkhratsky A (2011). Physiology of microglia. Physiological Reviews, 91(2), 461–553. 10.1152/physrev.00011.2010 [DOI] [PubMed] [Google Scholar]
- Krashia P, Martini A, Nobili A, Aversa D, D’Amelio M, Berretta N, … Mercuri NB (2017). On the properties of identified dopaminergic neurons in the mouse substantia nigra and ventral tegmental area. The European Journal of Neuroscience, 45(1), 92–105. 10.1111/ejn.13364 [DOI] [PubMed] [Google Scholar]
- Lana D, Ugolini F, Wenk GL, Giovannini MG, Zecchi-Orlandini S, & Nosi D (2019). Microglial distribution, branching, and clearance activity in aged rat hippocampus are affected by astrocyte meshwork integrity: Evidence of a novel cell-cell interglial interaction. The FASEB Journal, 33(3), 4007–4020. 10.1096/fj.201801539R [DOI] [PubMed] [Google Scholar]
- Lebowitz JJ, & Khoshbouei H (2019). Heterogeneity of dopamine release sites in health and degeneration. Neurobiology of Disease, 134, 104633. 10.1016/j.nbd.2019.104633 [DOI] [PMC free article] [PubMed] [Google Scholar]
- Miller DR, Shaerzadeh F, Phan L, Sharif N, Gamble-George J, McLaughlin JP, … Khoshbouei H (2018). HIV-1 Tat regulation of dopamine transmission and microglial reactivity is brain region specific. Glia, 66, 1915–1928. 10.1002/glia.23447 [DOI] [PMC free article] [PubMed] [Google Scholar]
- Morrison HW, & Filosa JA (2013). A quantitative spatiotemporal analysis of microglia morphology during ischemic stroke and reperfusion. Journal of Neuroinflammation, 10, 4. 10.1186/1742-2094-10-4 [DOI] [PMC free article] [PubMed] [Google Scholar]
- Naoi M, & Maruyama W (1999). Cell death of dopamine neurons in aging and Parkinson’s disease. Mechanisms of Ageing and Development, 111(2–3), 175–188. 10.1016/s0047-6374(99)00064-0 [DOI] [PubMed] [Google Scholar]
- Nishio T, Furukawa S, Akiguchi I, & Sunohara N (1998). Medial nigral dopamine neurons have rich neurotrophin support in humans. Neuroreport, 9(12), 2847–2851. [DOI] [PubMed] [Google Scholar]
- Ouchi Y, Yoshikawa E, Sekine Y, Futatsubashi M, Kanno T, Ogusu T, & Torizuka T (2005). Microglial activation and dopamine terminal loss in early Parkinson’s disease. Annals of Neurology, 57(2), 168–175. 10.1002/ana.20338 [DOI] [PubMed] [Google Scholar]
- Pais TF, Figueiredo C, Peixoto R, Braz MH, & Chatterjee S (2008). Necrotic neurons enhance microglial neurotoxicity through induction of glutaminase by a MyD88-dependent pathway. Journal of Neuroinflammation, 5, 43. 10.1186/1742-2094-5-43 [DOI] [PMC free article] [PubMed] [Google Scholar]
- Paolicelli RC, Bolasco G, Pagani F, Maggi L, Scianni M, Panzanelli P, … Gross CT (2011). Synaptic pruning by microglia is necessary for normal brain development. Science, 333(6048), 1456–1458. 10.1126/science.1202529 [DOI] [PubMed] [Google Scholar]
- Perry VH, & Holmes C (2014). Microglial priming in neurodegenerative disease. Nature Reviews. Neurology, 10(4), 217–224. 10.1038/nrneurol.2014.38 [DOI] [PubMed] [Google Scholar]
- Reeve A, Simcox E, & Turnbull D (2014). Ageing and Parkinson’s disease: Why is advancing age the biggest risk factor? Ageing Research Reviews, 14, 19–30. 10.1016/j.arr.2014.01.004 [DOI] [PMC free article] [PubMed] [Google Scholar]
- Rodriguez-Pallares J, Parga JA, Munoz A, Rey P, Guerra MJ, & Labandeira-Garcia JL (2007). Mechanism of 6-hydroxydopamine neurotoxicity: The role of NADPH oxidase and microglial activation in 6-hydroxydopamine-induced degeneration of dopaminergic neurons. Journal of Neurochemistry, 103(1), 145–156. 10.1111/j.1471-4159.2007.04699.x [DOI] [PubMed] [Google Scholar]
- Samorajski T (1976). How the human brain responds to aging. Journal of the American Geriatrics Society, 24(1), 4–11. [DOI] [PubMed] [Google Scholar]
- Scholzen T, & Gerdes J (2000). The Ki-67 protein: From the known and the unknown. Journal of Cellular Physiology, 182(3), 311–322. [DOI] [PubMed] [Google Scholar]
- Shirendeb U, Hishikawa Y, Moriyama S, Win N, Thu MM, Mar KS, … Koji T (2009). Human papillomavirus infection and its possible correlation with p63 expression in cervical cancer in Japan, Mongolia, and Myanmar. Acta Histochemica et Cytochemica, 42(6), 181–190. 10.1267/ahc.09030 [DOI] [PMC free article] [PubMed] [Google Scholar]
- Sierra A, Gottfried-Blackmore AC, McEwen BS, & Bulloch K (2007). Microglia derived from aging mice exhibit an altered inflammatory profile. Glia, 55(4), 412–424. 10.1002/glia.20468 [DOI] [PubMed] [Google Scholar]
- Streit WJ (2002). Microglia as neuroprotective, immunocompetent cells of the CNS. Glia, 40(2), 133–139. 10.1002/glia.10154 [DOI] [PubMed] [Google Scholar]
- Streit WJ, Braak H, Xue QS, & Bechmann I (2009). Dystrophic (senescent) rather than activated microglial cells are associated with tau pathology and likely precede neurodegeneration in Alzheimer’s disease. Acta Neuropathologica, 118(4), 475–485. 10.1007/s00401-009-0556-6 [DOI] [PMC free article] [PubMed] [Google Scholar]
- Streit WJ, & Kreutzberg GW (1988). Response of endogenous glial cells to motor neuron degeneration induced by toxic ricin. The Journal of Comparative Neurology, 268(2), 248–263. 10.1002/cne.902680209 [DOI] [PubMed] [Google Scholar]
- Streit WJ, Sammons NW, Kuhns AJ, & Sparks DL (2004). Dystrophic microglia in the aging human brain. Glia, 45(2), 208–212. 10.1002/glia.10319 [DOI] [PubMed] [Google Scholar]
- Streit WJ, & Xue QS (2013). Microglial senescence. CNS & Neurological Disorders Drug Targets, 12(6), 763–767. [DOI] [PubMed] [Google Scholar]
- Streit WJ, Xue QS, Tischer J, & Bechmann I (2014). Microglial pathology. Acta Neuropathologica Communications, 2(1), 142. 10.1186/s40478-014-0142-6 [DOI] [PMC free article] [PubMed] [Google Scholar]
- Tischer J, Krueger M, Mueller W, Staszewski O, Prinz M, Streit WJ, & Bechmann I (2016). Inhomogeneous distribution of Iba-1 characterizes microglial pathology in Alzheimer’s disease. Glia, 64(9), 1562–1572. 10.1002/glia.23024 [DOI] [PubMed] [Google Scholar]
- Tremblay ME, Zettel ML, Ison JR, Allen PD, & Majewska AK (2012). Effects of aging and sensory loss on glial cells in mouse visual and auditory cortices. Glia, 60(4), 541–558. 10.1002/glia.22287 [DOI] [PMC free article] [PubMed] [Google Scholar]
- Xu H, Chen M, Manivannan A, Lois N, & Forrester JV (2008). Age-dependent accumulation of lipofuscin in perivascular and subretinal microglia in experimental mice. Aging Cell, 7(1), 58–68. 10.1111/j.1474-9726.2007.00351.x [DOI] [PubMed] [Google Scholar]
- Xu H, Gelyana E, Rajsombath M, Yang T, Li S, & Selkoe D (2016). Environmental enrichment potently prevents microglia-mediated neuroinflammation by human amyloid beta-protein oligomers. The Journal of Neuroscience, 36(35), 9041–9056. 10.1523/JNEUROSCI.1023-16.2016 [DOI] [PMC free article] [PubMed] [Google Scholar]
- Xue QS, & Streit WJ (2011). Microglial pathology in Down syndrome. Acta Neuropathologica, 122(4), 455–466. 10.1007/s00401-011-0864-5 [DOI] [PubMed] [Google Scholar]
Associated Data
This section collects any data citations, data availability statements, or supplementary materials included in this article.
Supplementary Materials
Data Availability Statement
The data supporting the findings are available from the corresponding author upon request.