Abstract
Objective
To identify the best quantitative fat–water MRI biomarker for disease progression of leg muscles in Becker muscular dystrophy (BMD) by applying a stepwise approach based on standardized response mean (SRM) over 24 months, correlations with baseline ambulatory tests, and reproducibility.
Methods
Dixon fat–water imaging was performed at baseline (n = 24) and 24 months (n = 20). Fat fractions (FF) were calculated for 3 center slices and the whole muscles for 19 muscles and 6 muscle groups. Contractile cross-sectional area (cCSA) was obtained from the center slice. Functional assessments included knee extension and flexion force and 3 ambulatory tests (North Star Ambulatory Assessment [NSAA], 10-meter run, 6-minute walking test). MRI measures were selected using SRM (≥0.8) and correlation with all ambulatory tests (ρ ≤ −0.8). Measures were evaluated based on intraclass correlation coefficient (ICC) and SD of the difference. Sample sizes were calculated assuming 50% reduction in disease progression over 24 months in a clinical trial with 1:1 randomization.
Results
Median whole muscle FF increased between 0.2% and 2.6% without consistent cCSA changes. High SRMs and strong functional correlations were found for 8 FF but no cCSA measures. All measures showed excellent ICC (≥0.999) and similar SD of the interrater difference. Whole thigh 3 center slices FF was the best biomarker (SRM 1.04, correlations ρ ≤ −0.81, ICC 1.00, SD 0.23%, sample size 59) based on low SD and acquisition and analysis time.
Conclusion
In BMD, median FF of all muscles increased over 24 months. Whole thigh 3 center slices FF reduced the sample size by approximately 40% compared to NSAA.
Becker muscular dystrophy (BMD) is characterized by progressive muscle weakness due to the reduced production of a truncated dystrophin protein.1 Disease progression is usually slow and highly variable.2 This complicates design of clinical trials and emphasizes the development of objective and sensitive biomarkers.
Muscle fat fraction (FF) can be quantified reliably using Dixon chemical-shift MRI or magnetic resonance spectroscopy (MRS) and is considered a promising biomarker in muscular dystrophies.3,4 In Duchenne muscular dystrophy (DMD), FF increases within 12 months,5,6 predicts change in function and clinical milestones,7,8 and reduces sample sizes (SS) needed to detect a treatment effect compared to functional outcome measures.5,9,10 Quantitative muscle MRI also proved more sensitive to detect changes than functional measures in other, slowly progressive, neuromuscular diseases like FKRP-related limb-girdle muscular dystrophy R9, GNE myopathy, and Charcot-Marie-Tooth 1A.11-13
In BMD, longitudinal MRI data are limited. In a recent 1-year follow-up study in 16 patients, no significant increase in FF was found.14 Although FF correlated to functional outcomes in cross-sectional studies,15-18 there is a large variability in FF between muscles. Quantitative MRI yields a large number of acquisition and analysis possibilities, including for instance acquisition location, size of the field of view, and number of included muscles. In this study, we aimed to assess which muscle MRI measure (FF or contractile cross-sectional area [cCSA]), and which muscle or muscle group, was the most suitable biomarker to reflect disease progression in BMD.
Methods
Study Participants
Patients with BMD were recruited from the Dutch Dystrophinopathy Database in a prospective longitudinal observational study conducted at the Leiden University Medical Center.19 Inclusion criteria were male sex, age ≥18 years, DNA confirmed diagnosis (in-frame mutation) of BMD or supported by clinical phenotype (ambulant >16 years without steroid treatment), and no contraindications to MRI examination. Sex- and age-matched healthy controls (HCs) were recruited using flyers and advertisements.
Standard Protocol Approvals, Registrations, and Patient Consents
The study was approved by the local medical ethical committee. All patients signed written informed consent.
Study Design and Functional Tests
MRI and clinical assessments were performed at baseline and 2 years follow-up in patients with BMD and only at baseline in HC. Clinical assessments consisted of the North Star Ambulatory Assessment (NSAA, points), 10-meter run/walk test velocity (TMRv, m/s), 6-minute walk test (6MWT), and quantitative muscle assessment (QMA)–based strength of knee extensors (kg) and knee flexors (kg) on both sides within 1 week after the MRI by trained evaluators as described previously.20-22
MRI Acquisition
Thigh and lower leg muscles were examined at 3T (Philips Ingenia) using a 16-element receive coil placed on the anterior section of the leg and the 12-element coil located inside the patient table. Position of the patients was supine, feet first. A 3-point Dixon sequence (23 transverse slices, voxel size 1 × 1 × 10 mm, slice gap 5 mm, repetition time/echo time/echo time shift 210/4.41/0.76 ms, flip angle 8°, number of signal averages 2) was performed. Field of view (FOV) in the lower leg was 180 × 180 mm. FOV in the thigh ranged between 180 × 180 mm and 220 × 220 mm depending on the size of the thigh of the participant. Slice stacks were oriented perpendicular to the femur in the thigh and perpendicular to the tibia in the lower leg and centered at mid-thigh level and at the thickest part of the calf.
MRI Analysis
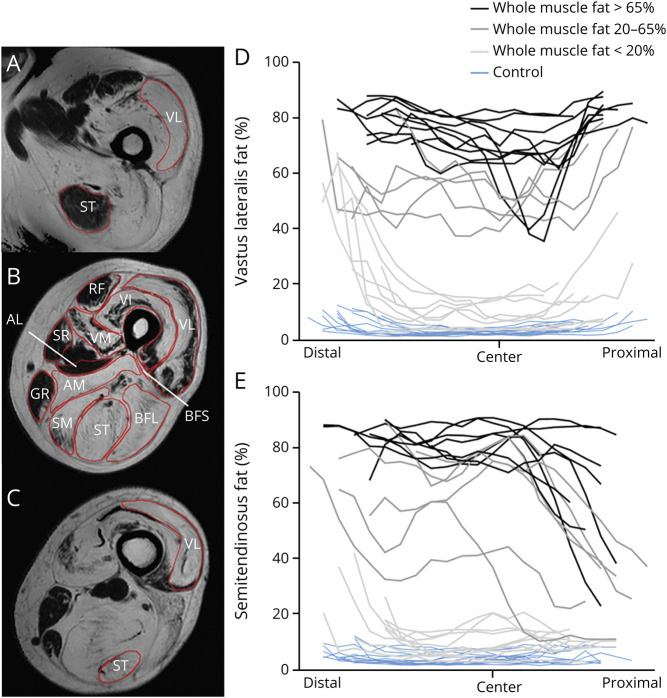
MRI data were analyzed as described before.23 We created FF maps by dividing the signal intensity of the fat image by the signal intensity of the fat plus the water image. A single observer (N.M.v.d.V.) manually drew regions of interest (ROIs) on the boundaries of the muscles for a total of 12 thigh (figure 1) and 7 lower leg muscles on the water images of each slice using Medical Image Processing Analysis and Visualization (MIPAV) software (mipav.cit.nih.gov/). Images with clear movement or reconstruction artefacts were excluded. To test reproducibility, a second observer (K.R.K.) drew ROIs in a subset of patients. These included 3 randomly selected participants with low FF (<20% fat), mid FF (20%–65%), and high FF (>65%) based on the average FF of all thigh muscles. We determined reproducibility of the ROI analysis using intraclass correlation coefficient (ICC) with a 2-way random effects model and absolute agreement and using the SD of the interrater difference between the 2 observers.
Figure 1. Heterogenous Fat Distribution in Vastus Lateralis (VL) and Semitendinosus (ST).
Example of regions of interest (B) and of heterogenous fat distribution from distal (A) to proximal (C) in the VL (A–D) and ST (A–C, E). (B) An example of heterogenous fat distribution in the axial plane of the quadriceps. To enhance visualization of the fat differences along the proximodistal axis of the muscles, patients are grouped according to their weighted fat of the whole muscle (light gray: <20% fat; dark gray: 20%–65% fat; black: >65% fat). The muscles are aligned based on the insertion of the biceps femoris short head (BFS) (marked as “center”) in D and E. Distal and proximal muscle parts are depicted in the left and right part of the figure, respectively. Blue lines: healthy controls; black/grey lines: Becker muscular dystrophy patients. Each line represents one individual participant. AL = adductor longus; AM = adductor magnus; BFL = biceps femoris long head; GR = gracilis; RF = rectus femoris; SM = semimembranosus; SR = sartorius; VI = vastus intermedius; VM = vastus medialis.
Quantification of Muscle Measures
We used the ROIs to obtain 3 measures: FF per slice and per muscle and cCSA. FFs were calculated per slice and per muscle by transposing the ROIs onto the FF map. An in-house developed MATLAB script (MathWorks) was used to erode the ROIs by 2 reconstruction voxels and to correct for the chemical shift displacement to avoid contamination with subcutaneous fat. cCSA was calculated in the center slice as a measure of the fat-free area using the following formula: cCSA = CSA*(1−FF). This center slice was determined in consensus by 3 observers (N.M.v.d.V., K.R.K., H.E.K.) and positioned using internal landmarks. The center slice was located at the slice containing the biceps femoris short head (BFS) insertion in the thigh and at the slice containing the flexor digitorum longus insertion in the lower leg.24 The 3 center slices were defined by the center slice plus 1 proximal and distal slice. We normalized the FFs for muscle area to obtain weighted FFs over 2 regions: 3 center slices and the whole depicted muscle. The same number of slices was used for the whole muscle analysis at baseline and follow-up. Finally, we combined outcomes of individual muscles into muscle groups to obtain a further set of MRI measures: whole thigh and whole lower leg, quadriceps (vastus lateralis [VL], vastus intermedius [VI], vastus medialis [VM], and rectus femoris [RF]), hamstrings (BFS, biceps femoris long head [BFL], semitendinosus, and semimembranosus), adductors (adductor longus and magnus, sartorius, and gracilis), and triceps surae (soleus, gastrocnemius medialis [GCM], and gastrocnemius lateralis [GCL]). This resulted in a total of 71 MRI measures: 3 outcomes per muscle (FF of the whole muscle, FF of 3 center slices, and cCSA) times 19 individual muscles and 6 muscle groups, minus cCSA and FF of 3 center slices for adductor longus and BFS. We did not use these 2 muscles for the analyses due to the choice of the landmark location at the BFS insertion. For readability, FFs are expressed as percentage.
Stepwise Biomarker Selection
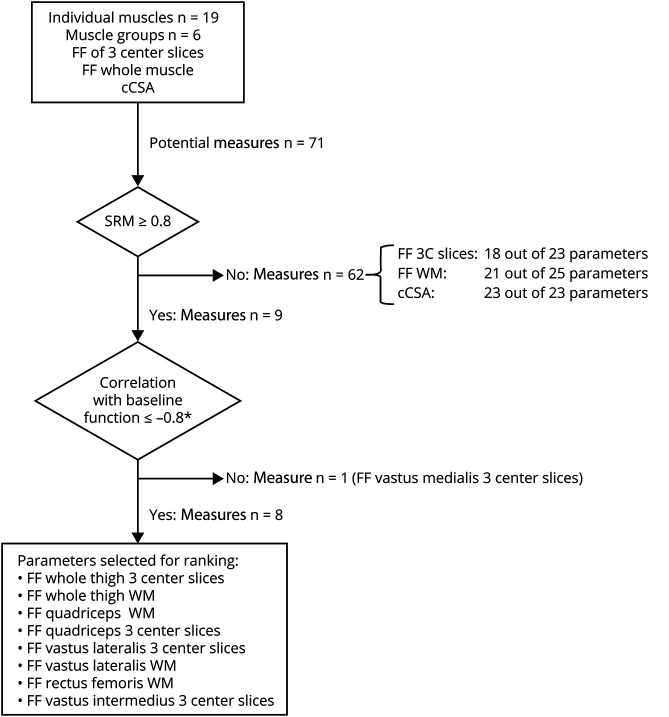
We used the acquired quantitative MRI measures to identify the optimal MRI biomarker for disease progression using a stepwise approach. The first step was based on the responsiveness to disease progression of each measure, measured by the standardized response mean (SRM), calculated as the mean change/SD of the change (figure 2). We only included measures with an SRM of ≥0.8 in the next step.25 We calculated corresponding SS for a potential clinical trial for each measure as primary outcome measure using the Lehr formula according to the method described by Morrow et al.11 In this calculation, we assumed a 50% reduction in disease progression over 24 months, a power of 80%, and an α < 0.05 in a 1:1 randomization. In the second step, only those measures that had a strong negative correlation of ≤−0.8 between baseline FF and all baseline functional tests (NSAA, TMRv, and 6MWT) were included. In the third and final step, we ranked the measures using the ICC and the SD of the difference between the 2 observers. The measure with the highest reproducibility in this final step was considered the best biomarker.
Figure 2. Flowchart of the Stepwise Process for Selection of MRI Measures.
*Correlation with baseline North Star Ambulatory Assessment, 10-meter run test, and 6-minute walk test. 3C slices = 3 center slices; cCSA = contractile cross-sectional area; FF = fat fraction; SRM = standardized response mean; WM = whole muscle.
We assessed the effect of a different center slice selection on measuring disease progression by shifting the center slice of the follow-up MRI 1 slice (corresponding to 1.5 centimeters) proximal or distal compared to the original center slice.
Statistical Analysis
Data are presented as median (range) unless otherwise stated. Wilcoxon signed-rank tests were used to assess changes in functional tests and quantitative muscle measures between baseline and follow-up. Spearman correlation coefficient was used to correlate functional and MRI measures at baseline and change over 2 years. We only correlated the delta FF of the 3 muscle measures with the lowest SD of the interrater difference in the stepwise biomarker selection to change in function. The current study was complementary to a second BMD longitudinal observational study that was performed in parallel at our institution,26 and some patients participated in both studies. As in a few patients the functional tests could not be performed within 1 week of the MRI scan at baseline, multiple imputation (5 times) was performed for these functional tests using the available data from the parallel study (3–5 time points per patient: 1 per year). We also calculated SRMs and SS for the functional tests as described above. All statistical tests were performed with IBM SPSS Statistics version 25. Statistical significance was set at p ≤ 0.05.
Data Availability
Anonymized data can be made available to qualified investigators on request.
Results
Cohort Characteristics
A total of 24 patients with BMD (median age, 41.3 years [18.8–66.3]) and 13 HCs (median age, 43.3 years [21.3–63.6]) were included at baseline. All patients were ambulant (defined as being able to walk 10 meters with support of a cane). After imputation (TMRv, n = 4; NSAA, n = 5; 6MWT, n = 2), baseline functional assessments were available for 23 out of 24 patients. Functional testing could not be performed in 1 patient due to known muscle cramps and pain following exercise.
Two patients did not complete follow-up (1 deceased and 1 no-show). Of the 22 patients who participated in the follow-up visit after a mean of 1.95 ± 0.23 years, 1 patient did not perform functional tests again due to muscle cramps. In 2 patients, MRI data were not available at follow-up due to a contraindication to MRI scanning (implantable cardioverter-defibrillator implantation) and a protocol deviation in which the opposite leg was scanned. Thus, longitudinal functional and MRI measurements were available for 21 and 20 patients, respectively.
Functional Assessments
At baseline, all functional tests showed large variability between patients (table 1). One patient lost ambulation during the study. Both the NSAA (−2.5 points, p = 0.002) and TMRv (−0.22 m/s, p = 0.014) declined significantly in 2 years, whereas the 6MWT did not. The SRM of the NSAA was higher (−0.81) than those of TMRv (−0.68) and 6MWT (−0.46). This resulted in a SS of 98 for the NSAA, 138 for the TMRv, and 310 for the 6MWT. Of the QMA measures, only the strength of the knee flexors decreased significantly in 24 months (median −1.4 kg, p = 0.04, SRM = −0.71, SS 126).
Table 1.
Change in Functional Assessments Between Baseline and After 24 Months
FF and cCSA at Baseline and Follow-up
Visual inspection showed that fat replacement was nonuniform over the proximodistal axis in the majority of individual muscles and that the pattern differed between muscles. For example, the FF of the VL seemed higher near the proximal and distal end of the muscle while in the semitendinosus the FF appeared higher near the distal end and was lower towards the proximal muscle part (figure 1). Interestingly, some muscles (e.g., the quadriceps muscles) also showed heterogeneous fat replacement in the axial plane in some patients (figure 1b).
Baseline median whole thigh FF was 52.0% (4.4–72.9) and median whole lower leg FF was 25.5% (4.4–56.5). Values of individual muscles whole muscle median FFs were highly variable between muscles and between patients, from median FF 7.9% (3.8–14.2) in the tibialis posterior to 68.1% (3.2–87.0) in the BFL.
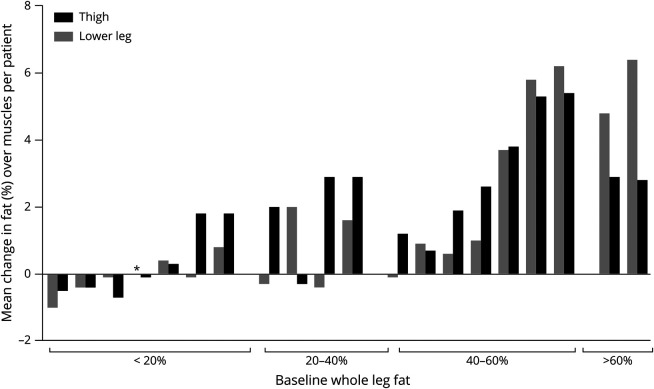
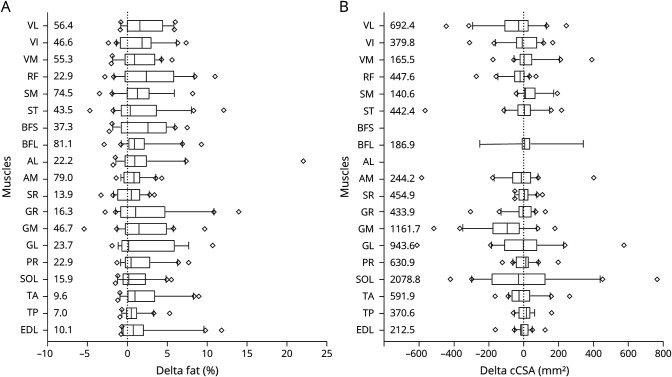
Whole thigh and lower leg FF changes from baseline to follow-up were low in patients with baseline whole leg fat <20% (median FF change in the thigh of −0.06% [−0.7 to 1.8] and in the lower leg −0.07% [−1.0 to 0.8]). In patients with baseline 40%–60% fat, and even in patients with >60% fat, the increase was relatively high (up to 5.4% in the thigh and 6.4% in the lower leg) (figure 3). Overall, whole muscle FF increased significantly over 24 months in the thigh (median +1.9% [−0.7 to 5.4], p = 0.01) and lower leg (median +0.7% [−1.0 to 6.4], p = 0.02). FF increases varied somewhat between individual muscles (figure 4A; table e-1 [git.lumc.nl/neuroscience/2021_VeldeNMvande_Neurology_BMD_MRI]), ranging from a median increase of +0.2% (−1.9 to 10.7) in the GCL to +2.6% (−2.3 to 2.6) in the BFS.
Figure 3. Mean Change in Fat in Thigh and Lower Leg Whole Muscles per Patient.
Each patient is represented by a black and gray bar stitched together. Black and gray bars indicate mean change over thigh and lower leg muscles, respectively. Patients are subdivided in 4 groups based on their average weighted fat over all thigh and lower leg muscles (<20%, 20%–40%, 40%–60%, and >60% fat). *Mean change of zero.
Figure 4. Change in Fat and Contractile Cross-Sectional Area (cCSA) Over 24 Months.
(A) Change in fat over 24 months. (B) Change in cCSA over 24 months. Boxes show median (IQR). The lines represent the 10th–90th percentile with diamonds indicating values outside this window. Median baseline values are given at the left border. AL = adductor longus; AM = adductor magnus; BFL = biceps femoris long head; BFS = biceps femoris short head; EDL = extensor digitorum longus; GL = gastrocnemius lateralis; GM = gastrocnemius medialis; GR = gracilis; PR = peroneus; RF = rectus femoris; SM = semimembranosus; SOL = soleus; SR = sartorius; ST = semitendinosus; TA = tibialis anterior; TP = tibialis posterior; VI = vastus intermedius; VL = vastus lateralis; VM = vastus medialis.
cCSA showed large variability between individual muscles and patients at baseline (table e-1). In the thigh, the VL had the highest median cCSA (692.4 mm2 [246.7 to 3,116.2] vs median cCSA 2,991.5 mm2 [2,390 to 3,540] in controls), and in the lower leg the median cCSA of the soleus was highest (2,078.8 mm2 [1,354.6 to 3,621.6] vs a median of 2,266.3 mm2 [1,343.4 to 3,005.7] in controls). The cCSA change over 24 months in patients with BMD was highly variable in and between muscles, ranging from a median decrease in the GCM of −95.5 mm2 (−516.4 to 181.6) to a median increase in the tibialis posterior of 16.3 mm2 (−58.4 to 159.3) (figure 4B and table e-1 [git.lumc.nl/neuroscience/2021_VeldeNMvande_Neurology_BMD_MRI]).
Selection of Quantitative MRI Biomarkers
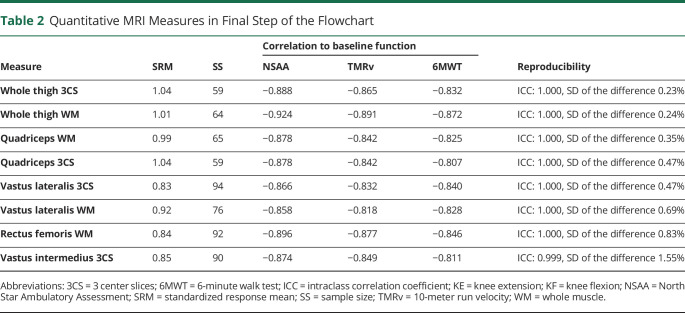
We included a total of 71 muscle MRI measures in the selection procedure. For the first step, that is, selection based on SRM, 9 measures had an SRM ≥0.8 (figure 2). Only FF of individual muscles or muscle groups passed this criterion, but none of the muscles or muscle groups cCSA. The SRMs of 3 center slices FF of the whole thigh and quadriceps were highest (1.04, corresponding SS of 59). In the second step, we found a correlation stronger than −0.8 between baseline FF and baseline tests of ambulatory function (NSAA, TMRv, and 6MWT) in 8 out of 9 measures. For individual muscles, these included FF of 3 center slices of the VL and the VI, and FF of the whole muscle of the VL and the RF. For muscle groups, this applied to the FF of both 3 center slices and whole muscle of the whole thigh and the quadriceps. The FF of 3 center slices of the VM showed a weaker correlation than −0.8 to the ambulatory tests. In the third and final step, all 8 measures showed an excellent ICC (table 2). The FF of whole thigh 3 center slices had the lowest SD of the difference between the 2 observers (0.23%). SD of the difference of whole thigh whole muscle was about the same (0.24%). The FF of VI 3 center slices had the highest SD (1.55%). The values of all measures of each step are given in table e-1. Definite ranking in the third step was not meaningful to the high ICCs and relatively small variation between SDs of the difference of the measures.
Table 2.
Quantitative MRI Measures in Final Step of the Flowchart
Relation Between Change in Function and FF
Changes in NSAA correlated weakly to changes in FF of 3 center slices and whole muscle of the whole thigh (ρ = −0.244, p = 0.314 and ρ = −0.222, p = 0.361) and weakly to quadriceps whole muscle (ρ = −0.341, p = 0.152). None of these longitudinal correlations was significant. Correlations between changes in the TMRv and 6MWT vs changes FF of the 3 muscle groups were all weak (−0.133 ≤ ρ ≤ −0.332) and not statistically significant (figure 5).
Figure 5. Relation Between Change in Function Tests and Fat Fraction (FF).
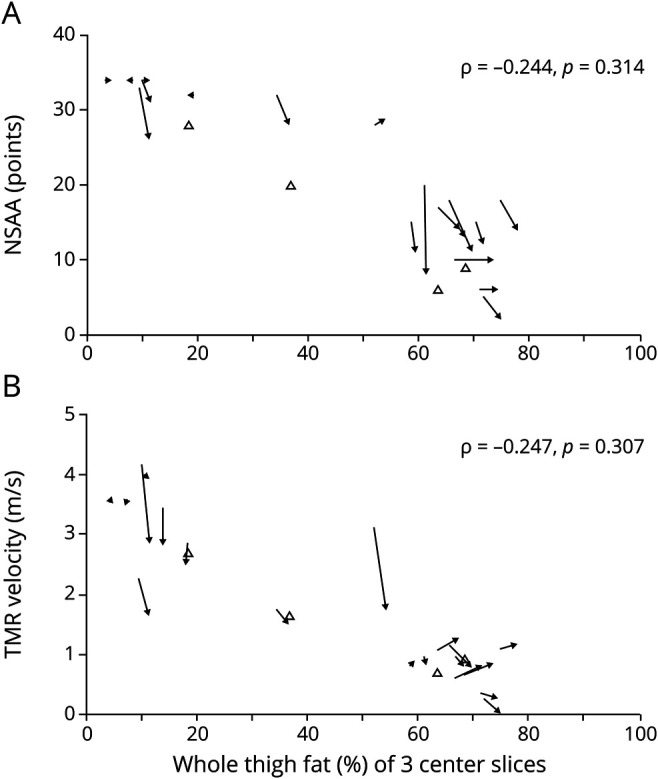
Change in whole thigh FF of 3 center slices vs (A) North Star Ambulatory Assessment (NSAA) and (B) 10-meter run test (TMR) velocity. Closed arrows: patients with baseline and follow-up measurements. Open triangles: patients with only 1 measurement (baseline). Horizontal arrows indicate functionally stable patients but with a change in FF.
Discussion
This prospective study describes longitudinal functional and quantitative muscle MRI data of patients with BMD. Quantitative water-fat imaging demonstrated an increase in median fat of all individual muscles over 24 months, irrespective of the FF at baseline. After a stepwise biomarker selection approach using SRMs, correlation to baseline function, and reproducibility, 8 thigh FF measures were selected as potential biomarkers for disease progression.
The conduction of clinical trials in muscular dystrophies has been hampered by the lack of objective biomarkers that are sensitive to disease progression, that are reproducible, and that show a relation with functional assessments. Trial development and conduction is even more complicated in BMD due to the low prevalence and the slow and heterogenous disease severity and progression. FF has been suggested as a sensitive biomarker for disease progression in several other muscular dystrophies and can be quantified by MRS or fat–water imaging.5,27,28 Dixon fat–water MRI allows determination of FFs and cCSAs of not only a wide range of different muscles, but also parts of muscles or muscle groups. For example, studies in several neuromuscular diseases have used single-slice, multislice (ranging from 3 to 15 slices), and different sets of individual muscles or muscle groups10-13,29,30 in their analyses. It is therefore not immediately clear which (part of) muscle or muscle group is most sensitive to detect disease progression. In our study, only thigh FF measures had a sufficiently high SRM to be included in the second step of the biomarker selection, and no cCSA measures. The variability of cCSA between patients is apparently larger than the change that can be detected in this slowly progressive disease, which is in line with findings in other neuromuscular diseases.11,12 In contrast to FF of the thigh, none of the lower leg FF measures had high SRMs. This may be explained by the BMD muscle pattern of involvement, where thigh muscles show weakness in early disease states, while lower leg muscles are spared until later.16,18
Our data from the second step in the biomarker selection confirmed the high correlation previously observed between muscle FF and clinical outcome measures at one time point in BMD,15-17 as 8 out of 9 thigh FF measures passed this criterion. These 8 MRI measures all had higher SRM than the functional tests, including the NSAA. Translated to SS for a hypothetical clinical trial, this would result in a reduction of 39 (compared to the NSAA) to 251 (compared to the 6MWT) patients per group to detect a 50% reduction of disease progression over 24 months for the 2 MRI measures with the highest SRM in our study, that is, the 3 center slices FF of whole thigh and quadriceps.
The excellent ICC in the third step is in line with previous findings that quantification of FF by quantitative MRI is accurate and reproducible.8,27,31 We assessed the reproducibility of the FF measures in even more detail by calculating the SD of the difference between 2 observers. Although low SD values did not allow a final ranking based on statistically significant differences, even small variabilities in SDs of the difference may obscure the relatively small increases in FF over time present in slowly progressive diseases, and can therefore influence the sensitivity to detect treatment effect in clinical trials. We found that muscle groups had lower between-observer variability, compared to individual muscles, and hence showed more promise as biomarkers. This is probably due to easier determination of borders of muscle groups in highly fatty replaced muscles compared to delineating individual muscles.12 A recent study described higher SRMs for segmentation of whole muscle groups compared to individual muscles in several other chronic and progressive neuromuscular diseases,32 supporting the results of our study. Using MRI measures that are based on only a small part of the muscle has significant advantages over using a whole muscle. First, imaging whole muscles may lead to difficulties in obtaining sufficient scan quality at the edges of the field of view due to B0 and B1 artifacts. This could be solved by imaging the thigh in 2 rather than 1 slice stack, but leads to a duplication of scanning time. Second, as no software exists that can accurately segment (partly) fatty replaced muscles, all analyses must be performed manually, which is time-consuming. Based on the small interrater differences and the advantages of imaging a small part of the muscle, whole thigh 3 center slices FF was the best biomarker in our cohort.
A potential disadvantage of using only 3 center slices could be the nonuniform fat replacement that we observed in the majority of thigh muscles. This variability has also been described in other muscular disorders,33-35 and could influence the repeatability when the center slice is not determined consistently. Indeed, our previous study in DMD demonstrated that shifting a slice stack of 4 center slices 1 slice proximal or distal resulted in a significant mean difference of 1%–2% in FF, ranging up to 12%.33 In the present study, the difference between change in whole thigh 3 center slices FF of the original center slice vs 1 slice shift proximal and distal ranged between a minimum of −2.4% to a maximum 2.7% within the patients. This highlights that the center slice should be selected precisely and consistently in longitudinal follow-up by trained technicians, especially in multicenter studies.
We assessed reproducibility in detail for analysis of ROIs. Final implementation of a biomarker in clinical trials would also require assessment of other sources of variability, such as intrasite and intersite variability in a multicenter setting. This has been addressed in HCs for a single vendor36 and in patients with DMD across vendors.37 High measures of reproducibility were achieved in both studies. Thus, a standardized image acquisition and analysis protocol, including instructions for center slice selection, could support the use of FF as biomarker in multicenter clinical trials. In such trials, it also remains important to assess system stability and variability between sites using a phantom, as was recently shown for liver FF.38
The results of our study confirm the insensitivity of functional tests as biomarker over shorter periods of time, as shown in several neuromuscular diseases.11,27,39 Although this substantiates the need for biomarker development, implementation of such biomarkers is only possible upon proving a clear association with a clinical meaningful endpoint. This interdependence has been recently shown in DMD,7,8 but should still be demonstrated with longer follow-up in BMD. Furthermore, other imaging biomarkers, such as the global T2 relaxation time, have also been shown to be sensitive to disease progression and predictive of function in DMD.7,40 However, this global T2 relaxation time (or MRI T2) is dominated by the fat signal, and therefore largely reflects the changes in fat replacement that we assessed here using the Dixon technique. By contrast, the water T2 relaxation time is thought to reflect edema or inflammation, and has been shown to be elevated early in the disease process in DMD.41 We recently showed no differences in water T2 between patients with BMD and HCs23 and have therefore not included this in the current analysis.
This study has limitations. Some functional tests (TMRv, n = 4; NSAA, n = 5; 6MWT, n = 2) were performed more than 1 week after baseline MRI examination. These values were therefore imputed to assess the decline in functional tests over 2 years, and to enable the direct comparison of SRMs of functional tests and MRI measures. The cohort was also relatively small, and definite ranking based on reproducibility was not possible. Our results should therefore be confirmed in another preferably larger cohort. Finally, only ambulant patients were included in our study, although this was not an inclusion criterion. Results may therefore not be extrapolated to patients with BMD in later disease stages.
FF of whole thigh 3 center slices was the optimal biomarker based on high SRM, low SD of the difference, and practical considerations in this ambulant and adult BMD population. This biomarker potentially lowered the SS of a clinical trial over 24 months by 39 patients compared to the NSAA, which is equivalent to a reduction of approximately 40%. The results support the use of FF quantified by quantitative MRI as biomarker in clinical trials in slowly progressive and heterogeneous diseases like BMD.
Acknowledgment
Several of the authors are members of the European Reference Network for Rare Neuromuscular Diseases (ERN EURO-NMD).
Glossary
- 6MWT
6-minute walk test
- BFL
biceps femoris long head
- BFS
biceps femoris short head
- BMD
Becker muscular dystrophy
- cCSA
contractile cross-sectional area
- DMD
Duchenne muscular dystrophy
- FF
fat fraction
- FOV
field of view
- GCL
gastrocnemius lateralis
- GCM
gastrocnemius medialis
- HC
healthy control
- ICC
intraclass correlation coefficient
- MRS
magnetic resonance spectroscopy
- NSAA
North Star Ambulatory Assessment
- QMA
quantitative muscle assessment
- RF
rectus femoris
- ROI
region of interest
- SRM
standardized response mean
- SS
sample size
- TMRv
10-meter run test velocity
- VI
vastus intermedius
- VL
vastus lateralis
- VM
vastus medialis
Appendix. Authors

Study Funding
This study was funded by the Netherlands Organization for Health Research and Development (113302001).
Disclosure
N.M. van de Velde reports no relevant disclosures. M.T. Hooijmans reports grants from Netherlands Organization for Health Research and Development, grant 113302001, during the conduct of the study. A.S.D. Sardjoe Mishre and K.R. Keene report no relevant disclosures. Z. Koeks reports grants from Netherlands Organization for Health Research and Development, grant 113302001, during the conduct of the study. T.T.J. Veeger, I. Alleman, and E.W. van Zwet report no relevant disclosures. J.M. Beenakker reports research support from Philips Healthcare during the conduct of the study. J.J.G.M. Verschuuren receives financial support Prinses Beatrix Spierfonds. H.E. Kan reports grants from Netherlands Organization for Health Research and Development, grant 113302001, during the conduct of the study; research support from Philips Healthcare during the conduct of the study; consultancy for PTC Therapeutics and Esperare; and trial support from ImagingDMD-UF outside the submitted work. E.H. Niks reports ad hoc consultancies for BioMarin, Summit, and WAVE, and worked as investigator of clinical trials of BioMarin, GSK, Lilly, Santhera, Givinostat, WAVE, Roche, NS Pharma, Reveragen, and Sarepta outside the submitted work. All reimbursements received by the LUMC. No personal financial benefits were received. Go to Neurology.org/N for full disclosures.
References
- 1.Bushby KM, Gardner-Medwin D. The clinical, genetic and dystrophin characteristics of Becker muscular dystrophy: I: natural history. J Neurol. 1993;240(2):98-104. [DOI] [PubMed] [Google Scholar]
- 2.Comi GP, Prelle A, Bresolin N, et al. . Clinical variability in Becker muscular dystrophy: genetic, biochemical and immunohistochemical correlates. Brain. 1994;117(pt 1):1-14. [DOI] [PubMed] [Google Scholar]
- 3.Burakiewicz J, Sinclair CDJ, Fischer D, Walter GA, Kan HE, Hollingsworth KG. Quantifying fat replacement of muscle by quantitative MRI in muscular dystrophy. J Neurol. 2017;264(10):2053-2067. [DOI] [PMC free article] [PubMed] [Google Scholar]
- 4.Straub V, Balabanov P, Bushby K, et al. . Stakeholder cooperation to overcome challenges in orphan medicine development: the example of Duchenne muscular dystrophy. Lancet Neurol. 2016;15(8):882-890. [DOI] [PubMed] [Google Scholar]
- 5.Willcocks RJ, Rooney WD, Triplett WT, et al. . Multicenter prospective longitudinal study of magnetic resonance biomarkers in a large Duchenne muscular dystrophy cohort. Ann Neurol. 2016;79(4):535-547. [DOI] [PMC free article] [PubMed] [Google Scholar]
- 6.Fischmann A, Hafner P, Fasler S, et al. . Quantitative MRI can detect subclinical disease progression in muscular dystrophy. J Neurol. 2012;259(8):1648-1654. [DOI] [PubMed] [Google Scholar]
- 7.Barnard AM, Willcocks RJ, Triplett WT, et al. . MR biomarkers predict clinical function in Duchenne muscular dystrophy. Neurology. 2020;94(9):e897-e909. [DOI] [PMC free article] [PubMed] [Google Scholar]
- 8.Naarding KJ, Reyngoudt H, van Zwet EW, et al. . MRI vastus lateralis fat fraction predicts loss of ambulation in Duchenne muscular dystrophy. Neurology. 2020;94(13):e1386-e1394. [DOI] [PMC free article] [PubMed] [Google Scholar]
- 9.Nagy S, Schadelin S, Hafner P, et al. . Longitudinal reliability of outcome measures in patients with Duchenne muscular dystrophy. Muscle Nerve. 2020;61(1):63-68. [DOI] [PubMed] [Google Scholar]
- 10.Bonati U, Hafner P, Schadelin S, et al. . Quantitative muscle MRI: a powerful surrogate outcome measure in Duchenne muscular dystrophy. Neuromuscul Disord. 2015;25(9):679-685. [DOI] [PubMed] [Google Scholar]
- 11.Morrow JM, Sinclair CD, Fischmann A, et al. . MRI biomarker assessment of neuromuscular disease progression: a prospective observational cohort study. Lancet Neurol. 2016;15(1):65-77. [DOI] [PMC free article] [PubMed] [Google Scholar]
- 12.Murphy AP, Morrow J, Dahlqvist JR, et al. . Natural history of limb girdle muscular dystrophy R9 over 6 years: searching for trial endpoints. Ann Clin Transl Neurol. 2019;6(6):1033-1045. [DOI] [PMC free article] [PubMed] [Google Scholar]
- 13.Gidaro T, Reyngoudt H, Le Louer J, et al. . Quantitative nuclear magnetic resonance imaging detects subclinical changes over 1 year in skeletal muscle of GNE myopathy. J Neurol. 2020;267(1):228-238. [DOI] [PubMed] [Google Scholar]
- 14.Sheikh AM, Rudolf K, Witting N, Vissing J. Quantitative muscle MRI as outcome measure in patients with Becker muscular dystrophy: a 1-year follow-up study. Front Neurol. 2020;11:613489. [DOI] [PMC free article] [PubMed] [Google Scholar]
- 15.Fischer D, Hafner P, Rubino D, et al. . The 6-minute walk test, motor function measure and quantitative thigh muscle MRI in Becker muscular dystrophy: a cross-sectional study. Neuromuscul Disord. 2016;26(7):414-422. [DOI] [PubMed] [Google Scholar]
- 16.Barp A, Bello L, Caumo L, et al. . Muscle MRI and functional outcome measures in Becker muscular dystrophy. Sci Rep. 2017;7(1):16060. [DOI] [PMC free article] [PubMed] [Google Scholar]
- 17.Maggi L, Moscatelli M, Frangiamore R, et al. . Quantitative muscle MRI protocol as possible biomarker in Becker muscular dystrophy. Clin Neuroradiol. 2021;31(1):257-266. [DOI] [PubMed] [Google Scholar]
- 18.Tasca G, Iannaccone E, Monforte M, et al. . Muscle MRI in Becker muscular dystrophy. Neuromuscul Disord. 2012;22(suppl 2):S100-S106. [DOI] [PubMed] [Google Scholar]
- 19.van den Bergen JC, Ginjaar HB, van Essen AJ, et al. . Forty-five years of Duchenne muscular dystrophy in the Netherlands. J Neuromuscul Dis. 2014;1(1):99-109. [PubMed] [Google Scholar]
- 20.McDonald CM, Henricson EK, Han JJ, et al. . The 6-minute walk test as a new outcome measure in Duchenne muscular dystrophy. Muscle Nerve. 2010;41(4):500-510. [DOI] [PubMed] [Google Scholar]
- 21.Mazzone E, Martinelli D, Berardinelli A, et al. . North Star Ambulatory Assessment, 6-minute walk test and timed items in ambulant boys with Duchenne muscular dystrophy. Neuromuscul Disord. 2010;20(11):712-716. [DOI] [PubMed] [Google Scholar]
- 22.Wokke BH, van den Bergen JC, Versluis MJ, et al. . Quantitative MRI and strength measurements in the assessment of muscle quality in Duchenne muscular dystrophy. Neuromuscul Disord. 2014;24(5):409-416. [DOI] [PubMed] [Google Scholar]
- 23.Hooijmans MT, Froeling M, Koeks Z, et al. . Multi-parametric MR in Becker muscular dystrophy patients. NMR Biomed. 2020:e4385. [DOI] [PMC free article] [PubMed] [Google Scholar]
- 24.Akima H, Lott D, Senesac C, et al. . Relationships of thigh muscle contractile and non-contractile tissue with function, strength, and age in boys with Duchenne muscular dystrophy. Neuromuscul Disord. 2012;22(1):16-25. [DOI] [PMC free article] [PubMed] [Google Scholar]
- 25.Cohen J. Statistical Power Analysis for the Behavioral Sciences. Erlbaum Associates; 1988. [Google Scholar]
- 26.The Natural History Study of Becker Muscular Dystrophy [NL50171.50058.50114]. toetsingonline.nl/to/ccmo_search.nsf/fABRpop?readform&unids=98B27357A2A7F7F7C12585A500153A22 [Google Scholar]
- 27.Willis TA, Hollingsworth KG, Coombs A, et al. . Quantitative muscle MRI as an assessment tool for monitoring disease progression in LGMD2I: a multicentre longitudinal study. PLoS One. 2013;8(8):e70993. [DOI] [PMC free article] [PubMed] [Google Scholar]
- 28.Andersen G, Dahlqvist JR, Vissing CR, Heje K, Thomsen C, Vissing J. MRI as outcome measure in facioscapulohumeral muscular dystrophy: 1-year follow-up of 45 patients. J Neurol. 2017;264(3):438-447. [DOI] [PubMed] [Google Scholar]
- 29.Nunez-Peralta C, Alonso-Perez J, Llauger J, et al. . Follow-up of late-onset Pompe disease patients with muscle magnetic resonance imaging reveals increase in fat replacement in skeletal muscles. J Cachexia Sarcopenia Muscle. 2020;11(4):1032-1046. [DOI] [PMC free article] [PubMed] [Google Scholar]
- 30.Heskamp L, van Nimwegen M, Ploegmakers MJ, et al. . Lower extremity muscle pathology in myotonic dystrophy type 1 assessed by quantitative MRI. Neurology. 2019;92(24):e2803-e2814. [DOI] [PMC free article] [PubMed] [Google Scholar]
- 31.Mul K, Vincenten SCC, Voermans NC, et al. . Adding quantitative muscle MRI to the FSHD clinical trial toolbox. Neurology. 2017;89(20):2057-2065. [DOI] [PMC free article] [PubMed] [Google Scholar]
- 32.Reyngoudt H, Marty B, Boisserie JM, et al. . Global versus individual muscle segmentation to assess quantitative MRI-based fat fraction changes in neuromuscular diseases. Eur Radiol. Epub 2020 Nov 21. [DOI] [PubMed] [Google Scholar]
- 33.Hooijmans MT, Niks EH, Burakiewicz J, et al. . Non-uniform muscle fat replacement along the proximodistal axis in Duchenne muscular dystrophy. Neuromuscul Disord. 2017;27(5):458-464. [DOI] [PubMed] [Google Scholar]
- 34.Chrzanowski SM, Baligand C, Willcocks RJ, et al. . Multi-slice MRI reveals heterogeneity in disease distribution along the length of muscle in Duchenne muscular dystrophy. Acta Myol. 2017;36(3):151-162. [PMC free article] [PubMed] [Google Scholar]
- 35.Janssen BH, Voet NB, Nabuurs CI, et al. . Distinct disease phases in muscles of facioscapulohumeral dystrophy patients identified by MR detected fat infiltration. PLoS One. 2014;9(1):e85416. [DOI] [PMC free article] [PubMed] [Google Scholar]
- 36.Schlaffke L, Rehmann R, Rohm M, et al. . Multi-center evaluation of stability and reproducibility of quantitative MRI measures in healthy calf muscles. NMR Biomed. 2019;32(9):e4119. [DOI] [PubMed] [Google Scholar]
- 37.Forbes SC, Walter GA, Rooney WD, et al. . Skeletal muscles of ambulant children with Duchenne muscular dystrophy: validation of multicenter study of evaluation with MR imaging and MR spectroscopy. Radiology. 2013;269(1):198-207. [DOI] [PMC free article] [PubMed] [Google Scholar]
- 38.Hu HH, Yokoo T, Bashir MR, et al. . Linearity and bias of proton density fat fraction as a quantitative imaging biomarker: a multicenter, multiplatform, multivendor phantom study. Radiology. 2021;298(3):640-651. [DOI] [PMC free article] [PubMed] [Google Scholar]
- 39.Kugathasan U, Evans MRB, Morrow JM, et al. . Development of MRC Centre MRI calf muscle fat fraction protocol as a sensitive outcome measure in hereditary sensory neuropathy type 1. J Neurol Neurosurg Psychiatry. 2019;90(8):895-906. [DOI] [PubMed] [Google Scholar]
- 40.Willcocks RJ, Arpan IA, Forbes SC, et al. . Longitudinal measurements of MRI-T2 in boys with Duchenne muscular dystrophy: effects of age and disease progression. Neuromuscul Disord. 2014;24(5):393-401. [DOI] [PMC free article] [PubMed] [Google Scholar]
- 41.Hooijmans MT, Niks EH, Burakiewicz J, Verschuuren JJ, Webb AG, Kan HE. Elevated phosphodiester and T2 levels can be measured in the absence of fat infiltration in Duchenne muscular dystrophy patients. NMR Biomed. 2017;30(1). [DOI] [PubMed] [Google Scholar]
Associated Data
This section collects any data citations, data availability statements, or supplementary materials included in this article.
Data Availability Statement
Anonymized data can be made available to qualified investigators on request.


