

1. PLAIN LANGUAGE SUMMARY
Adaptive teaching and individualization for K‐12 students improve academic achievement
1.1. The review in brief
Teaching methods that individualize and adapt instructional conditions to K‐12 learners’ needs, abilities, and interests help improve learning achievement. The most important variables are the teacher's role in the classroom as a guide and mentor and the adaptability of learning activities and materials.
What is the aim of this review?
This Campbell systematic review assesses the overall impact on student achievement of processes and methods that are more student‐centered versus less student‐centered. It also considers the strength of student‐centered practices in four teaching domains.
Flexibility: Degree to which students can contribute to course design, selecting study materials, and stating learning objectives.
Pacing of instruction: Students can decide how fast to progress through course content and whether this progression is linear or iterative.
Teacher's role: Ranging from authority figure and sole source of information, to teacher as equal partner in the learning process.
Adaptability: Degrees of manipulating learning environments, materials, and activities to make them more student‐centered.
1.2. What is this review about?
Teaching in K‐12 classrooms involves many decisions about the appropriateness of methods and materials that both provide content and encourage learning.
This review assesses the overall impact on student achievement of processes and methods that are more student‐centered versus less student‐centered (and thus more teacher‐centered, i.e., more under the direct control of a teacher). It also considers in which instructional dimensions the application of more of these student‐centered practices is most appropriate, and the strength of student‐centered practices in each of four teaching domains.
1.3. What is this review about?
1.3.1. What studies are included?
This review presents evidence from 299 studies (covering 43,175 students in a formal school setting) yielding 365 estimates of the impact of teaching practices. The studies spanned the period 2000–2017 and were mostly carried out in the United States, Europe, and Australia.
What is the overall average effect of more versus less student‐centered instruction on achievement outcomes? Which demographic variables moderate the overall results?
More student‐centered instructional conditions have a moderate positive effect on student achievement compared to less student‐centered.
Which dimensions of instruction are most important in promoting better achievement through the application of more versus less student‐centered instruction? Do these dimensions interact?
The teacher's role has a significantly positive impact on student achievement; more student‐centered instruction produces better achievement. Pacing of instruction/learning—where learners have more choice over setting the pace and content navigation of learning activities—has a significant effect in the opposite direction; i.e., a significantly negative relationship. There is no relationship between adaptability and flexibility and student achievement.
There are interactive effects. The teacher's role combined with adaptability produces stronger effects, whereas flexibility (greater involvement of students in course design and selection of learning materials and objectives) has the opposite effect; it reduces the effectiveness of teacher's role on learning outcomes.
Special education students perform significantly better in achievement compared to the general population.
Three other factors—grade level; Science, technology, engineering, and mathematics (STEM) versus non‐STEM subjects; individual subjects—do not have any effect on the impact of the intervention.
1.4. What do the findings of this review mean?
This review confirms previous research on the effectiveness of student‐centered and active learning. It goes further in suggesting the teacher's role promotes effective student‐centered learning, and excessive student control over pacing appears to inhibit it.
An important element of these findings relates to the significant combination of teacher's role and adaptability, in that it suggests the domain in which the teacher's role should focus.
Since adaptability relates to increasing the involvement of students in more student‐centered activities, the evidence suggests that instruction that involves activity‐based learning, either individually or in groups, increases learning beyond the overall effect found for more student‐centered versus less student‐centered activities.
Various student‐centered approaches, such as cooperative learning and peer‐tutoring, have been found to accomplish this goal.
1.5. How up‐to‐date is this review?
This meta‐analysis contains studies that date from 2000–2017.
2. EXECUTIVE SUMMARY/ABSTRACT
2.1. Background
The question of how to best deliver instruction to k‐12 students has dominated the educational conversation, both in terms of theory and practice, since before 1960. Two predominant models have clashed: (a) Traditional teacher‐directed instruction (referred to here as teacher‐centered Teacher‐Centered instruction), where there is little methodological adaptation for individual differences in ability, skills, interests, etc. among students; and (b) so‐called student‐centered instruction (referred to here as Student‐Centered instruction), deriving much of its theoretical justification and methodological intricacies from constructivist thought embodied in the works of Jean Piaget, Lev Vygotsky, Jerome Burner, and many others. While radical constructivism has never become dominant in k‐12 schooling (except in a relatively small number of demonstration schools), there has been considerable interest in embedding some of the principles of constructivism into k‐12 schooling. This is often referred to as individualized or adaptive instruction, meaning an operational concern for individual students, their abilities, interests, etc., which is nearly the opposite of Teacher‐Centered instruction. A great deal of research has demonstrated that approaches to individualism, such as mastery learning, collaborative and cooperative learning, problem‐based learning, peer tutoring, and computer‐based instruction, are effective in promoting achievement and attitudinal gains, as contrasted with Teacher‐Centered instruction, where mastery of content or subject matter is of the greatest concern, and the teacher is the “delivery mechanism.” More recently, this has been extended to include video‐based lectures often delivered through the internet, as proposed by proponents of blended learning and its variant the flipped classroom (e.g., Baepler, Walker, and Driessen (2014). Research has also demonstrated that Teacher‐Centered instruction is particularly useful in developing basic skills in areas such as reading, spelling, and math (Stockard, Wood, Coughlin, & Khoury, 2018).
More recent theory and practice concerning Teacher‐Centered (more conventional) and Student‐Centered (more adaptive and individualized) instruction suggest that neither perspective is entirely sufficient and that some combination of Teacher‐Centered and Student‐Centered instruction is possibly more productive. This notion of combined teaching methods (i.e., Teacher‐Centered plus Student‐Centered) is one of the defining characteristics of the flipped classroom (Baepler et al., 2014). Certainly, students need to acquire skills and knowledge, but they also need to develop their own personal preferences, creativity, problem‐solving abilities, and evaluative and self‐evaluative perspectives. The current meta‐analysis aims to determine if the advantage endowed by Student‐Centered instruction also affects content achievement (i.e., content achievement is the outcome measure in this meta‐analysis).
The current meta‐analysis was designed to explore teaching and learning in k‐12 classrooms and the achievement benefit that derives from more Student‐Centered versus less Student‐Centered classrooms. Several perspectives informed the basis for the research approach described here, but none more so than the words of Gersten et al. (2008) while exploring through meta‐analysis the question of Teacher‐Centered versus Student‐Centered instructional practices in elementary mathematics instruction. In the final report of their study, the group stated: “The Task Group found no examples of studies in which learners were teaching themselves or each other without any teacher guidance; nor did the Task Group find studies in which teachers conveyed … content directly to learners without any attention to their understanding or response. The fact that these terms, in practice, are neither clearly nor uniformly defined, nor are they true opposites, complicates the challenge of providing a review and synthesis of the literature …” (p. 12). The current meta‐analysis intends to investigate variations of more versus less Student‐Centered instruction and the four domains of the instructional process in which they are more or less profitable.
2.2. Objectives (research questions)
There are three primary objectives that this meta‐analysis intends to address (research questions that this study explores):
Overall, does more Student‐Centered instructional practices lead to a significant advantage in the acquisition of content (subject matter) knowledge (i.e., measured learning achievement)?
Do any of the four primary (substantive) moderator variables (entered into multiple meta‐regression), Teacher's Role, Pacing, Adaptability, and Flexibility, predict an increase or decrease in achievement across degrees of Student‐Centered use (From less Student‐Centered to more Student‐Centered)?
Is there a difference in categorical levels of less Student‐Centered to more Student‐Centered for each of the dimensions of instructional practice listed above, tested in mixed moderator variable analysis?
Do any of the secondary (demographic) moderator variables interact with each other (i.e., combine) to produce more versus less Student‐Centered instructional practices?
2.3. Search methods
Following the guidelines of the Campbell Collaboration (Kugley et al., 2017), in order to retrieve a broad base of studies to review, we started by having an experienced Information Specialist search across an array of bibliographic databases, both in the subject area and in related disciplines. The following databases were searched for relevant publications: ABI/Inform Global (ProQuest), Academic Search Complete (EBSCO), ERIC (EBSCO), PsycINFO (EBSCO), CBCA Education (ProQuest), Education Source (EBSCO), Web of Knowledge, Engineering Village, Francis, ProQuest Dissertations & Theses Global, ProQuest Education Database, Linguistics and Language Behavior Abstracts (ProQuest).
The search strategy was tailored to the features of each database, making use of database‐specific controlled vocabulary and search filters, but based on the same core key terms. Searches were limited to the year 2000–2017 and targeted a k‐12 population.
Database searching was supplemented by using the Google search engine to locate additional articles, but principally grey literature (research reports, conference papers, theses, and research published outside conventional journals).
2.4. Selection criteria
The overall set of inclusion/exclusion criteria (i.e., selection) for the meta‐analysis contained the following requirements:
Be publicly available and encompass studies from 2000 to the present;
Feature at least two groups of different instructional strategies/practices that can be compared according to the research question as Student‐Centered and Teacher‐Centered instruction;
Include course content and outcome measures that are compatible with the groups that form these comparisons;
Contain sufficient descriptions of major instructional events in both instructional conditions;
Satisfy the requirements of either experimental or high‐quality quasi‐experimental design;
Be conducted in formal k‐12 educational settings eventually leading to a certificate, diploma, degree, or promotion to a higher grade level;
Contain legitimate measures of academic achievement (i.e., teacher/researcher‐made, standardized); and
Contain sufficient statistical information for effect size extraction.
2.5. Data collection and analysis
2.5.1. Effect size extraction and calculation
One of the selection criteria was “Contain sufficient statistical information for effect size extraction,” so that an effect size could be calculated for each independent comparison. This information could take several forms (in all cases sample size data were required):
Means and standard deviations for each treatment and control group;
Exact t value, F value, with an indication of the ± direction of the effect;
Exact p value (e.g., p = .011), with an indication of the ± direction of the effect;
Effect sizes converted from correlations or log odds ratios;
Estimates of the mean difference (e.g., adjusted means, regression β weight, gain score means when r is unknown)
Estimates of the pooled standard deviation (e.g., gain score standard deviation, one‐way ANOVA with three or more groups, ANCOVA);
Estimates based on a probability of a significant t test using α (e.g., p < .05); and
Approximations based on dichotomous data (e.g., percentages of students who succeeded or failed the course requirements).
Effect sizes were initially calculated as Cohen's d (Cohen, 1988) and then converted to Hedges'g (i.e., correction for small samples; Hedges & Olkin, 1985). Standard errors (SE d ) were calculated for d and then converted to standard errors of SE g applying the correction formula for g. Hedges’ g, SE g , and sample sizes (i.e., treatment and control) were entered into Comprehensive Meta‐Analysis 3.3.07 (Borenstein, Hedges, Higgins, & Rothstein, 2014) where statistical analyses were performed.
The effect sizes were coded for precision and these data were analyzed in moderator variable analysis.
2.5.2. Statistical analyses
Analyses were conducted using the following statistical tests:
Overall weighted random effects analysis with the statistics of , SE g , V g, upper and lower limits of the 95th confidence interval, z g , and p value;
Homogeneity is estimated using Q‐Total, df, and p value. I 2 (i.e., percentage of error variation) and tau2 (i.e., average heterogeneity) is also calculated and reported.
Meta‐regression (single and multiple) is used to determine the relationship between covariates and effect sizes; and
Mixed‐model (i.e., random and fixed) moderator variable analysis is used to compare levels (categories) of each coded moderator variable. Q‐Between, df, and p value are used to make decisions about the significance of each categorical variable.
2.6. Results
The results are presented here in relationship to the four research questions previously described.
Question 1: Overall, does more Student‐Centered instructional practices lead to a significant advantage in the acquisition of content (subject matter) achievement (i.e., measured learning).
Result: Answering the basic question, more Student‐Centered instructional conditions (i.e., the treatment described above) outperform less Student‐Centered to a moderate extent. The average effect, = 0.44, k = 365, z = 4.56, p < .00, SE = 0.03, Q = 3,095.89, I 2 = 88.22, tau 2 = 0.27, between the mean of the more Student‐Centered treatment and the less Student‐Centered control, suggesting that teachers who promote and enact active classroom processes (more Student‐Centered instruction), can expect to see better student achievement than in classrooms where teachers employ less Student‐Centered instruction. Also, a linear trend was found in meta‐regression when Hedges’ was regressed on degree of Student‐Centered instruction (β = 0.04, SE = 0.02, z = 2.41, p = .032). The distribution remains significantly heterogeneous.
Question 2: Do any of the four moderator variables (entered into multiple meta‐regression), Teacher's Role, Pacing, Adaptability, and Flexibility, predict an increase or decrease in achievement across degrees of Student‐Centered use (From less Student‐Centered to more Student‐Centered)?
Result: In meta‐regression, Teacher's role produces a significant linear trend (β = 0.06, SE = 0.04, z = 4.42, p < .001) and Pacing (β = −0.14, SE = 0.04, z = 3.18, p = .002). Adaptability, and Flexibility are not significant (p > .05). However, the trend for Teacher's role and Pacing is opposite (note the opposite signs on β). Teacher's role is significantly positive (i.e., more Student‐Centered instruction produced higher achievement), while Pacing produces the reverse (i.e., a significantly negative trend). For Pacing, more Student‐Centered methods produce lower achievement.
Question 3: Do any of the moderator variables interact with each other (i.e., combine) to produce more versus less Student‐Centered instructional practices?
Result: Yes, Teacher's Role compared to two dimensions added to the Teacher's Role produce significantly different results (Q‐Between = 7.76, df = 3, p = .02: Teacher's Role and Teacher's Role plus Adaptability significantly outperformed Teacher's Role plus Flexibility.
Question 4: Is there a difference in categorical levels of less Student‐Centered to more Student‐Centered for each of the dimensions of instructional practice listed above, tested in mixed moderator variable analysis?
Result: Only one of five moderator variables produced a significant differentiation among levels. Among four moderator variables (i.e., grade level; STEM versus Non‐STEM subjects; individual subjects; and ability profile) only ability profile significantly differentiated among levels. Special education students demonstrated significantly higher achievement compared to the General population of students.
2.7. Authors’ conclusions
This meta‐analysis provides strong evidence that Student‐Centered instruction leads to improvements in learning with k‐12 students. Not only is the overall random effects average effect size of medium strength ( = 0.44), but there is also a demonstrated (subtle but significant) linear relationship between more Student‐Centered classroom instruction and effect size (p = .03). Taken together, these results support the efficacy of allowing students to engage in active learning or other forms of Student‐Centered enterprise as part of a comprehensive educational experience.
3. BACKGROUND
3.1. Adaptive teaching and individualization for k‐12 students improve academic achievement: A meta‐analysis of classroom studies
The question of how to provide the best‐quality instructional conditions for students of all grade levels has been scrutinized extensively since the early 1960s, principally from two major perspectives: Teacher‐centeredness (Teacher‐Centered) and student‐centeredness (Student‐Centered). Student‐Centered education initially arose from the writings of early progressive educators like John Dewey, and was carried on subsequently, in various forms, by Jean Piaget, Lev Vigotsky, Jerome Bruner, and Carl Rogers, to name only a few. The ideas were radical when first introduced, but the notion of Student‐Centered education resonated in educational circles, where lecturing and rote memorization was still the standard for quality education and led to vast amounts of theorizing and research to show that students could succeed in learning of all sorts without a strongly transmissive approach on the part of the teacher. Today, the terms individualized instruction and adaptive teaching have become a popular expression for current practice and are used nearly synonymously with Student‐Centered learning.
However, since their inception, Student‐Centered practices have inspired resistance, both from the public and from educational theorists. Thus, after Student‐Centered practices were widely introduced, a dichotomy arose in the literature, with one side promoting the continuation of Teacher‐Centered learning and on the other side the adopting Student‐Centered learning practices. This was argued as a dichotomy for many years. However, the arguments have abated somewhat now with the general recognition that there is value in both approaches. Generally speaking, educators no longer aspire to a pure implementation of either approach, but now discuss questions of which method, when, and for what purpose is best.
3.1.1. Individualized learning and adaptive student‐centered education (Student‐Centered)
Conceptual understanding of individualized learning and adaptive teaching varies broadly, encompassing a multitude of instructional strategies, approaches, and activities. It stretches from accounts of specific systems of instruction such as mastery learning (Bloom, 1968) and scaffolded adaptive feedback in computer‐based instruction (e.g., Azevedo & Bernard, 1995) to more general conceptions of active learning and individualization that involve approaches such as cooperative learning (e.g., Johnson & Johnson, 2002; Johnson, Johnson, & Maruyama, 1983), collaborative learning (e.g., Bernard, Rojo de Rubalcava, & St‐Pierre, 2000), problem‐based learning (e.g., Zhang et al., 2015), and project‐based learning (e.g., Bernard & Lundgren‐Cayrol, 2001). It also includes educational concepts, largely derived from elements of constructivism, such as discovery learning, inquiry‐based learning, activity‐based learning, experiential learning, and other forms of Student‐Centered education (Tobias & Duffy, 2009).
Notions of unguided Student‐Centered learners have not been free from detractors. Dewey criticized this approach in Experience and Education (Dewey, 1938), and, more recently, Kirschner, Sweller, and Clark (2006) published an influential piece that argued that the practice of turning kids loose to learn defies many of the tenets of the psychological principles of working memory and that guided instruction is both more efficient and ultimately more profitable to long‐term learning outcomes. A flurry of responses and rejoinders ensued with no clear resolution, but the educational community was left with the strong impression that a teacher's role in Student‐Centered learning was better as a guide on the side rather than a silent witness (King, 1993).
The learning sciences have further contributed to the distinction between social constructivism and individual constructivism providing a theoretical grounding for teacher versus learner‐based strategies (Kolodner, 2004). Current and developing applications, informed by pedagogical principles espoused by case‐based learning (e.g., Kolodner et al., 2003).
Research on more individualized and adaptive education
The earliest large‐scale research project, aimed at exploring the efficacy of so‐called progressive education, was conducted between 1933 and 1941 by the Progressive Education Association (funded by the General Education Board and other foundations). Twenty‐nine model schools were selected for curricular experimentation with the security that over 200 colleges and universities would accept their students upon recommendation by their principals. Changes in these schools included more individualized instruction and more access to alternative and cross‐disciplinary programs, which emphasized greater access to arts and extracurricular programs.
Results indicated that students graduating from the 200 schools scored on par in basic courses (e.g., mathematics and science) with students from traditionally oriented schools and that there was more activity in artistic, political, and social engagement in students from the alternative experimental schools. The long‐term impact of these experiments is generally described as influence on its participants and subsequent reformers rather than dramatic change. The intervening conservatism brought about by World War II and the ensuing Cold War are often cited as deterrents to widespread change in the overall educational system in the United States (Aiken, 1942).
Examples of further attempts to make teaching and learning more individualized and adaptive can be found in both the early and current research literature. They include, but are not limited to, mastery learning (e.g., Bloom, 1968), Personalized System of Instruction (PSI; e.g., Keller, 1968), assorted forms of peer instruction (e.g., Mazur, 1997), various practices of reciprocal reading/writing activities (e.g., Huang & Yang, 2015), collaborative and cooperative learning, problem and project‐based learning and, more recently, Intelligent Tutoring Systems (ITS; e.g., Huang & Shiu, 2012). Several of these approaches are summarized in the following paragraphs and a number of the most common group‐based Student‐Centered approaches are depicted in a Venn Diagram (Figure 2) that shows their inter‐relationship and approximate overlap (Bishop & Verleger, 2013, p. 6).
Figure 2.
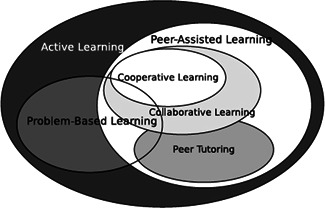
Venn diagram of the overlap among methods of active learning (Student‐Centered; Bishop & Verleger, 2013, p. 6)
The benefits and limitations of so‐called systems of instruction (i.e., mastery learning, PSI, and ISI) are summarized separately in both qualitative and quantitative reviews. In the late 1970s and early 1980s, several relevant meta‐analyses were published on mastery learning and its variant PSI. First, Lysakowski and Walberg (1982), Guskey and Gates (1986), Guskey and Pigott (1988), Slavin (1987), and Kulik, Kulik, and Bangert‐Drowns (1990) each performed successive meta‐analyses (Slavin's was the best evidence synthesis) on the efficacy of mastery learning. The studies produced equivocal and highly debatable findings. Kulik, Kulik, and Cohen (1979) reviewed 75 individual comparative studies of Keller's Personalized System of Instruction (PSI is a spin‐off of mastery learning) college teaching method. In comparison to conventional instruction, the PSI approach was demonstrated to have a positive effect on student achievement and course perception (mean effect size of nearly 0.70sd for both).
Bangert and Kulik (1982) looked at the effectiveness of the Individualized Systems of Instruction (ISI, a spin‐off of PSI) in secondary school students. They broadened the list of outcomes to account not only for student achievement (e.g., final exams), but also critical thinking, attitudes toward subject matter, and student self‐concept. For all outcome types, the findings were inconclusive. For example, for the achievement data, only 8 out of 49 studies demonstrated statistically significant results in favor of ISI (four studies favored more conventional teaching methods and the rest were inconclusive). Finally, Kulik (1984) attempted a wider research synthesis (encompassing over 500 individual studies) of the effectiveness of programmed instruction and ISI, paying special attention to the moderator variables of study dates and grade levels. The most promising findings indicated that more recent studies showed higher effects than the earlier ones and that college‐level students benefited significantly from using ISI compared with elementary and secondary school students. In summary, as stated earlier, these meta‐analyses produced inconclusive results. Moreover, they are rather outdated and practically none of the above‐mentioned instructional methods exists now in their original forms (e.g., Eyre, 2007 was able to identify fewer than 50 studies of PSI for the period between 1990 and 2006 in the PsycInfo database).
Much of the preceding discussion has been about systems of individualized instruction, designed and intended as self‐contained approaches to individualizing student learning. Because of their rule‐based nature, they may be thought to be individualized, but insufficiently adaptive (systems often are not very adaptive).
Several meta‐analyses addressed the topic of individualized and adaptive instruction (i.e., instructional approaches that can be applied as local circumstances dictate), though in very specific narrowly focused forms. Aiello and Wolfle (1980) summarized research on individualized instruction in science education compared with traditional lectures and found that individualized instruction was more effective. Horak's (1981) meta‐analysis of self‐paced modular instruction of elementary and secondary school math (1981) produced a wide variety of both positive and negative effect sizes. A highly cited meta‐analysis of active learning in science, engineering, and mathematics subject matters (Freeman et al., 2014) found a moderate effect size ( = 0.47) based on 158 studies. The authors also state that “The results raise questions about the continued use of traditional lecturing as a control in research studies, and support active learning as the preferred, empirically validated teaching practice in regular classrooms” (p. 8410). This sentiment appears to add support to the comparative approach that is employed in the current meta‐analysis.
Kraft, Blazar, and Hogan (2018) examined the effects of teacher coaching (i.e., tutoring) on student achievement and found minor effect on achievement ( = 0.08). Though these instructional approaches are not “adaptive,” per se, at least peer tutoring opens the educational process to much greater involvement of students, and thus accounts more for their individual inputs in learning. The effect size tended to be relatively small in middle school students, but higher at elementary and high school levels.
There have been numerous reviews and meta‐analyses of various forms of computer‐assisted instruction (CBI). Ma, Adesope, Nesbit, and Liu (2014) meta‐analyzed studies of ITS in a variety of subject matters, from reading and math to law and medical education. More specific reviews have been conducted on the effectiveness of feedback and scaffolding in CBI and ITS. The list of moderator variables included the type of both experimental and comparison treatments, as well as outcome type, student academic level, study discipline, etc. The highest achievement effects of using ITS were found in comparison with non‐ITS computer‐based instruction ( = 0.57) and teacher‐centered, large‐group instruction ( = 0.42), whereas in comparison with human tutoring it was even negative ( = −0.11), though not statistically significant. ITS‐based practices were similarly effective when used either alone or in combination with various forms of teacher‐led instruction in many subject domains. In particular, certain specific aspects of instruction like feedback and scaffolding in CBI and ITS systems have come under scrutiny. Azevedo & Bernard (1995) examined studies testing the effectiveness of computer‐provided feedback against no feedback, and Belland, Walker, Olsen, and Leary (2015) synthesized studies investigating feedback in computer‐based scaffolding. In both cases, the average effect size was around = 0.50 in favor of feedback conditions. Overall, the research literature paints a positive picture of Student‐Centered learning.
3.1.2. Less individualized and less adaptive teacher‐centered education (Teacher‐Centered)
There has been considerable research in Teacher‐Centered education as well over the years. In the 1960s, during the Lyndon Johnson administration in the United States, a massive experiment called Project Follow Through was initiated to test the efficacy of a range of instructional strategies. The intent was to evaluate the relative advantages of models of instruction that ranged from Direct Instruction (i.e., DISTAR) to so‐called Open Education (i.e., based on the British Infant School Model). After years of testing and millions of dollars spent, only one really striking finding emerged: That direct instruction advantaged learners in terms of both measures of achievement and affect, outperforming other models by as much as 1.5 SD (standard deviation). While a great deal of controversy surrounds the conduct and findings of this large‐scale educational trial, its results set a tone of teacher‐centeredness that is still influential (Magliaro, Lockee, & Burton, 2005).
The most recent addition to the direct instruction literature comes from Stockard et al. (2018). The report, published in Review of Educational Research, entitled “The Effectiveness of Direct Instruction Curricula: A Meta‐Analysis of a Half‐Century of Research,” synthesized 328 studies involving 413 study designs and almost 4,000 effect sizes. Effect sizes, calculated between the Direct Instruction group and a comparison group (not specifically described), were reported for Reading ( = 0.51), math ( = 0.55), language ( = 0.54), and spelling ( = 0.66), interpreted as medium effect sizes by Cohen's (1988) criteria. This report suggests that teaching basic skills and competencies through a Direct Instruction curriculum is at least as effective as the best forms of individualized and adaptive instructional systems and approaches. This quote from the Stockard et al. report summarizes their view as to the distinction between Teacher‐Centered and Student‐Centered instruction:
Direct Instruction builds on the assumption that all students can learn with well‐designed instruction. When a student does not learn, it does not mean that something is wrong with the student but, instead, that something is wrong with the instruction. Thus, the theory underlying DI lies in opposition to developmental approaches, constructivism, and theories of learning styles, which assume that students’ ability to learn depends on their developmental stage, their ability to construct or derive understandings, or their own unique approach to learning. Instead, DI assumes all students can learn new material when (a) they have mastered prerequisite knowledge and skills and (b) the instruction is unambiguous. (p. 480)
This quotation acknowledges that there is a marked distinction between Teacher‐Centered and Student‐Centered learning. Our premise is that the answer to the question regarding Teacher‐Centered and Student‐Centered classrooms is not either/or but a spectrum of practices that usually avoids either extreme. The central question posed in this systematic review is the location of the sweet spot on the Teacher‐Centered/Student‐Centered spectrum. Where and when should the teacher maintain control of the sort described by Stockard et al. (2018) and where and when can students take more ownership of their own leaning processes?
3.1.3. Comparing teacher‐centered and student‐centered instructional practices
A large‐scale examination (Hattie, 2008) of variables relating to various influences on educational outcomes of both Teacher‐Centered and Student‐Centered offers an opportunity to examine instructional practices side‐by‐side (See Table 1). Second‐order meta‐analyses relating to the teacher, the school, the curriculum, the home, etc. found average effect sizes for a number of instructional approaches that are shown in Table 1. Some of these approaches are clearly teacher‐centered, while some are more learner‐centered, and some have elements of both (or can be either depending on their application). Judging from these results, it is difficult to establish a clear pattern; Student‐Centered, Teacher‐Centered and both/either can be highly effective or not so effective. Clearly, a more in‐depth analysis is called for (Table 2).
Table 1.
Results of second‐order meta‐analyses of selected educational practices (ordered by average effect size)
| Instructional/pedagogical approach | Activity category (Teacher‐Centered, Student‐Centered or both/either) | Average effect size |
|---|---|---|
| Reciprocal teaching | Both/either | +0.74 |
| Feedback to students | Both/either | +0.73 |
| Problem‐solving teaching | Both/either | +0.61 |
| Cooperative versus individualistic learning | Both/either | +0.59 |
| Direct instruction | Teacher‐centered | +0.59 |
| Peer tutoring | Learner‐centered | +0.55 |
| Cooperative versus competitive learning | Both/either | +0.54 |
| Cooperative learning versus other strategies | Both/either | +0.41 |
| Inductive teaching | Teacher‐centered | +0.33 |
| Inquiry‐based teaching | Both/either | +0.31 |
| Problem‐based learning | Both/either | +0.15 |
| Learner control of learning | Learner‐centered | +0.04 |
| Open versus traditional education | Learner‐centered | +0.01 |
Note: Based on Hattie, (2008). Visible learning: A synthesis of over 800 meta‐analyses related to achievement. London: Routledge.
Table 2.
Duvall & Tweedie's Trim and Fill
| k |
|
Lower 95th | Upper 95th | Q value | ||
|---|---|---|---|---|---|---|
| Observed values | 365 | 0.44 | 0.38 | 0.50 | 3095.89 | |
| Adjusted values | 0 | 0.44 | 0.38 | 0.50 | 3095.89 |
3.2. The pragmatics of teaching and learning
One might be tempted to organize some of these practices according to a spectrum of more and less constructivist practice. However, since constructivism has many different strands, both philosophically and pedagogically (Phillips, 1995), and since those strands vary significantly and counter‐intuitively in the degree of teacher‐centeredness they tend to imply, other approaches organize teaching practice more directly. These approaches label instructional strategies from more Student‐Centered (e.g., collaborative learning, discovery learning, problem‐based learning, inquiry‐based learning) to more teacher‐centered (e.g., direct or explicit instruction, didactic and expository instruction, lecturing, lecture‐discussion, drill, and practice).
3.2.1. The genesis of this project
The current project deconstructs teaching and learning according to the events (or dimensions) associated with instructional conditions. Any of these events can be either more Teacher‐Centered or Student‐Centered. A more Teacher‐Centered environment is one where teachers are in charge of most of the instructional events. A more Student‐Centered classroom is one in which teachers pass on control over the responsibility for many of the instructional events to learners, thereby acting as guides rather than directors. These events are then isolated and rated, and a composite can be constructed that will yield a greater‐to‐lesser Student‐Centered scale along a continuum of instructional practices. This approach is multidimensional and avoids problems associated with the vague and somewhat confusing nature the first approach (i.e., holistically, more constructivist vs. less constructivist) and the inexact labeling (i.e., inquiry learning) of the second. It also has the advantage of allowing for the examination of clusters or combinations of instructional events that will be more practically relevant to k‐12 education.
There is support for this approach in the conclusion of Gersten et al. (2008), who was tasked with conducting a meta‐analysis of mathematics teaching practices of Teacher‐Centered and Student‐Centered classroom. They noted: “The Task Group found no examples of studies in which learners were teaching themselves or each other without any teacher guidance; nor did the Task Group find studies in which teachers conveyed … content directly to learners without any attention to their understanding or response. The fact that these terms, in practice, are neither clearly nor uniformly defined, nor are they true opposites, complicates the challenge of providing a review and synthesis of the literature…” (p. 12). Similarly, the National Mathematics Advisory Panel Final Report (2008) noted that most teachers do not rely on one single methodology (i.e., either/or, the extremes of teacher‐directedness or learner‐centeredness) but attempt to blend the two so that each is strengthened by the other.
In an attempt to help settle the issue in regards to inquiry instruction (in particular) versus direct instruction in k‐12 education, a team of researchers (Cobern et al., 2010), funded through NSF/IERI, conducted a 4‐year set of large‐scale RCTs comparing inquiry methods of teaching (Student‐Centered) with direct instruction (Teacher‐Centered). Results suggested that both models produced significant pretest‐posttest learning, but that there was no significant difference between the classroom models. One of their conclusions was that “… soundly constructed lessons, involving learner engagement, and competently taught by good teachers, are as important for development as to whether a lesson is cast as inquiry or direct instruction. Thus, the promotion of one mode of instruction over the other, where both are based on sound models of expert instruction, cannot be based simply on content acquisition alone” (p. 37). This result runs counter to the findings of a meta‐analysis by Schroeder, Scott, Tolson, Huang, and Lee (2007) of instructional practices in science education, where an average effect size of = 0.65 was found for Inquiry Strategies, but in the write‐up of this review it is unclear what served as the control condition.
While it seems quite clear that both Student‐Centered and Teacher‐Centered instructional practices can contribute to learning, it is not at all clear how they work together and in what instructional domains. This project seeks answers to these questions.
3.3. Description of the intervention
The main research question of this meta‐analysis is: Can more Student‐Centered (i.e., more adaptive and individualized) approaches to k‐12 instruction be distinguished from more Teacher‐Centered approaches, and if they can, what approaches work best in terms of their effect on student achievements and what substantive (including combinations among dimensions) and demographic factors moderate these effects?
A concrete example of the advantage of using this approach compared to other classification schemes can be observed in the literature of cooperative and collaborative learning. While cooperative learning strategies tend to be more Teacher‐Centered, and collaborative learning tends to be more Student‐Centered (i.e., there tend to be more rules for delivering cooperative learning than there are in collaborative learning), great variance can be observed in the way the steps (e.g., group composition, task selection, role assignment, assessment methods) in each are operationalized. As a teaching/learning strategy, cooperative learning is perhaps the most heavily researched and best‐understood technique for involving learners in small‐group, process‐oriented learning. However, it can be viewed as either Teacher‐Centered or Student‐Centered depending on how its components are implemented.
For better understanding and more successful practical application, educational practices subsumed under this generic pedagogical idea of adaptive teaching and individualized learning deserves a valid conceptual working model, both inclusive enough to account for various forms of personalized/individualized instruction and sufficiently sensitive to fluctuations due not only to the influence of numerous moderator variables, but also to nuanced qualities of particular instructional approaches themselves. Student‐Centered instructional strategies could, in our view, serve such an overarching conceptual framework with adequate explanatory power, but only if operationalized properly to avoid an oversimplified dichotomy such as inductive versus deductive or constructivist versus direct instruction.
3.4. How the intervention might work
The phenomenon being investigated in this review is not an intervention in the normal way that this word is used in the experimental literature. It is more correctly a set of instructional practices that have defined along a continuum from extremely Teacher‐Centered (where the teacher is the boss in control of all instructional events) to extremely Student‐Centered (i.e., where the teacher is a guide and facilitator, even sometimes an equal partner). As such, any classroom research, regardless of the intervention being investigated, is eligible so long as there is sufficient detail provided as to what each group did.
Following a review of the literature by the research team on instructional practices in grades k‐12, we developed a list of instructional events (or dimensions) that can be rated on a Teacher‐Centered to Student‐Centered continuum. These are: (a) Flexibility in Course Planning—degree to which teachers/learners participate in course design, setting objectives, selecting or creating materials; (b) Pacing of Instruction/Learning—degree to which teachers/learners set the pace and content navigation of learning activities; (c) Teacher's Role—degree to which the teacher's role in the classroom ranges from lecturer to lecturer/authority figure/facilitator/ guide/partner; and (d) Adaptability of Instruction—degree to which materials and activities are generic or modified for individual students.
To define the key qualities of instruction as adaptive and individualized, (referred to here as Student‐Centered) for the purposes of this systematic review, we have deconstructed teaching and learning according to the events associated with them. Accordingly, a more Student‐Centered (more adaptive and individualized) classroom is one in which students play a more central role in the conduct of the instructional events. Conversely, if teachers dominate the instructional events, the classroom might be referred to as less adaptive. We have isolated these categories of instruction in reports of primary classroom research and rated them individually on a Teacher‐Centered to Student‐Centered continuum. Each event could then be: (a) Examined separately to determine their individual strengths; (b) examined in clusters as combinations of events; or (c) collapsed into a multidimensional composite that would yield a greater‐to‐lesser distinction between two different instructional settings. This approach avoids problems associated with either subjectively defining instructional conditions as Teacher‐Centered versus Student‐Centered or the specific labeling of them, as, for instance, PSI, mastery learning, etc. It also has the advantage of allowing us to examine instructional events in isolation and in various combinations in the search for optimal instructional practices.
3.5. Why it is important to do the review
Most of the significant effects from the meta‐analyses described in the first section of this report on the topic cluster around = 0.40, but the data also reflect a wide range of effects depending on the whole spectrum of moderator variables. Also, the overall picture painted by these meta‐analyses is less useful today as most are now dated. Of special concern to us is the fact that both earlier and recent meta‐analyses are rather limited in scope and focus of interest, addressing very specific instructional practices. There were no serious attempts to find and conceptualize pedagogical commonalities among the interventions in question that would allow treating them within the same class of phenomena broadly depicted as individualized learning and adaptive teaching. Thus, a review that is broad in scope and summarizes up to‐date‐evidence is a next logical step in investigating these phenomena.
3.6. Objectives
The main objective of this review is to summarize research on the effectiveness (in terms of learning achievement outcomes) of adaptive and individualized instructional interventions operationally defined here as more Student‐Centered pedagogical approaches. The overall weighted average effect size will be an indication of that. Additionally, and no less important, the review aims to provide a better understanding of what circumstances (e.g., with what populations of learners, for what subject matters) the effects of adaptive and individualized instruction reach their highest potential, and what conditions may depress them. To explore this, a set of substantive and demographic study features are coded and subjected to moderator variable analyses.
The outcomes of this review will inform education practitioners and the research community of the best instructional practices, preconditions for their successful implementation, and potential pitfalls, as well as directions for further empirical research in the area.
4. METHODS
4.1. Criteria for considering studies for this review
4.1.1. Types of studies
Only studies that considered the difference between the two groups were eligible for inclusion in this review. Included are studies that are experimental (i.e., Randomized Control Trials) or high‐quality Quasi‐Experimental Designs (i.e., statistically verified group equivalence or adjustment) in design that adequately addressed the research question of group comparisons, contained legitimate measures of academic achievement (i.e., teacher/researcher‐made, standardized), and reported sufficient statistical information for effect size extraction.
4.1.2. Types of participants
The participants are students in k‐12 formal educational settings (~ages 5–18) eventually leading to a certificate, diploma, degree, or promotion to a higher level. Educational interventions take place either in the classroom, via distance education, or as a blended intervention (various combinations of classroom and distance education).
4.1.3. Types of interventions
As described earlier, the intervention in question (an experimental condition) was considered to be any combination of instructional events that is rated higher in Student‐Centered qualities than a comparison (control) condition. Student participation in decisions about or control over the selection of study materials and learning activities, pacing of instruction, adapting learning for students’ individual needs, interests, backgrounds, etc., as well as various degrees of involvement in “partnership” with teachers, constitute, in our view, such Student‐Centered qualities of instruction. Two experienced independent reviewers coded instructional conditions featured in a given primary study (on a scale from 1–5) to reflect the extent to which each group possessed these qualities. Below we describe dimensions that were in the focus of our review.
Within each eligible comparative study all participation groups were coded for the four effect dimensions using a five‐point scale, as follows:
Dimension of Teacher's Role represents a continuum of a teacher's major responsibilities for organizing/delivering instruction/managing classroom activities, etc.
Coding: Describes the teacher's predominant role in the teaching/learning process:
-
1.
Teacher almost exclusively lectures, is the main source of content‐relevant information and/or an authority figure.
-
2.
Teacher provides some guidance, feedback, initiates and supports discussions, etc.
-
3.
Teacher functions as a guide, coach, tutor, provocateur of thinking.
-
4.
Teacher functions as a colleague, partner in learning.
-
5.
Teacher almost exclusively acts as a facilitator of learning, responding to students’ specific needs (follows students’ lead, consults, clarifies, encourages, etc.).
Dimension of Pacing reflects the degree of student control over the time of instruction/learning and over the progression through the course content (i.e., pedagogical flexibility—revisiting/selecting/skipping/reordering topics and tasks).
Coding: Describes the degree to which students are given control over course progression:
-
1.
Instruction is highly structured and progresses step‐by‐step; no flexibility is allowed.
-
2.
Minor degree of either logistical or pedagogical flexibility is available to students.
-
3.
Program/teacher's control over course progression is balanced with that of students.
-
4.
Students have a substantial amount of flexibility in course progression.
-
5.
High degree of flexibility (up to the point of completely self‐paced and/or self‐planned/self‐managed learning).
Dimension of Flexibility describes the degree of student control over course design, selection, and the provision of study materials and the setting up of learning objectives.
Coding: Describes the degree to which teachers/students participate in course planning:
-
1.
No involvement of students (most is determined by the teacher or program/curriculum).
-
2.
Student involvement in at least one of the components of course planning is present but limited.
-
3.
Teachers and students collaborate in the course planning, but teacher's role is still dominant.
-
4.
Teachers and students collaborate in the course planning equally.
-
5.
High student involvement—students play a leading role in course planning and selection of learning materials.
Dimension of Adaptability of Instruction describes the degree to which levels or modifications in instructional process is provided to accommodate individual students.
Coding: Describes the degree to which instruction takes into account students’ needs/interests/level of knowledge:
-
1.
Learning materials, settings, group formation (if any), activities and other work arrangements are predetermined and unchanged throughout the instruction (e.g., standardized or required curriculum).
-
2.
Minor modifications are allowed to either learning materials, group composition, or the context of instruction.
-
3.
Elements of either individualized feedback, or role and tasks assignments based on students’ interests and/or previous achievements, etc.
-
4.
Adapting several instructional components (in combinations) to students’ individual needs/interests/levels of knowledge.
-
5.
High levels of joint Adaptability of several components of instruction.
Based on the results of this coding (implemented independently by two reviewers compared and finalized in discussions), numeric values for each participating group were derived. The sum of these values determined the experimental (higher total) and control (lower total) conditions in every included study. The differential score was subsequently calculated to reflect the degree of student‐centered (Student‐Centered) components of instruction and to serve as a “continuous” predictor in meta‐regression of effect sizes against the “strength” of the intervention. In the Results section this variable is depicted as “Student‐Centered Total Differential Score” (i.e., sum of scores for the experimental group minus sum of scores for the control group) with a theoretical range from 1 (one point difference in coding on a single dimension) to 16 (maximum difference between groups on all four coded dimensions).
Similarly, we determined and reflected the number of dimensions with differential scores higher than zero (i.e., on how many dimensions adaptive qualities of the instruction were present in the experimental group to a greater extent than in the control group). This variable is labeled “Difference by Dimension” and could range from 1 (difference on a single dimension) to 4 (difference on all four dimensions), regardless of the magnitude of that difference.
Finally, we wanted to trace and analyze the source of the difference. To that end, a categorical variable Source of the Difference was designed to reflect what dimensions in what combinations contributed to the magnitude of the respective effect size. Initial letters of each of the coded dimension depicted levels of this variable. For example, F_T_A stands for some difference on the dimensions of Flexibility, Teacher's Role, and Adaptability of Instruction, with zero differential score on the dimension of Pacing.
Decisions about the completeness of the reported information were made at three points in time. First, two independent coders decided in general on each study's inclusion/exclusion status (overall qualitative judgment). Second, when dimensions were actually coded, reviewers searched for all relevant information in the study and if this information was not found, assigned the valued of “999” (or missing information) subsequently excluding studies with more than one “999.” Third, at the analysis stage studies with “999” were converted into zeroes, indicating no difference between the two respective conditions, and if after this transformation the overall composite score was zero these studies were also excluded.
As a result, only studies judged by coders to have provided sufficient description were retained for analysis.
4.1.4. Types of outcome measures
Primary outcome
All types of objective measures of academic achievements were considered. Their psychometric features (e.g., standardized, nonstandardized teacher/researcher‐made assessment tools) and type of representativeness (e.g., cumulative final examinations or averages of several performance tasks covering various components of the course/unit content) were documented and used in subsequent moderator variable analyses. Self‐assessments were excluded, as well as attitudinal and behavioral measures.
4.1.5. Duration of follow‐up
To maximize coverage of primary research, fully compatible in terms of outcome measures, only immediate post‐test results were considered. Various forms of delayed post‐tests were documented and their time lags categorized to inform further reviews.
4.1.6. Types of settings
As stated earlier, k‐12 formal educational settings (~ages 5–18), in educational programs leading to advancement to the next academic level/grade, were required in the current meta‐analysis. Other settings (i.e., homeschooling, auxiliary programs, summer camps, vocational workshops, etc.) were excluded.
4.2. Search methods for identification of studies
4.2.1. Electronic searches
Following the Guidelines of the Campbell Collaboration (Kugley et al., 2017), in order to retrieve a broad base of studies to review we started by having an experienced Information Specialist search across an array of bibliographic databases, both in the subject area and in related disciplines. The following databases were searched for relevant publications: ABI/Inform Global (ProQuest), Academic Search Complete (EBSCO), ERIC (EBSCO), PsycINFO (EBSCO), CBCA Education (ProQuest), Education Source (EBSCO), Web of Knowledge, Engineering Village, Francis, ProQuest Dissertations & Theses Global, ProQuest Education Database, Linguistics and Language Behavior Abstracts (ProQuest).
The search strategy was tailored to the features of each database, making use of database‐specific controlled vocabulary and search filters. Searches were limited to the year 2000–2017, and targeted a k‐12 population. The following is an example from the ERIC database:
(AB (adaptive OR personalized OR personalized OR individuali*) AND AB (pedagog* OR learning OR teaching OR instruction OR education OR classroom OR curriculum)
OR (AB “self direct*” OR “self regulate*”) OR (DE “Open Education” OR DE “Discovery Learning” OR DE “Individual Activities” OR DE “Student‐Centered Curriculum” OR DE “Student Centered Learning” OR DE “Mastery Learning” OR DE “Independent Reading” OR DE “Independent Study” OR DE “Individualized Instruction” OR DE “Competency‐Based Education” OR DE “Individual Instruction” OR DE “Individualized Programs” OR DE “Individualized Reading” OR DE “Individualized Transition Plans” OR DE “Learner Controlled Instruction” OR DE “Pacing” OR DE “Individual Testing” OR DE “Adaptive Testing” OR DE “Experiential Learning” OR DE “Learner Engagement” OR DE “Cooperative Learning”))
AND
(DE “Program Validation” OR DE “Academic Achievement” OR DE “Instructional Improvement” OR DE “Progress Monitoring” OR DE “Educational Assessment” OR DE “Instructional Effectiveness” OR DE “Program Evaluation” OR DE “School Effectiveness” OR DE “Evidence” OR DE “Outcomes of Education” OR DE “Program Effectiveness”)
AND
(DE “Pretesting” OR DE “Pretests Posttests” OR DE “Control Groups” OR DE “Experimental Groups” OR DE “Matched Groups” OR DE “Mixed Methods Research” OR DE “Randomized Controlled Trials” OR DE “Effect Size” OR DE “Quasiexperimental Design” OR DE “Comparative Analysis”)
Limiters—Date Published: 20000101‐20171231; Educational Level: Elementary Education, Grade 1, Grade 2, Grade 3, Grade 4, Grade 5, Grade 6, Grade 7, Grade 8, Grade 9, Grade 10, Grade 11, Grade 12, High Schools, Junior High Schools, Kindergarten, Middle Schools, Primary Education, Secondary Education; Publication Type: Books, Collected Works (All), Dissertations/Theses (All), ERIC Publications, Information Analyses, Journal Articles, Numerical/Quantitative Data, Reports—Descriptive, Reports—Evaluative Reports, Reports—Research.
4.2.2. Searching other resources
Theses/Conference papers/Research reports
Database searching was supplemented by using the Google search engine to locate additional articles, but principally grey literature (research reports, conference papers, theses, and research published outside conventional journals). Finally, an in‐house database of empirical studies of teaching methods, assembled by the research team from previous research reviews, was searched and produced an additional 254 studies. While these studies had been previously collected, the same set of inclusion criteria used for other studies were applied to them.
4.3. Data collection and analysis
4.3.1. Selection of studies
The overall set of inclusion/exclusion criteria for the meta‐analysis contained the following requirements:
Be publicly available (or archived) and encompass studies from 2000 to the present.
Feature at least two groups of different instructional strategies/practices that can be compared according to the research question as Student‐Centered and Teacher‐Centered instruction.
Include course content and outcome measures that are compatible with the groups that form these comparisons.
Contain sufficient descriptions of major instructional events in both instructional conditions.
Satisfy the requirements of either experimental or high‐quality quasi‐experimental design.
Is conducted in formal k‐12 educational settings eventually leading to a certificate, diploma, degree, or promotion to a higher grade level.
Contain measures representative of course achievement (i.e., teacher/researcher‐made, standardized).
Contain sufficient statistical information for effect size extraction.
4.3.2. Data extraction and management
Two researchers independently conducted abstract screening and full‐text review of studies identified through the whole complex of searching activities, compared notes, discussed and resolved disagreements, and documented reliability rates. Similar procedures were employed for effect size extraction and coding of moderator variables.
4.3.3. Effect size extraction and calculation
One of the selection criteria was “Contain sufficient statistical information for effect size extraction,” so that an effect size could be calculated for each independent comparison. This information could take several forms (in all cases sample size data were required):
Means and standard deviations for each treatment and control group;
Exact t value, F‐value, with an indication of the ± direction of the effect;
Exact p value (e.g., p = .011), with an indication of the ± direction of the effect;
Effect sizes converted from correlations or log odds ratios;
Estimates of the mean difference (e.g., adjusted means, regression β weight, gain score means when r is unknown)
Estimates of the pooled standard deviation (e.g., gain score standard deviation, one‐way ANOVA with three or more groups);
Estimates based on a probability of a significant t test using α (e.g., p < .05); and
Approximations based on dichotomous data (e.g., percentages of students who succeeded or failed the course requirements).
Effect sizes were initially calculated as Cohen's d and then converted to Hedges’g (i.e., correction for small samples). Standard errors () were calculated for and then converted to standard errors of SE g applying the correction formula for g. Hedges’ g, SE g , and sample sizes (i.e., treatment and control) were entered into Comprehensive Meta‐Analysis 3.3.07 (Borenstein et al., 2014) where statistical analyses were performed.
The effect sizes were coded for precision of calculations and analyzed in moderator variable analysis.
4.3.4. Description of methods used in primary research
True experimental and quasi‐experimental studies were included as far as they feature two educational interventions covering the same content (required knowledge acquisition and/or skill development). They were assessed on compatible outcome measures, where one group (experimental) is greater in Student‐Centered qualities (as described earlier) compared to the other (control) group with fewer Student‐Centered qualities. Reporting quantitative data sufficient for an effect size extraction was a necessary condition for study inclusion.
4.3.5. Criteria for determination of independent findings
There are several potential major threats to the independence of the findings. These are: (a) Repeated use of data coming from the same participants (i.e., dependence); (b) reporting multiple outcomes of the same type; and (c) aggregating outcomes of different types representing the same sample of participants (does not apply to this review, as it is limited to learning achievement outcomes only). The means that we used for ensuring data independence were that no group of participants was used more than once, resulting in most cases in only one effect size per study; and only one outcome measure was used in each comparison (either cumulative or composite achievement score).
4.3.6. Details of study coding categories
In addition to the coding dimensions of Student‐Centered pedagogical qualities that would determine proper comparisons for effect size extraction, the following groups of study coding categories were used in the review. First, study methodological quality was assessed for features such as design type, the fidelity of treatment implementation, attrition, and the unit of assignment/analysis (Cooper, Hedges, & Valentine, 2009). Within the same category, we coded for outcome source and psychometric quality of the assessment tools, as well as for the precision of procedures used for effect size extraction and for equivalence of instructor and study materials. Jointly, these methodological study features were used in moderator variable analyses to inform us of any potential threats to all types of study validity (Cooper et al., 2009).
Substantive study features further clarify descriptions of Student‐Centered pedagogical qualities by specifying theoretical models underlying instructional practices under review, treatment duration, instructor's experience, provision of professional development for teachers, and training for students, whenever it is required by specific instructional intervention. Demographic study features encompass learners’ age, educational background, and ability level, as well as, subject matter studied. All of these study features were subsequently analyzed as moderators for their potential impact on treatment effects.
4.3.7. Assessment of risk of bias in included studies
Assessment of the risk of bias was accomplished in several ways:
4.3.8. Sensitivity analysis
Sensitivity analysis was performed to determine if issues such as research design, effect size extraction methods, instructor and material equivalence, publication bias, and assessment tool category, might have introduced bias into the results. It also involves a “one study removed” analysis of the distribution effect sizes. For the results of this analysis please see Table 5a–e.
Table 5.
a–e Research design, extraction method, instrument type, and publication source
| Codes | k |
|
SE | Lower 95th | Upper 95th | z‐value | p value | Q‐B | df | p value | |
|---|---|---|---|---|---|---|---|---|---|---|---|
| Research design—a | |||||||||||
| QED | 273 | 0.46 | 0.03 | 0.39 | 0.53 | 13.18 | .00 | ||||
| RCT | 90 | 0.40 | 0.07 | 0.28 | 0.53 | 6.17 | .00 | ||||
| Total between | 0.55 | 1 | .46 | ||||||||
| Extraction method—b | |||||||||||
| Exact | 107 | 0.37 | 0.05 | 0.27 | 0.47 | 7.22 | .00 | ||||
| Approximate | 257 | 0.48 | 0.04 | 0.40 | 0.55 | 12.69 | .00 | ||||
| Total between | 2.83 | 1 | .09 | ||||||||
| Instrument type—c | |||||||||||
| Standardized | 78 | 0.37 | 0.00 | 0.28 | 0.46 | 7.95 | .00 | ||||
| Mod. Stand. | 79 | 0.44 | 0.01 | 0.30 | 0.59 | 5.95 | .00 | ||||
| Teacher/Rcher. | 196 | 0.48 | 0.00 | 0.39 | 0.57 | 10.26 | .00 | ||||
| Combo | 11 | 0.35 | 0.02 | 0.10 | 0.60 | 2.78 | .01 | ||||
| Total between | 3.11 | 3 | .37 | ||||||||
| Teacher class assignment—d | |||||||||||
| Same teacher | 156 | 0.32 | 0.00 | 0.23 | 0.42 | 6.64 | .00 | ||||
| Diff. teacher | 196 | 0.52 | 0.00 | 0.44 | 0.60 | 13.12 | .00 | ||||
| Total between | 10.19 | 1 | .00 | ||||||||
| Teacher training—e | |||||||||||
| No | 128 | 0.50 | 0.05 | 0.40 | 0.60 | 9.86 | .00 | ||||
| Yes | 208 | 0.45 | 0.04 | 0.37 | 0.53 | 10.86 | .01 | ||||
| Total between | 0.63 | 1 | .43 | ||||||||
Note: Missing data has been removed so k does not always equal 365.
Abbreviations: QED: quasi‐experimental design; RCT: randomized control trial.
4.3.9. Assessment of reporting biases
Publication bias was assessed based on the examination of a Forest Plot and associated “Trim and Fill” analysis plus other tests such as Classic Fail‐safe analysis and Orwin's Fail‐safe N (Orwin, 1983).
4.3.10. Assessment of heterogeneity
Homogeneity assessment, sometimes called an analysis of precision, was accomplished using the fixed model of analysis. The following indicators are reported and discussed:
Q‐Total, df, test of the null hypothesis, I 2 (percentage of error variance over and above chance), and tau2 (average variability used in the calculation of random weights).
4.3.11. Data synthesis
Data are synthesized, initially, under the random effects model, and includes the following statistics: Overall weighted random effects analysis with the statistics of , SE g , V g, upper and lower limits of the 95th confidence interval, z g , and p value;
Heterogeneity is estimated using Q‐Total, df, and p value. I 2 (i.e., percentage of error variation) and tau2 (i.e., average heterogeneity) is also calculated and reported.
Meta‐regression (single and multiple) is used to determine the relationship between covariates and effect sizes; and
Mixed‐model (i.e., random and fixed) moderator variable analysis is used to compare categories of each coded moderator variable. Q‐Between, df, and p value are used to make decisions about the significance of difference among levels of each categorical variable.
The protocol for this review was published in the Campbell Library, August 2016: https://campbellcollaboration.org/media/k2/attachments/Bernard_Operationalized_Adaptive_Teaching_Title.pdf
5. RESULTS
5.1. Description of studies
5.1.1. Results of the searches
All searches were conducted by a fulltime Information Specialist (MLS level) and member of the Systematic Review Team at the Centre for the Study of Learning and Performance at Concordia University in Montreal, QC, Canada. As shown in the PISA flowchart in Figure 1, there were three sources of studies: (a) 1,663 studies from dedicated bibliographic searches detailed in the Method; (b) 95 studies retrieved from the grey literature; and (c) 254 studies transferred from an internal database of studies retrieved for a larger meta‐analysis that includes all grade levels, but with the same inclusion/exclusion criteria as the current study. Figure 1 details the results at each stage of the search and retrieval process. All bibliographic information was exported into an Endnote database and managed from there.
Figure 1.

Flow diagram of the review process
Duplicate studies were removed (n = 247) and the remaining 1,765 studies were subjected to an abstract screening process. In all, 817 studies were retrieved as full‐text documents. Examination of these studies proceeded according to the details described in the Method. A total of 518 full‐text documents were excluded for reasons detailed in the inclusion/exclusion description in the Method, leaving 299 studies that were included in the final analysis. In the final stage, 365 independent effect sizes were extracted from these studies, coded, and analyzed.
5.1.2. Included studies
There are 365 effect sizes (299 individual studies) included in this review, representing 43,175 treatment and control participants. References to these 299 studies appear in the section entitled References to included studies. Please see Table S13 for complete statistical information for the 365 effect sizes.
5.1.3. Excluded studies
A total of 1,613 studies were excluded from this review. Figure 1 shows how this number diminished over the course of the review and selection process and references to these excluded studies are presented in the section entitled References to excluded studies (found in Online Supplement 1).
5.2. Risk of bias in included studies
In assessing the quality of included studies we used the following criteria: Methodological quality moderators, publication and sensitivity bias analysis, data independence, and sufficiency of the description of instructional practices.
5.2.1. Publication bias analysis
Borenstein et al. (2014) state:
“The basic issue of publication bias is that not all completed studies are published, and the selection process is not random (hence the “bias”). Rather, studies that report relatively large treatment effects are more likely to be submitted and/or accepted for publication than studies [that] report more modest treatment effects. Since the treatment effect estimated from a biased collection of studies would tend to overestimate the true treatment effect, it is important to assess the likely extent of the bias, and its potential impact on the conclusions” (Publication Bias Report, Comprehensive Meta‐Analysis, 2014).
Thus, this report includes an extensive investigation of publication bias, as a potential source of difficulty and error in interpreting these results.
Funnel Plot analysis and Trim and Fill
A Funnel Plot (See Figure 3) and associated Trim and Fill procedure (Duval & Tweedie, 2000) of 365 effect sizes (See Table 3) indicate that there is no discernable publication bias on the negative side of the plot (i.e., left of the mean effect size) under the random effects model.
Figure 3.

Random effects funnel plot (effect size by standard error). [Color figure can be viewed at wileyonlinelibrary.com]
Table 3.
Analysis of publication source
| Categories | k |
|
SE | Lower 95th | Upper 95th | z‐value | p value | Q‐B | df | p value | |
|---|---|---|---|---|---|---|---|---|---|---|---|
| Journal articles | 302 | 0.46 | 0.03 | 0.40 | 0.53 | 13.69 | .00 | ||||
| Theses | 8 | 0.31 | 0.12 | 0.08 | 0.54 | 2.60 | .01 | ||||
| Other | 54 | 0.35 | 0.07 | 0.21 | 0.50 | 4.85 | .00 | ||||
| Total between | 3.12 | 2 | .21 |
Another indicator, Classic fail‐safe N, suggests that 121,993 additional effect sizes would be needed to bring the observed p value below alpha = .05 (i.e., 860 additional “null” effect sizes per each observed effect size). Also, Orwin's fail‐safe N (Orwin, 1983), suggests that 125 additional “null” effect sizes would be needed to bring the observed average effect size to a trivial level of = 0.10.
In addition, an analysis of publication type (See Table 3) indicated that journal articles ( = 0.46, k = 302), unpublished theses ( = 0.31, k = 8) and other unpublished documents (e.g., conference papers), ( = 0.35, k = 54) were not significantly different in mixed‐model moderator analysis (Q‐Between = 3.12, df = 2, p = .21). However, these nonsignificant findings should be viewed cautiously because of the small k for theses, possibly resulting from an issue of power.
Overall, there appear to be no serious issues of bias related to the analysis of published data.
5.2.2. Sensitivity analysis
Sensitivity analysis examines issues in the data and coding that might affect the reliability of the results. First, we conducted a one study removed (Borenstein et al., 2014, CMA, Version 3.3.070) analysis of effect size and study sample on the variability of the individual data points across the distribution. Table 4 shows partial results of that analysis. The table contains six studies from the top of the distribution (highest effect sizes) and six studies from the bottom (lowest effect sizes, all negative). There is only a 0.01th difference in average effect size between the top and the bottom of the distribution when each study is removed sequentially. Also, the standard errors and the limits of the 95th confidence demonstrate the same consistency. Since the most problematic studies often reside on the peripheries of the distribution, large/small in effect size magnitude and large in sample size (i.e., high influence studies), the relative random weights were included in the last column. In the 12 studies displayed, their influence ranged from 0.13–0.28 on the upper end and 0.19–0.33 on the lower end indicating little concern for undue influence.
Table 4.
Sample (top six studies and bottom six studies) of one study removed
| Study names | Actual | One study removed | Relative wt. | |||
|---|---|---|---|---|---|---|
| g |
|
SE | Lower 95th | Upper 95th | ||
| 1. Zohar_2 2008 | 3.10 | 0.44 | 0.03 | 0.38 | 0.50 | 0.20 |
| 2. Lamidi 2015 | 3.10 | 0.44 | 0.03 | 0.38 | 0.49 | 0.28 |
| 3. Garcâ_1 2006 | 3.10 | 0.44 | 0.03 | 0.38 | 0.50 | 0.26 |
| 4. Ben‐David 2009 | 3.10 | 0.44 | 0.03 | 0.38 | 0.49 | 0.27 |
| 5. Alfassi_1 2003 | 3.10 | 0.44 | 0.03 | 0.38 | 0.50 | 0.15 |
| 6. Alfassi_2 2003 | 2.85 | 0.44 | 0.03 | 0.38 | 0.50 | 0.13 |
| 360. Eysink_2 2009 | −0.88 | 0.45 | 0.04 | 0.23 | 0.39 | 0.33 |
| 361. Furtak_1 2012 | −0.97 | 0.45 | 0.04 | 0.23 | 0.39 | 0.19 |
| 362. Chang_2 2002 | −0.97 | 0.45 | 0.04 | 0.23 | 0.39 | 0.25 |
| 363. Sola_2 2007 | −0.98 | 0.45 | 0.04 | 0.23 | 0.39 | 0.29 |
| 364. Wesche 2002 | −1.07 | 0.45 | 0.04 | 0.23 | 0.39 | 0.32 |
| 365. Bassett 2014 | −1.48 | 0.45 | 0.04 | 0.23 | 0.39 | 0.25 |
| Overall (k = 365) | 0.44 | 0.44 | 0.03 | 0.38 | 0.50 | 100% |
Several issue related to study design quality and methodology (See Table 5a–c) also suggest no or minimal potential bias in these results (data below reported according to the mixed model analyses):
Bias in research design (Table 5a)—in moderator variable analysis, quasi‐experimental research designs versus randomized control trials, show no significant difference in average effect sizes ( = 0.46, k = 273 and = 0.40, k = 90, respectively, Q‐between = 0.55, df = 1, p = .46);
Effect size extraction bias (Table 5b)—effects calculated from exact descriptive statistics (e.g., means and SDs, exact t‐values, exact p values) versus effects estimated based on other statistics with the element of some assumptions (e.g., reported nonexact significance levels, p < .05) indicates no observable bias ( = 0.37, k = 107 vs. = 0.48, k = 257, respectively, Q‐between = 2.83, df = 1, p = .09).
Bias in the quality of instrument types (Table 5c)—standardized tests versus modified or piloted standardized tests versus teacher/researcher made tests versus combinations of measure types indicates no bias in average effect sizes ( = 0.37, k = 78, versus = 0.44. k = 79, versus = 0.48, k = 196, vs. = 0.35 vs. k = 11, respectively, Q‐between = 3.11, df = 3, p = .37).
Bias in coding—Five sources of coding bias were recorded and are presented here as percentage of agreement and Cohen's Kappa (κ; i.e., inter‐rater reliability):
-
1.
Abstract screening, 84.48% or κ = 0.69;
-
2.
Full‐text review, 96.08% or κ = 0.92;
-
3.
Decisions on number of effects per study, 92.78% or κ = 0.92;
-
4.
Data extraction and effect size calculation, 96.21 or κ = 0.92; and
-
5.
Study Feature coding (including the four primary dimensions), 92.23% or κ = 0.84.
These coding values are deemed to be within normal range and so no bias seems to be present.
Two other potential sources of bias that arose from classroom conditions were also tested:
Bias in teacher assignment (Table 5d)—same teacher in both classrooms versus different teachers in each classroom ( = 0.32, k = 157 vs. = 0.52, k = 196, Q‐between = 10.19, df = 1, p = <.001. In this case, bias seems to be present, with different teachers in each classroom outperforming classrooms where the same teacher was assigned.
Teacher training in Student‐Centered methods (Table 5e)—no teacher training versus teacher training ( = 0.50, k = 218 vs. = 0.45, k = 208, Q‐between = 0.63, df = 1, p = .43). There appears to be no bias due to differential teacher training.
Overall, this assessment of methodological and classroom variables indicates only one area of concern: The same teacher assigned to both the treatment and control conditions or a different teacher assigned to each condition. Different teachers appear to produce significantly higher effect sizes than when the same teacher is used in the two conditions. While this form of bias is of concern by itself and was further explored in the subsequent analyses, in light of all of the other bias issues tested and found to be equivalent in their influence on the treatment effect, it is unlikely that this issue alone affected the ultimate conclusions of this review.
5.3. Synthesis of results
5.3.1. Primary analysis
Basic question
The first question involved the overall average effect on achievement outcomes of more adaptive instruction as it is reflected in the difference between more Student‐Centered instructional conditions (the treatment condition) and less Student‐Centered conditions (the control condition). It is important to understand that this is not necessarily a contrast between Student‐Centered classrooms and Teacher‐Centered classrooms. It is instead the differential in ratings (on four effect size‐defining dimensions outlined in the Method section) between a treatment (more Student‐Centered) and control condition (less Student‐Centered) that range from equal (i.e., zero, treatment and control are equally Student‐Centered and Teacher‐Centered) to large, (i.e., up to +3 or +4—a theoretical, not necessarily observed in this review range, Student‐Centered is much greater than Teacher‐Centered).
In all, 365 effect sizes are included in the meta‐analysis. Four very large effect sizes (>4.00) are adjusted (Winsorized; Hastings, Mosteller, Tukey, & Winsor, 1947) to match the next lower effect size, the fifth largest, in the distribution (g = 3.1). This produces a change in the mean effect size of 0.10 and a similarly slight adjustment to the other statistics. There are no outliers at the negative end of the distribution.
The results of this analysis (See Table 6 for both the unadjusted and adjusted statistics) produces a significant weighted adjusted average effect size of = 0.444, k = 365, SE = 0.03, z = 14.56, p < .000. The distribution is significantly heterogeneous (Q‐Total = 3095.89, df = 364, p < .0001, with an I 2 value of 88.22 and a τ 2 (tau‐squared) of 0.27. This result suggests that on average more Student‐Centered classroom studies produce better results on achievement outcomes than do less Student‐Centered classroom studies. The average weighted effect size is of moderate size (Cohen, 1988) and indicates that on average the more C‐S condition (treatment) outperformed the less C‐S (control) by 0.444sd. The average effect size is used as a reference point to describe the collection of student‐centered versus teacher‐centered practices when compared and reflects the overall benefit for learning when student‐centered qualities are present. The subsequent moderator variable analysis (presented in the next section) attempts to explain the extent to which each dimension contributes (or does not contribute) to the overall average.
Table 6.
Overall results for unadjusted and Winsorized data sets
| Model | Effect size and 95th confidence interval | Test of null | ||||||
|---|---|---|---|---|---|---|---|---|
| Random effects | k |
|
SE | Lower 95th | Upper 95th | z‐value | p value | |
| Unadjusted | 365 | 0.454 | 0.03 | 0.39 | 0.52 | 14.44 | <.00 | |
| Winsorized | 365 | 0.444 | 0.03 | 0.38 | 0.50 | 14.56 | <.00 | |
| Model | Heterogeneity | ||||
|---|---|---|---|---|---|
| Fixed effect | Q‐value | df | p value | I 2 | Tau 2 |
| Unadjusted | 3,327.78 | 364 | <.00 | 89.03 | 0.29 |
| Winsorized | 3,095.89 | 364 | <.00 | 88.22 | 0.27 |
Simple meta‐regression can provide a sense of this relationship between the strength of Student‐Centered and achievement outcomes. A moderator variable reflecting the degree of Student‐Centered (the quantitative differences between the ratings of the treatment/control) was created to test this relationship. If this relationship is patterned (either positively or negatively) rather than irregular, the result of the meta‐regression of achievement on the degree of student centeredness should result in a positive, significant slope. If the slope of the regression line is not positive and significant, indicating the absence of a positive linear progression, we can assume that the relationship between student centeredness and achievement results is irregular, thereby diminishing the argument that more Student‐Centered classrooms are more advantageous to the attainment of achievement outcomes than less Student‐Centered Classrooms.
The simple meta‐regression of the relative difference between more Student‐Centered and less Student‐Centered resulted (the defining characteristic of the treatment‐control contrast) in a significant slope (β = 0.037, SE = 0.017, z = 2.14, p = .03). The test of the model resulted in Q‐Between = 4.58, df = 1, z = .03. Q‐within is also significant. These results indicate a marginally positive relationship between the degree of student centeredness and the achievement of learning outcomes by students. At best, this result is considered to be a weak but positive effect. Complete results of this analysis can be found in Table 7.
Table 7.
Overall strength of the relationship between treatment and control (degree of student‐centeredness)
| Covariate | β | SE | Lower 95th | Upper 95 | z‐value | p value | VIF |
|---|---|---|---|---|---|---|---|
| Intercept | 0.34 | 0.06 | 0.22 | 0.45 | 5.76 | <.001 | 3.67 |
| Degree of Student‐Centered instruction | 0.04 | 0.02 | 0.00 | 0.07 | 2.41 | .032 | 1.00 |
| Test of model: Q = 4.58, df = 1, p = .032. Goodness of Fit: Q = 3094.41, df = 363, p < .000, tau 2 = 0.27 | |||||||
Note: This and all subsequent meta‐regression analyses use Random Effects Method‐of‐Moments Model.
5.3.2. Primary predictor variables
There are four primary predictor variables that represent the degree of the Teacher's Role, Pacing, Flexibility, and Adaptivity that is offered to students. Studies are coded as a differential between the treatment and control conditions in terms of less flexible/adaptive classroom practices or more flexible/adaptive practices. These differentials form a hypothetical continuous integer‐level scale ranging from −4 to −1 for more Teacher‐Centered practices (less flexible/adaptive) and +1 to +4 for more Student‐Centered practices (more flexible/adaptive), with 0 (zero) interpreted as equality between the control and treatment conditions. Please, keep in mind that though negative‐to‐positive fluctuations within each dimension are theoretically possible, only studies whose total differential score (the sum of four dimensions) is positive (i.e., overall in favor of Student‐Centered qualities of instruction) were retained in our meta‐analysis. There are four dimensions of classroom practice (these are described in detail in the Method) that were identified and to which this coding was applied:
Teacher's role as a lecturer/guide/mentor;
Pacing of instruction to meet student needs/preferences;
Flexibility in the creation/use of study materials, course design, etc.;
Adaptability of feedback and learning activities to students, individual interests of students, etc.
The question being asked in this moderator variable analysis is which, if any, of these classroom practices, predicts levels of effect size. Initially, meta‐regression is used to explore this question. Then, treating the scale as categorical data, the various levels are explored through mixed moderator variable analysis (i.e., ANOVA‐analog). Finally, combinations of these dimensions are explored to determine if they can better characterize the totality of the instruction.
Meta‐regression of dimensions (primary moderator variables)
Initially, all four dimensions were entered into multiple meta‐regression (random effects method of moments) in the order that they are described above. The dependent or outcome variable in this analysis was the effect sizes of individual studies (k = 365).
The overall model, excluding the intercept (See Table 8a), was significant (Q‐Between = 31.02, df = 4, p < .001). The extent of unexplained variation goodness of fit test for heterogeneity was also significant (Q‐within = 2,912.94, df = 360, p < .001, I 2 = 87.64%, Tau 2 = 0.2615, Tau = 0.5113). Two of the four moderator variables were significant predictors of effect size (though acting in opposite directions): Pacing (β = −0.1542, SE = 0.045, z = −3.45, p = .0006); and Teacher's role (β = 0.154, SE = 0.039, z = 3.96, p = .0001). The other two predictor variables, Flexibility and Adaptability, were not significant.
Table 8.
a–b Meta‐regression results for interval‐level moderator variables
| Covariates | β | SE | Lower 95th | Upper 95 | z‐value | p value | VIF | |||||||
|---|---|---|---|---|---|---|---|---|---|---|---|---|---|---|
| Meta‐regression of four predictors—a | ||||||||||||||
| Intercept | 0.33 | 0.06 | 0.21 | 0.45 | 5.38 | <.001 | 4.11 | |||||||
| Pacing | −0.15 | 0.04 | −0.24 | −0.07 | −3.45 | <.001 | 1.04 | |||||||
| Teacher's role | 0.15 | 0.04 | 0.08 | 0.14 | 3.96 | <.001 | 1.06 | |||||||
| Adaptability | 0.06 | 0.04 | −0.02 | 0.14 | 1.52 | .13 | 1.04 | |||||||
| Flexibility | 0.04 | 0.04 | −0.04 | 0.11 | 0.99 | .32 | 1.07 | |||||||
| Test of model: Q = 31.02, df = 4, p < .001. Goodness of Fit: Q = 2921.91, df = 360, p < .0001, tau 2 = 0.51 | ||||||||||||||
| Meta‐regression of two predictors (reduced model)—b | ||||||||||||||
| Intercept | 0.36 | 0.06 | 0.25 | 0.47 | 6.21 | <.001 | 3.74 | |||||||
| Pacing | −0.14 | 0.04 | −0.23 | −0.05 | −3.18 | .002 | 1.01 | |||||||
| Teacher's role | 0.17 | 0.04 | 0.09 | 0.24 | 4.42 | <.001 | 1.00 | |||||||
| Test of model: Q = 27.74, df = 2, p < .001. Goodness of Fit: Q = 2920.95, df = 362, p < .0001, tau 2 = 0.51 | ||||||||||||||
Abbreviation: VIF: variance inflation factor.
The analysis was re‐run (See Table 8b) with the two nonsignificant variables removed. This model was also significant (Q = 27.74, df = 2, z = 4.42 p < .001) and heterogeneous (Q‐within = 2,920.95, df = 362, p < .001, I 2 = 87.61%, Tau 2 = 0.2583, Tau = 0.508). The variables in the reduced model were both significant: Pacing (β = −0.139, SE = 0.044, z = −3.16, p = .0015); and Teacher's role (β = 0.167, SE = 0.038, z = 4.42, p < .0001). It is interesting that the moderator Pacing is a negative predictor of effect size, while Teacher's role is positive. Note that in all of these analyses the variance inflation factor is low, indicating a lack of collinearity (Thompson & Higgins, 2002). See Figures 4, 5 for scatterplots of these results.
Figure 4.

Scatterplot of Teacher's Role from meta‐regression (Table 7b). [Color figure can be viewed at wileyonlinelibrary.com]
Figure 5.

Scatterplot of Pacing from meta‐regression (Table 7b). [Color figure can be viewed at wileyonlinelibrary.com]
To examine these results from another perspective, mixed moderator variable analysis was conducted for Pacing, Teacher's Role, Adaptability, and Flexibility, each explored across levels of differential scores (Table 9a–d). Several categories with cell frequencies (number of cases per level of the category) less than 5 were removed from each of these analyses. The same variables, Pacing, Teacher's Role, are significant across the categories of relative scores and the same pattern of —Teacher's Role, as a positive predictor of effect size, and Pacing as a negative predictor of effect size.
Table 9.
a–d Comparison of levels of relative strength (how much Student‐Centered) for four primary moderator variables
| Levels | k |
|
SE | Lower 95th | Upper 95th | z‐value | p value | Q‐Bet. | df | p value | ||
|---|---|---|---|---|---|---|---|---|---|---|---|---|
| Teacher's Role—a | ||||||||||||
| 0 (Student‐Centered = Teacher‐Centered) | 80 | 0.31 | 0.07 | 0.17 | 0.44 | 4.51 | .00 | |||||
| 1 (Student‐Centered > Teacher‐Centered) | 189 | 0.41 | 0.04 | 0.33 | 0.49 | 9.68 | .00 | |||||
| 2 (Student‐Centered >> Teacher‐Centered) | 79 | 0.58 | 0.06 | 0.46 | 0.69 | 10.07 | .00 | |||||
| 3 (Student‐Centered >>> Teacher‐Centered) | 15 | 0.78 | 0.21 | 0.37 | 1.20 | 3.72 | .00 | |||||
| Total between | 12.65 | 3 | .01 | |||||||||
| Pacing—b | ||||||||||||
| 0 (Student‐Centered = Teacher‐Centered) | 151 | 0.54 | 0.05 | 0.44 | 0.64 | 10.59 | .00 | |||||
| 1 (Student‐Centered > Teacher‐Centered) | 172 | 0.40 | 0.04 | 0.32 | 0.48 | 9.58 | .00 | |||||
| 2 (Student‐Centered >> Teacher‐Centered) | 38 | 0.22 | 0.08 | 0.06 | 0.38 | 2.72 | .01 | |||||
| Total between | 12.37 | 2 | .002 | |||||||||
| Adaptability—c | ||||||||||||
| 0 (Student‐Centered = Teacher‐Centered) | 179 | 0.38 | 0.04 | 0.31 | 0.46 | 9.94 | .00 | |||||
| 1 (Student‐Centered > Teacher‐Centered) | 140 | 0.49 | 0.06 | 0.38 | 0.60 | 8.57 | .00 | |||||
| 2 (Student‐Centered >> Teacher‐Centered) | 39 | 0.55 | 0.10 | 0.36 | 0.73 | 5.66 | .00 | |||||
| 3 (Student‐Centered >>> Teacher‐Centered) | 6 | 0.41 | 0.15 | 0.12 | 0.70 | 2.77 | .01 | |||||
| Total between | 3.99 | 3 | .26 | |||||||||
| Flexibility—d | ||||||||||||
| 0 (Student‐Centered = Teacher‐Centered) | 261 | 0.42 | 0.03 | 0.35 | 0.48 | 12.23 | .00 | |||||
| 1 (Student‐Centered > Teacher‐Centered) | 64 | 0.47 | 0.09 | 0.29 | 0.65 | 5.18 | .00 | |||||
| 2 (Student‐Centered >> Teacher‐Centered) | 29 | 0.60 | 0.11 | 0.40 | 0.81 | 5.76 | .00 | |||||
| 3 (Student‐Centered >>> Teacher‐Centered) | 10 | 0.61 | 0.25 | 0.11 | 1.10 | 2.41 | .02 | |||||
| Total between | 3.48 | 3 | .32 | |||||||||
There is nothing unique in this later analysis, but it does give a clear sense of the magnitude of effect within each category of relative strength. For example, Teacher's Role ranges in effect size magnitude from = 0.78 at strength level 3 to = 0.31 at level 0 (Table 9a), where the treatment and control conditions are equally balanced. Pacing (Table 9b) moved in the opposite with and average effect at strength 2 of = 0.22 and at = 0.54 at strength level 0. Both of these variables are significant in this analysis of categories.
By contrast, neither of the other two variables (Table 9c,d), Adaptability and Flexibility, is patterned or significant across levels of relative strength. For the two variables, average effect sizes ranges from = 0.38 to = 0.61, a relatively short range compared to Teacher's Role and Pacing.
The next question we asked concerns the combinations of these four variables. In this analysis, dimensions alone are compared with the dimensions paired (i.e., Teacher's Role + Pacing). The two significant predictors, Teacher's Role and Pacing are shown in Table 10. The between‐group z‐value comparing the two alone and their pair is not significant (p = .44).
Table 10.
Teacher's role and pacing and their combination
| Levels | k |
|
SE | Lower 95th | Upper 95th | z‐value | p‐value | Q‐Bet. | df | p value | |
|---|---|---|---|---|---|---|---|---|---|---|---|
| Teacher's role, pacing and combination | |||||||||||
| Teacher's role | 61 | 0.48 | 0.07 | 0.34 | 0.62 | 6.83 | .00 | ||||
| Pacing | 5 | 0.50 | 0.15 | 0.20 | 0.80 | 3.26 | .00 | ||||
| Teacher + Pacing | 14 | 0.72 | 0.25 | 0.23 | 1.20 | 2.91 | .00 | ||||
| Total between | 2.69 | 3 | .44 | ||||||||
However, when the other two variables, Flexibility, and Adaptability, are examined in the same way (single dimensions and pairs), the between‐group z‐value is significant (p = .01; See Table 11a). The two extremes with reasonable cell frequencies are further tested in post hoc analysis in Table 11b. These are Teacher's Role paired with Flexibility (k = 44, = 0.31) and Teacher's Role paired with Adaptability (k = 33, = 0.66). The overall Q‐between is significant (z = 7.58, p = .006).
Table 11.
a–b Two variables (adaptability and flexibility) and their combinations
| Levels | k |
|
SE | Lower 95th | Upper 95th | z‐value | p value | Q‐Bet. | df | p value | |
|---|---|---|---|---|---|---|---|---|---|---|---|
| Adaptability, Flexibility and combinations—a | |||||||||||
| Adaptability | 19 | 0.23 | 0.11 | 0.02 | 0.44 | 2.10 | .04 | ||||
| Flexibility | 29 | 0.19 | 0.09 | 0.02 | 0.35 | 2.17 | .03 | ||||
| Flexibility + Adaptability | 15 | 0.35 | 0.24 | −0.12 | 0.82 | 1.47 | .14 | ||||
| Flexibility + Teacher's role | 44 | 0.31 | 0.08 | 0.15 | 0.46 | 3.89 | .00 | ||||
| Adaptability/Pacing | 6 | 0.34 | 0.28 | −0.21 | 0.89 | 1.20 | .23 | ||||
| Adapt. +Teacher's role | 33 | 0.66 | 0.10 | 0.46 | 0.86 | 6.57 | .00 | ||||
| Total between | 14.55 | 5 | .01 | ||||||||
| Teacher's role and combinations with Flexibility and Adaptability (post hoc)—b | |||||||||||
| Teacher's role | 61 | 0.48 | 0.07 | 0.34 | 0.62 | 6.83 | .00 | ||||
| Flexibility + Teacher's role | 44 | 0.31 | 0.08 | 0.15 | 0.46 | 3.89 | .00 | ||||
| Adapt. + Teacher's role | 33 | 0.66 | 0.10 | 0.46 | 0.86 | 6.57 | .00 | ||||
| Total between | 7.76 | 2 | .02 | ||||||||
Note: The total number of all single dimensions and combinations is k = 365. Some have been excluded (k = 226).
Demographic moderator variable analysis
Moderator variables in this study (Table 12a–d), beyond those already described, are mostly demographic in nature. Thus, they are less important to the main focus but they do give a sense of the range of conditions that exist within the data set. In Table 12a–d, it is interesting that only one demographic variable is significant—Ability Profile and that only one is close to significance (STEM vs. Non‐STEM; Table 12b). The first is a contrast of two categories with reasonable cell frequencies greater than five, General Population and Special Education. The effect sizes were = 0.42 (k = 338) and = 0.80 (k = 26) in favor of Special Education. Non‐STEM subjects outperformed STEM in absolute magnitude, but the contrast was not significant ( = 0.52 vs. 0.40).
Table 12.
a–d Mixed moderator variable analysis for categorical demographics
| Levels | k |
|
SE | Lower 95th | Upper 95th | z‐value | p value | Q‐Bet. | df | p value | |
|---|---|---|---|---|---|---|---|---|---|---|---|
| Grade Level—a | |||||||||||
| Kindergarten | 7 | 0.44 | 0.18 | 0.10 | 0.79 | 2.52 | .01 | ||||
| Gr. 1–5 | 116 | 0.36 | 0.04 | 0.28 | 0.45 | 8.38 | .00 | ||||
| Gr. 6–8 | 95 | 0.47 | 0.07 | 0.34 | 0.60 | 6.93 | .00 | ||||
| Gr. 9–12 | 124 | 0.50 | 0.06 | 0.38 | 0.62 | 8.15 | .00 | ||||
| Total between | 4.11 | 3 | .39 | ||||||||
| Subject matter (Non‐STEM vs. STEM)—b | |||||||||||
| Non‐STEM | 93 | 0.52 | 0.07 | 0.39 | 0.65 | 7.93 | .00 | ||||
| STEM | 260 | 0.40 | 0.03 | 0.33 | 0.46 | 11.36 | .00 | ||||
| Total between | 2.80 | 1 | .09 | ||||||||
| Subject matter (Detailed)—c | |||||||||||
| ICT | 13 | 0.36 | 0.17 | 0.03 | 0.69 | 2.17 | .03 | ||||
| Language Arts | 52 | 0.48 | 0.06 | 0.35 | 0.60 | 7.57 | .00 | ||||
| Math | 80 | 0.37 | 0.06 | 0.26 | 0.48 | 6.61 | .00 | ||||
| Science | 168 | 0.43 | 0.05 | 0.33 | 0.52 | 8.94 | .00 | ||||
| Second Lang. | 12 | 0.57 | 0.18 | 0.21 | 0.92 | 3.11 | .00 | ||||
| Social Sciences | 12 | 0.64 | 0.27 | 0.03 | 0.69 | 2.33 | .02 | ||||
| Total between | 2.97 | 5 | .70 | ||||||||
| Ability Profile—d | |||||||||||
| General Pop. | 338 | 0.42 | 0.03 | 0.36 | 0.48 | 13.45 | .00 | ||||
| Special Ed. | 26 | 0.80 | 0.15 | 0.50 | 1.10 | 5.24 | .00 | ||||
| Total between | 5.96 | 1 | 0.01 | ||||||||
To reiterate, complete descriptive statistics are contained in Table S13.
6. DISCUSSION
The purpose of this review is to examine the effectiveness of Student‐Centered instructional practices in k‐12 classes as it increases or depresses student achievement. Additionally, the study examines four dimensions of instructional practice, namely, “Teacher's role,” “Pacing of instruction,” “Flexibility of instructional activity,” and “Adaptability of instruction” for their individual and/or collective influence. In addition, five demographic moderator variables are also examined for their potential relationship to the effectiveness of Student‐Centered instruction.
6.1. Summary of main results
6.1.1. Overall tests of Student‐Centered instruction
Two tests are used to judge the overall effectiveness of Student‐Centered instructional practices in promoting achievement outcomes in k‐12 learners.
The first is a test of the overall outcome of 365 effect sizes. The results are significant, producing an average random effect of = 0.444. Interpreted in terms of the normal distribution, this amounts to an increase for the more Student‐Centered condition of 17.5% (67.5 – 50 = 17.5) over the less Student‐Centered control condition. This result would be considered a moderate effect according to Cohen's (1988) interpretative criteria.
The second is the result of simple meta‐regression of effect size on the total number of 0 to 4 codes for four dimensions for each study (e.g., Pacing‐ Flexibility‐ Teacher's role‐ Adaptability or 1‐2‐2‐1 = 6, the sum of differential scores across dimensions). Each study was represented by a number with a theoretical range of 0–16. The analysis resulted in a positive and significant relationship (p = .03) suggesting that as Student‐Centered totals increase, so does effect size. Taken together, these results reveal a tendency towards an advantage for more Student‐Centered practices compared with less Student‐Centered practices.
6.1.2. Primary moderator variables
The next question relates to the four dimensions, represented by the codes for each dimension above disassembled from the total number referred. Each code ranges from 0–4 In the example above, this would give Pacing a 1, Flexibility a 2, Teacher's role a 2, and Adaptability a 1.
The four dimensions are tested as predictors of effect size using multiple meta‐regression. Two dimensions are significant, Teacher's role, and Pacing; Adaptability and Flexibility were not.
A second multiple meta‐regression, including only Teacher's role and Pacing also produces a significant overall result. However, the relationship between the two predictors is opposite: Teacher's role is significant and positive, whereas Pacing is significant and negative.
The combination of these dimensions, tested using mixed moderator variable analysis reveals that Teacher's role and Adaptability is a better combination for promoting better Student‐Centered achievement than Teacher's role and Flexibility (i.e., compared in post hoc analysis). This combination also exceeds the overall average effect size for more Student‐Centered versus less Student‐Centered instruction ( = 0.66 vs. = 0.44).
6.1.3. Demographic moderator variables
Four demographic moderator variables were coded and the results of their analyses are described below.
Three of the moderator variables are not significant: Grade level, Subject matter (i.e., Non‐STEM vs. STEM courses), and detailed Subject matter comparisons. None of these are significant across levels.
The variable Ability profile is significant in between‐group analysis, with students in Special Education programs outperforming students deemed in the General Population (i.e., = 0.80 vs. = 0.42). This result seems not to be surprising, given that Special Education teachers are trained to provide individual attention to students in small classroom settings.
6.2. Overall completeness and quality of the evidence
Clearly, this database does not include every single classroom study since 2000 that tested two groups. To find, much less to process literature that is potentially as large as this would be is a monumental task. Therefore, we had to be selective and limit the database in two important ways. First, we selected only studies that contained two compared groups that included enough information in each group to assess the qualities of Student‐Centered that we were looking for. Second, we selected only high‐quality quasi‐experimental designs (QEDs) and randomized control trials (RCTs), thus further limiting the potential pool of studies. As a result, we consider this corpus of 299 studies and 365 independent effect sizes to be a reasonable representation of the larger body of studies that we either excluded or that could not be accessed.
6.3. Limitations and potential biases in the review process
6.3.1. High‐inference versus low‐inference coding procedures
One of the obvious limitations and a potential source of bias in this study is the fact that it uses an extensive amount of high‐inference coding (Cooper, 2017). There is no treatment or control, per se, but instead, a set of judgments by reviewers, first as to the very definition of the treatment and control conditions (i.e., the treatment is the condition that is more Student‐Centered and, conversely, the control is the condition judged to be less Student‐Centered). These decisions by two independent coders were judged to be high in inter‐rater reliability for the direction of the effect (e.g., + vs. −; κ = >0.86), and for the precision of calculation (κ = >0.92). Second, judgments were made by coders as to the exact ratings (e.g., +3 vs. +4) applied to each of the four dimensions. Again, these decisions were made by at least two coders working independently and producing inter‐rater reliability of κ = 0.67. It is important to note in considering the accuracy of coding that raters/coders received extensive training for this task, including multiple practices runs on studies previously judged to have been accurately and reliably coded.
Also, it is worth noting that our research team has considerable experience with this approach to establishing the treatment and control through high inference coding, and have presented a paper on the subject at the Campbell Collaboration's Ninth Colloquium (Borokhovski, Bernard, Tamim, & Abrami, 2009) as well as included high inference coding in previously published meta‐analyses. In the earliest meta‐analysis (Bernard et al., 2009), we compared interaction treatments (i.e., practices that link students to each other, teachers. and content) in distance education to noninteraction treatments, and then classified them as student‐student, student‐teacher, student‐content interactions. The inter‐rater agreement for this exercise was κ = 0.71.
In a later meta‐analysis (Schmid et al., 2014) of the effects of technology treatments in postsecondary education, studies were rated for the degree of technology integration. Higher integration (i.e., longer, more extensive richer in functionality use of educational technology) was deemed the treatment and lower integration was the control. In this study, the inter‐rater reliability for this rating step was even higher (κ = 0.80), and in the same range as in the current study.
We recognize that this form of high‐inference coding contains greater risk of bias than the standard designation of treatment/control, which is normally referred to as low‐inference coding. However, we see no other way to advance research synthesis in literatures such as this one beyond relatively simple comparisons between “either this or that” comparisons like the treatment/control designations that populate the educational research literature. The alternative, of course, is for primary researchers to refine their questions, but that will take some time in coming.
6.4. Agreements and disagreements with other studies or reviews
This study is in strong agreement with much of the primary and secondary literature surrounding the question of the veracity of Student‐Centered educational practices (See in particular Table 1 for a summary of Student‐Centered related practices). Of the several meta‐analyses that have investigated the efficacy of active learning (i.e., operationalized here as more Student‐Centered learning) most have found a positive effect for it. In particular, reviews by Prince (2004), Linton, Farmer, and Peterson (2014), Burch et al. (2014), and Freeman et al. (2014) support the use of various Student‐Centered strategies in different levels of educational practice. However, ours is the only meta‐analysis that has approached the question in this fashion. It is also the only meta‐analysis that has examined where, in the range of instructional practices, this advantage for Student‐Centered instruction resides. Some of these reviews concern particular areas in postsecondary education (e.g., STEM subjects) and some are more general. The current review looks at STEM learning and individual studies beyond STEM. While not significantly different, these comparisons point to a generally positive effect across all subject areas covered in the corpus of the reviewed literature.
There are also reviews of direct instruction that have found that there are advantages for lecture‐based or Teacher‐Centered instruction (e.g., Stockard, et al. 2018) but it is arguable that there is a place for both forms of instruction and that it is an open question as to what the joint contributions of Teacher‐Centered and Student‐Centered are.
7. AUTHORS’ CONCLUSIONS
This meta‐analysis provides strong evidence that Student‐Centered instruction leads to improvements in learning with k‐12 students. Not only is the overall random effects average medium in magnitude ( = 0.44), but there is also a demonstrated (subtle but significant) linear relationship between more Student‐Centered classroom instruction and effect size (p = .03). Taken together, these results support the efficacy of allowing students to engage in active learning or other forms of Student‐Centered as part of a comprehensive educational experience. It does not, however, diminish the potential advantages imbued by direct instruction (i.e., Teacher‐Centered practices). Delivering important content and other kinds of directive information to students will always be part of ordered classroom processes. As Gersten et al. (2008) have argued, there is little evidence that classrooms are organized as purely Teacher‐Centered or Student‐Centered.
In regards to the principal moderator variables—Teacher's role, Pacing, Flexibility, and Adaptability, it is not surprising that Teacher's role occupies a central place in facilitating Student‐Centered classrooms and that the relationship of this variable to effect size produces a significant positive linear trend. It is less understandable why Pacing produces an effect in meta‐regression that is significantly negative. Apparently, the pacing of instructional events in a classroom is more productive when it is less Student‐Centered than when it is more Student‐Centered. It is possible that pacing is best left under the control of the teacher or at least mostly influenced by the teacher.
Flexibility and Adaptability, as tested in meta‐regression, failed to produce a linear relationship with average effect size. However, it is arguable that these variables are not primary, but may play a role in combination with Teacher's Role that either enhances or diminishes achievement outcomes. Teacher's Role plus Adaptability appears to boost average effect sizes, while Teacher's Role plus Flexibility appears to diminish the average effect size. This inverted relationship is not too hard to understand if one considers the definitions of the two dimensions as they were operationalized in this study:
Flexibility is the individualized creation/use of study materials, course design; and
Adaptability is the provision of feedback to students and learning activities that are geared to the individual interests of students.
Flexibility concerns the creation/choice of learning materials, a role that students do not often assume, and Adaptability is operationalized as consideration for individual students in terms of appropriately designed learning activities and individualized feedback on those activities. Pacing, found to be a negative predictor of achievement, does not appear to interact with Teacher's Role.
7.1. Implications for practice and policy
This study does not provide specific instructions for the design and development of more Student‐Centered Classrooms. However, besides the overall finding that more verses less Student‐Centeredenteredness improves achievement outcomes, it does suggest where these practices might be applied most beneficially in specific domains of practice. We understand from these results that the teacher's role in creating an Student‐Centered classroom is critical. Given more freedom to develop intellectually as an individual and with peers (i.e., any of a variety of group‐based approaches) does appear to lead to better achievement outcomes compared to more direct forms of Teacher‐Centered instruction. This is one lesson that is worth learning and enacting across the k‐12 spectrum since there was no differentiation among grade levels. Similarly, there was no distinction between STEM and Non‐STEM courses, nor were any of the individual subject matters reliably different from one another. This suggests a universal phenomenon that is even more pronounced in Special Education courses compared to the general population of students.
7.2. Implications for research
As we have in the past (Bernard et al., 2009; Schmid et al., 2014) we argue that new research efforts in classroom‐based research move toward to more nuanced questions concerning practice. So much of classroom instruction asks the question, “Does alternative treatment X outperform classroom instruction or traditional educational practices.” There were a time and place for this either/or form of research, but as the efficacy of instructional approaches is validated, new questions about varieties of the new treatments need to be asked and answered. This quote from Bernard, Borokhovski, and Tamim (2019) expresses this sentiment in clear terms: “To use David Cook's (2009) analogy, can you imagine how far automobiles would have developed if they had always been compared to their reasonable alternative at the turn of the 20th century, the horse?” In spite of Henry Ford's declaration that “if I'd listened to my consumers, I'd have given them a faster horse” (Sherrington, 2003, p. 8), the driving public got something much better than a faster horse, largely because it was abandoned as the comparison condition (p. 20). Educational researchers should do the same.
INFORMATION ABOUT THIS REVIEW
Roles and responsibilities
The review team on this meta‐analysis possesses the breadth and depth of experience suggested by the Campbell Collaboration. The recommended optimal review team composition includes (a) at least one person on the review team who has content expertise (Bernard has 7 years of elementary education experience, three in a Student‐Centered school; Schmid is an Educational Psychologist focusing on instructional methods, and Waddington is an Educational Philosopher focusing on constructivist and Student‐Centered theory), (b) at least one person who has methodological expertise (Bernard and Borokhovski have authored and co‐authored many published meta‐analyses, including five published in Review of Educational Research), and conduct workshops in M‐A. methodology), and (c) at least one person who has statistical expertise (Bernard and Borokhovski both have extensive statistical experience and Bernard has taught statistical methods to M.A. and Ph.D. students for over 20 years). It is also (d) recommended having one person with information retrieval expertise (Pickup possesses an MLIS degree from McGill University, has been involved in retrieval and data management for our systematic review team for 5 years, and works as a methods reviewer for the Campbell Collaboration).
Responsibilities:
-
●
Content: Robert M. Bernard, Eugene Borokhovski, Richard F. Schmid, and David I. Waddington
-
●
Systematic review methods: Eugene Borokhovski and Robert M. Bernard
-
●
Statistical analysis: Robert M. Bernard and Eugene Borokhovski
-
●
Information retrieval: David Pickup
-
●
Update and revision: David Pickup and Eugene Borokhovski
SOURCES OF SUPPORT
Bernard, R. M. [PI], Borokhovski, E., Schmid, R. M., Waddington, D. I., & Pickup, D. (2016–2018). A Meta‐Analysis of 21st Century Adaptive Teaching and Individualized Learning Operationalized as Specific Blends of Student‐Centered Instructional Events. Jacobs Foundation and the Campbell Collaboration. Support: $50,000USD.
PLANS FOR UPDATING THE REVIEW
This review will be updated on an annual basis.
DECLARATIONS OF INTEREST
None of the authors are in conflict of interest with the goals or the outcomes of this meta‐analysis.
Publication bias analysis (See Figures 3–5 and Tables 1–4)
Methodological comparisons (sensitivity analysis; See Tables 5a–e)
Overall results (See Tables 6 and 7)
Results: Substantive moderator variables (See Tables 8a–b, 9a–d, 10, and 11a–b)
Demographic moderator variables (See Tables 12a–d)
Supporting information
Supplementary information
Bernard RM, Borokhovski E, Schmid RF, Waddington DI, Pickup DI. Twenty‐first century adaptive teaching and individualized learning operationalized as specific blends of student‐centered instructional events: A systematic review and meta‐analysis. Campbell Systematic Reviews. 2019;15:e1017. 10.1002/cl2.1017
Linked article:
References
REFERENCES
- Aiello, N. C. , & Wolfle, L. M. (1980). A meta‐analysis of individualized instruction in science. Paper presented at the annual meeting of the American Educational Research Association, Boston, MA. Retrieved from http://files.eric.ed.gov/fulltext/ED190404.pdf
- Aiken, W. M. (1942). The story of the eight‐year study, Adventures in American Education Vol. 1). New York: McGraw‐Hill. [Google Scholar]
- Azevedo, R. , & Bernard, R. M. (1995). A meta‐analysis of the effects of feedback in computer‐based instruction. Journal of Educational Computing Research, 13(2), 109–125. 10.2190/9LMD-3U28-3A0G-FTQT [DOI] [Google Scholar]
- Baepler, P. , Walker, J. D. , & Driessen, M. (2014). It's not about seat time: Blending, flipping, and efficiency in active learning classrooms. Computers & Education, 78, 227–236. 10.1016/j.compedu.2014.06.006 [DOI] [Google Scholar]
- Bangert, R. L. , & Kulik, J. A. (1982). Individualized systems of instruction: A meta‐analysis of findings in secondary schools. Paper presented at the annual meeting of the American Educational Research Association, New York, NY. Retrieved from http://eric.ed.gov/?id=ED220358
- Belland, B. R. , Walker, A. E. , Olsen, M. W. , & Leary, H. (2015). A pilot meta‐analysis of computer based scaffolding in STEM education. Educational Technology & Society, 18(1), 183–197. [Google Scholar]
- Bernard, R. M. , Borokhovski, E. , & Tamim, R. M. (2019). The state of research on distance, online, and blended learning from the perspectives of meta‐analyses and qualitative systematic reviews, Distance Education Research Handbook. New York, NY: Routledge. [Google Scholar]
- Bernard, R. M. , Rojo de Rubalcava, B. , & St‐Pierre, D. (2000). Collaborative online distance education: Issues for future practice and research. Distance Education, 21(2), 260–277. 10.1080/0158791000210205 [DOI] [Google Scholar]
- Bernard, R. M. , & Lundgren‐Cayrol, K. (2001). Computer conferencing: An environment for collaborative project‐based learning in distance education. Research and Evaluation in Education, 7(2‐3), 241–261. 10.1076/edre.7.2.241.3866 [DOI] [Google Scholar]
- Bernard, R. M. , Abrami, P. C. , Borokhovski, E. , Wade, A. , Tamim, R. , Surkes, M. , & Bethel, E. C. (2009). A meta‐analysis of three interaction treatments in distance education. Review of educational research, 79(3), 1243–1289. 10.3102/0034654309333844 [DOI] [Google Scholar]
- Bishop, J. L. , & Verleger, M. A. (2013). The flipped classroom: A survey of the research. In ASEE National Conference Proceedings, Atlanta, GA.
- Bloom, B. (1968). Learning for mastery. Evaluation Comment, 1(2), 1–11. [Google Scholar]
- Borenstein, M. , Hedges, L. , Higgins, J. , & Rothstein, H. (2014). Comprehensive Meta‐analysis Version 3. Englewood, NJ: Biostat. [Google Scholar]
- Borokhovski, E. , Bernard, R.M. , Tamim, R. , & Abrami, P.C. (2009, May). Establishing the direction of effect in meta‐analyses with multiple treatments (and no obvious control condition). Paper presented at the Campbell Collaboration Ninth Annual Colloquium, Oslo, Norway.
- Burch, G. F. , Batchelor, J. H. , Heller, N. A. , Shaw, J. , Kendall, W. , & Turner, B. (2014). Experiental learning – What do we know: A meta‐analysis of 40 years of research. Developments in Business Simulation and Experiential Learning, 41, 279–283. Retrieved from. https://journals.tdl.org/absel/index.php/absel/article/view/2127 [Google Scholar]
- Cobern, W. W. , Schuster, D. , Adams, B. , Applegate, B. , Skjold, B. , Undreiu, A. , … Gobert, J. D. (2010). Experimental comparison of inquiry and direct instruction in science. Research in Science & Technological Education, 28(1), 81–96. 10.1080/026351409035135999 [DOI] [Google Scholar]
- Cohen, J. (1988). Statistical Power Analysis for the Behavioral Sciences (2nd ed.). Hillsdale, NJ: Lawrence Erlbaum Associates. [Google Scholar]
- Cook, D. A. (2009). The failure of e‐learning research to inform educational practice, and what we can do about it. Medical Teacher, 31(2), 158–162. 10.1080/01421590802691393 [DOI] [PubMed] [Google Scholar]
- Cooper, H. (2017). Research Synthesis and Meta‐analysis: A Step‐by‐step Approach (5th ed.). Los Angeles, CA: SAGE Publications. [Google Scholar]
- Cooper H., Hedges L. V., & Valentine J. C. (Eds.), (2009). The Handbook of Research Synthesis and Meta‐analysis (2nd ed.). New York: Russell Sage Foundation. [Google Scholar]
- Duval, S. , & Tweedie, R. (2000). Trim and fill: A simple funnel‐plot–based method of testing and adjusting for publication bias in meta‐analysis. Biometrics, 56(2), 455–463. 10.1111/j.0006-341X.2000.00455.x [DOI] [PubMed] [Google Scholar]
- Dewey, J. (1938). Experience and Education. New York: Simon & Schuster. [Google Scholar]
- Eyre, H. L. (2007). Keller's personalized system of instruction: Was it a fleeting fancy or is there a revival on the horizon? The Behavior Analyst Today, 8(3), 317–324. 10.1037/h0100623 [DOI] [Google Scholar]
- Freeman, S. , Eddy, S. L. , McDonough, M. , Smith, M. K. , Okoroafor, N. , Jordt, H. , & Wenderoth, M. P. (2014). Active learning increases student performance in science, engineering, and mathematics. Proceedings of the National Academy of Sciences, 111(23), 8410‐8415. https://doi.org/10.1073 [DOI] [PMC free article] [PubMed]
- Gersten, R. , Chard, D. , Jayanthi, M. , Baker, S. , Morphy, P. , & Flojo, J. (2008). Mathematics Instruction for Students with Learning Disabilities or Difficulty Learning Mathematics: A Synthesis of the Intervention Research. Portsmouth, NH: RMC Research Corporation, Center on Instruction. [Google Scholar]
- Guskey, T. R. , & Gates, S. L. (1986). Synthesis of research on the effects of mastery learning in elementary and secondary schools. Educational Leadership, 43(8), 73–80. Retrieved from. http://www.ascd.org/ASCD/pdf/journals/ed_lead/el_198605_guskey.pdf [Google Scholar]
- Guskey, T. R. , & Pigott, T. D. (1988). Research on group‐based mastery learning programs: A meta‐analysis. Journal of Educational Research, 81(4), 197–216. [Google Scholar]
- Hastings, C. , Mosteller, F. , Tukey, J. W. , & Winsor, C. P. (1947). Low moments for small samples: A comparative study of order statistics. Annals of Mathematical Statistics, 18(3), 413–426. [Google Scholar]
- Hattie, J. (2008). Visible Learning: A Synthesis of over 800 Meta‐analyses Related to Achievement. London: Routledge. [Google Scholar]
- Hedges, L. V. , & Olkin, I. (1985). Statistical Methods for Meta‐analysis. Orlando, FL: Academic Press. [Google Scholar]
- Horak, V. M. (1981). A meta‐analysis of research findings on individualized instruction in mathematics. Journal of Educational Research, 74(4), 249–253. 10.1080/00220671.1981.10885318 [DOI] [Google Scholar]
- Huang, S. L. , & Shiu, J. ‐H. (2012). A user‐centric adaptive learning system for e‐learning 2.0. Educational Technology & Society, 15(3), 214–225. [Google Scholar]
- Huang, C.‐T. , & Yang, S. C. (2015). Effects of online reciprocal teaching on reading strategies, comprehension, self‐efficacy, and motivation. Journal of Educational Computing Research, 52(3), 381–407. 10.1177/0735633115571924 [DOI] [Google Scholar]
- Johnson, A. W. , & Johnson, R. (2002). Cooperative learning methods: A meta‐analysis. Journal of Research in Education, 12(1), 5–14. [Google Scholar]
- Johnson, D. W. , Johnson, R. T. , & Maruyama, G. (1983). Interdependence and interpersonal attraction among heterogeneous and homogeneous individuals: A theoretical formulation and a meta‐analysis of the research. Review of Educational Research, 53, 5–54. 10.3102/00346543053001005 [DOI] [Google Scholar]
- Keller, F. (1968). Good‐bye, teacher. Journal of Applied Behavior Analysis, 1(1), 79–89. 10.1901/jaba.1968.1-79 [DOI] [PMC free article] [PubMed] [Google Scholar]
- King, A. (1993). Sage on the stage to guide on the side. College Teaching, 41(1), 30–35. [Google Scholar]
- Kirschner, P. A. , Sweller, J. , & Clark, R. E. (2006). Why minimal guidance during instruction does not work: An analysis of the failure of constructivist, discovery, problem‐based, experiential, and inquiry‐based teaching. Educational Psychologist, 41, 75–86. 10.1207/s15326985ep4102_1 [DOI] [Google Scholar]
- Kolodner, J. L. (2004). The learning sciences: Past, present, and future. Educational Technology, 44(3), 37–42. [Google Scholar]
- Kolodner, J. L. , Camp, P. J. , Crismond, D. , Fasse, B. , Gray, J. , Holbrook, J. , & Ryan, M. (2003). Problem‐based learning meets case‐based reasoning in the middle‐school science classroom: Putting learning by design into practice. Journal of the Learning Sciences, 12(4), 495–547. 10.1207/S15327809JLS1204_2 [DOI] [Google Scholar]
- Kraft, M. A. , Blazar, D. , & Hogan, D. (2018). The effect of teacher coaching on instruction and achievement: A meta‐analysis of the causal evidence. Review of Educational Research, 88(4), 547–588. 10.3102/0034654318759268 [DOI] [Google Scholar]
- Kugley, S. , Wade, A. , Thomas, J. , Mahood, Q. , Jørgensen, A.‐M. K. , Hammerstrøm, K. T. , & Sathe, N. (2017). Searching for studies: A guide to information retrieval for Campbell systematic reviews. Retrieved from Campbell Collaboration website, 10.4073/cmg.2016.1 [DOI] [Google Scholar]
- Kulik, J. A. (1984). The fourth revolution in teaching: Meta‐analyses. Paper presented at the annual meeting of the American Educational Research Association, New Orleans, LA. Retrieved from http://eric.ed.gov/?id=ED244617
- Kulik, C. C. , Kulik, J. A. , & Bangert‐Drowns, R. L. (1990). Effectiveness of mastery learning programs: A meta‐analysis. Review of Educational Research, 60(2), 265–299. 10.3102/00346543060002265 [DOI] [Google Scholar]
- Kulik, J. A. , Kulik, C. C. , & Cohen, P. A. (1979). A meta‐analysis of outcome studies of Keller's Personalized System of Instruction. American Psychologist, 34, 307–318. 10.1037/0003-066X.34.4.307 [DOI] [Google Scholar]
- Linton, D. L. , Farmer, J. K. , & Peterson, E. (2014). Is peer interaction necessary for optimal active learning? CBE Life Sciences Education . CBE Life Sciences Education, 13(2), 243–252. 10.1187/cbe.13-10-0201 [DOI] [PMC free article] [PubMed] [Google Scholar]
- Lysakowski, R. S. , & Walberg, H. J. (1982). Instructional effects of cues, participation, and corrective feedback: A quantitative synthesis. American Educational Research Journal, 19(4), 559–578. 10.3102/00028312019004559 [DOI] [Google Scholar]
- Ma, W. , Adesope, O. O. , Nesbit, J. C. , & Liu, Q. (2014). Intelligent tutoring systems and learning outcomes: A Meta‐analysis. Journal of Educational Psychology, 106(4), 901–918. 10.1037/a0037123 [DOI] [Google Scholar]
- Magliaro, S. G. , Lockee, B. B. , & Burton, J. K. (2005). Direct instruction revisited: A key model for instructional technology. Educational Technology Research & Development, 53(4), 41–55. 10.1007/BF02504684 [DOI] [Google Scholar]
- Mazur, E. (1997). Peer instruction: Getting students to think in class. In Redish E. F., & Rigden J. S. (Eds.), The Changing Role of Physics Departments in Modern Universities, Part Two: Sample Classes (pp. 981–988). Woodbury NY: American Institute of Physics. [Google Scholar]
- National Mathematics Advisory Panel . (2008). Foundations for success: The final report of the National Mathematics Advisory Panel. Retrieved from https://www2.ed.gov/about/bdscomm/list/mathpanel/report/final‐report.pdf
- Orwin, R. G. (1983). A fail‐safe N for effect size in meta‐analysis. Journal of Educational Statistics, 8(2), 157–159. 10.2307/1164923 [DOI] [Google Scholar]
- Phillips, D. C. (1995). The good, the bad, and the ugly: The many faces of constructivism. Educational Researcher, 24(7), 5–12. 10.3102/0013189X024007005 [DOI] [Google Scholar]
- Prince, M. (2004). Does active learning work? A review of the research. Journal of Engineering Education, 93(3), 223–232. [Google Scholar]
- Schmid, R. F. , Bernard, R. M. , Borokhovski, E. , Tamim, R. M. , Abrami, P. C. , Surkes, M. A. , … Woods, J. (2014). The effects of technology use in postsecondary education: A meta‐analysis of classroom applications. Computers & Education, 72, 271–291. 10.1016/j.compedu.2013.11.002 [DOI] [Google Scholar]
- Schroeder, C. M. , Scott, T. P. , Tolson, H. , Huang, T.‐Y. , & Lee, Y.‐H. (2007). A meta‐analysis of national research: Effects of teaching strategies on student achievement in science in the United States. Journal of Research in Science Teaching, 44(10), 1436–1460. 10.1002/tea.20212 [DOI] [Google Scholar]
- Sherrington, M. (2003). Added Value: The Alchemy of Brand‐led Growth. New York, NY: Palgrave Macmillan. [Google Scholar]
- Slavin, R. E. (1987). Mastery learning reconsidered. Review of Educational Research, 57(2), 175–213. 10.3102/00346543057002175 [DOI] [Google Scholar]
- Stockard, J. , Wood, W. , Coughlin, C. , & Khoury, C. R. (2018). The effectiveness of direct instruction: A meta‐analysis of a half‐century of research. Review of Educational Research, 88(4), 479–507. 10.3102/0034654317751919 [DOI] [Google Scholar]
- Thompson, S. G. , & Higgins, J. P. T. (2002). How should meta‐regression analyses be undertaken and interpreted? Statistics in Medicine, 21, 1559–15773. 10.1002/sim.1187 [DOI] [PubMed] [Google Scholar]
- Tobias S., & Duffy T. M. (Eds.), (2009). Constructivist Instruction: Success or Failure. New York: Routledge. [Google Scholar]
- Zhang, Y. , Zhou, L. , Liu, X. , Liu, L. , Wu, Y. , Zhao, Z. , & Dong, Y. (2015). The effectiveness of the problem‐based learning teaching model for use in introductory Chinese undergraduate medical courses: A systematic review and meta‐Analysis. PLOS One, 10(3), e0120884. 10.1371/journal.pone.0120884 [DOI] [PMC free article] [PubMed] [Google Scholar]
References to Studies in the Review
- Abdullah, S. , & Shariff, A. (2008). The effects of inquiry‐based computer simulation with cooperative learning on scientific thinking and conceptual understanding of gas laws. EURASIA Journal of Mathematics, Science & Technology Education, 4(4), 387–398. 10.12973/ejmste/75365 [DOI] [Google Scholar]
- Agodini, R. , & Harris, B. (2010). An experimental evaluation of four elementary school math curricula. Journal of Research on Educational Effectiveness, 3(3), 199–253. 10.1080/19345741003770693 [DOI] [Google Scholar]
- Aguilar, A. C. (2008). Developing, transferring, and adapting self‐regulated learning processes (Doctoral dissertation). Available from ProQuest Dissertations and Theses database. (UMI No. 3326303)
- Akar, E. (2005). Effectiveness of 5e Learning Cycle Model on Students’ Understanding of Acid‐base Concepts. Middle East Technical University. (Unpublished master's thesis) [Google Scholar]
- Akinoglu, O. , & Tandogan, R. O. (2007). The effects of problem‐based active learning in science education on students' academic achievement, attitude and concept learning. EURASIA Journal of Mathematics, Science & Technology Education, 3(1), 71–81. 10.12973/ejmste/75375 [DOI] [Google Scholar]
- Akkus, H. , Kadayifci, H. , Atasoy, B. , & Geban, O. (2003). Effectiveness of instruction based on the constructivist approach on understanding chemical equilibrium concepts. Research in Science & Technological Education, 21(2), 209–227. 10.1080/0263514032000127248 [DOI] [Google Scholar]
- Akkus, R. , Gunel, M. , & Hand, B. (2007). Comparing an inquiry‐based approach known as the science writing heuristic to traditional science teaching practices: Are there differences? International Journal of Science Education, 29, 1745–1765. 10.1080/09500690601075629 [DOI] [Google Scholar]
- Akpinar, Y. (2014). Different modes of digital learning object use in school settings: Do we design for individual or collaborative learning? International Journal of Education and Development using Information and Communication Technology, 10(3), 87–95. [Google Scholar]
- Aksoy, G. , & Gurbuz, F. (2013). The effect of group research and cooperative reading‐writing‐application techniques in the unit of "what is the earth's crust made of?" On the academic achievements of the students and the permanent. Balkan Physics Letters, 21, 132–139. [Google Scholar]
- Alfassi, M. (2003). Promoting the will and skill of students at academic risk: An evaluation of an instructional design geared to foster achievement, self‐efficacy and motivation. Journal of Instructional Psychology, 30(1), 28–40. [Google Scholar]
- Alfassi, M. (2009). The efficacy of a dialogic learning environment in fostering literacy. Reading Psychology, 30(6), 539–563. 10.1080/02702710902733626 [DOI] [Google Scholar]
- Anderson‐Abrams, L. M. (2006). Empirically derived reading instruction: Developing word level skills with Breakthrough to Literacy's technology (Doctoral dissertation). Available from ProQuest Dissertations and Theses database. (UMI No. 3213642)
- Araz, G. , & Sungur, S. (2007). Effectiveness of problem‐based learning on academic performance in genetics. Biochemistry and Molecular Biology Education, 35(6), 448–451. 10.1002/bmb.97 [DOI] [PubMed] [Google Scholar]
- Artut, P. D. (2009). Experimental evaluation of the effects of cooperative learning on kindergarten children's mathematics ability. International Journal of Educational Research, 48(6), 370–380. 10.1016/j.ijer.2010.04.001 [DOI] [Google Scholar]
- Augustin, M. A. (2015). Effect of progress monitoring on reading achievement for students in a middle school setting (Doctoral dissertation). Available from ProQuest Dissertations and Theses database. (UMI No. 3687670)
- Azevedo, R. , Cromley, J. G. , Winters, F. I. , Moos, D. C. , & Greene, J. A. (2005). Adaptive human scaffolding facilitates adolescents' self‐regulated learning with hypermedia. Instructional Science: An International Journal of Learning and Cognition, 33(5‐6), 381–412. 10.1007/s11251-005-1273-8 [DOI] [Google Scholar]
- Balim, A. G. (2009). The effects of discovery learning on students' success and inquiry learning skills. Eurasian Journal of Educational Research, 9(35), 1–17. Retrieved from. http://www.ejer.com.tr/0DOWNLOAD/pdfler/eng/1177009234.pdf [Google Scholar]
- Barnes, L. J. (2008). Lecture‐free high school biology using an audience response system. American Biology Teacher, 70(9), 531–536. [Google Scholar]
- Barrus, A. (2013). Does self‐regulated learning‐skills training improve high‐school students' self‐regulation, math achievement, and motivation while using an intelligent tutor? (Doctoral dissertation). Available from ProQuest Dissertations and Theses database. (UMI No. 3559572)
- Bassett, M. M. , Martinez, J. , & Martin, E. P. (2014). Self‐directed activity‐based learning and achievement in high school chemistry. Education Research and Perspectives, 41(1), 73–94. [Google Scholar]
- Ben‐David, A. , & Zohar, A. (2009). Contribution of meta‐strategic knowledge to scientific inquiry learning. International Journal of Science Education, 31(12), 1657–1682. 10.1080/09500690802162762 [DOI] [Google Scholar]
- Berry, R. Q., III , & McClain, O. L. (2009). Contrasting pedagogical styles and their impact on African American students. In Martin D. B. (Ed.), Mathematics Teaching, Learning, and Liberation in the Lives of Black Children (pp. 123–144). New York, NY,US: Routledge/Taylor & Francis Group. [Google Scholar]
- Boulware‐Gooden, R. , Carreker, S. , Thornhill, A. , & Joshi, R. M. (2007). Instruction of metacognitive strategies enhances reading comprehension and vocabulary achievement of third‐grade students. Reading Teacher, 61(1), 70–77. 10.1598/RT.61.1.7 [DOI] [Google Scholar]
- Brown, D. S. (2003). High school biology: A group approach to concept mapping. American Biology Teacher, 65(3), 192–197. [Google Scholar]
- Burley, M. A. (2010). Working for social change: Using student‐centered instructional designs to improve achievement (Doctoral dissertation). Available from ProQuest Dissertations and Theses database. (UMI No. 3379796)
- Burris, S. (2005). Effect of problem‐based learning on critical thinking ability and content knowledge of secondary agriculture students (Doctoral dissertation). Available from ProQuest Dissertations and Theses database. (UMI No. 3322153)
- Caliskan, I. S. (2004). The Effect of Inquiry‐based Chemistry Course on Students’ Understanding of Atom Concept, Learning Approaches, Motivation, Self‐efficacy, and Epistemological Beliefs. Middle East Technical University. (Unpublished master's thesis) [Google Scholar]
- Camahalan, F. M. G. (2006). Effects of self‐regulated learning on mathematics achievement of selected Southeast Asian children. Journal of Instructional Psychology, 33(3), 194–205. [Google Scholar]
- Campbell, T. , Zhang, D. H. , & Neilson, D. (2011). Model based inquiry in the high school physics classroom: An exploratory study of implementation and outcomes. Journal of Science Education and Technology, 20(3), 258–269. 10.1007/s10956-010-9251-6 [DOI] [Google Scholar]
- Castano, C. (2008). Socio‐scientific discussions as a way to improve the comprehension of science and the understanding of the interrelation between species and the environment. Research in Science Education, 38(5), 565–587. 10.1007/s11165-007-9064-7 [DOI] [Google Scholar]
- Celikten, O. , Ipekcioglu, S. , Ertepinar, H. , & Geban, O. (2012). The effect of the conceptual change oriented instruction through cooperative learning on 4th grade students' understanding of earth and sky concepts. Science Education International, 23(1), 84–96. [Google Scholar]
- Cervetti, G. N. , Barber, J. , Dorph, R. , Pearson, P. D. , & Goldschmidt, P. G. (2012). The impact of an integrated approach to science and literacy in elementary school classrooms. Journal of Research in Science Teaching, 49(5), 631–658. 10.1002/tea.21015 [DOI] [Google Scholar]
- Chang, C.‐Y. (2001). Comparing the impacts of a problem‐based computer‐assisted instruction and the direct‐interactive teaching method on student science achievement. Journal of Science Education and Technology, 10(2), 147–153. 10.1023/A:1009469014218 [DOI] [Google Scholar]
- Chang, C.‐Y. (2002). The impact of different forms of multimedia CAI on students science achievement. Innovations in Education and Teaching International, 39(4), 280–288. 10.1080/13558000210161052 [DOI] [Google Scholar]
- Chang, C.‐Y. , Hsiao, C.‐H. , & Chang, Y.‐H. (2011). Science learning outcomes in alignment with learning environment preferences. Journal of Science Education & Technology, 20(2), 136–145. 10.1007/s10956-010-9240-9 [DOI] [Google Scholar]
- Chang, C.‐Y. , & Tsai, C.‐C. (2005). The interplay between different forms of CAI and students' preferences of learning environment in the secondary science class. Science Education, 89(5), 707–724. 10.1002/sce.20072 [DOI] [Google Scholar]
- Chang, H.‐Y. , Quintana, C. , & Krajcik, J. S. (2010). The impact of designing and evaluating molecular animations on how well middle school students understand the particulate nature of matter. Science Education, 94(1), 73–94. 10.1002/sce.20352 [DOI] [Google Scholar]
- Chang, K.‐E. , Sung, Y.‐T. , & Chen, I.‐D. (2002). The effect of concept mapping to enhance text comprehension and summarization. The Journal of Experimental Education, 71(1), 5–23. 10.1080/00220970209602054 [DOI] [Google Scholar]
- Chang, K.‐E. , Wu, L.‐J. , Lai, S.‐C. , & Sung, Y.‐T. (2016). Using mobile devices to enhance the interactive learning for spatial geometry. Interactive Learning Environments, 24(4), 916–934. 10.1080/10494820.2014.948458 [DOI] [Google Scholar]
- Chang, K. E. , Sung, Y. T. , & Chen, S. F. (2001). Learning through computer‐based concept mapping with scaffolding aid. Journal of Computer Assisted Learning, 17(1), 21–33. 10.1111/j.1365-2729.2001.00156.x [DOI] [Google Scholar]
- Chayarathee, S. , & Waugh, R. F. (2006). Teaching English as a foreign language to grade 6 students in Thailand: Cooperative learning versus Thai communicative method. In J. Renner, J. Cross & C. Bell (Eds.), Engagement and empowerment: New opportunities for growth in higher education: EDU‐COM 2006 conference proceedings, 22–24 November 2006 (pp. 120‐131). Joondalup, WA: Edith Cowan University. Retrieved from http://ro.ecu.edu.au/ceducom/69/
- Chen, C.‐H. , Wang, K.‐C. , & Lin, Y.‐H. (2015). The comparison of solitary and collaborative modes of game‐based learning on students' science learning and motivation. Educational Technology & Society, 18(2), 237–248. [Google Scholar]
- Chen, C.‐M. , Wang, J.‐Y. , Chen, Y.‐T. , & Wu, J.‐H. (2016). Forecasting reading anxiety for promoting English‐language reading performance based on reading annotation behavior. Interactive Learning Environments, 24(4), 681–705. 10.1080/10494820.2014.917107 [DOI] [Google Scholar]
- Choi, H. J. , & Johnson, S. D. (2007). The effect of problem‐based video instruction on learner satisfaction, comprehension and retention in college courses. British Journal of Educational Technology, 38(5), 885–895. 10.1111/j.1467-8535.2006.00676.x [DOI] [Google Scholar]
- Chuy, M. , Scardamalia, M. , Bereiter, C. , Prinsen, F. , Resendes, M. , Messina, R. , … Chow, A. (2010). Understanding the nature of science and scientific progress: A theory‐building approach. Canadian Journal of Learning and Technology, 36(1) 10.21432/T2GP4R [DOI] [Google Scholar]
- Cicalese, C. (2003). Children's Perspectives on Interactive Writing versus Independent Writing in Primary Grades. Union, NJ: Kean University. (Unpublished Master's thesis) [Google Scholar]
- Cobern, W. W. , Schuster, D. , Adams, B. , Applegate, B. , Skjold, B. , Undreiu, A. , … Gobert, J. D. (2010). Experimental comparison of inquiry and direct instruction in science. Research in Science & Technological Education, 28(1), 81–96. 10.1080/02635140903513599 [DOI] [Google Scholar]
- Conring, J. M. (2010). The effects of cooperative learning on mathematic achievement in second graders (Doctoral dissertation). Available from ProQuest Dissertations and Theses database. (UMI No. 3379802)
- Cook, L. L. (2008). Increasing middle grades math achievement through effective teaching practices (Doctoral dissertation). Available from ProQuest Dissertations and Theses database. (UMI No. 3288765)
- Cruse, A. R. (2012). Using hands‐on learning activities in high school mathematics classes to impact student success (Doctoral dissertation). Available from ProQuest Dissertations and Theses database. (UMI No. 3518540)
- Cuenca‐Sanchez, Y. , Mastropieri, M. A. , Scruggs, T. E. , & Kidd, J. K. (2012). Teaching students with emotional and behavioral disorders to self‐advocate through persuasive writing. Exceptionality, 20(2), 71–93. 10.1080/09362835.2012.669291 [DOI] [Google Scholar]
- Cuevas, J. A. , Russell, R. L. , & Irving, M. A. (2012). An examination of the effect of customized reading modules on diverse secondary students' reading comprehension and motivation. Educational Technology Research and Development, 60(3), 445–467. 10.1007/s11423-012-9244-7 [DOI] [Google Scholar]
- Damhuis, C. M. P. , Segers, E. , Scheltinga, F. , & Verhoeven, L. (2016). Effects of individualized word retrieval in kindergarten vocabulary intervention. School Effectiveness and School Improvement, 27(3), 441–454. 10.1111/j.1540-5826.2010.00310.x [DOI] [Google Scholar]
- Danili, E. , & Reid, N. (2004). Some strategies to improve performance in school chemistry, based on two cognitive factors. Research in Science & Technological Education, 22(2), 203–226. 10.1080/0263514042000290903 [DOI] [Google Scholar]
- Dano, J. B. (2009). Completing chemistry TAKS Objective 4(9D): The effect of flash animation (Master's thesis). Available from ProQuest Dissertations and Theses database. (UMI No. 1468393)
- Defauw, D. L. (2010). The effect of authentic contest‐writing instruction on third‐grade students' on‐demand prompt writing for standardized writing assessment (Doctoral dissertation). Available from ProQuest Dissertations and Theses database. (UMI No. 3438031)
- Dekker, R. , & Elshout‐Mohr, M. (2004). Teacher interventions aimed at mathematical level raising during collaborative learning. Educational Studies in Mathematics, 56(1), 39–65. 10.1023/B:EDUC.0000028402.10122.ff [DOI] [Google Scholar]
- Del Favero, L. , Boscolo, P. , Vidotto, G. , & Vicentini, M. (2007). Classroom discussion and individual problem‐solving in the teaching of history: Do different instructional approaches affect interest in different ways? Learning and Instruction, 17(6), 635–657. 10.1016/j.learninstruc.2007.09.012 [DOI] [Google Scholar]
- Demirci, C. (2009). Constructivist learning approach in science teaching. Hacettepe University Journal of Education, 37, 24–35. [Google Scholar]
- Dharmadasa, I. , & Silvern, S. B. (2000). Children's conceptualization of force: Experimenting and problem solving. Journal of Research in Childhood Education, 15(1), 88–103. 10.1080/02568540009594778 [DOI] [Google Scholar]
- Dickerson, D. , Clark, M. , Dawkins, K. , & Horne, C. (2006). Using science kits to construct content understandings in elementary schools. Journal of Elementary Science Education, 18(1), 43–56. 10.1007/BF03170653 [DOI] [Google Scholar]
- DiEnno, C. M. , & Hilton, S. C. (2005). High school students' knowledge, attitudes, and levels of enjoyment of an environmental education unit on nonnative plants. Journal of Environmental Education, 37(1), 13–25. 10.3200/JOEE.37.1.13-26 [DOI] [Google Scholar]
- Dobbs, V. (2008). Comparing student achievement in the problem‐based learning classroom and traditional teaching methods classroom (Doctoral dissertation). Available from ProQuest Dissertations and Theses database. (UMI No. 3297457)
- Dori, Y. J. , & Sasson, I. (2008). Chemical understanding and graphing skills in an honors case‐based computerized chemistry laboratory environment: The value of bidirectional visual and textual representations. Journal of Research in Science Teaching, 45(2), 219–250. 10.1002/tea.20197 [DOI] [Google Scholar]
- Drake, D. M. (2010). Developing mathematical ideas: An alternative pedagogy to teaching elementary mathematics (Doctoral dissertation). Available from ProQuest Dissertations and Theses database. (UMI No. 3396807)
- Drake, K. N. , & Long, D. (2009). Rebecca's in the dark: A comparative study of problem‐based learning and direct instruction/experiential learning in two 4th‐grade classrooms. Journal of Elementary Science Education, 21(1), 1–16. 10.1007/BF03174712 [DOI] [Google Scholar]
- Dresel, M. , & Haugwitz, M. (2008). A computer‐based approach to fostering motivation and self‐regulated learning. Journal of Experimental Education, 77(1), 3–18. 10.3200/JEXE.77.1.3-20 [DOI] [Google Scholar]
- Ebenezer, J. , Chacko, S. , Kaya, O. N. , Koya, S. K. , & Ebenezer, D. L. (2010). Effects of common knowledge construction model sequence of lessons on science achievement and relational conceptual change. Journal of Research in Science Teaching, 47(1), 25–46. 10.1002/tea.20295 [DOI] [Google Scholar]
- Ebrahim, A. (2004). The effects of traditional learning and a learning cycle inquiry learning strategy on students' science achievement and attitudes toward elementary science (Doctoral dissertation). Available from ProQuest Dissertations and Theses database. (UMI No. 3129129)
- Eliot, M. H. (2006). The effect of guided inquiry‐based instruction in secondary science for students with learning disabilities (Doctoral dissertation). Available from ProQuest Dissertations and Theses database. (UMI No. 3221043)
- Eysink, T. H. S. , de Jong, T. , Berthold, K. , Kolloffel, B. , Opfermann, M. , & Wouters, P. (2009). Learner performance in multimedia learning arrangements: An analysis across instructional approaches. American Educational Research Journal, 46(4), 1107–1149. 10.3102/0002831209340235 [DOI] [Google Scholar]
- Fabio, R. A. , & Antonietti, A. (2012). Effects of hypermedia instruction on declarative, conditional and procedural knowledge in ADHD students. Research in Developmental Disabilities, 33(6), 2028–2039. 10.1016/j.ridd.2012.04.018 [DOI] [PubMed] [Google Scholar]
- Faro, S. , & Swan, K. (2006). An investigation into the efficacy of the studio model at the high school level. Journal of Educational Computing Research, 35(1), 45–59. 10.2190/G6P7-1731-X1H7-38U2 [DOI] [Google Scholar]
- Fien, H. , Doabler, C. T. , Nelson, N. J. , Kosty, D. B. , Clarke, B. , & Baker, S. K. (2016). An examination of the promise of the numbershire level 1 gaming intervention for improving student mathematics outcomes. Journal of Research on Educational Effectiveness, 9(4), 635–661. 10.1080/19345747.2015.1119229 [DOI] [Google Scholar]
- Fortenberry C. L., & Walker B. J. (Eds.), (2006). Alternatives to Sounding Out: The Influence of Explicit Cueing Strategies Instruction on Word Identification in Second Grade Students. Readyville, TN: College Reading Association. [Google Scholar]
- Franke, G. , & Bogner, F. X. (2011). Conceptual change in students' molecular biology education: Tilting at windmills? The Journal of Educational Research, 104(1), 7–18. 10.1080/00220670903431165 [DOI] [Google Scholar]
- Fund, Z. (2007). The effects of scaffolded computerized science problem‐solving on achievement outcomes: A comparative study of support programs. Journal of Computer Assisted Learning, 23(5), 410–424. 10.1111/j.1365-2729.2007.00226.x [DOI] [Google Scholar]
- Furtak, E. M. (2012). Effects of autonomy‐supportive teaching on student learning and motivation. Journal of Experimental Education, 80(3), 284–316. 10.1080/00220973.2011.573019 [DOI] [Google Scholar]
- Gambari, I. A. , & Yusuf, M. O. (2016). Effects of computer‐assisted jigsaw ii cooperative learning strategy on physics achievement and retention. Contemporary Educational Technology, 7(4), 352–367. [Google Scholar]
- Gambrari, I. A. , Yusuf, M. O. , & Thomas, D. A. (2015). Effects of computer‐assisted STAD, LTM and ICI cooperative learning strategies on Nigerian secondary school students' achievement, gender and motivation in physics. Journal of Education and Practice, 6(19), 16–28. [Google Scholar]
- García‐Sánchez, J. ‐N. , & Fidalgo‐Redondo, R. (2006). Effects of two types of self‐regulatory instruction programs on students with learning disabilities in writing products, processes, and self‐efficacy. Learning Disability Quarterly, 29(3), 181–211. 10.2307/30035506 [DOI] [Google Scholar]
- Gaston, A. , Martinez, J. , & Martin, E. P. (2016). Embedding literacy strategies in social studies for eighth‐grade students. Journal of Social Studies Education Research, 7(1), 73–95. [Google Scholar]
- Gersten, R. , Baker, S. K. , Smith‐Johnson, J. , Dimino, J. , & Peterson, A. (2006). Eyes on the prize: Teaching complex historical content to middle school students with learning disabilities. Exceptional Children, 72(3), 264. 10.1177/001440290607200301 [DOI] [Google Scholar]
- Gillies, R. M. (2004). The effects of cooperative learning on junior high school students during small group learning. Learning and Instruction, 14(2), 197–213. 10.1016/S0959-4752(03)00068-9 [DOI] [Google Scholar]
- Gillies, R. M. , Nichols, K. , Burgh, G. , & Haynes, M. (2012). The effects of two strategic and meta‐cognitive questioning approaches on children's explanatory behaviour, problem‐solving, and learning during cooperative, inquiry‐based science. International Journal of Educational Research, 53, 93–106. 10.1016/j.ijer.2012.02.003 [DOI] [Google Scholar]
- Glaser, C. , & Brunstein, J. C. (2007). Improving fourth‐grade students' composition skills: Effects of strategy instruction and self‐regulation procedures. Journal of Educational Psychology, 99(2), 297–310. 10.1037/0022-0663.99.2.297 [DOI] [Google Scholar]
- Glaser‐Zikuda, M. , Fuss, S. , Laukenmann, M. , Metz, K. , & Randler, C. (2005). Promoting students' emotions and achievement‐‐Instructional design and evaluation of the ECOLE‐approach. Learning and Instruction, 15(5), 481–495. 10.1016/j.learninstruc.2005.07.013 [DOI] [Google Scholar]
- Golden, T. (2001). Assessing the effects of traditional and constructivist teaching methodologies on comprehension of content of an acids and bases chemistry unit in the 7th grade (Doctoral dissertation). Available from ProQuest Dissertations and Theses database. (UMI No. 3062895)
- Gonzales, W. D. W. , & Torres, P. L. (2015). Looking at CIRC through quantitative lenses: Can it improve the reading comprehension of Filipino ESL learners? Philippine ESL Journal, 15, 67–98. [Google Scholar]
- González‐Lamas, J. , Cuevas, I. , & Mateos, M. (2016). Arguing from sources: Design and evaluation of a programme to improve written argumentation and its impact according to students’ writing beliefs. Infancia y Aprendizaje, 39(1), 49–83. 10.1080/02103702.2015.1111606 [DOI] [Google Scholar]
- Graham, S. , Harris, K. R. , & Mason, L. (2005). Improving the writing performance, knowledge, and self‐efficacy of struggling young writers: The effects of self‐regulated strategy development. Contemporary Educational Psychology, 30(2), 207–241. 10.1016/j.cedpsych.2004.08.001 [DOI] [Google Scholar]
- Graham, S. , & Macaro, E. (2008). Strategy instruction in listening for lower‐intermediate learners of French. Language learning, 58(4), 747–783. 10.1111/j.1467-9922.2008.00478.x [DOI] [Google Scholar]
- Gürbüz, R. , & Birgin, O. (2012). The effect of computer‐assisted teaching on remedying misconceptions: The case of the subject “probability”. Computers & Education, 58(3), 931–941. 10.1016/j.compedu.2011.11.005 [DOI] [Google Scholar]
- Gurbuz, R. , Catlioglu, H. , Birgin, O. , & Erdem, E. (2010). An investigation of fifth grade students' conceptual development of probability through activity based instruction: A quasi‐experimental study. Educational Sciences: Theory and Practice, 10(2), 1053–1068. Retrieved from. http://files.eric.ed.gov/fulltext/EJ889200.pdf [Google Scholar]
- Guthrie, J. T. , & Klauda, S. L. (2014). Effects of classroom practices on reading comprehension, engagement, and motivations for adolescents. Reading Research Quarterly, 49(4), 387–416. 10.1002/rrq.81 [DOI] [PMC free article] [PubMed] [Google Scholar]
- Halberstam, M. (2008). Reciprocal teaching: The effects on reading comprehension of third grade students (Doctoral dissertation). Available from ProQuest Dissertations and Theses database. (UMI No. 3334047)
- Hamzah, M. S. , & Zain, A. N. (2010). The effect of cooperative learning with DSLM on conceptual understanding and scientific reasoning among form four physics students with different motivation levels. Bulgarian Journal of Science and Education Policy, 4(2), 275–310. [Google Scholar]
- Hanze, M. , & Berger, R. (2007). Cooperative learning, motivational effects, and student characteristics: An experimental study comparing cooperative learning and direct instruction in 12th grade physics classes. Learning and Instruction, 17(1), 29–41. 10.1016/j.learninstruc.2006.11.004 [DOI] [Google Scholar]
- Hardy, I. , Jonen, A. , & Möller, K. (2006). Effects of instructional support within constructivist learning environments for elementary school students' understanding of “floating and sinking”. Journal of Educational Psychology, 98(2), 307–326. 10.1037/0022-0663.98.2.307 [DOI] [Google Scholar]
- Hardy, I. , Jonen, A. , Möller, K. , & Stern, E. (2006). Effects of instructional support within constructivist learning environments for elementary school students' understanding of 'floating and sinking’. Journal of Educational Psychology, 98(2), 307–326. 10.1037/0022-0663.98.2.307 [DOI] [Google Scholar]
- Harskamp, E. , & Suhre, C. (2007). Schoenfeld's problem solving theory in a student controlled learning environment. Computers & Education, 49(3), 822–839. 10.1016/j.compedu.2005.11.024 [DOI] [Google Scholar]
- Hartley, K. (2001). Learning strategies and hypermedia instruction. Journal of Educational Multimedia and Hypermedia, 10(3), 285–305. [Google Scholar]
- Heard, P. F. , Divall, S. A. , & Johnson, S. D. (2000). Can 'ears‐on' help hands‐on science learning for girls and boys? International Journal of Science Education, 22(11), 1133–1146. 10.1080/09500690050166715 [DOI] [Google Scholar]
- Hernandez‐Ramos, P. , & De La Paz, S. (2009). Learning history in middle school by designing multimedia in a project‐based learning experience. Journal of Research on Technology in Education, 42(2), 151–173. [Google Scholar]
- Hilbert, T. S. , & Renkl, A. (2009). Learning how to use a computer‐based concept‐mapping tool: Self‐explaining examples helps. Computers in Human Behavior, 25(2), 267–274. [Google Scholar]
- Hitz, W. H., Jr. (2000). The effect of teaching methodologies on student achievement in mathematics: The traditional classroom method and the agricultural and environmental education project‐based experiential method (Doctoral dissertation). Available from ProQuest Dissertations and Theses database. (UMI No. 9998359)
- Ho, F. F. , & Boo, H. K. (2007). Cooperative learning: Exploring its effectiveness in the physics classroom. Asia‐Pacific Forum on Science Learning and Teaching, 8(2. Article 7. Retrieved from. http://www.ied.edu.hk/apfslt/download/v8_issue2_files/hoff.pdf [Google Scholar]
- Hogenes, M. , van Oers, B. , Diekstra, R. F. W. , & Sklad, M. (2016). The effects of music composition as a classroom activity on engagement in music education and academic and music achievement: A quasi‐experimental study. International Journal of Music Education, 34(1), 32–48. 10.1177/0255761415584296 [DOI] [Google Scholar]
- Holveck, S. E. (2012). Teaching for conceptual change in a density unit taught to 7th graders: Comparing two teaching methodologies‐‐‐Scientific inquiry and a traditional approach (Doctoral dissertation). Available from ProQuest Dissertations and Theses database. (UMI No. 3523345)
- Hoon, T. S. , Chong, T. S. , & Binti Ngah, N. A. (2010). Effect of an interactive courseware in the learning of matrices. Educational Technology & Society, 13(1), 121–132. [Google Scholar]
- Hsien‐Sheng, H. , Cheng‐Sian, C. , Chien‐Yu, L. , Chih‐Chun, C. , & Jyun‐Chen, C. (2014). The influence of collaborative learning games within different devices on student's learning performance and behaviours. Australasian Journal of Educational Technology, 30(6), 652–669. Retrieved from. https://ajet.org.au/index.php/AJET/article/view/347 [Google Scholar]
- Hsu, C.‐K. , Hwang, G.‐J. , Chuang, C.‐W. , & Chang, C.‐K. (2012). Effects on learners' performance of using selected and open network resources in a problem‐based learning activity. British Journal of Educational Technology, 43(4), 606–623. 10.1111/j.1467-8535.2011.01235.x [DOI] [Google Scholar]
- Hsu, Y.‐S. (2008). Learning about seasons in a technologically enhanced environment: The impact of teacher‐guided and student‐centered instructional approaches on the process of students' conceptual change. Science Education, 92(2), 320–344. 10.1002/sce.20242 [DOI] [Google Scholar]
- Huizenga, J. , Admiraal, W. , Akkerman, S. , & Dam, G. t (2009). Mobile game‐based learning in secondary education: Engagement, motivation and learning in a mobile city game. Journal of Computer Assisted Learning, 25(4), 332–344. 10.1111/j.1365-2729.2009.00316.x [DOI] [Google Scholar]
- Hwang, G.‐J. , Sung, H.‐Y. , Hung, C.‐M. , Huang, I. , & Tsai, C.‐C. (2012). Development of a personalized educational computer game based on students' learning styles. Educational Technology Research and Development, 60(4), 623–638. 10.1007/s11423-012-9241-x [DOI] [Google Scholar]
- Ibanez Orcajo, M. T. , & Martinez Aznar, M. (2007). Solving problems in genetics, part III: Change in the view of the nature of science. International Journal of Science Education, 29(6), 747–769. 10.1080/09500690600855369 [DOI] [Google Scholar]
- Işık, D. , & Tarim, K. (2009). The effects of the cooperative learning method supported by multiple intelligence theory on Turkish elementary students' mathematics achievement. Asia Pacific Education Review, 10(4), 465–474. 10.1007/s12564-009-9049-5 [DOI] [Google Scholar]
- Jaber, L. Z. , & Boujaoude, S. (2012). A macro‐micro‐symbolic teaching to promote relational understanding of chemical reactions. International Journal of Science Education, 34(7), 973–998. 10.1080/09500693.2011.569959 [DOI] [Google Scholar]
- Jack, L. M. (2016). An analysis of the implementation and the effect of jigsaw and think‐pair‐share cooperative learning strategies on ninth grade students' achievement in Algebra I (Doctoral dissertation). Available from ProQuest Dissertations and Theses database. (UMI No. 3689597)
- Jacklin, R. (2008). Building student knowledge: A study of project‐based learning to aid geography concept recall (Doctoral dissertation). Available from ProQuest Dissertations and Theses database. (UMI No. 3325337)
- Jackson, C. (2009). Effects of teacher‐directed and student‐centered instruction on science comprehension of eighth grade students (Master's thesis). Available from ProQuest Dissertations and Theses database. (UMI No. 1467064)
- Jang, S.‐J. (2010). The impact on incorporating collaborative concept mapping with coteaching techniques in elementary science classes. School Science and Mathematics, 110(2), 86–97. 10.1111/j.1949-8594.2009.00012.x [DOI] [Google Scholar]
- Jena, A. K. (2012). Does constructivist approach applicable through concept maps to achieve meaningful learning in science? Asia‐Pacific Forum on Science Learning and Teaching, 13(1. Retrieved from. http://www.ied.edu.hk/apfslt/download/v13_issue1_files/jena.pdf [Google Scholar]
- Jitendra, A. K. , Hoppes, M. K. , & Xin, Y. P. (2000). Enhancing main idea comprehension for students with learning problems: The role of a summarization strategy and self‐monitoring instruction. The Journal of Special Education, 34(3), 127–139. https://doi.org/002246690003400302 [Google Scholar]
- Johnson, E. (2010). Improving students' academic achievement through differentiated instruction (Doctoral dissertation). Available from ProQuest Dissertations and Theses database. (UMI No. 3413105)
- Johnson‐Glenberg, M. C. , Birchfield, D. A. , Tolentino, L. , & Koziupa, T. (2014). Collaborative embodied learning in mixed reality motion‐capture environments: Two science studies. Journal of Educational Psychology, 106(1), 86–104. 10.1037/a0034008 [DOI] [Google Scholar]
- D'On Jones, C. , Reutzel, D. R. , & Fargo, J. D. (2010). Comparing two methods of writing instruction: Effects on kindergarten students' reading skills. Journal of Educational Research, 103(5), 327–341. 10.1080/00220670903383119 [DOI] [Google Scholar]
- Juan, K. (2017). Effects of interactive software on student achievement and engagement in four secondary school geometry classes, compared to two classes with no technology integration (Doctoral dissertation). Available from ProQuest Dissertations and Theses database. (UMI No. 10154478)
- Justan, M. P. , & Omampo, C. B. (2002). Parallels between experiential learning method and inductive reasoning in mathematics using technology. Paper presented at the 6th World Multiconference on Systemics, Cybernetics and Informatics, 14‐18 July 2002, Orlando, FL.
- Kapur, M. (2010). Productive failure in mathematical problem solving. Instructional Science, 38(6), 523–550. 10.1007/s11251-009-9093-x [DOI] [Google Scholar]
- Ke, F. (2008). Alternative goal structures for computer game‐based learning. International Journal of Computer‐Supported Collaborative Learning, 3(4), 429–445. 10.1007/s11412-008-9048-2 [DOI] [Google Scholar]
- Kebritchi, M. , Hirumi, A. , & Bai, H. (2010). The effects of modern mathematics computer games on mathematics achievement and class motivation. Computers & Education, 55(2), 427–443. 10.1016/j.compedu.2010.02.007 [DOI] [Google Scholar]
- Kelly, G. (2013). Differentiated instruction in the classroom (Doctoral dissertation). Available from ProQuest Dissertations and Theses database. (UMI No. 3568331)
- Keselman, A. (2003). Supporting inquiry learning by promoting normative understanding of multivariable causality. Journal of Research in Science Teaching, 40(9), 898–921. 10.1002/tea.10115 [DOI] [Google Scholar]
- Kim, A.‐H. , Vaughn, S. , Klingner, J. K. , Woodruff, A. L. , Reutebuch, C. K. , & Kouzekanani, K. (2006). Improving the reading comprehension of middle school students with disabilities through computer‐assisted collaborative strategic reading. Remedial and Special Education, 27(4), 235–249. 10.1177/07419325060270040401 [DOI] [Google Scholar]
- Kim, J. S. , & White, T. G. (2008). Scaffolding voluntary summer reading for children in grades 3 to 5: An experimental study. Scientific Studies of Reading, 12(1), 1–23. 10.1080/10888430701746849 [DOI] [Google Scholar]
- Kim, M. H. (2013). Working collaboratively in virtual learning environments: Using Second Life with Korean high school students in history class (Doctoral dissertation). Available from ProQuest Dissertations and Theses database. (UMI No. 3554775)
- Kırık, Ö. T. , & Boz, Y. (2012). Cooperative learning instruction for conceptual change in the concepts of chemical kinetics. Chemistry Education Research and Practice, 13(3), 221–236. 10.1039/C1RP90072B [DOI] [Google Scholar]
- Kocakulah, M. S. , & Kural, M. (2010). Investigation of conceptual change about double‐slit interference in secondary school physics. International Journal of Environmental and Science Education, 5(4), 435–460. [Google Scholar]
- Kolloffel, B. , Eysink, T. H. S. , & de Jong, T. (2011). Comparing the effects of representational tools in collaborative and individual inquiry learning. International Journal of Computer‐Supported Collaborative Learning, 6(2), 223–251. 10.1007/s11412-011-9110-3 [DOI] [Google Scholar]
- Kong, N. W. , & Lai, K. S. (2005). ICT and constructivist strategies instruction for science and mathematics education. Journal of Science and Mathematics Education in Southeast Asia, 28(1), 138–160. [Google Scholar]
- Kong, S. C. (2008). The development of a cognitive tool for teaching and learning fractions in the mathematics classroom: A design‐based study. Computers & Education, 51(2), 886–899. 10.1016/j.compedu.2007.09.007 [DOI] [Google Scholar]
- Kostaris, C. , Sergis, S. , Sampson, D. G. , Giannakos, M. ç , & Pelliccione, L. (2017). Investigating the potential of the flipped classroom model in k‐12 ICT teaching and learning: An action research study. Journal of Educational Technology & Society, 20(1), 261–273. [Google Scholar]
- Kramarski, B. , & Mizrachi, N. (2006). Online discussion and self‐regulated learning: Effects of instructional methods on mathematical literacy. Journal of Educational Research, 99(4), 218–230. 10.3200/JOER.99.4.218-231 [DOI] [Google Scholar]
- Kroesbergen, E. H. , & van Luit, J. E. H. (2002). Teaching multiplication to low math performers: Guided versus structured instruction. Instructional Science, 30(5), 361–378. 10.1023/A:1019880913714 [DOI] [Google Scholar]
- Kroesbergen, E. H. , & Van Luit, J. E. H. (2005). Constructivist mathematics education for students with mild mental retardation. Short report. European Journal of Special Needs Education, 20(1), 107–116. 10.1080/0885625042000319115 [DOI] [Google Scholar]
- Kuhn, M. R. , Schwanenflugel, P. J. , Morris, R. D. , Mandel Morrow, L. , Gee Woo, D. , Meisinger, E. B. , … Stahl, S. A. (2006). Teaching children to become fluent and automatic readers. Journal of Literacy Research, 38(4), 357–387. 10.1207/s15548430jlr3804_1 [DOI] [PMC free article] [PubMed] [Google Scholar]
- Kuo, F.‐R. , Hwang, G.‐J. , & Lee, C.‐C. (2012). A hybrid approach to promoting students’ web‐based problem‐solving competence and learning attitude. Computers & Education, 58(1), 351–364. 10.1016/j.compedu.2011.09.020 [DOI] [Google Scholar]
- Kwon, O. N. , Park, J. S. , & Park, J. H. (2006). Cultivating divergent thinking in mathematics through an open‐ended approach. Asia Pacific Education Review, 7(1), 51–61. 10.1007/BF03036784 [DOI] [Google Scholar]
- Kwon, S. Y. , & Cifuentes, L. (2007). Using computers to individually‐generate vs. collaboratively‐generate concept maps. Educational Technology & Society, 10(4), 269–280. [Google Scholar]
- Kwon, S. Y. , & Cifuentes, L. (2009). The comparative effect of individually‐constructed vs. collaboratively‐constructed computer‐based concept maps. Computers & Education, 52(2), 365–375. 10.1016/j.compedu.2008.09.012 [DOI] [Google Scholar]
- Lai, C.‐H. , Yang, J. C. , Chen, F. C. , Ho, C. W. , & Chan, T. W. (2007). Affordances of mobile technologies for experiential learning: The interplay of technology and pedagogical practices. Journal of Computer Assisted Learning, 23(4), 326–337. 10.1111/j.1365-2729.2007.00237.x [DOI] [Google Scholar]
- Lamidi, B. T. , Oyelekan, O. S. , & Olorundare, A. S. (2015). Effects of mastery learning instructional strategy on senior school students’ achievement in the mole concept. Electronic Journal of Science Education, 19(5. Retrieved from. http://ejse.southwestern.edu/article/view/14594 [Google Scholar]
- Law, Y.‐K (2008). Effects of cooperative learning on second graders' learning from text. Educational Psychology, 28(5), 567–582. 10.1080/01443410701880159 [DOI] [Google Scholar]
- Law, Y.‐K. (2014). The role of structured cooperative learning groups for enhancing Chinese primary students’ reading comprehension. Educational Psychology, 34(4), 470–494. 10.1080/01443410.2013.860216 [DOI] [Google Scholar]
- Lazonder, A. W. , & Kamp, E. (2012). Bit by bit or all at once? Splitting up the inquiry task to promote children's scientific reasoning. Learning and Instruction, 22(6), 458–464. 10.1016/j.learninstruc.2012.05.005 [DOI] [Google Scholar]
- Lenhard, W. , Baier, H. , Endlich, D. , Schneider, W. , & Hoffmann, J. (2013). Rethinking strategy instruction: Direct reading strategy instruction versus computer‐based guided practice. Journal of research in reading, 36(2), 223–240. 10.1111/j.1467-9817.2011.01505.x [DOI] [Google Scholar]
- Leonard, W. H. , Speziale, B. J. , & Penick, J. E. (2001). Performance assessment of a standards‐based high school biology curriculum. American Biology Teacher, 63(5), 310–311. 313‐316 [Google Scholar]
- Lin, C. P. , Chen, W. , Yang, S. J. , Xie, W. , & Lin, C. C. (2014). Exploring students' learning effectiveness and attitude in group scribbles‐supported collaborative reading activities: A study in the primary classroom. Journal of Computer Assisted Learning, 30(1), 68–81. 10.1111/jcal.12022 [DOI] [Google Scholar]
- Liu, L. , & Hmelo‐Silver, C. E. (2009). Promoting complex systems learning through the use of conceptual representations in hypermedia. Journal of Research in Science Teaching, 46(9), 1023–1040. 10.1002/tea.20297 [DOI] [Google Scholar]
- Liu, T.‐Y. , & Chu, Y.‐L. (2010). Using ubiquitous games in an English listening and speaking course: Impact on learning outcomes and motivation. Computers & Education, 55(2), 630–643. 10.1016/j.compedu.2010.02.023 [DOI] [Google Scholar]
- Mandrin, P.‐A. , & Preckel, D. (2009). Effect of similarity‐based guided discovery learning on conceptual performance. School Science and Mathematics, 109(3), 133–145. 10.1111/j.1949-8594.2009.tb17949.x [DOI] [Google Scholar]
- Marinopoulos, D. , & Stavridou, H. (2002). The influence of a collaborative learning environment on primary students' conceptions about acid rain. Journal of Biological Education, 37(1), 18–25. 10.1080/00219266.2002.9655841 [DOI] [Google Scholar]
- Martens, L. R. (2005). The development of student metacognition and self‐regulated learning in the classroom by monitoring learning strategies and response‐certitude on assessments (Doctoral dissertation). Available from ProQuest Dissertations and Theses database. (UMI No. 3146553)
- Marusic, M. , & Slisko, J. (2012). Influence of three different methods of teaching physics on the gain in students' development of reasoning. International Journal of Science Education, 34(2), 301–326. 10.1080/09500693.2011.582522 [DOI] [Google Scholar]
- Mastropieri, M. A. , Scruggs, T. E. , Norland, J. J. , Berkeley, S. , McDuffie, K. , Tornquist, E. H. , & Connors, N. (2006). Differentiated curriculum enhancement in inclusive middle school science: Effects on classroom and high‐stakes tests. Journal of Special Education, 40(3), 130–137. 10.1177/00224669060400030101 [DOI] [Google Scholar]
- Maxfield, M. B. (2011). The effects of small group cooperation methods and question strategies on problem solving skills, achievement, and attitude during problem‐based learning (Doctoral dissertation). Available from ProQuest Dissertations and Theses database. (UMI No. 3459251)
- McKeough, A. , Davis, L. , Forgeron, N. , Marini, A. , & Fung, T. (2005). Improving story complexity and cohesion: A developmental approach to teaching story composition. Narrative Inquiry, 15(2), 241–266. 10.1075/ni.15.2.04mck [DOI] [Google Scholar]
- McManus, D. O. C. , Dunn, R. , & Denig, S. J. (2003). Effects of traditional lecture versus teacher‐constructed and student‐constructed self‐teaching instructional resources on short‐term science achievement and attitudes. American Biology Teacher, 65(2), 93–102. [Google Scholar]
- McNeill, K. L. , Lizotte, D. J. , Krajcik, J. , & Marx, R. W. (2006). Supporting students' construction of scientific explanations by fading scaffolds in instructional materials. Journal of the Learning Sciences, 15(2), 153–191. 10.1207/s15327809jls1502_1 [DOI] [Google Scholar]
- McWhorter, H. (2009). Facilitating high school student success through READ 180: Analysis of program impact using measures of academic progress (MAP) (Doctoral dissertation). Available from ProQuest Dissertations and Theses database. (UMI No. 3379873)
- Meluso, A. , Zheng, M. , Spires, H. A. , & Lester, J. (2012). Enhancing 5th graders' science content knowledge and self‐efficacy through game‐based learning. Computers & Education, 59(2), 497–504. 10.1016/j.compedu.2011.12.019 [DOI] [Google Scholar]
- Mercier, E. M. , & Higgins, S. E. (2013). Collaborative learning with multi‐touch technology: Developing adaptive expertise. Learning and Instruction, 25, 13–23. 10.1016/j.learninstruc.2012.10.004 [DOI] [Google Scholar]
- Mergendoller, J. R. , Maxwell, N. L. , & Bellisimo, Y. (2000). Comparing problem‐based learning and traditional instruction in high school economics. Journal of Educational Research, 93(6), 374–382. 10.1080/00220670009598732 [DOI] [Google Scholar]
- Mevarech, Z. R. , & Amrany, C. (2008). Immediate and delayed effects of meta‐cognitive instruction on regulation of cognition and mathematics achievement. Metacognition and Learning, 3(2), 147–157. 10.1007/s11409-008-9023-3 [DOI] [Google Scholar]
- Mevarech, Z. R. , & Kramarski, B. (2003). The effects of metacognitive training versus worked‐out examples on students' mathematical reasoning. British Journal of Educational Psychology, 73(4), 449–471. 10.1348/000709903322591181 [DOI] [PubMed] [Google Scholar]
- Michaux, R. P. (2011). The effects of reciprocal teaching on at‐risk 10th grade students (Doctoral dissertation). Available from ProQuest Dissertations and Theses database. (UMI No. 3479233)
- Milne, R. B. , Kelly, S. A. , & Webb, D. C. (2014). Effect of adaptivity on learning outcomes in an online intervention for rational number tutoring, “Woot Math,” for grades 3‐6: A multi‐site randomized controlled trial. Retrieved from Wootmath.com website: https://www.wootmath.com/research
- Mitchell, V. (2010). A quasi‐experimental study of the use of “Dr. Cupp's Readers” in comparison to traditional instruction of at‐risk second grade students' test scores (Doctoral dissertation). Available from ProQuest Dissertations and Theses database. (UMI No. 3397991)
- Molenaar, I. , Roda, C. , van Boxtel, C. , & Sleegers, P. (2012). Dynamic scaffolding of socially regulated learning in a computer‐based learning environment. Computers & Education, 59(2), 515–523. 10.1016/j.compedu.2011.12.006 [DOI] [Google Scholar]
- Morgan, K. , & Brooks, D. W. (2012). Investigating a method of scaffolding student‐designed experiments. Journal of Science Education and Technology, 21(4), 513–522. 10.1007/s10956-011-9343-y [DOI] [Google Scholar]
- Mueller, A. (2009). The effects of The Apple Genomics Project active‐learning lessons on high school students' knowledge, motivation and perceptions of learning experiences and teachers' perceptions of teaching experiences (Master's thesis). Available from ProQuest Dissertations and Theses database. (UMI No. 1469893)
- Muir, K. D. (2010). Comparing the effects of two asynchronous teaching methods, wikis and eBoards, on Spanish students' cultural proficiency (Doctoral dissertation). Available from ProQuest Dissertations and Theses database. (UMI No. 3407854)
- Nath, L. R. , & Ross, S. M. (2001). The influence of a peer‐tutoring training model for implementing cooperative groupings with elementary students. Educational Technology Research and Development, 49(2), 41–56. 10.1007/BF02504927 [DOI] [Google Scholar]
- Nelson‐Johnson, D. P. (2007). A mixed methods study of the effects of constructivist and traditional teaching on students in an after‐school mathematics program (Doctoral dissertation). Available from ProQuest Dissertations and Theses database. (UMI No. 3338145)
- Nicolaou, C. T. , Nicolaidou, I. A. , Zacharia, Z. C. , & Constantinou, C. P. (2007). Enhancing fourth graders' ability to interpret graphical representations through the use of microcomputer‐based labs implemented within an inquiry‐based activity sequence. Journal of Computers in Mathematics and Science Teaching, 26(1), 75–99. [Google Scholar]
- Nosal, E. M. (2013). It figures in their future: Assessing the impact of EverFi, a virtual environment, on learning high school personal finance (Doctoral dissertation). Available from ProQuest Dissertations and Theses database. (UMI No. 3606477)
- Nwagbo, C. (2006). Effects of two teaching methods on the achievement in and attitude to biology of students of different levels of scientific literacy. International Journal of Educational Research, 45(3), 216–229. 10.1016/j.ijer.2006.11.004 [DOI] [Google Scholar]
- Ocak, G. (2012). The application of portfolio technique in english lesson at the student centered education. Cukurova University Faculty of Education Journal, 41(1), 87–94. Retrieved from. http://dergipark.gov.tr/cuefd/issue/4133/54258 [Google Scholar]
- Olgun, O. S. , & Adali, B. (2008). Teaching grade 5 life science with a case study approach. Journal of Elementary Science Education, 20(1), 29–44. 10.1007/BF03174701 [DOI] [Google Scholar]
- Olson, C. B. , Land, R. , Anselmi, T. , & AuBuchon, C. (2010). Teaching secondary English learners to understand, analyze, and write interpretive essays about theme. Journal of Adolescent & Adult Literacy, 54(4), 245–256. 10.1598/JAAL.54.4.2 [DOI] [Google Scholar]
- Oortwijn, M. , Boekaerts, M. , & Vedder, P. (2008). The impact of the teacher's role and pupils' ethnicity and prior knowledge on pupils' performance and motivation to cooperate. Instructional Science: An International Journal of the Learning Sciences, 36(3), 251–268. 10.1007/s11251-007-9032-7 [DOI] [Google Scholar]
- Ozdilek, Z. , & Ozkan, M. (2009). The effect of applying elements of instructional design on teaching material for the subject of classification of matter. Turkish Online Journal of Educational Technology, 8(1. Article 9. Retrieved from. https://files.eric.ed.gov/fulltext/ED503906.pdf [Google Scholar]
- Pappa, E. , Zafiropoulou, M. , & Metallidou, P. (2003). Intervention on strategy use and on motivation of Greek pupils' reading comprehension in English classes. Perceptual and Motor Skills, 96(3), 773–786. 10.2466/pms.2003.96.3.773 [DOI] [PubMed] [Google Scholar]
- Parmer, S. M. , Salisbury‐Glennon, J. , Shannon, D. , & Struempler, B. (2009). School gardens: An experiential learning approach for a nutrition education program to increase fruit and vegetable knowledge, preference, and consumption among second‐grade students. Journal of nutrition education and behavior, 41(3), 212–217. 10.1016/j.jneb.2008.06.002 [DOI] [PubMed] [Google Scholar]
- Peşman, H. , & Özdemir, Ö. F. (2012). Approach–method interaction: The role of teaching method on the effect of context‐based approach in physics instruction. International Journal of Science Education, 34(14), 2127–2145. 10.1080/09500693.2012.700530 [DOI] [Google Scholar]
- Peters, E. , & Kitsantas, A. (2010). The effect of nature of science metacognitive prompts on science students' content and nature of science knowledge, metacognition, and self‐regulatory efficacy. School Science and Mathematics, 110(8), 382–396. 10.1111/j.1949-8594.2010.00050.x [DOI] [Google Scholar]
- Prewitt, S. L. , Hannon, J. C. , Colquitt, G. , Brusseau, T. A. , Newton, M. , & Shaw, J. (2015). Effect of personalized system of instruction on health‐related fitness knowledge and class time physical activity. Physical Educator, 72(5), 23–39. 10.18666/TPE-2015-V72-I5-6997 [DOI] [Google Scholar]
- Puntambekar, S. , & Stylianou, A. (2005). Designing navigation support in hypertext systems based on navigation patterns. Instructional Science, 33(5/6), 451–481. 10.1007/s11251-005-1276-5 [DOI] [Google Scholar]
- Queen, S. (2009). Effect of cooperative learning and traditional strategies on academic performance in middle school language arts (Doctoral dissertation). Available from ProQuest Dissertations and Theses database. (UMI No. 3355076)
- Radosevich, D. J. , Salomon, R. , Radosevich, D. M. , & Kahn, P. (2008). Using student response systems to increase motivation, learning, and knowledge retention. Innovate: Journal of Online Education, 5(1. Retrieved from. http://nsuworks.nova.edu/cgi/viewcontent.cgi?article=1035&context=innovate [Google Scholar]
- Raes, A. , Schellens, T. , De Wever, B. , & Vanderhoven, E. (2012). Scaffolding information problem solving in web‐based collaborative inquiry learning. Computers & Education, 59(1), 82–94. 10.1016/j.compedu.2011.11.010 [DOI] [Google Scholar]
- Ramirez, H. M. (2011). Effects of reading strategies and the writing process with written recasts on second language achievement (Doctoral dissertation). Available from ProQuest Dissertations and Theses database. (UMI No. 3466304)
- Randler, C. , & Bogner, F. X. (2007). Efficacy of two different instructional methods involving complex ecological content. International Journal of Science and Mathematics Education, 7(2), 315–337. 10.1007/s10763-007-9117-4 [DOI] [Google Scholar]
- Randler, C. , & Hulde, M. (2007). Hands‐on versus teacher‐centred experiments in soil ecology. Research in Science & Technological Education, 25(3), 329–338. 10.1080/02635140701535091 [DOI] [Google Scholar]
- Ravenel, J. , Lambeth, D. T. , & Spires, B. (2014). Effects of computer‐based programs on mathematical achievement scores for fourth‐grade students. Journal on School Educational Technology, 10(1), 8–21. [Google Scholar]
- Re, A. M. , Pedron, M. , Tressoldi, P. E. , & Lucangeli, D. (2014). Response to specific training for students with different levels of mathematical difficulties. Exceptional Children, 80(3), 337–352. 10.1177/0014402914522424 [DOI] [Google Scholar]
- Reis, S. M. , Eckert, R. D. , McCoach, D. B. , Jacobs, J. K. , & Coyne, M. (2008). Using enrichment reading practices to increase reading fluency, comprehension, and attitudes. Journal of Educational Research, 101(5), 299–315. 10.3200/JOER.101.5.299-315 [DOI] [Google Scholar]
- Repenning, A. , Ioannidou, A. , Luhn, L. , Daetwyler, C. , & Repenning, N. (2010). Mr. Vetro: Assessing a collective simulation framework. Journal of Interactive Learning Research, 21(4), 515–537. [Google Scholar]
- Reutzel, D. R. , Fawson, P. C. , & Smith, J. A. (2008). Reconsidering silent sustained reading: An exploratory study of scaffolded silent reading. Journal of Educational Research, 102(1), 37–50. 10.3200/JOER.102.1.37-50 [DOI] [Google Scholar]
- Reutzel, D. R. , Petscher, Y. , & Spichtig, A. N. (2012). Exploring the value added of a guided, silent reading intervention: effects on struggling third‐grade readers’ achievement. Journal of Educational Research, 105(6), 404–415. 10.1080/00220671.2011.629693 [DOI] [PMC free article] [PubMed] [Google Scholar]
- Reznitskaya, A. , Glina, M. , Carolan, B. , Michaud, O. , Rogers, J. , & Sequeira, L. (2012). Examining transfer effects from dialogic discussions to new tasks and contexts. Contemporary Educational Psychology, 37(4), 288–306. 10.1016/j.cedpsych.2012.02.003 [DOI] [Google Scholar]
- Ridlon, C. L. (2009). Learning mathematics via a problem‐centered approach: A two‐year study. Mathematical Thinking and Learning: An International Journal, 11(4), 188–225. 10.1080/10986060903225614 [DOI] [Google Scholar]
- Ritchie, D. C. , & Volkl, C. (2000). Effectiveness of two generative learning strategies in the science classroom. School Science and Mathematics, 100(2), 83–89. 10.1111/j.1949-8594.2000.tb17240.x [DOI] [Google Scholar]
- Roschelle, J. , Rafanan, K. , Bhanot, R. , Estrella, G. , Penuel, B. , Nussbaum, M. , & Claro, S. (2010). Scaffolding group explanation and feedback with handheld technology: Impact on students' mathematics learning. Educational Technology Research and Development, 58(4), 399–419. 10.1007/s11423-009-9142-9 [DOI] [Google Scholar]
- Rowe, J. P. (2013). Narrative‐centered tutorial planning with concurrent markov decision processes (Doctoral dissertation). Available from ProQuest Dissertations and Theses database. (UMI No. 3575820)
- Rule, A. C. , Dockstader, C. J. , & Stewart, R. A. (2006). Hands‐on and kinesthetic activities for teaching phonological awareness. Early Childhood Education Journal, 34(3), 195–201. 10.1007/s10643-006-0130-y [DOI] [Google Scholar]
- Sadeh, I. , & Zion, M. (2009). The development of dynamic inquiry performances within an open inquiry setting: A comparison to guided inquiry setting. Journal of Research in Science Teaching, 46(10), 1137–1160. 10.1002/tea.20310 [DOI] [Google Scholar]
- Sampson, V. , & Clark, D. (2009). The impact of collaboration on the outcomes of scientific argumentation. Science Education, 93(3), 448–484. 10.1002/sce.20306 [DOI] [Google Scholar]
- Samson, A. M. (2009). Comparing the effectiveness of interactive field, interactive class and non‐interactive class lecture teaching strategies to teach wetland ecology concepts to 6th grade science students (Master's thesis). Available from ProQuest Dissertations and Theses database. (UMI No. 1474412)
- Savio‐Ramos, C. A. (2015). A study of the self‐efficacy of personalized learning as a remediation tool in algebra (Doctoral dissertation). Available from ProQuest Dissertations and Theses database. (UMI No. 3732669)
- Schaal, S. , & Bogner, F. X. (2005). Human visual perception learning at workstations. Journal of Biological Education, 40(1), 32–37. 10.1080/00219266.2005.9656006 [DOI] [Google Scholar]
- Schultz, D. , Duffield, S. , Rasmussen, S. C. , & Wageman, J. (2014). Effects of the flipped classroom model on student performance for advanced placement high school chemistry students. Journal of Chemical Education, 91(9), 1334–1339. 10.1021/ed400868x [DOI] [Google Scholar]
- Servetti, S. (2010). Cooperative learning groups involved in a written error‐correction task: A case study in an Italian secondary school. European Education, 42(3), 7–25. 10.2753/EUE1056-4934420301 [DOI] [Google Scholar]
- Servetti, S. (2010). Cooperative learning as a correction and grammar revision technique: Communicative exchanges, self‐correction rates and scores. UStudent‐Centeredhina Education Review, 7(4), 12–22. [Google Scholar]
- Shaaban, K. (2006). An initial study of the effects of cooperative learning on reading comprehension, vocabulary acquisition, and motivation to read. Reading Psychology, 27(5), 377–403. 10.1080/02702710600846613 [DOI] [Google Scholar]
- Shachar, H. , & Fischer, S. (2004). Cooperative learning and the achievement of motivation and perceptions of students in 11th grade chemistry classes. Learning and Instruction, 14(1), 69–87. 10.1016/j.learninstruc.2003.10.003 [DOI] [Google Scholar]
- Sharifi Ashtiani, N. , & Babaii, E. (2007). Cooperative test construction: The last temptation of educational reform? Studies in Educational Evaluation, 33(3‐4), 213–228. 10.1016/j.stueduc.2007.07.002 [DOI] [Google Scholar]
- Shih, S.‐C. , Bor‐Chen, K. , & Yu‐Lung, L. (2012). Adaptively ubiquitous learning in campus math path. Journal of Educational Technology & Society, 15(2), 298–308. [Google Scholar]
- Shin, N. , Sutherland, L. M. , Norris, C. A. , & Soloway, E. (2012). Effects of game technology on elementary student learning in mathematics. British Journal of Educational Technology, 43(4), 540–560. 10.1111/j.1467-8535.2011.01197.x [DOI] [Google Scholar]
- Singh, S. S. B. , Rathakrishnan, B. , Sharif, S. , Talin, R. , & Eboy, O. V. (2016). The effects of geography information system (gis) based teaching on underachieving students' mastery goal and achievement. Turkish Online Journal of Educational Technology ‐ TOJET, 15(4), 119–134. [Google Scholar]
- So, W.‐M. W. , & Kong, S.‐C. (2007). Approaches of inquiry learning with multimedia resources in primary classrooms. Journal of Computers in Mathematics and Science Teaching, 26(4), 329–354. [Google Scholar]
- Sola, A. O. , & Ojo, O. E. (2007). Effects of project, inquiry and lecture‐demonstration teaching methods on senior secondary students' achievement in separation of mixtures practical test. Educational Research and Reviews, 2(6), 124–132. [Google Scholar]
- Souvignier, E. , & Kronenberger, J. (2007). Cooperative learning in third graders' jigsaw groups for mathematics and science with and without questioning training. British Journal of Educational Psychology, 77(4), 755–771. 10.1348/000709906X173297 [DOI] [PubMed] [Google Scholar]
- Souvignier, E. , & Mokhlesgerami, J. (2006). Using self‐regulation as a framework for implementing strategy instruction to foster reading comprehension. Learning and Instruction, 16(1), 57–71. 10.1016/j.learninstruc.2005.12.006 [DOI] [Google Scholar]
- Spörer, N. , & Brunstein, J. C. (2009). Fostering the reading comprehension of secondary school students through peer‐assisted learning: Effects on strategy knowledge, strategy use, and task performance. Contemporary Educational Psychology, 34(4), 289–297. 10.1016/j.cedpsych.2009.06.004 [DOI] [Google Scholar]
- Strand‐Cary, M. , & Klahr, D. (2008). Developing elementary science skills: Instructional effectiveness and path independence. Cognitive development, 23(4), 488–511. 10.1016/j.cogdev.2008.09.005 [DOI] [Google Scholar]
- Sturm, H. , & Bogner, F. X. (2008). Student‐oriented versus teacher‐centred: The effect of learning at workstations about birds and bird flight on cognitive achievement and motivation. International Journal of Science Education, 30(7), 941–959. 10.1080/09500690701313995 [DOI] [Google Scholar]
- Suh, S. , Kim, S. W. , & Kim, N. J. (2010). Effectiveness of MMORPG‐based instruction in elementary English education in Korea. Journal of Computer Assisted Learning, 26(5), 370–378. 10.1111/j.1365-2729.2010.00353.x [DOI] [Google Scholar]
- Sun, L.‐E. (2010). A study of the effects of reciprocal teaching as a reading strategy instruction on metacognitive awareness, self‐efficacy, and English reading comprehension of EFL junior high school students (Doctoral dissertation). Available from ProQuest Dissertations and Theses database. (UMI No. 3480319)
- Sung, H.‐Y. , Hwang, G.‐J. , & Chang, Y.‐C. (2016). Development of a mobile learning system based on a collaborative problem‐posing strategy. Interactive Learning Environments, 24(3), 456–471. 10.1080/10494820.2013.867889 [DOI] [Google Scholar]
- Suppapittayaporn, D. , Emarat, N. , & Arayathanitkul, K. (2010). The effectiveness of peer instruction and structured inquiry on conceptual understanding of force and motion: A case study from Thailand. Research in Science & Technological Education, 28(1), 63–79. 10.1080/02635140903513573 [DOI] [Google Scholar]
- Suppes, P. , Holland, P. W. , Hu, Y. , & Vu, M. ‐t (2013). Effectiveness of an individualized computer‐driven online math k‐5 course in eight California Title I elementary schools. Educational Assessment, 18(3), 162–181. 10.1080/10627197.2013.814516 [DOI] [Google Scholar]
- Swaak, J. , de Jong, T. , & van Joolingen, W. R. (2004). The effects of discovery learning and expository instruction on the acquisition of definitional and intuitive knowledge. Journal of Computer Assisted Learning, 20(4), 225–234. 10.1111/j.1365-2729.2004.00092.x [DOI] [Google Scholar]
- Tarhan, L. , & Acar, B. (2007). Problem‐based learning in an eleventh grade chemistry class: “Factors affecting cell potential”. Research in Science & Technological Education, 25(3), 351–369. 10.1080/02635140701535299 [DOI] [Google Scholar]
- Tarhan, L. , Ayar‐Kayali, H. , Urek, R. O. , & Acar, B. (2008). Problem‐based learning in 9th grade chemistry class: “Intermolecular forces”. Research in Science Education, 38(3), 285–300. 10.1007/s11165-007-9050-0 [DOI] [Google Scholar]
- Tarhan, L. , Ayyildiz, Y. , Ogunc, A. , & Sesen, B. A. (2013). A jigsaw cooperative learning application in elementary science and technology lessons: Physical and chemical changes. Research in Science & Technological Education, 31(2), 184–203. 10.1080/02635143.2013.811404 [DOI] [Google Scholar]
- Tarim, K. (2009). The effects of cooperative learning on preschoolers' mathematics problem‐solving ability. Educational Studies in Mathematics, 72(3), 325–340. 10.1007/s10649-009-9197-x [DOI] [Google Scholar]
- Tarim, K. , & Akdeniz, F. (2008). The effects of cooperative learning on Turkish elementary students' mathematics achievement and attitude towards mathematics using TAI and STAD methods. Educational Studies in Mathematics, 67(1), 77–91. 10.1007/s10649-007-9088-y [DOI] [Google Scholar]
- Terwel, J. , van Oers, B. , van Dijk, I. , & van den Eeden, P. (2009). Are representations to be provided or generated in primary mathematics education? Effects on transfer. Educational Research and Evaluation, 15(1), 25–44. 10.1080/13803610802481265 [DOI] [Google Scholar]
- Thadani, V. , Cook, M. S. , Griffis, K. , Wise, J. A. , & Blakey, A. (2010). The possibilities and limitations of curriculum‐based science inquiry interventions for challenging the “pedagogy of poverty”. Equity & Excellence in Education, 43(1), 21–37. 10.1080/10665680903408908 [DOI] [Google Scholar]
- Theodoropoulos, A. , Antoniou, A. , & Lepouras, G. (2016). Students teach students: Alternative teaching in Greek secondary education. Education and Information Technologies, 21(2), 373–399. 10.1007/s10639-014-9327-7 [DOI] [Google Scholar]
- Timmermans, R. E. , Van Lieshout, E. C. D. M. , & Verhoeven, L. (2007). Gender‐related effects of contemporary math instruction for low performers on problem‐solving behavior. Learning and Instruction, 17(1), 42–54. 10.1016/j.learninstruc.2006.11.005 [DOI] [Google Scholar]
- Tracy, B. , Reid, R. , & Graham, S. (2009). Teaching young students strategies for planning and drafting stories: The impact of self‐regulated strategy development. Journal of Educational Research, 102(5), 323–331. 10.3200/JOER.102.5.323-332 [DOI] [Google Scholar]
- Tsai, M.‐J. (2002). Do male students often perform better than female students when learning on computers? A study of Taiwanese eighth graders' computer education through strategic and cooperative learning. Journal of Educational Computing Research, 26(1), 67–85. 10.2190/9JW6-VV1P-FAX8-CGE0 [DOI] [Google Scholar]
- Tseng, J. C. R. , Chu, H.‐C. , Hwang, G.‐J. , & Tsai, C.‐C. (2008). Development of an adaptive learning system with two sources of personalization information. Computers & Education, 51(2), 776–786. 10.1016/j.compedu.2007.08.002 [DOI] [Google Scholar]
- Turkmen, H. (2009). An effect of technology based inquiry approach on the learning of “earth, sun, & moon” subject. Asia‐Pacific Forum on Science Learning and Teaching, 10(1. Article 5. Retrieved from. http://www.ied.edu.hk/apfslt/download/v10_issue1_files/turkmen.pdf [Google Scholar]
- Ugwu, O. , & Soyibo, K. (2004). The effects of concept and vee mappings under three learning modes on Jamaican eighth graders' knowledge of nutrition and plant reproduction. Research in Science & Technological Education, 22(1), 42–58. 10.1080/0263514042000187539 [DOI] [Google Scholar]
- Uwameiye, R. , & Titilayo, O. M. (2005). A comparative analysis of two methods of teaching financial accounting at senior secondary school. International Journal of Instructional Technology & Distance Learning, 2(11. Retrieved from. http://itdl.org/Journal/Nov_05/article03.htm [Google Scholar]
- Uzomah, S. L. (2012). Teaching mathematics to kindergarten students through a multisensory approach (Doctoral dissertation). Available from ProQuest Dissertations and Theses database. (UMI No. 3494578)
- Vadasy, P. F. , & Sanders, E. A. (2008). Repeated reading intervention: Outcomes and interactions with readers' skills and classroom instruction. Journal of Educational Psychology, 100(2), 272–290. 10.1037/0022-0663.100.2.272 [DOI] [Google Scholar]
- van Boxtel, C. , & van Drie, J. (2012). “That's in the time of the Romans!” Knowledge and strategies students use to contextualize historical images and documents. Cognition and Instruction, 30(2), 113–145. 10.1080/07370008.2012.661813 [DOI] [Google Scholar]
- van Klaveren, C. , Vonk, S. , & Cornelisz, I. (2017). The effect of adaptive versus static practicing on student learning – evidence from a randomized field experiment. Economics of Education Review, 58, 175–187. 10.1016/j.econedurev.2017.04.003 [DOI] [Google Scholar]
- Veermans, K. , van Joolingen, W. , & de Jong, T. (2006). Use of heuristics to facilitate scientific discovery learning in a simulation learning environment in a physics domain. International Journal of Science Education, 28(4), 341–361. 10.1080/09500690500277615 [DOI] [Google Scholar]
- Victor, A. M. (2005). The effects of metacognitive instruction on the planning and academic achievement of first and second grade children (Doctoral dissertation). Available from ProQuest Dissertations and Theses database. (UMI No. 3152786)
- Wagensveld, B. , Segers, E. , Kleemans, T. , & Verhoeven, L. (2015). Child predictors of learning to control variables via instruction or self‐discovery. Instructional Science, 43(3), 365–379. 10.1007/s11251-014-9334-5 [DOI] [Google Scholar]
- Walker, E. , Rummel, N. , & Koedinger, K. R. (2014). Adaptive intelligent support to improve peer tutoring in algebra. International Journal of Artificial Intelligence in Education, 24(1), 33–61. 10.1007/s40593-013-0001-9 [DOI] [Google Scholar]
- Wang, H.‐C. , Rosé, C. , & Chang, C.‐Y. (2011). Agent‐based dynamic support for learning from collaborative brainstorming in scientific inquiry. International Journal of Computer‐Supported Collaborative Learning, 6(3), 371–395. 10.1007/s11412-011-9124-x [DOI] [Google Scholar]
- Wang, T.‐H. (2011). Developing web‐based assessment strategies for facilitating junior high school students to perform self‐regulated learning in an e‐Learning environment. Computers & Education, 57(2), 1801–1812. 10.1016/j.compedu.2011.01.003 [DOI] [Google Scholar]
- Wanzek, J. , Vaughn, S. , Kent, S. C. , Swanson, E. A. , Roberts, G. , Haynes, M. , … Solis, M. (2014). The effects of team‐based learning on social studies knowledge acquisition in high school. Journal of Research on Educational Effectiveness, 7(2), 183–204. 10.1080/19345747.2013.836765 [DOI] [Google Scholar]
- Ward, J. D. , & Lee, C. L. (2004). Teaching strategies for FCS: Student achievement in problem‐based learning versus lecture‐based instruction. Journal of Family and Consumer Sciences, 96(1), 73–76. [Google Scholar]
- Washington, S. W. (2008). A quasi‐experimental comparative analysis of two teaching methods in mathematics education (Doctoral dissertation). Available from ProQuest Dissertations and Theses database. (UMI No. 3310451)
- Wassenburg, S. I. , Bos, L. T. , de Koning, B. , & van der Schoot, M. (2015). Effects of an inconsistency‐detection training aimed at improving comprehension monitoring in primary school children. Discourse processes, 52(5‐6), 463–488. 10.1080/0163853X.2015.1025203 [DOI] [Google Scholar]
- Watts, J. E. (2006). Benefits of storytelling methodologies in 4th and 5th grade historical instruction (Master's thesis). Available from ProQuest Dissertations and Theses database. (UMI No. 1437706)
- Waugh R. F., Bowering M. H., & Chayarathee S. (Eds.), (2005). Cooperative Learning Versus Communicative Thai Teaching of English as a Second Language for Prathom (Grade) 6 Students Taught in Thailand. Hauppauge, NY: Nova Science Publishers. [Google Scholar]
- Weiss, I. , Kramarski, B. , & Talis, S. (2006). Effects of multimedia environments on kindergarten children's mathematical achievements and style of learning. Educational Media International, 43(1), 3–17. 10.1080/09523980500490513 [DOI] [Google Scholar]
- Wesche, M. V. (2002). Effects of behaviorist and constructivist mathematics lessons on upper elementary students' learning about the area of a triangle (Doctoral dissertation). Available from ProQuest Dissertations and Theses database. (UMI No. 3045986)
- Wilder, S. , & Berry, L. (2016). Emporium model: The key to content retention in secondary math courses. Journal of Educators Online, 13(2), 53–75. [Google Scholar]
- Willson‐Quayle, A. M. (2001). The effects of child‐centered, teacher‐directed, and scaffolded instruction on low‐income, Latino preschoolers' task performance, motivation, and private speech (Doctoral dissertation). Available from ProQuest Dissertations and Theses database. (UMI No. 3003059)
- Wong, B. Y. L. , Hoskyn, M. , Jai, D. , Ellis, P. , & Watson, K. (2008). The comparative efficacy of two approaches to teaching sixth graders opinion essay writing. Contemporary Educational Psychology, 33(4), 757–784. 10.1016/j.cedpsych.2007.12.004 [DOI] [Google Scholar]
- Wood, L. C. (2012). Conceptual change and science achievement related to a lesson sequence on acids and bases among African American alternative high school students: A teacher's practical arguments and the voice of the “other” (Doctoral dissertation). Available from ProQuest Dissertations and Theses database. (UMI No. 3504164)
- Wright, J. , & Jacobs, B. (2003). Teaching phonological awareness and metacognitive strategies to children with reading difficulties: A comparison of the two instructional methods. Educational Psychology, 23(1), 17–45. 10.1080/01443410303217 [DOI] [Google Scholar]
- Wrzesien, M. , & Raya, M. A. (2010). Learning in serious virtual worlds: Evaluation of learning effectiveness and appeal to students in the e‐junior project. Computers & Education, 55(1), 178–187. 10.1016/j.compedu.2010.01.003 [DOI] [Google Scholar]
- Wu, Y.‐T. , & Tsai, C.‐C. (2005). Effects of constructivist‐oriented instruction on elementary school students cognitive structures. Journal of Biological Education, 39(3), 112–119. 10.1080/00219266.2005.9655977 [DOI] [Google Scholar]
- Yager, R. E. , & Akcay, H. (2008). Comparison of student learning outcomes in middle school science classes with an STS approach and a typical textbook dominated approach. RMLE Online: Research in Middle Level Education, 31(7), 1–16. 10.1080/19404476.2008.11462050 [DOI] [Google Scholar]
- Yagmur Sahin, E. (2013). The effect of jigsaw and cluster techniques on achievement and attitude in Turkish written expression. Hacettepe University Journal of Education, 28(2), 521–534. Retrieved from. http://dergipark.ulakbim.gov.tr/hunefd/article/view/5000048114/0 [Google Scholar]
- Yin, Y. , Shavelson, R. J. , Ayala, C. C. , Ruiz‐Primo, M. A. , Brandon, P. R. , Furtak, E. M. , … Young, D. B. (2008). On the impact of formative assessment on student motivation, achievement, and conceptual change. Applied Measurement in Education, 21(4), 335–359. 10.1080/08957340802347845 [DOI] [Google Scholar]
- Ysseldyke, J. , & Tardrew, S. (2007). Use of a progress monitoring system to enable teachers to differentiate mathematics instruction. Journal of Applied School Psychology, 24(1), 1–28. 10.1300/J370v24n01_01 [DOI] [Google Scholar]
- Yuruk, N. , Beeth, M. E. , & Andersen, C. (2009). Analyzing the effect of metaconceptual teaching practices on students' understanding of force and motion concepts. Research in Science Education, 39(4), 449–475. 10.1007/s11165-008-9089-6 [DOI] [Google Scholar]
- Zepeda, C. D. , Richey, J. E. , Ronevich, P. , & Nokes‐Malach, T. J. (2015). Direct instruction of metacognition benefits adolescent science learning, transfer, and motivation: An in vivo study. Journal of Educational Psychology, 107(4), 954–970. 10.1037/edu0000022 [DOI] [Google Scholar]
- Zhang, L. , Ayres, P. , & Chan, K. (2011). Examining different types of collaborative learning in a complex computer‐based environment: A cognitive load approach. Computers in Human Behavior, 27(1), 94–98. 10.1016/j.chb.2010.03.038 [DOI] [Google Scholar]
- Zhang, L. J. (2008). Constructivist pedagogy in strategic reading instruction: Exploring pathways to learner development in the English as a second language (ESL) classroom. Instructional Science, 36(2), 89–116. 10.1007/s11251-007-9025-6 [DOI] [Google Scholar]
- Zion, M. , Michalsky, T. , & Mevarech, Z. R. (2005). The effects of metacognitive instruction embedded within an asynchronous learning network on scientific inquiry skills. International Journal of Science Education, 27(8), 957–983. 10.1080/09500690500068626 [DOI] [Google Scholar]
- Zohar, A. , & David, A. B. (2008). Explicit teaching of meta‐strategic knowledge in authentic classroom situations. Metacognition and Learning, 3(1), 59–82. 10.1007/s11409-007-9019-4 [DOI] [Google Scholar]
- Zohar, A. , & Peled, B. (2008). The effects of explicit teaching of metastrategic knowledge on low‐ and high‐achieving students. Learning and Instruction, 18(4), 337–353. 10.1016/j.learninstruc.2007.07.001 [DOI] [Google Scholar]
- Zoubeir, W. F. (2000). Grafting computer projected simulations and interactive engagement methods within a traditional classroom setting: The influence on secondary level students' understanding of Newtonian mechanics and on attitudes towards physics (Doctoral dissertation). Available from ProQuest Dissertations and Theses database. (UMI No. 9988370)
- Zumbach, J. , Kumpf, D. , & Koch, S. (2004). Using multimedia to enhance problem‐based learning in elementary school. Information Technology in Childhood Education Annual, 2004(1), 25–37. [Google Scholar]
- Zydney, J. M. (2005). Eighth‐grade students defining complex problems: The effectiveness of scaffolding in a multimedia program. Journal of Educational Multimedia and Hypermedia, 14(1), 61–90. [Google Scholar]
Additional references
- Centers for Disease Control and Prevention (2012). CDC estimates 1 in 88 children in United States has been identified as having an autism spectrum disorder. Retrieved from: http://www.cdc.gov/media/releases/2012/p0329_autism_disorder.html
Associated Data
This section collects any data citations, data availability statements, or supplementary materials included in this article.
Supplementary Materials
Supplementary information