Keywords: amplitude modulation, auditory cortex, decision, lateral belt, single neuron
Abstract
Selective attention is necessary to sift through, form a coherent percept of, and make behavioral decisions on the vast amount of information present in most sensory environments. How and where selective attention is employed in cortex and how this perceptual information then informs the relevant behavioral decisions is still not well understood. Studies probing selective attention and decision-making in visual cortex have been enlightening as to how sensory attention might work in that modality; whether or not similar mechanisms are employed in auditory attention is not yet clear. Therefore, we trained rhesus macaques on a feature-selective attention task, where they switched between reporting changes in temporal (amplitude modulation, AM) and spectral (carrier bandwidth) features of a broadband noise stimulus. We investigated how the encoding of these features by single neurons in primary (A1) and secondary (middle lateral belt, ML) auditory cortex was affected by the different attention conditions. We found that neurons in A1 and ML showed mixed selectivity to the sound and task features. We found no difference in AM encoding between the attention conditions. We found that choice-related activity in both A1 and ML neurons shifts between attentional conditions. This finding suggests that choice-related activity in auditory cortex does not simply reflect motor preparation or action and supports the relationship between reported choice-related activity and the decision and perceptual process.
NEW & NOTEWORTHY We recorded from primary and secondary auditory cortex while monkeys performed a nonspatial feature attention task. Both areas exhibited rate-based choice-related activity. The manifestation of choice-related activity was attention dependent, suggesting that choice-related activity in auditory cortex does not simply reflect arousal or motor influences but relates to the specific perceptual choice.
INTRODUCTION
The auditory system is often faced with the difficult challenge of encoding a specific sound in a noisy environment, such as following a conversation in a loud room. The neural mechanisms by which the auditory system attends to one sound source and ignores distracting sounds are not yet understood. Studies probing the mechanisms underlying auditory attention in cortex have been largely concerned with task engagement, wherein the effects of active performance on neural activity are compared with those of passive listening. Studies in auditory cortex (AC) utilizing this paradigm have shown that task engagement can improve behaviorally relevant neural sound discrimination (1–8), modulate neuronal tuning (9–14), alter the structure of correlated variability within neural populations (15, 16), as well as other effects (17–20). Though informative, this active/passive paradigm makes it difficult to disentangle arousal and motor effects from the mechanisms more specifically employed in selectively attending to a single sound source or feature amidst auditory “clutter.”
Studies on the neural basis of auditory selective attention at the single neuron level are rare (21), and nonspatial auditory feature-selective attention has been relatively unexplored (22). Feature-selective attention, which segregates particular sound features, such as intensity or fundamental frequency, is essential for tasks such as discriminating between talkers in a noisy environment (23–27). Furthermore, it can prove useful for listeners to switch between attended sound features because the most distinctive feature dimensions may vary across sources (24, 27).
In visual cortex, feature-based attention has been suggested to follow a gain model similar to spatial attention, where responsivity to the attended feature increases in cells tuned to the attended feature and decreases in cells tuned to orthogonal features (28, 29). Studies of spatial attention in AC single neurons suggest that AC employs a mechanism similar to that reported in visual cortex, where a gain in neural activity increases when attention is directed into the receptive field of a neuron and, conversely, gain decreases when attention is directed outside the receptive field (12, 30, 31). We endeavored to see if feature-selective attention in AC is also facilitated by a gain in activity in neurons tuned to an attended feature.
How and where task relevant sensory information is transformed into a decision in the brain is still largely unclear. Reports of activity correlated to the reported decision in AC have been mixed where some have not found choice-related activity (32–34), some have found it in higher areas, but not A1 (35, 36), and some studies have found it as early as primary auditory cortex (A1) (1, 5, 35, 37–45). As one progresses further along the auditory cortical hierarchy, there is either an increasingly larger proportion of neurons showing activity correlated to the decision, or the nature of the choice signal changes (1, 36, 46). Both cases suggest that the sensory evidence informing task-relevant decisions is transformed as the information moves up the processing stream (23, 47–49).
There has also been uncertainty as to whether the reported choice activity in AC could be more reflective of motor influences than perceptual or decision-related influences. Go/No-Go tasks are typically used in auditory cortical studies, and these tasks require movement for report of one choice, but not the other (46, 50); forced-choice tasks reduce this uncertainty by requiring movements for either report (42). It has been well documented that movement can modulate auditory cortical activity (42, 51, 52). Here, we employ a Yes/No forced-choice task format in which a movement is required for both responses to disentangle motor-related from choice-related activity in AC.
We investigated whether a mechanism for feature-selective attention similar to feature-based attention in visual cortex is employed in primary (A1) and secondary (middle lateral belt, ML) auditory cortex using noise that was amplitude modulated (AM) or bandwidth restricted (ΔBW). Monkeys were presented sounds that varied either in spectral (ΔBW) or temporal (AM) dimensions, or both, and performed a detection task in which they reported change along one of these feature dimensions. In this study, we focus on the amplitude modulation feature, as it has been well studied and is a salient communicative sound feature for humans and other animals (53–56) and can be helpful in sound source segregation (24, 57). Spectral content changes were used as a difficulty-matched attentional control. We hypothesized we would see a gain in AM encoding when animals were cued to attend to that feature, compared with when they were cued to attend ΔBW changes. We also examined choice-related activity in AC, hypothesizing to find a larger proportion of neurons with significant choice-related activity in higher-order AC (ML) than in A1.
MATERIALS AND METHODS
Subjects
Subjects were two adult rhesus macaques, one male (13 kg, 14–16 yr old) and one female (7 kg, 17–19 yr old). All animals were fluid regulated, and all procedures were approved by the University of California–Davis Animal Care and Use Committee and met the requirements of the United States Public Health Service policy on experimental animal care.
Stimuli
Stimuli were constructed from broadband Gaussian (white) noise bursts (400 ms; 5 ms cosine ramped), 9 octaves in width (40 to 20,480 Hz). Four different seeds were used to create the carrier noise, which was frozen across trials. To introduce variance along spectral and temporal dimensions, the spectral bandwidth of the noise was narrowed (ΔBW) and/or the noise envelope was sinusoidally amplitude modulated (AM). The extent of variation in each dimension was manipulated to measure behavioral and neural responses above and below threshold for detecting each feature. It is important to note that some methods of generating ΔBW introduce variation in that sound’s envelope; however, we implemented a synthesis method that constructs noise using a single-frequency additive algorithm and thus avoids introducing envelope variations that could serve as cues for ΔBW (58).
Sound generation methods have been previously reported (59). Briefly, sound signals were produced using an in-house MATLAB program and a digital-to-analog converter [Cambridge Electronic Design (CED) model 1401]. Signals were attenuated (TDT Systems PA5, Leader LAT-45), amplified (RadioShack MPA-200), and presented from a single speaker (RadioShack PA-110) positioned ∼1.5 m in front of the subject centered at the interaural midpoint. Sounds were generated at a 100-kHz sampling rate. Intensity was calibrated across all sounds (Bruel & Kjaer model 2231) to 65 dB at the outer ear.
Recording Procedures
Each animal was implanted with a head post centrally behind the brow ridge and a recording cylinder over an 18-mm craniotomy over the left parietal lobe using aseptic surgical techniques (60). Placement of the craniotomy was based on stereotactic coordinates of auditory cortex to allow vertical access through parietal cortex to the superior temporal plane (61).
All recordings took place in a sound attenuating, foam-lined booth (IAC: 2.9 × 3.2 × 2 m) while subjects sat in an acoustically transparent chair (Crist Instruments). Three quartz-coated tungsten microelectrodes (Thomas Recording, 1–2 MΩ; 0.35-mm horizontal spacing; variable, independently manipulated vertical spacing) were advanced vertically to the superior surface of the temporal lobe.
Extracellular signals were amplified (AM Systems model 1800), bandpass filtered between 0.3 Hz and 10 kHz (Krohn-Hite 3382), and then converted to a digital signal at a 50-kHz sampling rate (CED model 1401). During electrode advancement, auditory responsive neurons were isolated by presenting various sounds while the subject sat passively. When at least one auditory responsive single unit was well isolated, we measured neural responses to the two features while the subjects sat passively awake. At least 10 repetitions of each of the following stimuli were presented: the unmodulated noise, each level of bandwidth restriction, and each of the possible AM test modulation frequencies (described in the Feature Attention Task section). We also measured pure tone tuning and responses to bandpass noise to aid in distinguishing area boundaries.
After completing these measures, experimental behavioral testing and recording began. When possible, tuning responses to the tested stimuli were again measured after task performance, to ensure stability of electrodes throughout the recording. Contributions of single units (SUs) to the signal were determined offline using principal components analysis-based spike sorting tools from Spike2 (CED). Single-unit waveform templates were generated using Spike2’s template forming algorithms, and spikes were assigned to matching templates. Single units were confirmed by their separability in principal-component space. Spiking activity was generally 4–5 times the visually assessed background noise level. Fewer than 0.1% of spike events assigned to single-unit clusters fell within a 1-ms refractory period window. Only recordings in which neurons were well isolated for at least 180 trials within each condition were included in analysis here.
Cortical Field Assessment
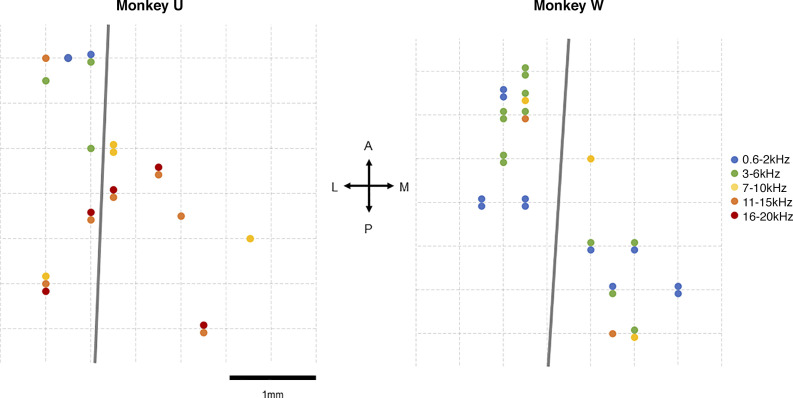
Recording locations were determined using both stereotactic coordinates (62) and established physiological measures (63–65). In each animal, we mapped characteristic frequency (CF) and preference between pure tones and bandpass noise to establish a topographic distribution of each (Fig. 1). Tonotopic gradient reversal, BW distribution, spike latency, and response robustness to pure tones was used to estimate the boundary between A1 and ML and assign single units to an area (7, 16). Recordings were assigned to their putative cortical fields post hoc using recording location, tuning preferences, and latencies.
Figure 1.
Tonotopic maps for both animals. We have included here tuning preferences from sessions that were not included in this study to present a fuller example of the recording areas. Gray lines indicate putative A1/ML borders. Arrows in center indicate anterior-posterior and medial-lateral orientation.
Feature Attention Task
This feature attention task has been previously described in detail (22). The subjects performed a change detection task in which only changes in the attended feature were relevant for the task. Subjects moved a joystick laterally to initiate a trial, wherein an initial sound (the S1, always the 9-octave-wide broadband, unmodulated noise) was presented, followed by a second sound (S2) after a 400 ms interstimulus interval (ISI). The S2 could be identical to the S1, it could change by being amplitude modulated (AM), it could change by being bandwidth restricted (ΔBW), or it could change along both feature dimensions.
Only three values of each feature (AM, ΔBW) were presented, limiting the size of the stimulus set to obtain a reasonable number of trials for each stimulus under each attention condition to compare in analyses. The stimulus space was further reduced by presenting only a subset of the possible covarying stimuli. Within each recording session, we presented 13 total stimuli. To equilibrate difficulty between the two features, we presented values of each feature so that one was near each animal’s behavioral threshold of detection, one was slightly above, and one far above threshold.
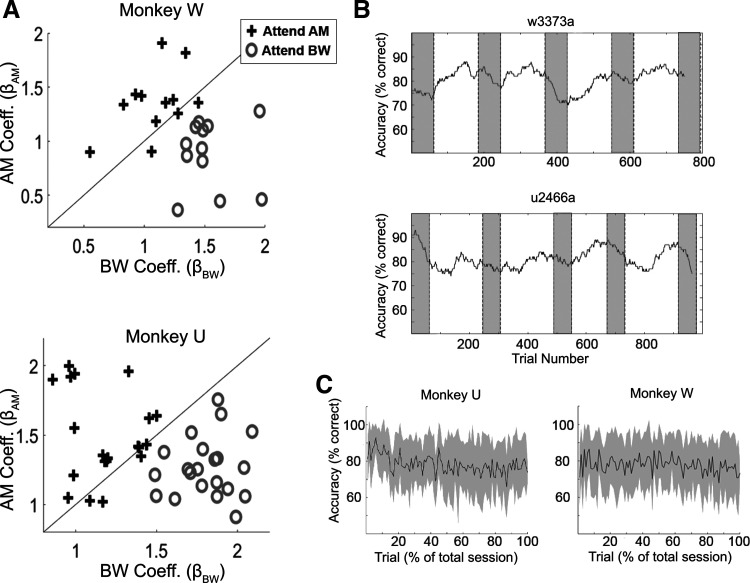
Thresholds were determined for each feature and subject independently using six levels of each feature before choosing three values and beginning the covarying feature attention task. For Monkey U, the ΔBW values were 0.375, 0.5, and 1 octave (8.625, 8.5, and 8 octaves wide carrier, respectively) and the AM depth values were 28%, 40%, and 100%. For Monkey W, the ΔBW values were 0.5, 0.75, and 1.5 octaves (8.5, 8.25, and 7.5 octave wide carrier, respectively) and the AM depth values were 40%, 60%, and 100%. For all analyses in which data are collapsed across subjects, ΔBW values and AM values are presented as ranks (ΔBW 0–3 and AM 0–3). Each animal’s behavioral performance during feature attention was similar at these values. For AM 1, they were slightly above chance (Monkey W 53% correct, Monkey U 59%), for AM2, they were better (Monkey W 71% correct, Monkey U 75% correct) and they were quite good at detecting AM3 (Monkey W 86% correct, Monkey U 89% correct). Performance was similar for increasing values of ΔBW where Monkey W performed at 54%, 73%, and 90% correct, and Monkey U performed at 65%, 76%, and 88% correct for ΔBW 1–3, respectively. Performance was calculated for each session with a regression model (22). We used a binomial logistic regression to determine the extent to which the rank value of a given feature affects the probability of the animal making a “target-present” report. Conceptually, as the influence of a given feature (e.g., AM) on the probability of the subject responding “target-present” increases, the regression coefficient (e.g., βAM in this example) will increase. If one of the features has no effect on the behavioral response, its beta coefficient will be 0. This regression showed that, in general, the monkeys were performing the task using the appropriate feature (Fig. 2A). When combining 1) the stimulus construction of Strickland and Viemeister, 2) the broad frequency spectrum of even the most restricted stimuli, 3) the animals’ behavior, and 4) that we saw results that depended on performing ΔBW detection, the notion that bandwidth restriction is providing temporal envelope cues that are the primary driver of performance is not supported. There was also no systematic relationship of performance drifts with early or late trials within a session or block (Fig. 2, B and C). Behavior from the A1 sessions have been previously reported in more detail (22), and performance was similar during the ML recording sessions.
Figure 2.
Animals’ behavioral performance. A: performance of each animal by attention condition, shown by the regression coefficients that correspond to the influence of each feature on the animals’ response. Each symbol identifies a single recording session. Increases in coefficient values represent an increased probability that the animal will report “yes” as the level of that feature increases. Both animals’ behavioral responses are influenced more strongly by the target feature than the distractor feature. This analysis is identical to that of Downer et al. (22), but now has added the ML sessions. B: examples of performance over time during a behavioral session. Performance would fluctuate across a session but did not tend to systematically get worse near the end of the session. Gray rectangles indicate instruction trials at the beginning of a new block. Titles over plots in B denote the session from which the data were recorded. C: average performance across all sessions by percent of total trials for each monkey. AM, amplitude modulation; BW, bandwidth; ML, middle lateral belt.
Within a given session, AM sounds were presented at only a single modulation frequency. Across sessions, a small set of frequencies was used (15, 22, 30, 48, and 60 Hz). The AM frequency was selected randomly each day. Subjects were cued visually via an LED above the speaker as to which feature to attend (green or red light, counterbalanced between subjects). Additionally, before each block of feature attention trials, there was a 60-trial instruction block in which the S2s presented were only altered along the target feature dimension (i.e., sounds containing the distractor feature were not presented). Subjects were to respond with a “yes” (up or down joystick movement, counterbalanced across subjects) on any trial in which the attended feature was presented, otherwise, the correct response was “no” (opposite joystick movement). We chose upward or downward joystick movement to avoid influences on single neuron choice activity dependent on contralateral movements. Such movement-related activity has been recently reported in other studies (42). Hits and correct rejections were rewarded with a drop of water or juice, and misses and false alarms resulted in a penalty (3–5 s timeout).
During the test conditions, the S2 was unmodulated broadband noise (no change from S1) on 25% of the trials, covarying on 25% of the trials, and contained only ΔBW or AM on 25% of the trials, respectively. Sounds in the set were presented pseudorandomly such that, over sets of 96 trials, the entire stimulus set was presented exhaustively (including all four random noise seeds). Block length was variable, based in part on subjects’ performance, to ensure a sufficient number of correct trials for each stimulus. Not including instruction trials, block length was at least 180 trials and at most 360 trials, to ensure that subjects performed in each attention condition at least once during the experiment. Subjects could perform each attention condition multiple times within a session. Only sessions in which subjects completed at least 180 trials per condition (excluding instruction trials) were considered for analysis in this study.
Analysis of Single Neuron Feature Selectivity
Spike counts (SC) were calculated over the entire 400-ms stimulus window. SCs in response to feature-present stimuli were normalized over the entire spike count distribution across both features, including unmodulated noise, for that cell. To characterize this response function, we calculated a feature-selectivity index (FSI) for each feature as follows:
| (1) |
| (2) |
where SCx is the mean SC in response to the given set of stimuli designated by the subscript. A Kruskal–Wallis rank-sum test was performed between distributions of SCs with the feature-present (feature level greater than 0) and those with the feature-absent (feature value of 0) to determine the significance of the FSI for each neuron. Cells that had a significant FSI for a given feature were categorized as encoding that feature with firing rate. Neurons were classified as having “increasing” (or “decreasing”) responses to a feature if their FSI was greater than (or less than) zero for that feature.
Phase-Projected Vector Strength
Vector strength (VS) is a metric that describes the degree to which the neural response is phase locked to the stimulus (66, 67). VS is defined as:
| (3) |
where n is the number of spikes over all trials and θi is the phase of each spike, in radians, calculated by:
| (4) |
Where ti is the time of the spike (in ms) relative to the onset of the stimulus and p is the modulation period of the stimulus (in ms). When spike count is low, VS tends to be spuriously high. Phase-projected vector strength (VSpp) is a variation on VS developed to help mitigate issues with low SC trials (68). VSpp is calculated by first calculating VS for each trial, then comparing the mean phase angle of each trial to the mean phase angle of all trials. The trial VS value is penalized if out of phase with the global mean response. VSpp is defined as:
| (5) |
where VSpp is the phase-projected vector strength per trial, VSt is the vector strength per trial, as calculated in Eq. 1, and φt and φc are the trial-by-trial and mean phase angle in radians, respectively, calculated for each stimulus by:
| (6) |
where n is the number of spikes per trial (for φt) or across all trials (for φc). In this report, we use VSpp exclusively to measure phase locking, as SC tended to be relatively low and VS and VSpp tend to be in good agreement with the exception of low SCs where VSpp tends to be more accurate than VS (68). To determine significance of VSpp encoding for each neuron, a Kruskal–Wallis rank-sum test was preformed between distributions of VSpp values on trials with nonzero AM depths, to those from unmodulated noise trials. Of note, VSpp in response to an unmodulated stimulus is a control measurement assuming the same modulation frequency as the corresponding AM frequency from that recording session.
Analysis of Neural Discriminability
We applied the area under the receiver operating characteristic (ROCa), a signal detection theory-based (69), to measure how well neurons could detect each feature. ROCa represents the probability an ideal observer can detect the presence of the target feature given only a measure of the neural responses (either firing rate or VSpp). To calculate ROCa, we partitioned the trial-by-trial neural responses into two distributions: those when the target feature was present in the stimulus and trials where it was absent. Then we determined the proportion of trials in each group where the neural response exceeds a criterion value. We repeated the measure using 100 criterion values, covering the whole range of responses. The graph of the probability of exceeding the criterion for feature-present trials (neural “hits”) versus the probability of exceeding the criterion for feature-absent trials (neural false alarms) plotted for all 100 criteria as separate points creates the ROC. The area under this curve is the ROCa. ROCa is bounded by 0 and 1, where both extremes indicate perfect discrimination between target feature-present and target feature-absent stimuli, and 0.5 indicates a chance level of discrimination between the two distributions.
Analysis of Choice-Related Activity
Choice probability (CP) is an application of ROC analysis used to measure the difference between neural responses contingent on what the animal reports, for example, whether a stimulus feature is present or absent (70, 71). Similar to ROCa described above, CP values are bounded by 0 and 1, and a CP value of 0.5 indicates no difference (or perfect overlap) in the neural responses between “feature-present” and “feature-absent” reports. A CP value of 1 means for every trial that the animal reports a feature, the neuron fired more than on trials where the animal did not report the feature. A CP value of 0 means that, for every trial that the animal reports a feature, the neuron fired less than on trials where the animal did not report the feature. Stimuli that did not have at least five “yes” and five “no” responses were excluded from analyses. CP was calculated based on both firing rate and on VSpp. For rate-based CP, we calculated CP both for each stimulus separately and pooled across stimuli. We calculated this stimulus-pooled CP by first separating the “yes” and “no” response trials within stimulus, then converting these rates into Z-scores within a stimulus, then combined these Z-scored responses across stimuli. This type of Z-scoring has been found to be conservative in estimating CP (72). CP was calculated during both the 400-ms stimulus presentation (S2) and during the response window (RW), the time after stimulus offset and before the response (typically ∼0.2–3.0 s). The significance of each neuron’s CP was determined using a permutation test (71). The neural responses were pooled between the “feature-present report” and “feature-absent report” distributions, and random samples were taken (without replacement). CP was then calculated from this randomly sampled set. This procedure was repeated 2,000 times. The P value is the proportion of CP values from these randomly sampled repeats that were greater than the CP value from the nonshuffled distributions.
RESULTS
We recorded activity from 92 single units in A1 (57 from Monkey W, 35 from Monkey U) from 16 recording sessions and 122 single units in ML (49 from Monkey W, 73 from Monkey U) over 17 recording sessions as animals performed a feature-selective attention task. All metrics reported here were first assessed separately for each subject and were determined to be similar between the animals (Wilcoxon rank sum test >0.05) and thus were pooled to increase our statistical power.
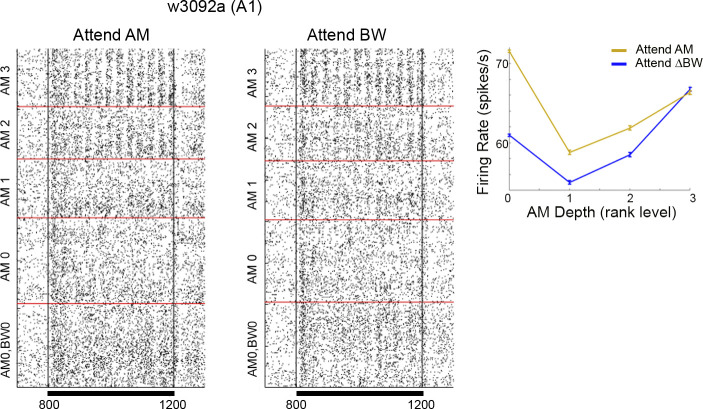
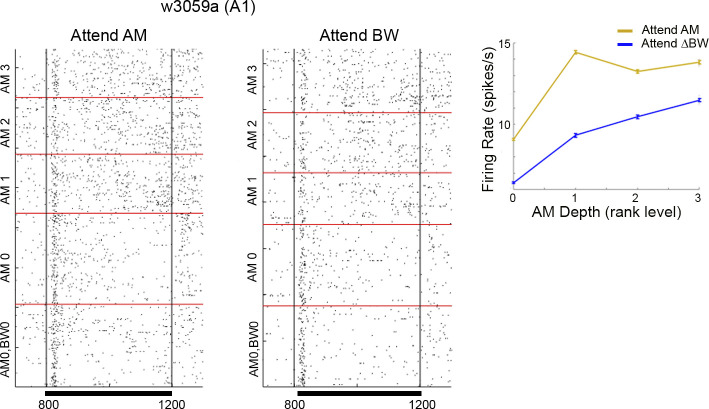
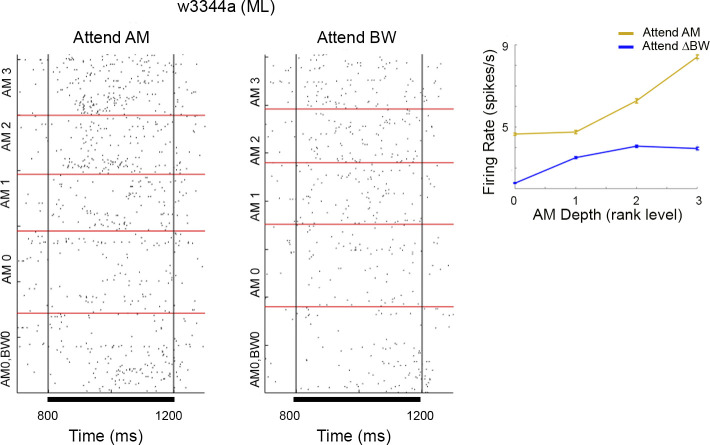
The raster plots of neural activity are shown for three example neurons across different conditions for entire trials (Fig. 3), and for the same neurons expanded just to show the responses to S2 (Figs. 4, 5, and 6). Each neuron’s ability to encode AM with firing rate or VSpp and/or to encode ΔBW is shown in the legend of Fig. 3. In the examples from Figs. 3, 4, 5, and 6, with one exception, when collapsing across ΔBW, for all AM stimuli (AM1, 2, 3) including unmodulated (AM0), the firing rate was higher in the attend-AM condition than attend ΔBW (Figs. 4, 5, and 6 subpanels). The exception was AM3 in Fig. 4. The example neurons in Figs. 4, 5, and 6, all monotonically increase firing rate as AM depth goes from level 1 to level 3, although the neuron in Fig. 4 also responds strongly to the unmodulated noise (AM level 0). Also note that the neuron in Fig. 4 shows strong phase-locking to AM. This overall effect was consistent with a population effect (later described in Fig. 8) where, on average, there was a nonsignificant increase in firing rate across all stimuli in the attend AM condition, but because AM0 also increases this did not lead to increased neuronal ability to detect AM.
Figure 3.
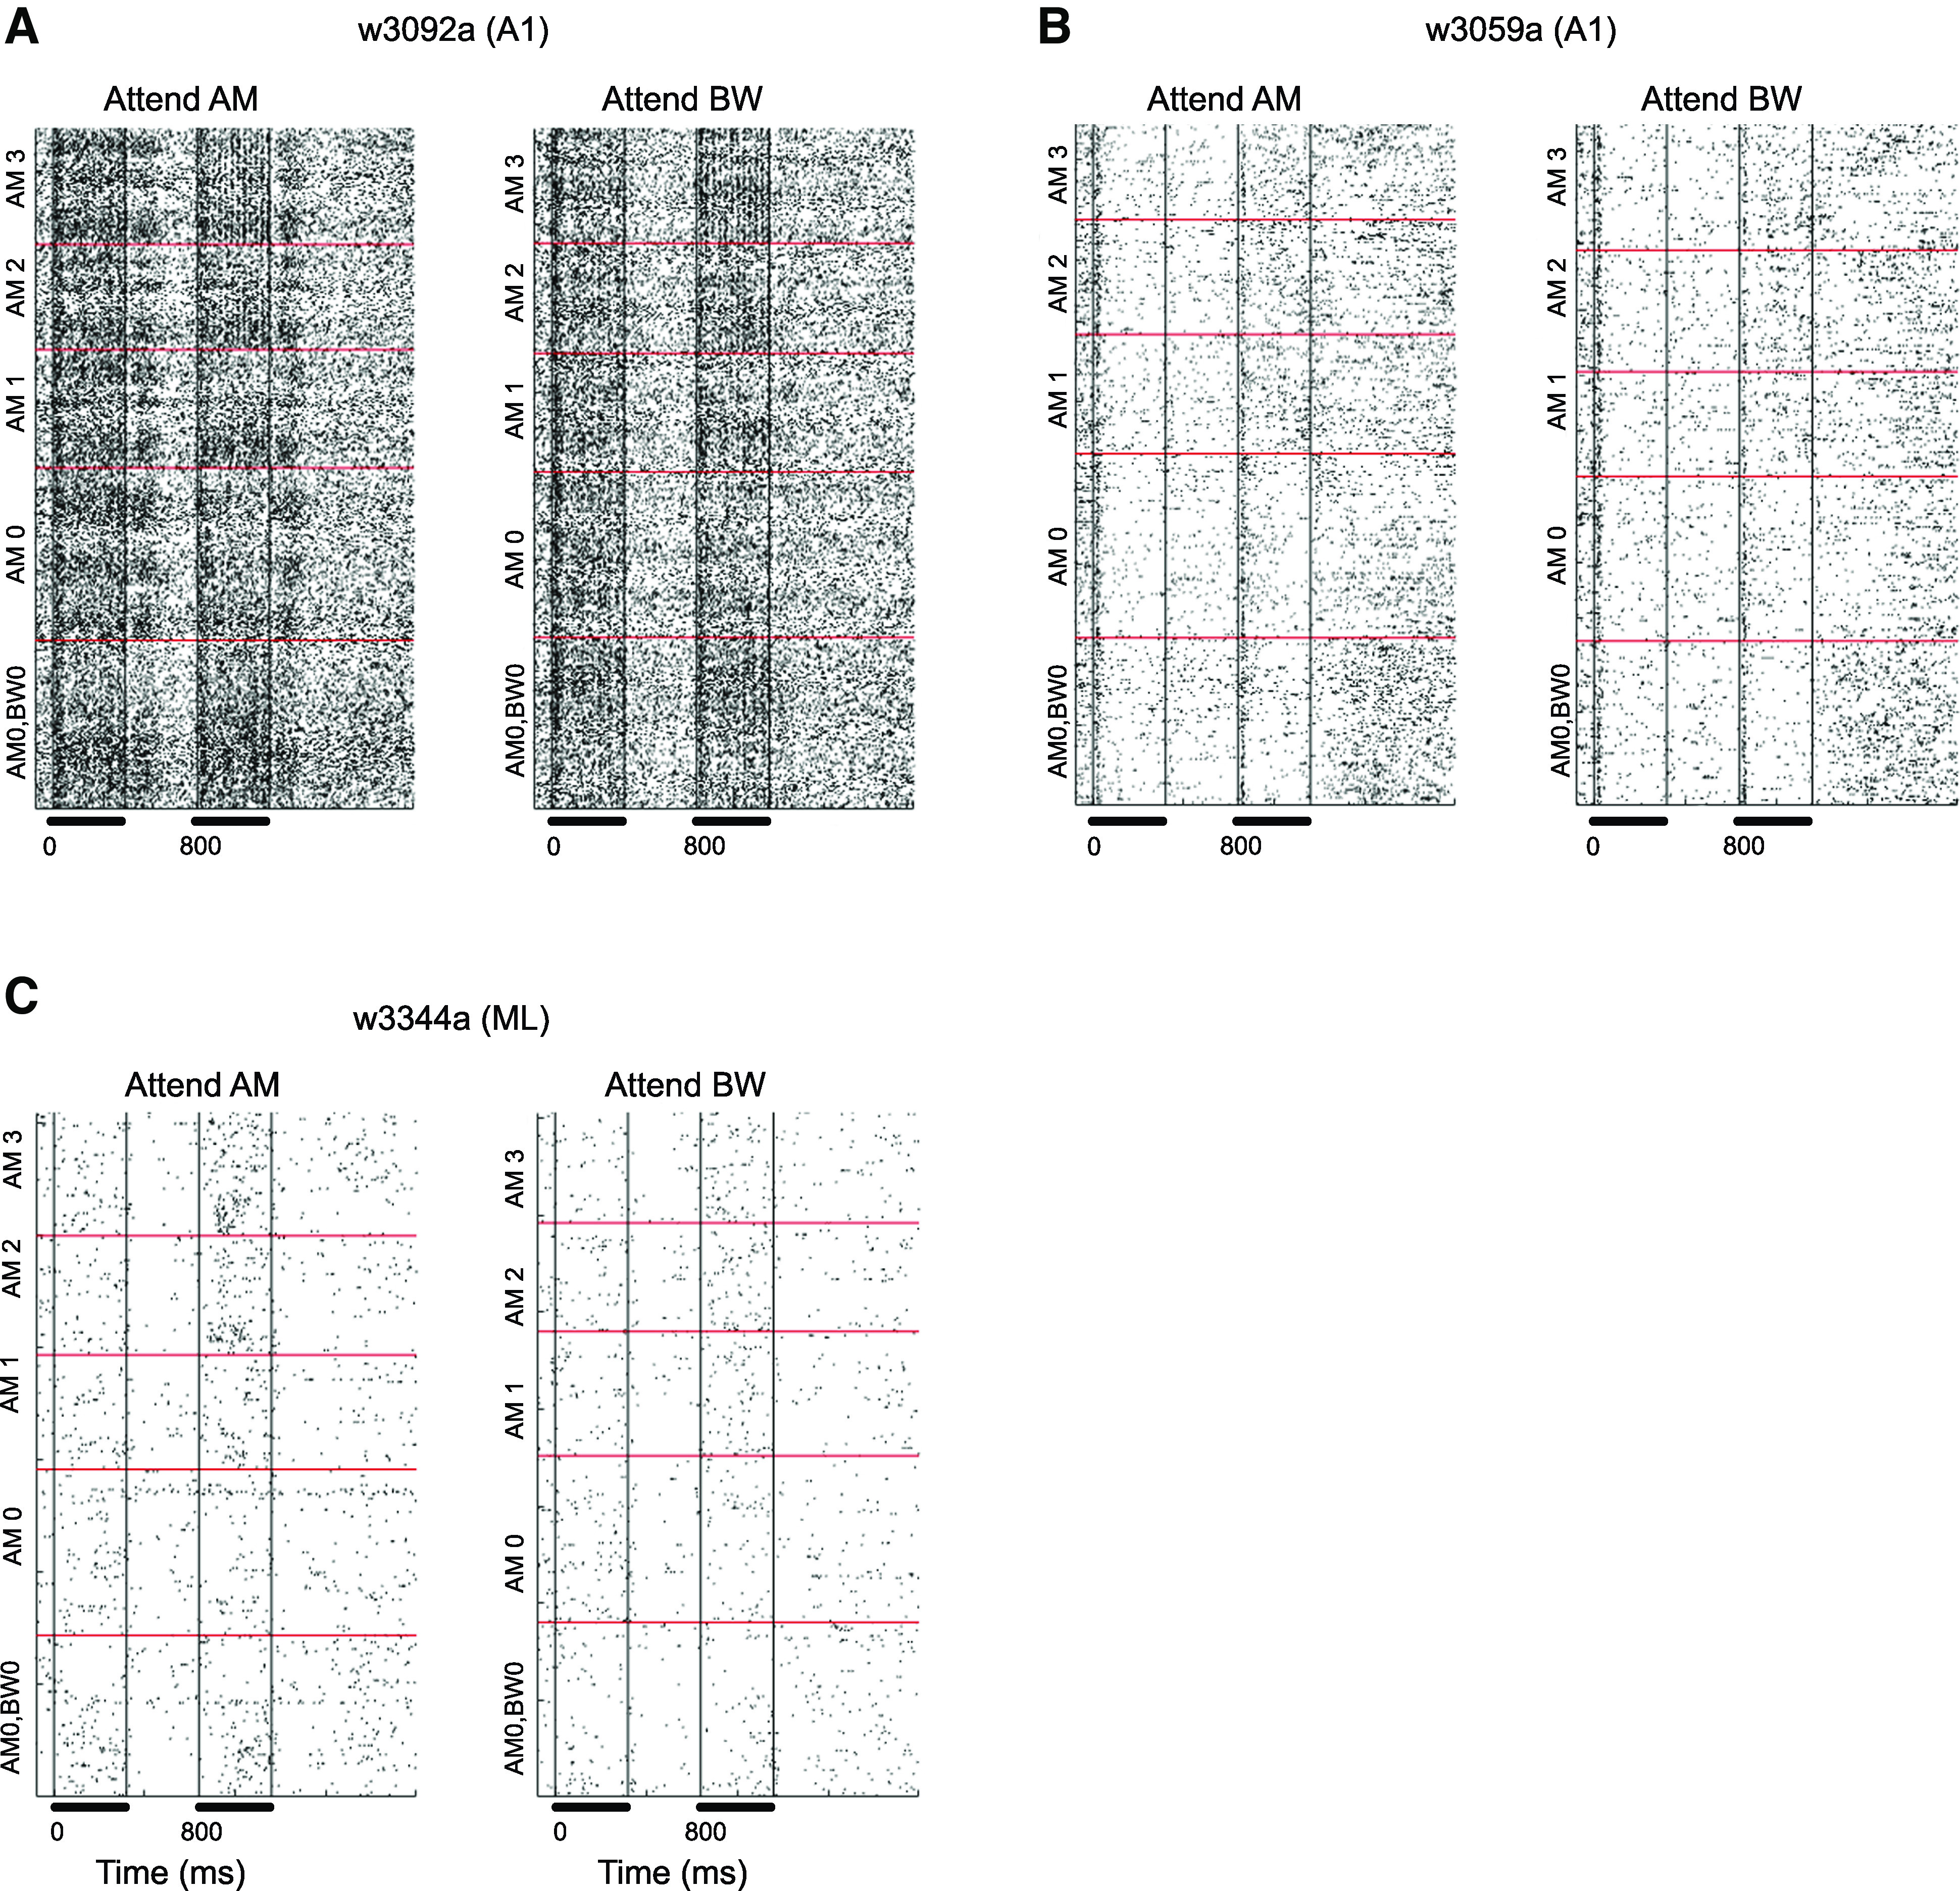
Example responses of A1 (A and B) and ML (C) neurons to AM noise by attentional condition. On the largest scale, we sort by S2 stimulus. The lowest rectangle in each had no AM and no bandwidth restriction (AM0, BW0). Then the going up the next rectangle (AM0) shows the responses to stimuli with no AM but with BW restriction (within the rectangle sorted from lowest on bottom to highest level of BW restriction). The three different levels of stimuli with AM and BW restriction are then shown above. For these within each rectangle the sorting by BW restriction is the same as for AM0. Each subplot is separated into “Attend AM” trials (left) and “Attend BW” trials (right). Bars below each plot indicate stimulus presentation. Black bars below time axis indicate presentation of the S1 and S2 stimulus. A: this neuron encoded AM with average firing rate and vector strength (VSpp) and encoded BW with firing rate. (Definitions of “encoding” are statistically based and in the methods). B: encoded AM with firing rate but not with VSpp and did not encode BW. C: encoded AM and BW with firing rate but did not use VSpp to encode AM. AM, amplitude modulation; A1, primary auditory cortex; BW, bandwidth; ML, middle lateral belt; S1, initial sound; S2, second stimulus; VSpp, phase-projected vector strength. Titles over each subfigure denote the session from which the data were recorded.
Figure 4.
Same as example cell in Fig. 3A, with the peri-S2 time window expanded. Inset shows firing rate as a function of AM depth, error bars show SE. The unmodulated stimuli (AM0) had significantly higher firing rates in the attend AM versus the attend BW condition. Although the firing rate appears higher in the other AM stimuli (AM1, 2, 3) during attend AM, none of those AM stimuli showed significant changes in activity between attend AM and attend BW. AM, amplitude modulation; A1, primary auditory cortex; BW, bandwidth; S2, second stimulus; ΔBW, bandwidth restricted. w3092 indicates the session from which the data were recorded.
Figure 5.
Same as example cells as in Fig. 3B, with the peri-S2 time window expanded. Inset shows firing rate as a function of AM depth, error bars show SE. AM0 and AM1 was significantly greater in attend AM than Attend BW. AM, amplitude modulation; A1, primary auditory cortex; BW, bandwidth; S2, second stimulus; ΔBW, bandwidth restricted. w3059a denotes the session from which the data were recorded.
Figure 6.
Same example cell as in Fig. 3C, with the peri-S2 time window expanded. Inset shows firing rate as a function of AM depth, error bars show SE. For all conditions, firing rate was higher in attend AM, but this was only significant for unmodulated (AM0) and the most modulated (AM3). AM, amplitude modulation; BW, bandwidth; ML, middle lateral belt; S2, second stimulus; ΔBW, bandwidth restricted. w3344a indicates the session from which the data were recorded.
Feature Tuning
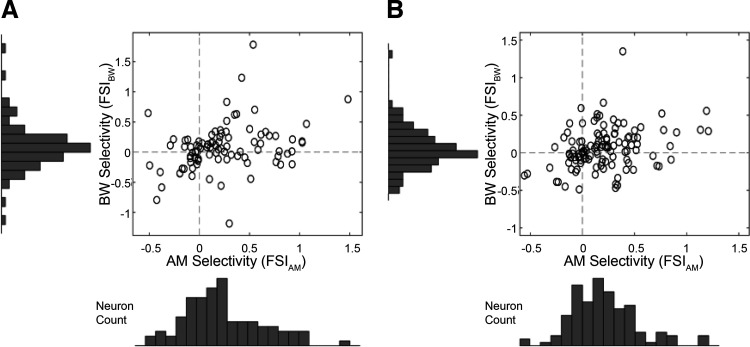
There was no significant difference in the proportions of neurons in A1 and ML that encoded AM (47.8% A1, 38.5% ML; P = 0.08, χ2 test). We found a large proportion of neurons in both A1 and ML that were sensitive to the relatively small changes in ΔBW from the 9-octave wide unmodulated noise (Fig. 7), though there was no difference in the proportion of ΔBW encoding neurons between areas (32.6% A1, 29.5% ML; P = 0.18, χ2 test; Table 1).
Figure 7.
Single neuron feature selectivity index (FSI), a measure of how sensitive a neuron is to changes in each feature value separately. A: A1: a positive correlation between AM and ΔBW selectivity (Pearson rho = 0.3143, P = 0.002). B: ML: positive correlation between AM and BW selectivity (Pearson’s rho = 0.3109, P = 5.32 e-4). AM, amplitude modulation; A1, primary auditory cortex; BW, bandwidth; ML, middle lateral belt; ΔBW, bandwidth restricted.
Table 1.
Percentage of cells in A1 and ML that increased firing rate in response to each feature dimension versus those that decreased activity in response to the feature dimension
| AM rate Coder | Decreasing AM | Increasing AM + AM Coder | Decreasing AM + AM Coder | BW Coder | Decreasing BW | Increasing BW + BW Coder | Decreasing BW + BW Coder | VS Coder | |
|---|---|---|---|---|---|---|---|---|---|
| A1 (n = 92; %) | 47.8 | 32.6 | 41.3 | 6.5 | 32.6 | 42.5 | 18.5 | 14.1 | 32.6 |
| ML (n = 122; %) | 38.5 | 27.1 | 34.4 | 4.1 | 29.5 | 41.8 | 20.5 | 9.0 | 30.33 |
The majority of cells that significantly encoded AM (AM coder) in both A1 and ML increased firing rate in the presence of AM sounds. Cells that significantly encoded ΔBW (BW coder) in A1 were about equally likely to be increasing as decreasing. BW coders in ML were more likely to have increasing functions than decreasing. AM, amplitude modulation; A1, primary auditory cortex; BW, bandwidth; ML, middle lateral belt; ΔBW, bandwidth restricted.
There was a positive correlation between AM and ΔBW selectivity in both A1 (Fig. 7A, Pearson rho = 0.31, P = 0.002) and ML (Fig. 7B, Pearson rho = 0.31, P = 5.32 e-4), so cells that tended to increase firing rate for increasing AM levels, also tended to increase firing rate for increasing ΔBW levels (FSIAM vs. FSIBW). In this feature-selective attention task, we found no significant difference between A1 and ML in the proportions of “increasing” and “decreasing” encoding cells for either AM (“Increasing” P = 0.21, χ2 test; “Decreasing” P = 0.11, χ2 test) or ΔBW (“Increasing” P = 0.22, χ2 test; “Decreasing” P = 0.52, χ2 test).
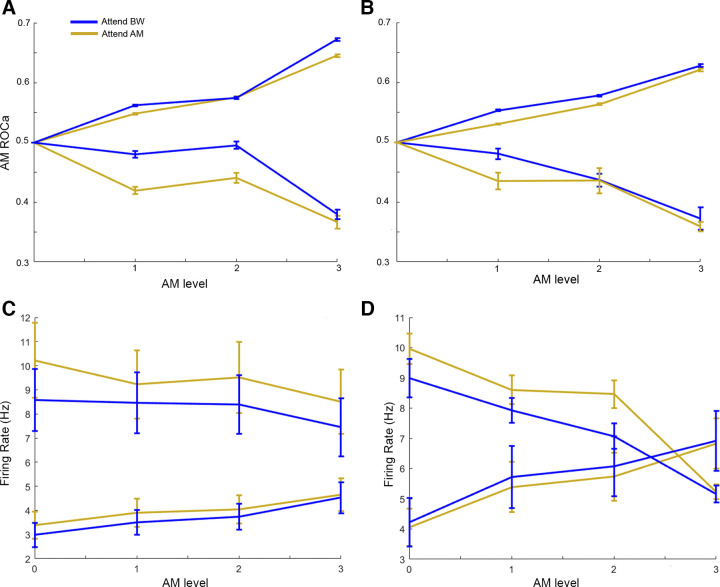
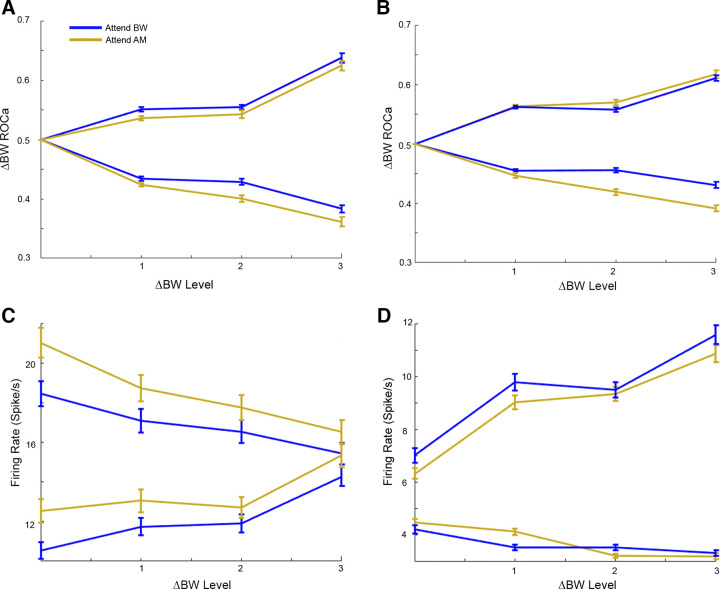
A large population of neurons decreased firing rate for increasing AM depth (“decreasing cells”) in both A1 and ML (Table 1, Fig. 8, C and D). We also found that nearly half of the neurons in both A1 and ML decreased firing rate for increasing ΔBW (Table 1, Fig. 9, C and D). However, the population of neurons that significantly encoded AM was largely dominated by cells that increased firing rate for increasing AM depth in both A1 and ML (Fig. 8, A and B), with only 13.6% of AM encoders (6 cells, 6.5% of all A1 units) classified as “decreasing” units in A1, and 10.6% of AM encoders “decreasing” in ML (5 cells, 4.1% of all ML units). Among significant ΔBW encoders, the population was more evenly split between “increasing” and “decreasing” units in both A1 and ML (Fig. 9, A and B): 43.3% of ΔBW encoders (14.1% of all A1 units) have “decreasing” functions in A1 versus 30.6% in ML (9.0% of all ML units).
Figure 8.
Population average rate-based responses to AM level in A1 (A and C) and ML (B and D). Blue lines indicate responses during Attend BW context, yellow lines indicate responses during Attend AM condition. A: AM encoding (ROCa) in A1. Here, we include only cells that were significant AM encoders (n = 38 increasing, n = 6 decreasing cells). B: AM encoding (ROCa) in ML. Here, we include only cells that were significant AM encoders (n = 42 increasing, n = 5 decreasing cells). C and D: population average raw firing rate for all A1 (C, n = 92) and ML (D, n = 122). Each plot is separated by “increasing cells” (A1 n = 62, ML n = 89) and “decreasing cells” (A1 n = 30, ML n = 33). AM, amplitude modulation; A1, primary auditory cortex; BW, bandwidth; ML, middle lateral belt; ROCa, area under the receiver operating characteristic.
Figure 9.
As in Fig. 8. for the BW feature dimension. Population averaged responses to BW level. Blue lines indicate attend BW condition, yellow lines indicate attend AM condition. A: BW encoding (ROCa) in A1. Here, we include only cells that significantly encoded ΔBW (n = 17 increasing, n = 13 decreasing cells). B: BW encoding (ROCa) in ML. Here, we include only cells that were significant BW encoders (n = 25 increasing, n = 11 decreasing cells). Population average raw firing rate by ΔBW level for all A1 (C, n = 92) and ML (D, n = 122). Each plot is separated by “increasing cells” (A1 n = 53, ML n = 86) and “decreasing cells” (A1 n = 39, ML n = 36). There was no significant effect of attentional condition at any level of ΔBW for either A1 (A and C) or ML (B and D). AM, amplitude modulation; A1, primary auditory cortex; BW, bandwidth; ML, middle lateral belt; ROCa, area under the receiver operating characteristic; ΔBW, bandwidth restricted.
Vector Strength Encoding
We found a similar proportion of cells in A1 and ML that significantly phase locked to AM (P = 0.77, χ2 test), as measured by phase-projected vector strength (VSpp; Table 1). As in previous reports (46), we found VSpp to be weaker in ML than A1 at low AM depths (Fig. 10, C and D, P < 0.05 at low AM depths, Wilcoxon rank-sum test), but not significantly different at the highest AM depth (P = 0.73, Wilcoxon rank-sum test). In both A1 and ML, there was no significant difference in phase-locking (VSpp) between the attend AM and attend ΔBW conditions (P > 0.05, signed-rank test, Fig. 10, C and D).
Figure 10.
Population averaged phase locking responses to AM. Yellow lines indicate attend AM condition, blue lines indicate attend BW condition. A and B: VSpp-based discriminability (ROCa) of AM from unmodulated sounds. In cells that were significant VS encoders both A1 (A, n = 30) and ML (B, n = 37), VSpp-based discriminability of AM was not significantly different between attention conditions at any AM level (P > 0.05, signed-rank test). At low modulation depths (AM level = 1), A1 had significantly better AM discriminability than ML (P = 0.02, Wilcoxon rank sum test); however, they were not significantly different at the higher modulation depths (AM levels 2 and 3, P > 0.05, Wilcoxon rank sum test). C and D: population averaged phase locking responses (VSpp) in all cells for A1 (C, n = 92) and ML (D, n = 122). VSpp is greater in A1 (C) than ML (D) at low AM depths (AM level 1, P = 0.01; AM level 2, P = 0.002, Wilcoxon ranked sum test), though phase locking is more similar (not significantly different) at the highest AM depth (P = 0.73, Wilcoxon ranked sum). There was no significant difference in either VSpp between attentional conditions in either area (P > 0.05 for all AM levels, Wilcoxon signed rank test). AM, amplitude modulation; A1, primary auditory cortex; BW, bandwidth; ML, middle lateral belt; ROCa, area under the receiver operating characteristic; VSpp, phase-projected vector strength.
Feature Discriminability and Context Effects
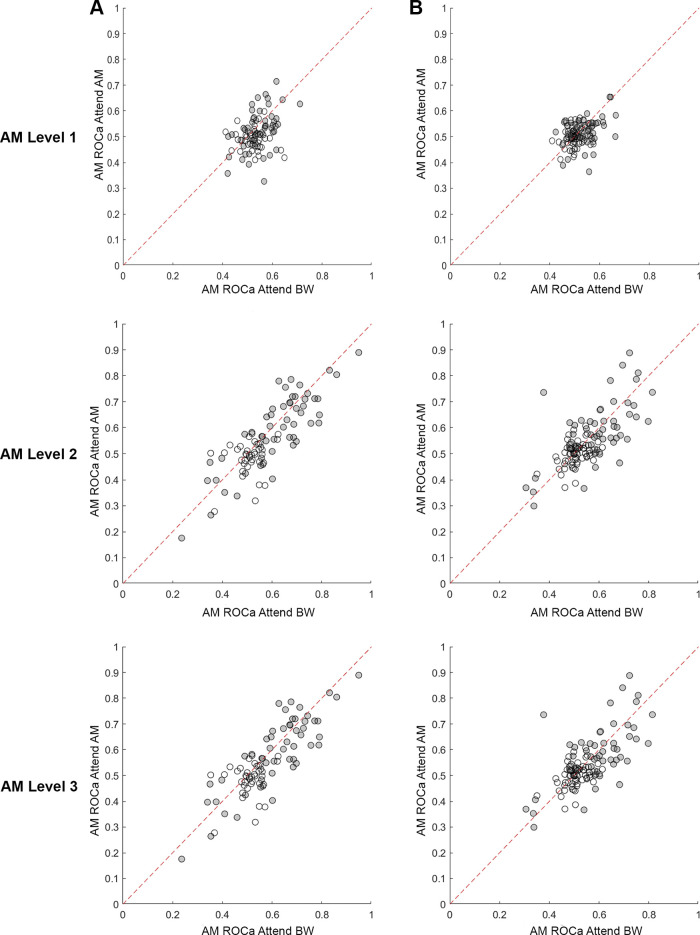
We used the signal detection theory-based area under the receiver operating characteristic (ROCa) to measure how well an ideal observer could detect the presence of each sound feature based on the neural responses (either firing rate or VSpp). Increases in the levels of both features tended to yield increasing ROCa (A1 AM Spearman rho = 0.15, ΔBW Spearman rho = 0.06; ML AM Spearman rho = 0.13, ΔBW Spearman rho = 0.05; Fig. 11). However, there was no significant effect of attentional condition on either feature at any level of feature modulation for either A1 (Figs. 8A and 9A) or ML (Figs. 8B and 9B).
Figure 11.
Cell-by-cell AM firing rate encoding differences between attention conditions for A1 (A; n = 92) and ML (B; n = 122). Filled dots indicate cells that significantly encode AM. Diagonal line is the unity line. As feature level increased, discriminability of AM from unmodulated sounds became greater (ROCa further away from 0.5). AM, amplitude modulation; A1, primary auditory cortex; BW, bandwidth; ML, middle lateral belt; ROCa, area under the receiver operating characteristic.
VSpp-based discrimination (ROCa) of AM from unmodulated sounds was better at the lowest modulation depth in A1 than in ML (P = 0.02, Wilcoxon Rank Sum Test, Fig. 10, A and B). At the higher modulation depths, VSpp-based discrimination was similar in A1 and ML (P = 0.99, AM depth 2; P = 0.26, AM depth 3; Wilcoxon Rank Sum Test; Fig. 10, A and B). However, there was no significant difference in VSpp discriminability between attention conditions for any modulation depth in either area (P > 0.05, signed-rank test, Fig. 10, A and B).
Choice-Related Activity
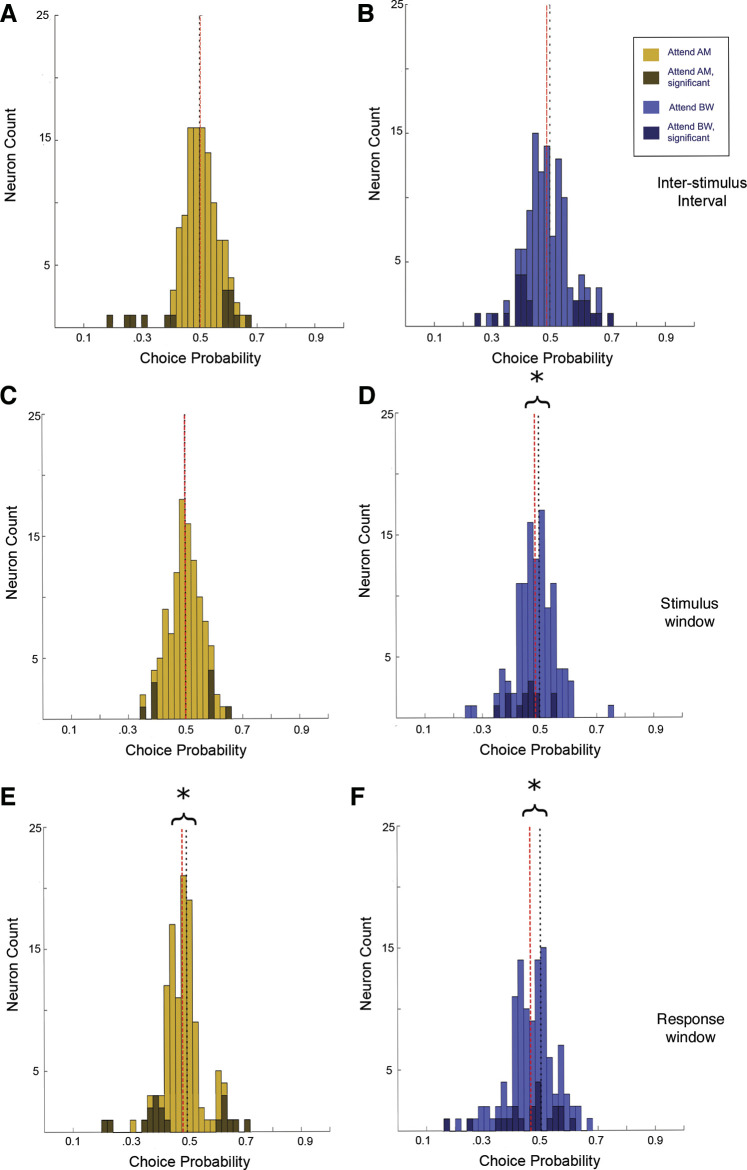
In A1, during the attend AM condition, CP values were evenly distributed ∼0.5 during the ISI (ISI median = 0.49, P = 0.11, signed-rank test), the stimulus presentation (S2 median CP = 0.50, P = 0.87, signed-rank test), and the response window (RW median CP = 0.49, P = 0.43, signed-rank test; (Fig. 12, A, C, and E). In contrast, during the attend ΔBW context, the CP values tended to be lower than 0.5 during both the stimulus (S2 median CP = 0.49, P = 0.02, signed-rank test) and the response window (RW median CP =0.46, P = 4.2 e-8, signed-rank test), but not significantly different from 0.5 during the ISI (ISI median = 0.51, P = 0.92; Fig. 12, B, D, and F). That is, during the attend ΔBW condition, the population of neurons tended to decrease firing rate when reporting target feature detection, whereas during the attend AM condition, it was equally likely for a neuron to increase firing rate for a report of target detection as it was for a report of target absence. There was a significant difference in the population CP distributions between attention conditions during the RW (Attend AM median = 0.49, Attend ΔBW median = 0.46, P = 0.004, signed-rank test), though neither during the ISI (P = 0.33, signed-rank test) nor the S2 (P = 0.06, signed-rank test).
Figure 12.
Choice probability in A1 neurons (n = 92). Values closer to 0 indicate increased activity for “feature-absent” response, whereas 1 indicates increased activity for “feature-present” response. Darker colored bars indicate cells with significant choice activity. Black dotted line indicates 0.5, red dashed line denotes the population median. A and B: CP during the ISI window was centered about 0.5 for both the attend AM condition (A; median = 0.49, P = 0.11, signed-rank test) and the attend BW condition (B; median = 0.51, P = 0.92, signed-rank test). CP during the attend AM condition is evenly distributed about 0.5 in both the stimulus window (C; median = 0.50, P = 0.87, signed-rank test) and the response window (E; median = 0.49, P = 0.43, signed-rank test). In the attend ΔBW condition, CP values tended to be less than 0.5 in both the stimulus window (D; median = 0.49, P = 0.02, signed-rank test) and the response window (F; median = 0.46, P = 4.2 e-8, signed-rank test). There was a significant difference in the population CP distributions between attention conditions during the RW (P = 0.004, signed-rank test), though not during the S2 (P = 0.06, signed-rank test). AM, amplitude modulation; A1, primary auditory cortex; BW, bandwidth; CP, choice probability; ISI, interstimulus interval; RW, response window; S2, second sound; ΔBW, bandwidth restricted. *indicates population median significantly different than 0.5, P < 0.05, signed-rank test.
The choice-related activity in ML was similar to that reported above in A1 during the ISI and S2. During the attend AM condition, activity was evenly distributed ∼0.5 (ISI median CP = 0.50, P = 0.47; S2 median CP = 0.50, P = 0.94, signed-rank test; (Fig. 13, A and C). During the attend ΔBW condition, average CP was less than 0.5 during the S2 (S2 median CP = 0.49, P = 0.043 signed-rank test; Fig. 13D), but not during the ISI (ISI median CP = 0.49, P = 0.15, signed-rank test; Fig. 13B). However, during the response window, CP values were less than 0.5 in both the attend AM condition (median CP = 0.48, P = 0.004 signed-rank test) and the attend ΔBW condition (median CP = 0.47, P = 2.7 e-5 signed-rank test; Fig. 13, E and F). This is in contrast to A1 where CP values tended to be lower than 0.5 only in the attend ΔBW condition. There was no significant difference in the distribution of CP values in ML neurons between the attend AM and attend ΔBW conditions during either the ISI (P = 0.49, signed-rank test) or the S2 (P = 0.15, signed-rank test). However, there was a significant difference in the CP distribution between the attend AM and attend ΔBW conditions in ML during the response window (Attend AM median = 0.48, Attend ΔBW median = 0.47, P = 0.033 signed-rank test), reflecting the population shift to CP values less than 0.5 in the attend ΔBW condition compared with the attend AM condition.
Figure 13.
Choice probability in ML neurons (n = 122), as in Fig. 12. A and B: CP during the ISI window was centered about 0.5 for both the attend AM condition (A; median = 0.50, P = 0.47, signed-rank test) and the attend BW condition (B; median = 0.49, P = 0.15, signed-rank test). CP during the attend AM condition is evenly distributed about 0.5 in the stimulus window (C; median = 0.50, P = 0.94, signed-rank test). However, in the response window E, CP values tended to be less than 0.5 (median = 0.48, P = 0.004, signed-rank test). In the attend ΔBW condition, CP values tended to be less than 0.5 in both the stimulus window (D; median = 0.49, P = 0.043 signed-rank test) and the response window (F; median = 0.47, P = 2.7 e-5 signed-rank test). As in A1, there was a significant difference in the population CP distributions between attention conditions during the RW (P = 0.033, signed-rank test), though not during the S2 (P = 0.15, signed-rank test). AM, amplitude modulation; A1, primary auditory cortex; BW, bandwidth; CP, choice probability; ISI, interstimulus interval; ML, middle lateral belt; RW, response window; S2, second sound; ΔBW, bandwidth restricted. *indicates population median significantly different than 0.5, P < 0.05, signed-rank test.
There was no significant difference in the proportion of neurons in A1 (19.5%) and ML (26.2%) with significant choice-related activity during the stimulus window (P = 0.31, χ2 test; Figs. 12, C and D, and 13, C and D) or ISI window (A1 17.4%, ML 20.5%, P = 0.38, χ2 test; Figs. 12, A and B, and 13, A and B). In both areas, the population of neurons with significant choice-related activity during the response window (from S2 end to joystick movement) was not significantly different between the two areas (41.3% A1, 34.4% ML, P = 0.41, χ2 test; Figs. 12, E and F, and 13, E and F). Additionally, the proportion of neurons with significant CP was larger during the response window than during both the ISI and the stimulus window.
DISCUSSION
We found a large proportion of cells in ML that decreased firing rate with increasing AM detectability, similar to previous findings in ML (46, 73). However, unlike these previous studies where ML had a significantly larger population of cells with decreasing AM depth functions than A1, we found a similar proportion of A1 neurons with decreasing AM depth functions. Further, the majority of neurons in both A1 and ML significantly encoding AM depth had increasing AM depth functions. This suggests that the encoding of amplitude modulation can be flexible depending upon the behavioral and sensory demands of the task. In essence, with increased perceptual difficulty, stimulus/feature ambiguity, and task difficulty, it may be necessary for A1 to develop a more robust and appropriate code to solve the task, and for ML to take on more of the sensory processing, and thus the encoding schemes look more similar between these two areas.
We also found a large population of cells in both A1 and ML that were sensitive to changes in bandwidth. This was particularly surprising, as the changes in bandwidth were relatively small compared with the 9-octave wide unmodulated noise. It’s possible that the ΔBW encoding we saw was due to an increasing concentration of power in the middle frequencies of the broadband noise as the level of bandwidth restriction increased. It could also be caused by decreasing power in flanking inhibitory bands. Further studies investigating if and how neurons in A1 and ML encode small changes in spectral bandwidth to broad-band sounds under power-matched conditions could be enlightening.
Using phase-projected vector strength (VSpp) as a measure of temporal coding, neither ML nor A1 single neurons showed attention-related changes in VSpp-based sensitivity to AM or VS-based choice-related activity. This is consistent with previous results from our laboratory showing smaller effects for VSpp-based attention and choice than for firing rate (46). A recent study that could help interpretation of this result shows thalamic projections to the striatum (an area involved in decisions and possibly attention) relay information about temporally modulated sounds in the form of phase-locking, whereas cortical projections to the striatum only convey information about temporally modulated sounds with average firing rate over the stimulus (74).
Attending to the target-feature did not significantly improve single neuron amplitude modulation or bandwidth restriction detection in A1 or ML. This seems surprising considering the wide array of effects that have been previously reported in auditory cortex related to different tasks, and behavioral contexts (1–3, 5, 17, 20, 44, 75, 76). In macaque monkeys, an improvement in both rate-based and temporal AM encoding was observed in A1 and ML neurons when animals performed a single-feature AM detection task compared with when animals passively listened to the same stimuli (7, 46). We did not see a similar level of encoding improvement, possibly due to the more fine-tuned form of attention needed to perform this task.
One might expect to observe smaller effects from this more selective form of attention than in a passive versus active listening task, as the difference between attending to one feature of a sound compared with another is much smaller than switching between paying attention to a sound and passive sound presentation. Furthermore, arousal, as measured with pupillometry, has recently been shown to correlate with increases in activity, gain and trial-to-trial reliability of A1 neurons (77), which could account for some of the effects seen in task engagement paradigms.
Feature-based attention has been shown to have gain effects on neurons tuned to the attended feature in visual cortex (78, 79). It is possible that we did not see a similar gain effect of feature attention in AC due to the mixed selectivity we and others (80) found in the encoding of these features (i.e., most neurons are sensitive to both AM and ΔBW). However, it is likely that mixed selectivity is not the only reason we did not see a gain effect. In a study where rats performed a frequency categorization task with shifting boundaries, Jaramillo and colleagues (81) similarly found that neurons in AC did not improve their discriminability with attentional context. This similar lack of enhancement seen in a task where only a single feature is modulated suggests that the mechanism for feature attention in auditory cortex could be enacted via a different mechanism.
In visual cortical studies probing selective feature attention—where the subject must distinguish between features within a single object, rather than object- or place-oriented, feature-based attention—results have been similarly complex. At the level of the single neuron, there have not been clear, gain-like improvements in the sensitivity to the attended feature (82–85). Further, the effects of feature-selective attention seem to be dependent upon not just the tuning preferences of a neuron, but also the strength of its tuning (86). These studies, along with our own, suggest that segregation of features within an object may require a different mechanism relative to object-directed, feature-based attention.
In each of the feature-selective attention studies cited above, a common observation is that single neurons in sensory cortex have mixed selectivity for the features in the task, as opposed to being uniquely responsive to one feature or another. Such mixed selectivity among single neurons may permit sophisticated, flexible computations at the population level (87). It thus seems likely the mechanism for feature-selective attention lies not at the level of the single neuron, but rather requires the integration of activity from a larger population of neurons. A feature-selective study using ERPs found that the neural responses to identical stimuli varied when the subjects attend to different features of the stimulus (88). The single neuron and neural circuit mechanisms underlying this effect remain unclear. One such possible mechanism might be the structure of correlated variability within the population, which has been shown to be modulated by feature-selective attention (22). Another study, simulating populations by pooling single neurons across A1 recordings permitted clear segregation of these two features, as well as an enhancement in discrimination of the attended feature (89). Further studies investigating feature-selective attention at the level of populations of neurons are necessary to better understand the underlying mechanisms.
We did see an interesting difference in the distribution of choice-related activity between the attentional conditions, where the correlation between firing rate and choice shifted direction between conditions. During the attend AM context, CP was evenly distributed ∼0.5 with some neurons showing significant choice activity at either extreme. In contrast, during the attend ΔBW context, CP values were shifted toward 0, with very few neurons having significant choice-related activity greater than 0.5 (increasing firing rate for “feature-present” response).
Neurons in auditory cortical areas may also modulate their responses to motor events (50). Some previous reports on choice-related activity have been difficult to interpret, as they employed a Go/No-Go task format in which one perceptual choice required a movement and the other choice did not (46, 50). Therefore, the choice-related activity observed was difficult to disentangle from a general preparation to move. The task reported here was a Yes/No forced-choice task, requiring a motor response to each decision (target present vs. target absent). The shift in choice-related activity between attention conditions observed in this force choice task, and another recent study (42) shows that this choice-related activity cannot simply reflect motor preparation or action. This strengthens the possible relationship between this activity and the decision or attention process.
The lack of clear attentional improvement of single neuron feature encoding found in this study suggests one or more of the following: 1) the feature-selective attention required in this task is not implemented at the level of an individual neuron in A1 or ML; 2) the feature-selective attention necessary for this particular task occurs at a later stage in auditory processing; 3) the mixed selectivity of single neurons in A1 and ML for these features complicates the interpretability of the effects of attention at the single neuron level, in contrast to feature-based attention neurons studied found in visual cortex (28, 29, 90). Although we did not see robust differences in encoding between attentional conditions, the difference in attentional choice-related activity reveals that it is not simply reflective of motor preparation and suggests that activity correlated to reported choice as early as A1 could be informing perceptual and decision processes.
GRANTS
This work was funded by NIH National Institute on Deafness and Other Communication Disorders Grant DC002514 (M. L. Sutter), National Science Foundation Graduate Research Fellowships Program 1148897 (J. D. Downer), and ARCS Foundation Fellowship (J. D. Downer).
DISCLOSURES
No conflicts of interest, financial or otherwise, are declared by the authors.
AUTHOR CONTRIBUTIONS
J.D.D., K.N.O., and M.L.S. conceived and designed research; J.L.M. and J.D.D. performed experiments; J.L.M. analyzed data; J.L.M., K.N.O., J.S.J., and M.L.S. interpreted results of experiments; J.L.M. prepared figures; J.L.M. drafted manuscript; J.L.M., J.D.D., K.N.O., J.S.J., and M.L.S. edited and revised manuscript; J.L.M., J.D.D., K.N.O., J.S.J., and M.L.S. approved final version of manuscript.
REFERENCES
- 1.Atiani S, David SV, Elgueda D, Locastro M, Radtke-Schuller S, Shamma SA, Fritz JB. Emergent selectivity for task-relevant stimuli in higher-order auditory cortex. Neuron 82: 486–499, 2014. doi: 10.1016/j.neuron.2014.02.029. [DOI] [PMC free article] [PubMed] [Google Scholar]
- 2.Bagur S, Averseng M, Elgueda D, David S, Fritz J, Yin P, Shamma S, Boubenec Y, Ostojic S. Go/No-Go task engagement enhances population representation of target stimuli in primary auditory cortex. Nat Commun 9: 2529, 2018. doi: 10.1038/s41467-018-04839-9. [DOI] [PMC free article] [PubMed] [Google Scholar]
- 3.Buran BN, von Trapp G, Sanes DH. Behaviorally gated reduction of spontaneous discharge can improve detection thresholds in auditory cortex. J Neurosci 34: 4076–4081, 2014. doi: 10.1523/JNEUROSCI.4825-13.2014. [DOI] [PMC free article] [PubMed] [Google Scholar]
- 4.Carcea I, Insanally MN, Froemke RC. Dynamics of auditory cortical activity during behavioural engagement and auditory perception. Nat Commun 8: 14412, 2017. doi: 10.1038/ncomms14412. [DOI] [PMC free article] [PubMed] [Google Scholar]
- 5.Francis NA, Elgueda D, Englitz B, Fritz JB, Shamma SA. Laminar profile of task-related plasticity in ferret primary auditory cortex. Sci Rep 8: 16375, 2018. doi: 10.1038/s41598-018-34739-3. [DOI] [PMC free article] [PubMed] [Google Scholar]
- 6.Niwa M, Johnson JS, O'Connor KN, Sutter ML. Active engagement improves primary auditory cortical neurons’ ability to discriminate temporal modulation. J Neurosci 32: 9323–9334, 2012. doi: 10.1523/JNEUROSCI.5832-11.2012. [DOI] [PMC free article] [PubMed] [Google Scholar]
- 7.Niwa M, O'Connor KN, Engall E, Johnson JS, Sutter ML. Hierarchical effects of task engagement on amplitude modulation encoding in auditory cortex. J Neurophysiol 113: 307–327, 2015. doi: 10.1152/jn.00458.2013. [DOI] [PMC free article] [PubMed] [Google Scholar]
- 8.von Trapp G, Buran BN, Sen K, Semple MN, Sanes DH. A decline in response variability improves neural signal detection during auditory task performance. J Neurosci 36: 11097–11106, 2016. doi: 10.1523/JNEUROSCI.1302-16.2016. [DOI] [PMC free article] [PubMed] [Google Scholar]
- 9.Fritz J, Shamma S, Elhilali M, Klein D. Rapid task-related plasticity of spectrotemporal receptive fields in primary auditory cortex. Nat Neurosci 6: 1216–1223, 2003. doi: 10.1038/nn1141. [DOI] [PubMed] [Google Scholar]
- 10.Fritz JB, Elhilali M, Shamma SA. Differential dynamic plasticity of A1 receptive fields during multiple spectral tasks. J Neurosci 25: 7623–7635, 2005. doi: 10.1523/JNEUROSCI.1318-05.2005. [DOI] [PMC free article] [PubMed] [Google Scholar]
- 11.Fritz JB, Elhilali M, Shamma SA. Adaptive changes in cortical receptive fields induced by attention to complex sounds. J Neurophysiol 98: 2337–2346, 2007. doi: 10.1152/jn.00552.2007. [DOI] [PubMed] [Google Scholar]
- 12.Lee C-C, Middlebrooks JC. Auditory cortex spatial sensitivity sharpens during task performance. Nat Neurosci 14: 108–114, 2011. doi: 10.1038/nn.2713. [DOI] [PMC free article] [PubMed] [Google Scholar]
- 13.Lin P-A, Asinof SK, Edwards NJ, Isaacson JS. Arousal regulates frequency tuning in primary auditory cortex. Proc Natl Acad Sci USA 116: 25304–25310, 2019. doi: 10.1073/pnas.1911383116. [DOI] [PMC free article] [PubMed] [Google Scholar]
- 14.Yin P, Fritz JB, Shamma SA. Rapid spectrotemporal plasticity in primary auditory cortex during behavior. J Neurosci 34: 4396–4408, 2014. doi: 10.1523/JNEUROSCI.2799-13.2014. [DOI] [PMC free article] [PubMed] [Google Scholar]
- 15.Downer JD, Niwa M, Sutter ML. Task engagement selectively modulates neural correlations in primary auditory cortex. J Neurosci 35: 7565–7574, 2015. doi: 10.1523/JNEUROSCI.4094-14.2015. [DOI] [PMC free article] [PubMed] [Google Scholar]
- 16.Downer JD, Niwa M, Sutter ML. Hierarchical differences in population coding within auditory cortex. J Neurophysiol 118: 717–731, 2017. doi: 10.1152/jn.00899.2016. [DOI] [PMC free article] [PubMed] [Google Scholar]
- 17.Angeloni C, Geffen M. Contextual modulation of sound processing in the auditory cortex. Curr Opin Neurobiol 49: 8–15, 2018. doi: 10.1016/j.conb.2017.10.012. [DOI] [PMC free article] [PubMed] [Google Scholar]
- 18.Massoudi R, Van Wanrooij MM, Van Wetter SMCI, Versnel H, Van Opstal AJ. Task-related preparatory modulations multiply with acoustic processing in monkey auditory cortex. Eur J Neurosci 39: 1538–1550, 2014. doi: 10.1111/ejn.12532. [DOI] [PubMed] [Google Scholar]
- 19.Osmanski MS, Wang X. Behavioral dependence of auditory cortical responses. Brain Topogr 28: 365–378, 2015. doi: 10.1007/s10548-015-0428-4. [DOI] [PMC free article] [PubMed] [Google Scholar]
- 20.Sutter ML, Shamma SA. The relationship of auditory cortical activity to perception and behavior. In: The Auditory Cortex, edited by Winer JA, Schreiner CE. New York: Springer, 2011, p. 617–641. [Google Scholar]
- 21.Schwartz ZP, David SV. Focal suppression of distractor sounds by selective attention in auditory cortex. Cereb Cortex 28: 323–339, 2018. doi: 10.1093/cercor/bhx288. [DOI] [PMC free article] [PubMed] [Google Scholar]
- 22.Downer JD, Rapone B, Verhein J, O'Connor KN, Sutter ML. Feature-selective attention adaptively shifts noise correlations in primary auditory cortex. J Neurosci 37: 5378–5392, 2017. doi: 10.1523/JNEUROSCI.3169-16.2017. [DOI] [PMC free article] [PubMed] [Google Scholar]
- 23.Bizley JK, Cohen YE. The what, where and how of auditory-object perception. Nat Rev Neurosci 14: 693–707, 2013. doi: 10.1038/nrn3565. [DOI] [PMC free article] [PubMed] [Google Scholar]
- 24.Bregman AS. Auditory Scene Analysis: The Perceptual Organization of Sound. Cambridge: MIT Press, 1994. [Google Scholar]
- 25.McDermott JH. The cocktail party problem. Curr Biol 19: R1024–R1027, 2009. doi: 10.1016/j.cub.2009.09.005. [DOI] [PubMed] [Google Scholar]
- 26.Shinn-Cunningham BG. Object-based auditory and visual attention. Trends Cogn Sci 12: 182–186, 2008. doi: 10.1016/j.tics.2008.02.003. [DOI] [PMC free article] [PubMed] [Google Scholar]
- 27.Woods KJP, McDermott JH. Attentive tracking of sound sources. Curr Biol 25: 2238–2246, 2015. doi: 10.1016/j.cub.2015.07.043. [DOI] [PubMed] [Google Scholar]
- 28.Martinez-Trujillo JC, Treue S. Feature-based attention increases the selectivity of population responses in primate visual cortex. Curr Biol 14: 744–751, 2004. doi: 10.1016/j.cub.2004.04.028. [DOI] [PubMed] [Google Scholar]
- 29.Maunsell JHR, Treue S. Feature-based attention in visual cortex. Trends Neurosci 29: 317–322, 2006. doi: 10.1016/j.tins.2006.04.001. [DOI] [PubMed] [Google Scholar]
- 30.Engle JR, Recanzone GH. Characterizing spatial tuning functions of neurons in the auditory cortex of young and aged monkeys: a new perspective on old data. Front Aging Neurosci 4: 36, 2013. [23316160] doi: 10.3389/fnagi.2012.00036. [DOI] [PMC free article] [PubMed] [Google Scholar]
- 31.Scott BH, Malone BJ, Semple MN. Effect of behavioral context on representation of a spatial cue in core auditory cortex of awake macaques. J Neurosci 27: 6489–6499, 2007. doi: 10.1523/JNEUROSCI.0016-07.2007. [DOI] [PMC free article] [PubMed] [Google Scholar]
- 32.Elgueda D, Duque D, Radtke-Schuller S, Yin P, David SV, Shamma SA, Fritz JB. State-dependent encoding of sound and behavioral meaning in a tertiary region of the ferret auditory cortex. Nat Neurosci 22: 447–459, 2019. doi: 10.1038/s41593-018-0317-8. [DOI] [PMC free article] [PubMed] [Google Scholar]
- 33.Lemus L, Hernandez A, Romo R. Neural codes for perceptual discrimination of acoustic flutter in the primate auditory cortex. Proc Natl Acad Sci USA 106: 9471–9476, 2009. doi: 10.1073/pnas.0904066106. [DOI] [PMC free article] [PubMed] [Google Scholar]
- 34.Tsunada J, Lee JH, Cohen YE. Representation of speech categories in the primate auditory cortex. J Neurophysiol 105: 2634–2646, 2011. doi: 10.1152/jn.00037.2011. [DOI] [PMC free article] [PubMed] [Google Scholar]
- 35.Christison-Lagay KL, Bennur S, Cohen YE. Contribution of spiking activity in the primary auditory cortex to detection in noise. J Neurophysiol 118: 3118–3131, 2017. doi: 10.1152/jn.00521.2017. [DOI] [PMC free article] [PubMed] [Google Scholar]
- 36.Tsunada J, Liu ASK, Gold JI, Cohen YE. Causal contribution of primate auditory cortex to auditory perceptual decision-making. Nat Neurosci 19: 135–142, 2016[Erratum inNat Neurosci19: 642, 2016]. doi: 10.1038/nn.4195. [DOI] [PMC free article] [PubMed] [Google Scholar]
- 37.Bathellier B, Ushakova L, Rumpel S. Discrete neocortical dynamics predict behavioral categorization of sounds. Neuron 76: 435–449, 2012. doi: 10.1016/j.neuron.2012.07.008. [DOI] [PubMed] [Google Scholar]
- 38.Bizley JK, Walker KMM, Nodal FR, King AJ, Schnupp JWH. Auditory cortex represents both pitch judgments and the corresponding acoustic cues. Curr Biol 23: 620–625, 2013. doi: 10.1016/j.cub.2013.03.003. [DOI] [PMC free article] [PubMed] [Google Scholar]
- 39.Christison-Lagay KL, Cohen YE. The contribution of primary auditory cortex to auditory categorization in behaving monkeys. Front Neurosci 12: 601, 2018. doi: 10.3389/fnins.2018.00601. [DOI] [PMC free article] [PubMed] [Google Scholar]
- 40.Francis NA, Winkowski DE, Sheikhattar A, Armengol K, Babadi B, Kanold PO. Small networks encode decision-making in primary auditory cortex. Neuron 97: 885–897.e6, 2018. doi: 10.1016/j.neuron.2018.01.019. [DOI] [PMC free article] [PubMed] [Google Scholar]
- 41.Gronskaya E, von der Behrens W. Evoked response strength in primary auditory cortex predicts performance in a spectro-spatial discrimination task in rats. J Neurosci 39: 6108–6121, 2019. doi: 10.1523/JNEUROSCI.0041-18.2019. [DOI] [PMC free article] [PubMed] [Google Scholar]
- 42.Guo L, Weems JT, Walker WI, Levichev A, Jaramillo S. Choice-selective neurons in the auditory cortex and in its striatal target encode reward expectation. J Neurosci 39: 3687–3697, 2019. doi: 10.1523/JNEUROSCI.2585-18.2019. [DOI] [PMC free article] [PubMed] [Google Scholar]
- 43.Huang Y, Heil P, Brosch M. Associations between sounds and actions in early auditory cortex of nonhuman primates. eLife 8: e43281, 2019. doi: 10.7554/eLife.43281. [DOI] [PMC free article] [PubMed] [Google Scholar]
- 44.Niwa M, Johnson JS, O'Connor KN, Sutter ML. Activity related to perceptual judgment and action in primary auditory cortex. J Neurosci 32: 3193–3210, 2012. doi: 10.1523/JNEUROSCI.0767-11.2012. [DOI] [PMC free article] [PubMed] [Google Scholar]
- 45.Runyan CA, Piasini E, Panzeri S, Harvey CD. Distinct timescales of population coding across cortex. Nature 548: 92–96, 2017. doi: 10.1038/nature23020. [DOI] [PMC free article] [PubMed] [Google Scholar]
- 46.Niwa M, Johnson JS, O'Connor KN, Sutter ML. Differences between primary auditory cortex and auditory belt related to encoding and choice for AM sounds. J Neurosci 33: 8378–8395, 2013. doi: 10.1523/JNEUROSCI.2672-12.2013. [DOI] [PMC free article] [PubMed] [Google Scholar]
- 47.Hackett TA. Information flow in the auditory cortical network. Hear Res 271: 133–146, 2011. doi: 10.1016/j.heares.2010.01.011. [DOI] [PMC free article] [PubMed] [Google Scholar]
- 48.Huang Y, Brosch M. Associations between sounds and actions in primate prefrontal cortex. Brain Res 1738: 146775, 2020. doi: 10.1016/j.brainres.2020.146775. [DOI] [PubMed] [Google Scholar]
- 49.Romanski LM, Tian B, Fritz J, Mishkin M, Goldman-Rakic PS, Rauschecker JP. Dual streams of auditory afferents target multiple domains in the primate prefrontal cortex. Nat Neurosci 2: 1131–1136, 1999. doi: 10.1038/16056. [DOI] [PMC free article] [PubMed] [Google Scholar]
- 50.Brosch M, Selezneva E, Scheich H. Nonauditory events of a behavioral procedure activate auditory cortex of highly trained monkeys. J Neurosci 25: 6797–6806, 2005. doi: 10.1523/JNEUROSCI.1571-05.2005. [DOI] [PMC free article] [PubMed] [Google Scholar]
- 51.Eliades SJ, Wang X. Sensory-motor interaction in the primate auditory cortex during self-initiated vocalizations. J Neurophysiol 89: 2194–2207, 2003. doi: 10.1152/jn.00627.2002. [DOI] [PubMed] [Google Scholar]
- 52.Schneider DM, Nelson A, Mooney R. A synaptic and circuit basis for corollary discharge in the auditory cortex. Nature 513: 189–194, 2014. doi: 10.1038/nature13724. [DOI] [PMC free article] [PubMed] [Google Scholar]
- 53.Schnupp JWH, Hall TM, Kokelaar RF, Ahmed B. Plasticity of temporal pattern codes for vocalization stimuli in primary auditory cortex. J Neurosci 26: 4785–4795, 2006. doi: 10.1523/JNEUROSCI.4330-05.2006. [DOI] [PMC free article] [PubMed] [Google Scholar]
- 54.Shannon RV, Zeng F-G, Kamath V, Wygonski J, Ekelid M. Speech recognition with primarily temporal cues. Science 270: 303–304, 1995. doi: 10.1126/science.270.5234.303. [DOI] [PubMed] [Google Scholar]
- 55.Van Tasell DJ, Soli SD, Kirby VM, Widin GP. Speech waveform envelope cues for consonant recognition. J Acoust Soc Am 82: 1152–1161, 1987. doi: 10.1121/1.395251. [DOI] [PubMed] [Google Scholar]
- 56.Wang L, Narayan R, Grana G, Shamir M, Sen K. Cortical discrimination of complex natural stimuli: can single neurons match behavior? J Neurosci 27: 582–589, 2007. doi: 10.1523/JNEUROSCI.3699-06.2007. [DOI] [PMC free article] [PubMed] [Google Scholar]
- 57.Grimault N, Bacon SP, Micheyl C. Auditory stream segregation on the basis of amplitude-modulation rate. J Acoust Soc Am 111: 1340–1348, 2002. doi: 10.1121/1.1452740. [DOI] [PubMed] [Google Scholar]
- 58.Strickland EA, Viemeister NF. The effects of frequency region and bandwidth on the temporal modulation transfer function. J Acoust Soc Am 102: 1799–1810, 1997. doi: 10.1121/1.419617. [DOI] [PubMed] [Google Scholar]
- 59.O’Connor KN, Yin P, Petkov CI, Sutter ML. Complex spectral interactions encoded by auditory cortical neurons: relationship between bandwidth and pattern. Front Syst Neurosci 4: 145, 2010. doi: 10.3389/fnsys.2010.00145. [DOI] [PMC free article] [PubMed] [Google Scholar]
- 60.O’Connor KN, Petkov CI, Sutter ML. Adaptive stimulus optimization for auditory cortical neurons. J Neurophysiol 94: 4051–4067, 2005. doi: 10.1152/jn.00046.2005. [DOI] [PubMed] [Google Scholar]
- 61.Saleem K, Logothetis NK. A Combined MRI and Histology Atlas of the Rhesus Monkey Brain in Sterotaxic Coordinates. Burlington, MA: Academic Press, 2007. [Google Scholar]
- 62.Martin RF, Bowden DM. A stereotaxic template atlas of the macaque brain for digital imaging and quantitative neuroanatomy. Neuroimage 4: 119–150, 1996. doi: 10.1006/nimg.1996.0036. [DOI] [PubMed] [Google Scholar]
- 63.Merzenich MM, Brugge JF. Representation of the cochlear partition on the superior temporal plane of the macaque monkey. Brain Res 50: 275–296, 1973. doi: 10.1016/0006-8993(73)90731-2. [DOI] [PubMed] [Google Scholar]
- 64.Rauschecker JP, Tian B. Mechanisms and streams for processing of “what” and “where” in auditory cortex. Proc Natl Acad Sci USA 97: 11800–11806, 2000. doi: 10.1073/pnas.97.22.11800. [DOI] [PMC free article] [PubMed] [Google Scholar]
- 65.Tian B, Rauschecker JP. Processing of frequency-modulated sounds in the lateral auditory belt cortex of the rhesus monkey. J Neurophysiol 92: 2993–3013, 2004. doi: 10.1152/jn.00472.2003. [DOI] [PubMed] [Google Scholar]
- 66.Goldberg JM, Brown PB. Response of binaural neurons of dog superior olivary complex to dichotic tonal stimuli: some physiological mechanisms of sound localization. J Neurophysiol 32: 613–636, 1969. doi: 10.1152/jn.1969.32.4.613. [DOI] [PubMed] [Google Scholar]
- 67.Mardia KV, Jupp PE. Directional Statistics. Chichester, UK: J. Wiley, 2000. [Google Scholar]
- 68.Yin P, Johnson JS, O'Connor KN, Sutter ML. Coding of amplitude modulation in primary auditory cortex. J Neurophysiol 105: 582–600, 2011. doi: 10.1152/jn.00621.2010. [DOI] [PMC free article] [PubMed] [Google Scholar]
- 69.Green DM, Swets JA. Signal Detection Theory and Psychophysics. Huntington, NY: Krieger Publishing Company, 1974. [Google Scholar]
- 70.Britten K, Shadlen M, Newsome W, Movshon J. The analysis of visual motion: a comparison of neuronal and psychophysical performance. J Neurosci 12: 4745–4765, 1992. doi: 10.1523/JNEUROSCI.12-12-04745.1992. [DOI] [PMC free article] [PubMed] [Google Scholar]
- 71.Britten KH, Newsome WT, Shadlen MN, Celebrini S, Movshon JA. A relationship between behavioral choice and the visual responses of neurons in macaque MT. Vis Neurosci 13: 87–100, 1996. doi: 10.1017/s095252380000715x. [DOI] [PubMed] [Google Scholar]
- 72.Kang I, Maunsell JHR. Potential confounds in estimating trial-to-trial correlations between neuronal response and behavior using choice probabilities. J Neurophysiol 108: 3403–3415, 2012. doi: 10.1152/jn.00471.2012. [DOI] [PMC free article] [PubMed] [Google Scholar]
- 73.Johnson JS, Niwa M, O'Connor KN, Sutter ML. Amplitude modulation encoding in the auditory cortex: comparisons between the primary and middle lateral belt regions. J Neurophysiol 124: 1706–1726, 2020. doi: 10.1152/jn.00171.2020. [DOI] [PMC free article] [PubMed] [Google Scholar]
- 74.Ponvert ND, Jaramillo S. Auditory thalamostriatal and corticostriatal pathways convey complementary information about sound features. J Neurosci 39: 271–280, 2019. doi: 10.1523/JNEUROSCI.1188-18.2018. [DOI] [PMC free article] [PubMed] [Google Scholar]
- 75.Lakatos P, Musacchia G, O'Connel MN, Falchier AY, Javitt DC, Schroeder CE. The spectrotemporal filter mechanism of auditory selective attention. Neuron 77: 750–761, 2013. doi: 10.1016/j.neuron.2012.11.034. [DOI] [PMC free article] [PubMed] [Google Scholar]
- 76.Otazu GH, Tai L-H, Yang Y, Zador AM. Engaging in an auditory task suppresses responses in auditory cortex. Nat Neurosci 12: 646–654, 2009. doi: 10.1038/nn.2306. [DOI] [PMC free article] [PubMed] [Google Scholar]
- 77.Schwartz ZP, Buran BN, David SV. Pupil-associated states modulate excitability but not stimulus selectivity in primary auditory cortex. J Neurophysiol 123: 191–208, 2020. doi: 10.1152/jn.00595.2019. [DOI] [PMC free article] [PubMed] [Google Scholar]
- 78.Ni AM, Maunsell JHR. Neuronal effects of spatial and feature attention differ due to normalization. J Neurosci 39: 5493–5505, 2019. doi: 10.1523/JNEUROSCI.2106-18.2019. [DOI] [PMC free article] [PubMed] [Google Scholar]
- 79.Treue S, Trujillo JCM. Feature-based attention influences motion processing gain in macaque visual cortex. Nature 399: 575–579, 1999. doi: 10.1038/21176. [DOI] [PubMed] [Google Scholar]
- 80.Chambers AR, Hancock KE, Sen K, Polley DB. Online stimulus optimization rapidly reveals multidimensional selectivity in auditory cortical neurons. J Neurosci 34: 8963–8975, 2014. doi: 10.1523/JNEUROSCI.0260-14.2014. [DOI] [PMC free article] [PubMed] [Google Scholar]
- 81.Jaramillo S, Borges K, Zador AM. Auditory thalamus and auditory cortex are equally modulated by context during flexible categorization of sounds. J Neurosci 34: 5291–5301, 2014. doi: 10.1523/JNEUROSCI.4888-13.2014. [DOI] [PMC free article] [PubMed] [Google Scholar]
- 82.Chen X, Hoffmann K-P, Albright TD, Thiele A. Effect of feature-selective attention on neuronal responses in macaque area MT. J Neurophysiol 107: 1530–1543, 2012. doi: 10.1152/jn.01042.2010. [DOI] [PMC free article] [PubMed] [Google Scholar]
- 83.Mirabella G, Bertini G, Samengo I, Kilavik BE, Frilli D, Della Libera C, Chelazzi L. Neurons in area V4 of the macaque translate attended visual features into behaviorally relevant categories. Neuron 54: 303–318, 2007. doi: 10.1016/j.neuron.2007.04.007. [DOI] [PubMed] [Google Scholar]
- 84.Sasaki R, Uka T. Dynamic readout of behaviorally relevant signals from area MT during task switching. Neuron 62: 147–157, 2009. doi: 10.1016/j.neuron.2009.02.019. [DOI] [PubMed] [Google Scholar]
- 85.Uka T, Sasaki R, Kumano H. Change in choice-related response modulation in area MT during learning of a depth-discrimination task is consistent with task learning. J Neurosci 32: 13689–13700, 2012. doi: 10.1523/JNEUROSCI.4406-10.2012. [DOI] [PMC free article] [PubMed] [Google Scholar]
- 86.Ruff DA, Born RT. Feature attention for binocular disparity in primate area MT depends on tuning strength. J Neurophysiol 113: 1545–1555, 2015. doi: 10.1152/jn.00772.2014. [DOI] [PMC free article] [PubMed] [Google Scholar]
- 87.Fusi S, Miller EK, Rigotti M. Why neurons mix: high dimensionality for higher cognition. Curr Opin Neurobiol 37: 66–74, 2016. doi: 10.1016/j.conb.2016.01.010. [DOI] [PubMed] [Google Scholar]
- 88.Nobre AC, Rao A, Chelazzi L. Selective attention to specific features within objects: behavioral and electrophysiological evidence. J Cogn Neurosci 18: 539–561, 2006. doi: 10.1162/jocn.2006.18.4.539. [DOI] [PubMed] [Google Scholar]
- 89.Downer JD, Verhein JR, Rapone BC, O’Connor KN, Sutter ML. An emergent population code in primary auditory cortex supports selective attention to spectral and temporal sound features. bioRxiv, 2020. doi: 10.1101/2020.03.09.984773. [DOI] [PMC free article] [PubMed]
- 90.Maunsell JHR. Neuronal mechanisms of visual attention. Annu Rev Vis Sci 1: 373–391, 2015. doi: 10.1146/annurev-vision-082114-035431. [DOI] [PMC free article] [PubMed] [Google Scholar]


