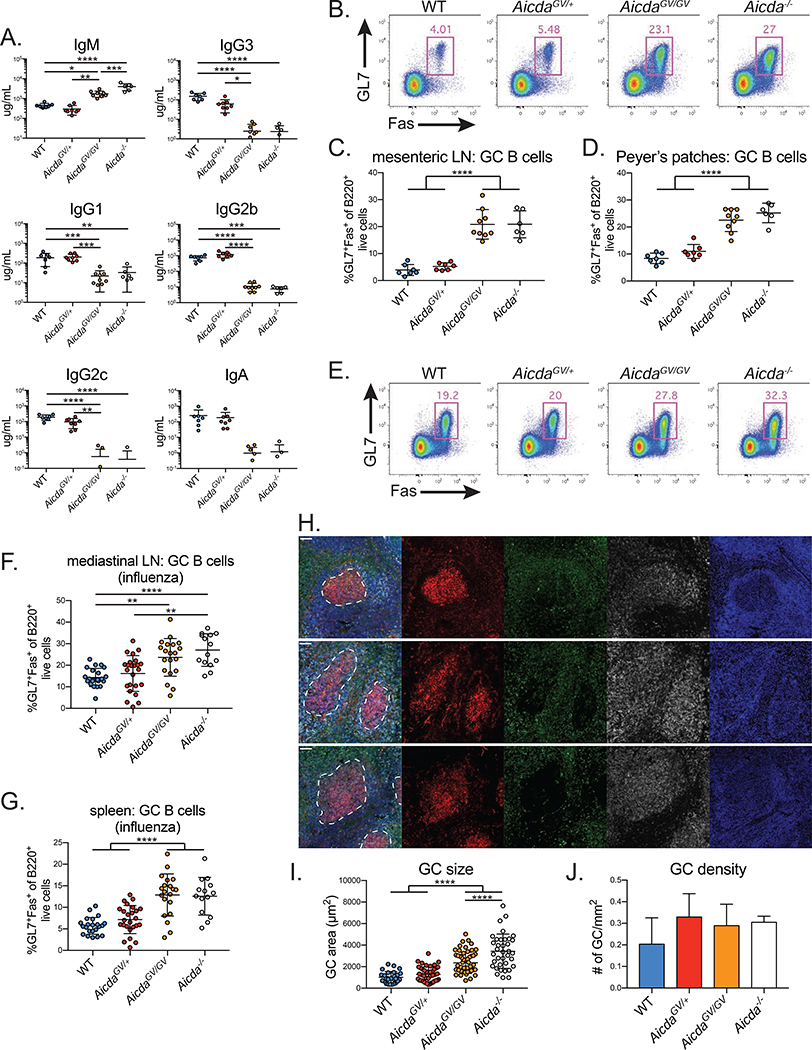
Figure 1. AicdaGV/GV mice model hyper-IgM type 2 syndrome.
(A) Quantification of homeostatic serum immunoglobulin concentrations by ELISA. (B-D) Homeostatic germinal center (GC) hyperplasia in AicdaGV/GV secondary lymphoid organs. (B) Representative GC B cell gates (GL7+Fas+ of B220+ live cells) from mesenteric lymph node (LN). Quantification of GC B cell frequency within the mesenteric LN (C) or Peyer’s patches (D). (E-J) Influenza A virus GC hyperplasia. Mice were intranasally infected with 50 TCID50 PR8 and analyzed at d21 post-infection. (E) Representative GC B cell gates (GL7+Fas+ of B220+ live cells) from mediastinal LN. Quantification of GC B cell frequency within the mediastinal LN (F) or spleen (G). (H) Representative immunofluorescent images from splenic sections stained with PNA (red), anti-IgD (green), anti-B220 (grey), and DAPI (blue). Scale bar represents 50 μm. Quantification of GC size (I) and density (J). Data in (A-D) are from 2 independent experiments with 1–6 mice per genotype, (E-G) are from 5 independent experiments with 2–8 mice per genotype, (H-J) are from 1 experiment with 3–4 mice per genotype. AicdaGV/GV, AicdaG133V/G133V. Error bars represent the mean ± std. dev. *p < 0.05; **p < 0.01; ***p < 0.001; ****p < 0.0001; p-values calculated using a one-way ANOVA with Tukey’s multiple comparisons test without pairing.

