

Abstract
A variety of visual cues can trigger defensive reactions in mice and other species. In mice, looming stimuli that mimic an approaching aerial predator elicit flight or freezing reactions, while sweeping stimuli that mimic an aerial predator flying parallel to the ground typically elicit freezing. The retinal ganglion cell (RGC) types involved in these circuits are largely unknown. We previously discovered that loss of RGC subpopulations in Brn3b knockout mice results in distinct visual response deficits. Here, we report that retinal or global loss of Brn3b selectively ablates the fleeing response to looming stimuli while leaving the freeze response intact. In contrast, freezing responses to sweeping stimuli are significantly affected. Genetic manipulations removing three RGC subpopulations (Brn3a+ betta RGCs, Opn4+Brn3b+, and Brn3c+Brn3b+ RGCs) result in milder phenocopies of Brn3b knockout response deficits. These findings show that flight and freezing responses to distinct visual cues are mediated by circuits that can already be separated at the level of the retina, potentially by enlisting dedicated RGC types.
NEW & NOTEWORTHY Flight and freezing response choices evoked by visual stimuli are controlled by brain stem and thalamic circuits. Genetically modified mice with loss of specific retinal ganglion cell (RGC) subpopulations have altered flight versus freezing choices in response to some but not other visual stimuli. This finding suggests that “threatening” visual stimuli may be computed already at the level of the retina and communicated via dedicated pathways (RGCs) to the brain.
Keywords: Brn3b/Pou4f2 transcription factor, defensive behavior, looming stimuli, retinal ganglion cells, sweep stimuli
INTRODUCTION
Many species, including houseflies, crabs, zebrafish, frogs, turtles, rhesus monkeys, and humans (Dill 1974; Hayes and Saiff 1967; Holmqvist and Srinivasan 1991; Schiff 1965; Schiff et al. 1962; Yamamoto et al. 2003; Yonas et al. 1978) will move out of the perceived path of collision or flinch away when presented with a visual stimulus simulating a rapidly approaching object/animal (Budnik et al. 2016; Dick et al. 2017; Dunn et al. 2016; Jang et al. 2016; Sen et al. 2017; Shragai et al. 2017; Simmons et al. 2013; Temizer et al. 2015; Wu et al. 2016; Yamawaki 2019; Yin et al. 2019). Several recent studies have documented fleeing and/or freezing reactions in response to looming (approach) and sweeping (“fly-over”) stimuli in mice (De Franceschi et al. 2016; Evans et al. 2018; Huang et al. 2017; Salay et al. 2018; Shang et al. 2015, 2018; Wei et al. 2015; Yilmaz and Meister 2013; Zhao et al. 2014). As shown in these studies, the type of defensive reaction and its intensity can vary with stimulus characteristics and context (presence or absence of a shelter, number of stimulus repeats, previous familiarity with the experimental arena, etc.). The superior colliculus (SC), a mesencephalic retinorecipient area conserved across all vertebrates, is an important link in the visually evoked defensive behavior circuitry and participates in the choice between flight or freezing in different contexts. The role of SC laminae and the dorsal periaqueductal gray in visually evoked defensive behaviors (VEDBs) has been dissected in several recent studies (Evans et al. 2018; Liang et al. 2015; Shang et al. 2015, 2018; Wei et al. 2015). In addition, several thalamic regions are implicated in loom responses (Evans et al. 2018; Salay et al. 2018; Shang et al. 2015, 2018; Wei et al. 2015). However, it is not yet clear how the visual information for looming and sweep stimuli is carried from the eye to retinorecipient areas of the brain. Recent studies begin to catalogue retinal ganglion cell (RGC) signals into the SC, and the moving stimuli motion preferences of different SC neurons (Gale and Murphy 2014, 2016, 2018; Reinhard et al. 2019).
Two populations of RGCs have been suggested as potential mediators of VEDBs to looming. The OFF-transient alpha cell spiking rate is significantly increased by looming stimuli in vitro (Münch et al. 2009). Bistratified RGCs with recursive dendrite morphologies resembling some Brn3c RGCs project to the retinoraphe nucleus and are thought to mediate looming responses based on in vivo optogenetic and chemogenetic inactivation experiments (Huang et al. 2017). Elegant viral tracing experiments suggest that overlapping RGC subpopulations synapse onto SC neurons that relay information relevant for VEDBs to either lateral posterior thalamic nucleus (LP) or parabigeminal nucleus (PBGN)(Reinhard et al. 2019). It should be pointed out that, in the absence of vision, mice can rely on cognitive spatial maps to escape to the nest when presented with a threatening stimulus (Vale et al. 2017). Somatosensory input from the vestibular and proprioceptive systems (self-motion) via the vestibular and dorsal root ganglia and the whisker map via the trigeminal ganglion provide information for acquisition of these spatial maps and help the mouse to navigate (Diamond et al. 2008; Geva-Sagiv et al. 2015; Laurens and Angelaki 2018; Mittelstaedt and Mittelstaedt 1980; Poulter et al. 2018; Whishaw 1985).
To identify potential RGC types involved in responses to looming and sweeping stimuli, we tested several genetically modified mouse lines known to carry deficits in various RGC subpopulations. First, we analyzed an allelic series at the Pou4f2/Brn3b locus. Brn3bKO/KO mice are missing subpopulations of RGCs and exhibit a variety of documented visual defects. Brn3b is a POU domain transcription factor expressed in RGCs, several SC laminae and nuclei and the dorsal periaqueductal gray (dPAG), all stations implicated in processing of VEDBs (Xiang et al. 1993). In addition, Brn3b-positive neurons can be found in the trigeminal ganglion (TGG), dorsal root ganglia (DRG), and spiral and vestibular ganglia (Erkman et al. 1996; Sajgo et al. 2016; Xiang et al. 1993, 1995). However the only known phenotype of Brn3b loss is within the retina, and Brn3bKO/KO mice exhibit a 70–80% reduction in RGC numbers (Badea et al. 2009; Erkman et al. 1996; Xiang et al. 1993). Distinct RGC populations are selectively affected by loss of Brn3b in a cell-autonomous and cell-nonautonomous manner. While some cell types appear largely unaffected, others are completely missing, and some cells exhibit striking morphological defects in axon and dendrite formation (Badea et al. 2009; Badea and Nathans 2011; Shi et al. 2013). Although reduced in numbers, both OFF-alpha transient RGCs and bistratified RGCs similar with the retinoraphe projecting cells are found in Brn3b null retinas (Badea and Nathans 2011; Shi et al. 2013). Consistent with the broad RGC loss, axonal projections to several retinorecipient areas are affected, resulting in specific visual behavior deficits. Vertical optokinetic responses (OKR) are absent, due to complete loss of RGC projections to the medial terminal nucleus, while horizontal OKR and horizontal optomotor responses (OMR) are significantly reduced but not abolished, as a consequence of loss of RGC projections to the nucleus of the optic tract and dorsal terminal nucleus (Badea et al. 2009; Kretschmer et al. 2017). In addition, RGC projections to the olivary pretectal nucleus (OPN) are significantly affected, resulting in severely impaired pupillary light reflex (PLR) (Badea et al. 2009). Brn3b positive RGCs do not project to the suprachiasmatic nucleus (SCN) however circadian photoentrainment is affected with variable penetrance, potentially via a cell-nonautonomous effect onto Brn3b negative M1 ipRGCs or cell-autonomously by affecting ipRGCs projecting to the intergeniculate leaflet (IGL) (Badea et al. 2009; Chen et al. 2011). Lateral geniculate nucleus (LGN) projections are reduced significantly but not eliminated (Badea et al. 2009). RGC projections to the SC are significantly affected by Brn3b loss (Badea et al. 2009). Given the importance of RGCs, SC, and dPAG in VEDBs, we decided to investigate these responses in mice with RGC deficits resulting from germ-line or retina-specific ablation of Brn3b.
The transcription factor Brn3a/Pou4f1 is expressed in most projection sensory neurons of the body, including RGCs, DRGs, TGG, vestibular ganglion, and spiral ganglion, and is essential for survival of large fractions of these neurons(Gerrero et al. 1993; Huang et al. 1999, 2001; Ichikawa et al. 2002a, 2002b, 2002c, 2004, 2005a, 2005b, 2005c, 2009; Quina et al. 2005; Xiang et al. 1996; Zou et al. 2012). General Brn3a ablation is perinatal lethal. While Brn3a is expressed in most adult RGCs, retina-specific ablation of Pou4f1/Brn3a using a conditional knockin reporter allele (Brn3aCKOAP) results in ablation of RGCs with small and dense dendritic arbors (“betta-like”), morphologically similar to several motion sensitive types (Badea et al. 2009; Badea and Nathans 2011; Jacoby and Schwartz 2017; Rousso et al. 2016; Shi et al. 2013; Zhang et al. 2012).
The extensively characterized intrinsically photosensitive RGC cell types expressing the photopigment Opn4 (Melanopsin), are subdivided in at least six cell types, including ON, OFF, and ON-OFF laminating widefield RGCs with sparse dendritic arbors (high melanopsin expressors, M1-M3), an ON-alpha RGC morphology (M4), a type laminating in close proximity to the GCL (M5), and a bistratified RGC (M6) (Chen et al. 2011; Hattar et al. 2002; Schmidt et al. 2011). We have previously shown that there is a significant but not complete overlap between Brn3b and Opn4 expression. Opn4+Brn3b+ RGC ablation in Opn4Cre/WT; Brn3bcDTA/WT mice (which likely removes OPN-prjecting M1s, and M2-M6 cells) results in loss of pupillary light reflex (PLR), while circadian photoentrainment is preserved (Chen et al. 2011).
The transcription factor Brn3c is expressed in a more limited subset of RGCs and, significantly, has a limited overlap with Brn3b (Badea and Nathans 2011; Badea et al. 2012; Shi et al. 2013; Xiang et al. 1997). We have recently generated a Brn3cCre allele and found that Brn3c+Brn3b+ RGCs are generally restricted to widefield, OFF laminating dendritic arbor morphologies and exhibit topographic inhomogeneity across the retina, reminiscent of an area centralis (Parmhans et al. 2018, 2020). In this study, we used Brn3cCre/WT; Brn3bcDTA/WT mice to remove this RGC subpopulation.
While none of these genetic manipulations are restricted to removing one specific RGC type, they manipulate relatively well separated, partially overlapping RGC subpopulations. For instance, neither Brn3a nor Brn3c express Opn4, and the betta-like RGCs affected in Brn3a knockout (KO) mice are clearly distinct from the Brn3c+Brn3b+ or Opn4+Brn3b+ populations. It was therefore our expectation that investigating looming and sweep responses in these genetic backgrounds could yield useful information on the RGC requirements for VEDBs.
MATERIALS AND METHODS
Mice.
The following previously characterized mouse lines were used: Brn3aKO (Xiang et al. 1996), Brn3bKO (Gan et al. 1996), Pde6brd1 (Bowes et al. 1990; Dräger and Hubel 1978; Pittler and Baehr 1991), Rax:Cre (Klimova et al. 2013), Brn3aCKOAP and Brn3bCKOAP (Badea et al. 2009; Badea and Nathans 2011; Shi et al. 2013), Opn4Cre (Chen et al. 2011; Ecker et al. 2010), and Brn3bcDTA (Chen et al. 2011; Mu et al. 2005). The Brn3cCre line, recently generated in our group, expresses Cre recombinase in Brn3c/Pou4f3 RGCs (Badea and Nathans 2011; Badea et al. 2012; Parmhans et al. 2018, 2020; Shi et al. 2013). To generate retina-specific Brn3b−/− mice we used two different approaches. First, we crossed Rax:Cre; Brn3bKO/WT males with Brn3bCKOAP/CKOAP females to produce both Rax:Cre; Brn3bCKOAP/WT and Rax:Cre; Brn3bCKOAP/KO offspring. In addition, we crossed Rax:Cre; Brn3bCKOAP/WT males with Brn3bCKOAP/CKOAP females to produce both Rax:Cre; Brn3bCKOAP/WT and Rax:Cre; Brn3bCKOAP/CKOAP offspring. To obtain retina-specific Brn3a ablation, we crossed Rax:Cre; Brn3aKO/WT males with Brn3aCKOAP/CKOAP females to produce both Rax:Cre; Brn3aCKOAP/WT and Rax:Cre; Brn3aCKOAP/KO offspring. To obtain selective ablation of RGCs expressing both Brn3b and Opn4, we crossed Opn4Cre/WT males to Brn3bcDTA/WT females and obtained Opn4Cre/WT; Brn3bcDTA/WT mice, in which expression of the diphtheria toxin subunit A (DTA) is induced by Cre recombination and results in cell-autonomous cell death (Chen et al. 2011). To obtain selective ablation of RGCs expressing both Brn3b and Brn3c, we crossed Brn3cCre/WT males to Brn3bcDTA/WT females and obtained Brn3cCre/WT; Brn3bcDTA/WT mice. Mice used were adults of both sexes (7–36 wk) and were housed with one to three same-sex mice, with food and water available ad libitum. Light cycle was 16:8 light-dark (light = 9:00 AM until 5:00 PM) at experiment start and was changed to 12:12 light-dark (light = 7:00 AM until 7:00 PM) with no apparent effects on behavior. Behavior testing was done from 9 AM to 1 PM for all mice. For all looming and sweeping experiments, Brn3bWT/WT, Brn3bKO/WT, Brn3bKO/KO, Opn4Cre/WT; Brn3bcDTA/WT, Brn3cCre/WT; Brn3bcDTA/WT and blind (rd1) mice were on C57/Bl6 background while Rax:Cre; Brn3bCKOAP/KO, Rax:Cre; Brn3bCKOAP/WT, Rax:Cre; Brn3bCKOAP/CKOAP, Rax:Cre; Brn3aCKOAP/WT, and Rax:Cre; Brn3aCKOAP/KO mice were of mixed C57/Bl6-SV129 background. For qOMR, Brn3bWT/WT, Brn3bKO/WT, Brn3bKO/KO, Opn4Cre/WT; Brn3bcDTA/WT, Brn3cCre/WT; Brn3bcDTA/WT mice, and littermate controls were on a C57Bl6 background while all Rax:Cre; Brn3CKOAP (both Brn3a and Brn3b) were of mixed C57/Bl6-SV129 background. All animal procedures were approved by the National Eye Institute (NEI) Animal Care and Use Committee under Protocol NEI640.
Arena and setup.
Arena was a 53.3 cm × 53.3 cm × 34.3 cm (length × width × height) white opaque box with a 57.0 cm × 31.0 cm (1,920 × 1,080 pixels) monitor (refresh rate 60 Hz) resting on top for stimulus display (Supplemental Fig. S1, A and B; all Supplemental material is available at https://doi.org/10.6084/m9.figshare.c.5127533.v1.
A refuge was placed against the middle of the only wall not touching the stimulus screen. Stimuli were generated in MATLAB (MathWorks) using the freely available Psychophysics Toolbox (Brainard 1997; Kleiner et al. 2007; Pelli 1997). Mice were recorded with a Logitech C920 HD Pro Webcam [at 10–25 frames/s (fps)], using ImageJ software (Wayne Rasband, https://imagej.nih.gov/ij/) and the webcam capture plugin written by Jerome Mutterer (Rueden et al. 2017). Each mouse was tested three to four times per stimulus condition (in rare instances, 2 or 5 trials/condition were acquired for some animals), with only one trial/day and resting at least one full day between trials. Experiments and raw data analysis were performed with experimenter unaware of mouse genotype, with the exception of blind mice that were tested at a later date. For each trial, mice were gently placed in the arena and allowed to adapt and explore the arena and the nest for 7 min. If a mouse did not enter the nest within 7 min of being placed in arena, adaptation time was extended until the mouse entered the nest. Recordings were triggered manually after the 7-min adaptation period and if the mouse was judged by experimenter to be moving toward the center of the arena. Stimulus was triggered at least 10 s after starting the recording and if the mouse was facing the arena center, and mice were recorded for at least 10 s before and 10 s after stimulus was triggered. The 10 s before and 12–15 s after stimulus onset were then analyzed. Stimuli were presented only once per trial. Each animal was tested in only one trial (either looming or sweeping) per day, for a total of three to four times looming and three to four times sweep trials per animal.
Looming stimuli.
Basic looming stimulus was a black disk with a diameter expanding only once from 0 cm (0° visual angle) to 31.5 cm (49.3° visual angle) on gray background screen (contrast ct = 0.55, see below) for 0.25 s [speed ∼200°/s, based on (De Franceschi et al. 2016) and remaining on-screen for 0.5 s after expansion (Supplemental Fig. S1C). For low-contrast trials, looming size and speed were identical to basic stimulus, but stimuli were lightened to bring contrast to 0.2, 0.29, or 0.375. Stimuli were created using Psychtoolbox (version 3) and Psych toolbox displayed using Octave.
Sweeping stimuli.
Basic sweeping stimulus was a 2.6-cm diameter (4.6° visual angle) black circle moving diagonally across gray screen from corner to corner for 4 s (contrast = 0.55, speed = 21.8°/s, based on (De Franceschi et al. 2016)) (Supplemental Fig. S1D). Fast and slow sweep stimuli were identical in size and contrast to basic sweeping stimulus but moved at speeds of 43.5°/s and 10.9°/s, respectively. Big and small sweeping stimuli moved at identical speed to basic sweeping stimulus at identical contrast but occupied visual angles of 7.67° and 1.92° respectively. Stimuli were created and displayed using Psychtoolbox (version 3) and Octave. Note that the stimulus length is shorter (2.76 s) for Figs. 7–10, caused by a slightly redesigned arena [55.4 cm × 55.4 cm × 46.13 cm (length × width × height), with refuge placed in one of the corners adjacent to the wall that does not touch the screen]. A higher arena required an increase in moving disk size and speed to preserve the angular size and velocity and therefore a shorter stimulus on-screen time. All calculations, including behavior computations, took this stimulus length into account.
Fig. 7.

Global and/or retinal specific Brn3b ablation differentially affects freeze and flight responses to sweeping stimuli. A: ethogram of log (mouse speed) across trials for Rax:Cre; Brn3bCKOAP/WT (left) and Rax:Cre; Brn3bCKOAP/CKOAP (right) mice. For Figs. 7–10, basic sweep stimulus was used: a 4.3° black disk moving diagonally across screen at 21.8°/s over 2.76 s at contrast 0.55. Ethogram description is as in Fig. 6A. For speed ethograms and behavior ethograms for all other genotypes in this figure see Supplemental Fig. S8. B: cumulative probability plots of freezing (left), fleeing (middle), and nest entry (right) for Brn3bWT/WT (blue, 3–4 trials/mouse, n = 10 mice), Brn3bKO/KO (red, 3–4 trials/mouse, n = 11 mice), and Brn3bKO/WT (green, 3–4 trials/mouse, n = 10 mice). Data for Brn3bWT/WT and Brn3bKO/KO mice from B are included here again for comparison purposes. C: cumulative probability plots of freezing (left), fleeing (middle), and nest entry (right) for Rax:Cre; Brn3bCKOAP/WT (orange, 3–4 trials/mice, n = 14 mice), Rax:Cre; Brn3bCKOAP/CKOAP (black, 4 trials/mice, n = 12 mice), and Rax:Cre; Brn3bCKOAP/KO (purple, 3–4 trials/mice, n = 10 mice). D: box-whisker plots for freeze reaction times. E: behavior frequency during stimulus. Data are normalized to total number of trials for each genotype. Data points in D and bars in E indicate the 6 Brn3b genotypes, color coded according to A. For D, KS2 test was used, and for E, χ2 test was used to determine significance. For all graphs: *P < 0.05, **P < 0.01, ***P < 0.001.
Fig. 10.

Modest shifts in sweeping-evoked freeze and flight responses in Brn3cCre/WT; Brn3bcDTA/WT mice. A: ethogram of log (mouse speed) across looming response trials for Brn3cCre/WT (left) and Brn3cCre/WT; Brn3bcDTA/WT (right) mice. Stimulus definition and ethogram description as in Fig. 8A. For behavior ethograms, see Supplemental Fig. S9. B: cumulative probability plots of freezing (left), fleeing (middle), and nest entry (right), for Brn3cCre/WT (orange, 4 trials/mouse, n = 7 mice) and Brn3cCre/WT; Brn3bcDTA/WT (black, 4 trials/mouse, n = 10 mice). C: behavior frequency during stimulus for Brn3cCre/WT (orange) and Brn3cCre/WT; Brn3bcDTA/WT (black) mice. Data are normalized to total number of trials for each genotype. D: box-whisker plots for freeze reaction times. For D, KS2 test was used, and for C, χ2 test was used to determine significance. For all graphs: *P < 0.05.
qOMR.
qOMR trials were recorded using the commercially available PhenoSys qOMR setup (https://www.phenosys.com/innovations/visual-acuity-mice/), all at full contrast and moving at 12°/s (Kretschmer et al. 2013, 2015). Each mouse was tested three times/spatial frequency, resting at least one full day between trials. qOMR index was automatically calculated for each trial by the machine’s software. Each blue data point on qOMR graphs (Supplemental Fig. S10) represents the median OMR index for each mouse at each spatial frequency, and each black data point represents the median of those medians. qOMR curves were generated using MATLAB’s cftool function.
Contrast.
For all stimuli, contrast was calculated as Michelson contrast: CM = (Lmax − Lmin)/(Lmax + Lmin) where Lmin and Lmax were set to minimum and maximum screen lookup table (LUT) values of [0 0 0] and [255 255 255], respectively. Total irradiance of the monitor was measured when screen was white, black, and for two intermediate values of gray, and areas under each irradiance curve from x = 425 nm – 700 nm were calculated. The “maximal contrast value” of 0.55 is derived from the fact that the “black” stimuli are set to LUT = [0 0 0], while the background is set to gray. We did not use completely “White” backgrounds (LUT = [255 255 255]), since we found that mice tend to spend most of the time in the refuge under those brightness conditions.
Tracking.
Mice were tracked using the OptiMouse freeware (Ben-Shaul 2017) through MATLAB and manually revised to ensure correct positions. Data were corrected for camera distortion using MATLAB’s transformPointsForward function calibrated to an image of the arena (Supplemental Fig. S1, E–G).
Timing.
To ensure accurate timing, time of trial start, stimulus start, and trial end were recorded by using the GetSecs function in MATLAB. Trial start and end times were compared with the number of frames to calculate accurate frames per second (fps). The timestamp of each frame was assigned by adding the interframe interval (1/fps) to the timestamp of the previous frame and rounding to the nearest tenth of a second to synchronize timing between videos. If the interframe interval was so large as to have a tenth of a second with an unassigned frame, the frames on either side of the missing 0.1 s were averaged to attain the mouse’s position during the missing 0.1 s. If the interframe interval was small enough that multiple frames rounded to the same tenth of a second, every frame rounded to the same 0.1 s was averaged to attain mouse position during that 0.1 s. The mirror reflecting the screen (Supplemental Fig. S1, B, E, and F) was used to assign frame numbers to stimulus onset.
Fleeing criteria.
Ten trials where mice were judged by experimenter to flee from stimulus were analyzed. All data from before stimulus onset were compared to frames after stimulus where mouse appeared to be fleeing. Distance moved and angle of movement vector toward nest before and after stimulus onset were compared, and fleeing was defined as a mouse moving more than 300 pixels/s, or approximately 31 cm/s, with an angle of less than 36.25° to the nest (Supplemental Fig. S1, H and J).
Freezing criteria.
Ten trials where mice were judged by experimenter to freeze in response to stimulus were analyzed. All data from before stimulus onset were compared to frames after stimulus where mouse appeared to be freezing. Distance moved and change in body angle with respect to nest before and after stimulus onset were compared, and freezing was tentatively defined as a mouse moving less than 5 pixel/s or approximately 0.5 cm/s with a change in body angle less than 12°/s. Using those criteria, frames that met the putative freezing criteria were analyzed to ascertain for how many consecutive frames mice met the freezing criteria prior to stimulus onset. The result appeared to have a roughly bimodal distribution, and “true freezing” was consequently defined as a trial where the mouse met the freezing criteria for at least 0.6 s (Supplemental Fig. S1, J and K).
Histograms and cumulative probability plots.
Cumulative probability was calculated as number of trials where a mouse has exhibited the relevant behavior (flee, freeze, or in nest) by each time point along the x-axis, starting from 0.5 s before stimulus onset, then normalized to the total number of trials. For fleeing and freezing behaviors, frames where mouse center of mass was not visible (e.g., hidden under camera or mirror) were not included in total number of trials for that time point. For nest behavior, all trials were included at all time points since it was clear whether the mouse was in the nest even if the center of mass was not visible.
Statistics.
All P values are represented as *P < 0.05, **P < 0.01, ***P < 0.001. Because of nonnormally distributed data (as determined by one-sample Kolmogorov–Smirnov test), the nonparametric test two-sample Kolmogorov–Smirnov test (KS2 test for comparing differing genotype reactions within same conditions) was used. For categorical data such as the number of mice performing a certain behavior, the χ2 test was used. All animals tested were included in the statistical analysis.
Software.
The following publicly or commercially available software and algorithms were used: MATLAB (MathWorks, RRID: SCR_001622), GNU Octave (Free Software Foundation, http://www.gnu.org/software/octave), Psychophysics Toolbox (http://psychtoolbox.org), Optimouse (Yoram Ben-Shaul, http://bmcbiol.biomedcentral.com/articles/10.1186/s12915-017-0377-3), qOMR apparatus and software (PhenoSys GMBH, https://www.phenosys.com/innovations/visual-acuity-mice/-event/), ImageJ (Wayne Rasband, https://imagej.nih.gov), and Webcam Plugin (Jerome Mutterer, https://imagej.nih.gov/ij/plugins/webcam-capture/index.html).
RESULTS
To define the RGC types required for defensive responses to looming and sweep stimuli, we used several well-characterized genetic models of RGC loss (Table 1). To achieve a broad ablation of RGCs, we used Brn3bKO/KO mice (which are missing ∼75% of RGCs), alongside Brn3bKO/WT and Brn3bWT/WT littermate controls (Figs. 1 and 6). Since Brn3b is expressed in other populations of neurons (Gan et al. 1996; Sajgo et al. 2016) and cells outside the nervous system, we eliminated Brn3b specifically in the retina, using the retina-specific Cre driver Rax:Cre, the constitutive Brn3bKO allele, and the Brn3bCKOAP conditional knockin allele from which Brn3b can be ablated and replaced with the alkaline phosphatase histochemical reporter in a Cre-dependent manner) (Badea et al. 2009). In Rax:Cre; Brn3bCKOAP/KO mice, the whole body (including the brain) is Brn3b+/− (heterozygote), while the retina is missing both copies of the Brn3b gene (retina Brn3b−/−-homozygote null). In Rax:Cre; Brn3bCKOAP/CKOAP mice, the retina is missing both copies of the Brn3b gene (retina Brn3b−/−-homozygote null), while the body and brain are wild type. Since Brn3b expression in the retina is restricted to RGCs, retina-specific Brn3b ablation only affects RGC development. Rax:Cre; Brn3bCKOAP/WT littermates, in which the retina is missing only one Brn3b allele (heterozygote), while the rest of the body/brain is wild type, were used as controls (Figs. 2 and 7). These genetic strategies allow us to distinguish effects of Brn3b loss within the retina (i.e., in RGCs), from potential phenotypes related to other sites of Brn3b expression. To ablate RGCs with small, dense dendritic arbors (betta-like RGCs), we selectively removed Brn3a from the retina using Rax:Cre; Brn3aCKOAP/KO mice and Rax:Cre; Brn3aCKOAP/WT (Brn3a retina heterozygote) controls (Figs. 3 and 8). A distinct subset of RGCs, consisting of OPN-projecting M1 ipRGCs and M2-M6 ipRGCs, was targeted using Opn4Cre/WT; Brn3bcDTA/WT mice, by comparing them to Opn4Cre/WT and Brn3bcDTA/WT controls (Figs. 4 and 9). Finally, a narrow subset of OFF widefield RGCs expressing both Brn3b and Brn3c were eliminated using Brn3cCre/WT; Brn3bcDTA/WT mice (Figs. 5 and 10). Mice were subjected to three types of tests: looming stimuli (Figs. 1–5), sweeping stimuli (Figs. 6–10), and control optomotor recordings (Supplemental Fig. S10). For each animal, three to four trials of each test were performed. Each animal was presented to only one trial (either loom, sweep, or OMR) per day and only retested at least 24 h later.
Table 1.
Summary of genotypes analyzed
| Genotype | Somatic Genotype/Phenotype | |
|---|---|---|
| Eye | Body | |
| Brn3bWT/WT | WT | WT |
| Brn3bKO/WT | Brn3b+/− | Brn3b+/− |
| Brn3bKO/KO | Brn3b−/− | Brn3b−/− |
| Rax:Cre; Brn3bCKOAP/WT | Brn3b+/− | WT |
| Rax:Cre; Brn3bCKOAP/CKOAP | Brn3b−/− | WT |
| Rax:Cre; Brn3bCKOAP/KO | Brn3b−/− | Brn3b+/− |
| Rax:Cre; Brn3aCKOAP/WT | Brn3a+/− | WT |
| Rax:Cre; Brn3aCKOAP/KO | Brn3a−/− | Brn3a+/− |
| Brn3bcDTA/WT | Brn3b+/− | Brn3b+/− |
| Opn4Cre/WT | Opn4+/− | Opn4+/− |
| Opn4Cre/WT; Brn3bcDTA/WT | Opn4+Brn3b+ RGC† | Opn4+/−; Brn3b+/− |
| Brn3cCre/WT | Brn3c+/− | Brn3c+/− |
| Brn3cCre/WT; Brn3bcDTA/WT | Brn3c+Brn3b+ RGC† | Brn3c+/−; Brn3b+/− |
| Pdeb6rd1 | Pdeb6rd1 | Pdeb6rd1 |
Genotypes: KO, knockout allele; WT, wild-type allele; Cre, Cre knockin allele; CKOAP, Cre-dependent conditional knockin allele; cDTA, Cre-dependent conditional DTA expression. Effective genotypes in the eye: +/− signifies heterozygosity, −/− is homozygote null. Note that cells carrying the Cre and cDTA alleles are at the same time missing one copy of the endogenous locus for that specific gene (Brn3b, Brn3c, or Opn4). Effective genotypes in the rest of the body are shown. See materials and methods and mouse lines for references. Spacing highlights the groups of experimental and control animals (e.g., Brn3a KO vs. WT, Cre-DTA vs. Cre or DTA, etc.)
For cells that coexpress the Cre and cDTA alleles, DTA expression is activated, resulting in cell death.
Fig. 1.
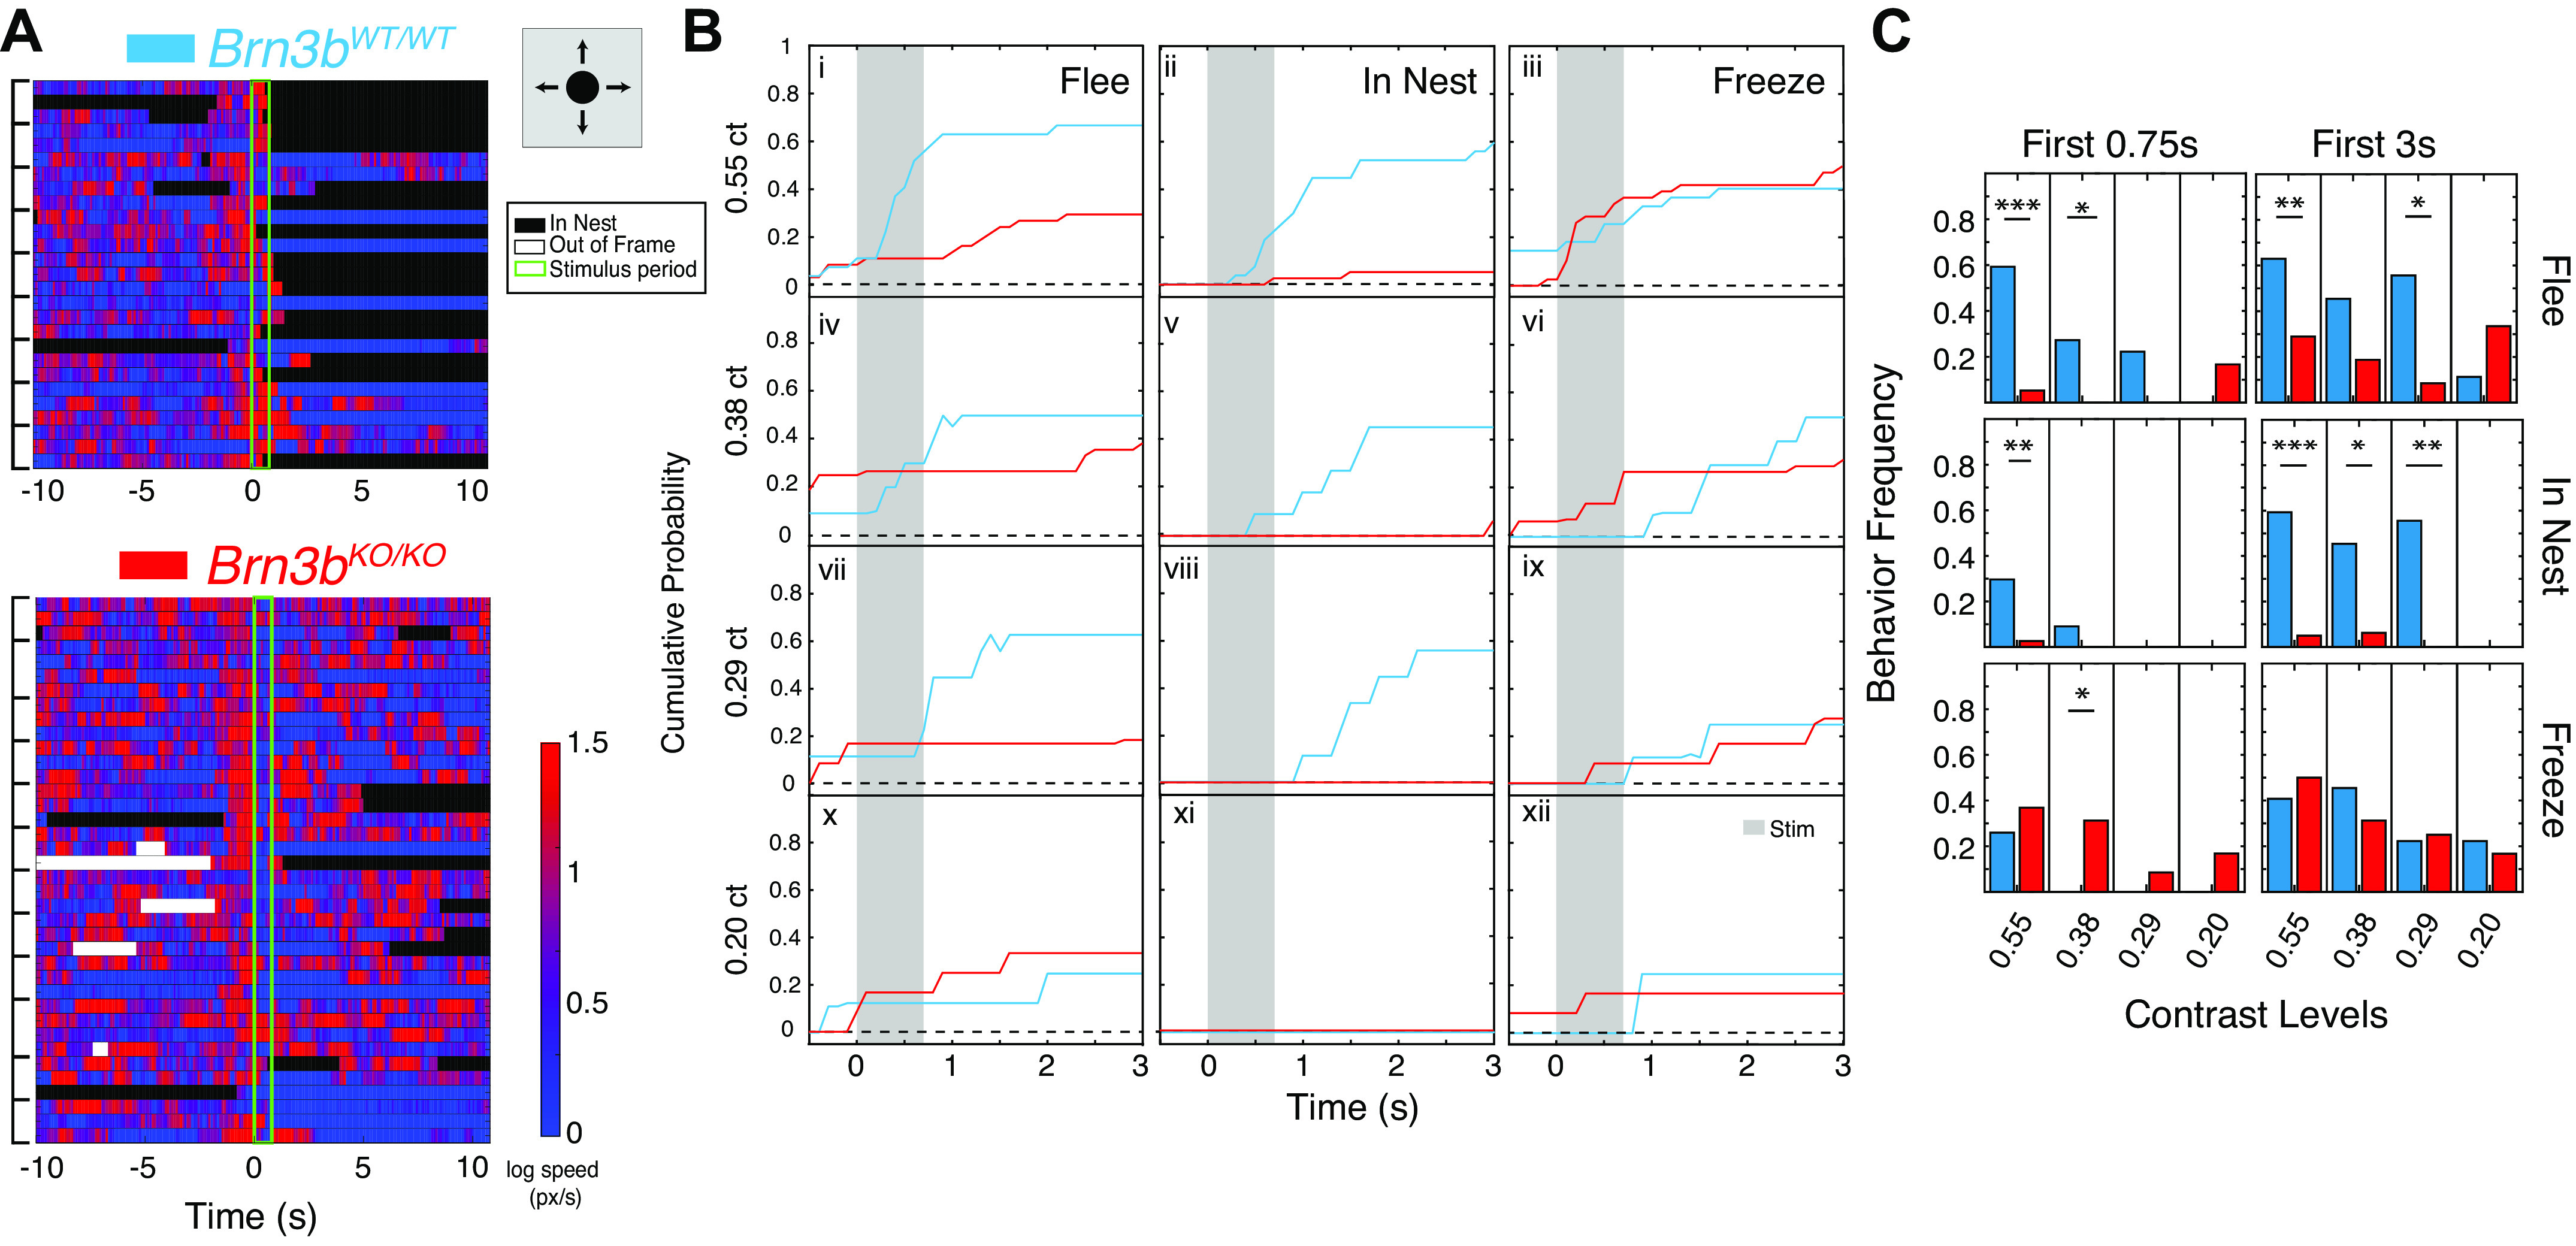
Characterization of flight and freeze responses to looming stimuli in Brn3bKO/KO mice. A: ethogram of log10 (mouse speed) across trials for Brn3bWT/WT (top) and Brn3bKO/KO (bottom) mice. Basic looming stimulus schematic: black disk in center of screen expanding from 0 cm (0°) diameter to 31.5 cm (49.3°) diameter over 250 ms (197°/s), remaining onscreen for 500 ms after expansion at contrast 0.55. Stimulus expands once per trial. Each horizontal track represents 1 trial. For each mouse, 3–4 trials (encompassed by black brackets on the left) are shown in chronological order from top to bottom (i.e., first trial at the top). Time (x-axis) shows 10 s before and after the stimulus (stimulus, t = 0, duration 0.75 s, light green lines). Heat map to the right represents the mouse speed. Black denotes periods of nest entry and white periods during which mouse position was undetermined. For speed ethograms and behavior ethograms for all stimulus conditions, see Supplemental Fig. S4. High speed in these ethograms does not necessarily signify flight toward nest. Behavior assessments of flight computed below also include a directionality toward the nest component (materials and methods). B: cumulative probability plots of fleeing (i, iv, vii, and x), entries into nest (ii, v, viii, and xi), and freezing (iii, vi, ix, and xii) for Brn3bWT/WT (blue, n = 9 mice) and Brn3bKO/KO (red, n = 12) mice, 3 trials/mouse. Freeze and flee behaviors are normalized to total number of viable trials in time bins of 0.1 s; nest entries are normalized to total number of trials at each time point. i–iii: Traces of responses at maximal contrast (0.55). iv-xii: Traces of responses under various contrast conditions (0.375 = iv–vi; 0.29 = vii–ix; 0.2 = x–xii) for Brn3bWT/WT (blue, n = 3 mice) and Brn3bKO/KO (red, n = 4 mice), 3–4 trials/mouse/stimulus. Gray vertical columns indicate the stimulus duration. C: behavior frequency during stimulus presentation (First 0.75 s, left), or within 3 s (First 3 s, right) of stimulus presentation, for Brn3bWT/WT (blue) and Brn3bKO/KO (red) mice. Data are normalized to total number of trials for each genotype. Contrast levels are indicated under the plots. χ2 test was used to determine significance. For all graphs: *P < 0.05, **P < 0.01, ***P < 0.001.
Fig. 6.

Characterization of freeze and flight responses to sweeping stimuli in Brn3bKO/KO mice. A: ethogram of log (mouse speed) across trials for Brn3bWT/WT (left) and Brn3bKO/KO (right) mice. Basic sweeping stimulus schematic: 2.6 cm (4.3°) black disk moving diagonally across screen at 21.8°/s over 4 s at contrast 0.55. Each horizontal bar is 1 trial; trials from each animal are marked with brackets and arranged top to bottom in chronological order (1st trial at the top). Stimulus duration is indicated by green outline, and time (x-axis) is centered on stimulus onset. Black areas denote nest entry, while white areas denote mice out of frame. For behavior ethograms, see Supplemental Fig. S7. B: cumulative probability plots of freezing (i, iv, vii, x, and xiii), flight (ii, v, viii, xi, and xiv), and nest entries (iii, vi, ix, xii, and xv). Freeze and flee behaviors are normalized to total number of viable trials in time bins of 0.1 s; nest entries are normalized to total number of trials at each time point. B, i–iii: responses to basic stimulus conditions (speed 21.8 o/s, spot diameter = 4.3°) for Brn3bWT/WT (blue, 3–4 trials/mouse, n = 10 mice) and Brn3bKO/KO (red, 3–4 trials/mouse, n = 11 mice). B, iv–vi: responses to “Big” stimulus conditions (speed 21.8 o/s, spot diameter = 7.67°). B, vii–ix: Responses to “Small” stimulus conditions (speed 21.8 o/s, spot diameter = 1.92°). B, x–xii: responses to “Fast” stimulus conditions (speed 43.5 o/s, spot diameter = 4.3°). B, xiii–xv: Responses to “Slow” stimulus conditions (speed 10.9 o/s, spot diameter = 4.3°). Experiments for each condition in iv–xv were carried out for Brn3bWT/WT (blue, 2–4 trials, n = 8 mice) and Brn3bKO/KO mice (red, 2–4 trials, n = 6 mice). C: number of trials where behavior was observed during stimulus period, normalized to total number of trials. In C–E, stimulus variants are indicated under the plots and colors of bars refer to mouse genotypes as indicated in A. D: time spent freezing for each trial, normalized to length of stimulus. Trials where no reactions were observed within stimulus period excluded. No significant differences found between the different genotypes under optimal (basic) stimulus conditions. Asterisks indicate significant effect of stimulus speed on normalized time spent freezing for WT mice. E: freeze reaction times. Trials with freezing episode starting before stimulus onset or after stimulus end excluded. For C, χ2 test was used to determine significance. For D and E, KS2 test was used to determine significance within same condition between genotypes, and Kruskal-Wallis test was used to determine whether there was an effect of size/speed of stimulus on reaction time or time spent freezing. For all graphs: *P < 0.05, **P < 0.01, ***P < 0.001.
Fig. 2.

Global and/or retinal-specific loss of Brn3b abolishes flight but not freeze responses to looming stimuli. A: ethogram of log (mouse speed) across looming response trials for Rax:Cre; Brn3bCKOAP/WT (left), and Rax:Cre; Brn3bCKOAP/CKOAP (right) mice. Stimulus definition and ethogram description are shown. For speed ethograms and behavior ethograms for all other genotypes in this figure, see Supplemental Fig. S5. B: Cumulative probability plots of fleeing (left), nest entry (middle), and freezing (right), for Brn3bWT/WT (blue, 3 trials/mouse, n = 9 mice), Brn3bKO/KO (red, 3 trials/mouse, n = 12 mice), and Brn3bKO/WT (green, 4 trials/mouse, n = 10 mice). Data for Brn3bWT/WT and Brn3bKO/KO mice from i–iii are included here again for comparison purposes. C: cumulative probability plots of fleeing (left), nest entry (middle), and freezing (right) for Rax:Cre; Brn3bCKOAP/WT (orange, 3–4 trials/mice, n = 14 mice), Rax:Cre; Brn3bCKOAP/CKOAP (black, 4 trials/mice, n = 12 mice), and Rax:Cre; Brn3bCKOAP/KO (purple, 3–4 trials/mice, n = 10 mice). D: behavior frequency during stimulus (First 0.75 s, left), or within 3 s (First 3 s, right) of stimulus presentation, for the 6 Brn3b genotypes, color coded according to A. Data are normalized to total number of trials for each genotype. E and F: box-whisker plots for flee (E) and freeze (F) reaction times for trials where reaction was observed within 3 s of basic loom stimulus onset. Box indicates the interquartile interval, dots the individual datapoints, red line the median, and whisker the full range of observations. Trials with freezing/fleeing episode starting before stimulus onset and lasting into stimulus period excluded. For E and F, KS2 test was used, and for D, χ2 test was used to determine significance. For all graphs: *P < 0.05, **P < 0.01, ***P < 0.001.
Fig. 3.

Looming-evoked flight to freeze shifts in retinal Brn3a knockout (KO) mice. A: ethogram of log (mouse speed) across looming response trials for Rax:Cre; Brn3aCKOAP/WT (left) and Rax:Cre; Brn3aCKOAP/KO (right) mice. Stimulus definition and ethogram description as in Fig. 2A. For behavior ethograms, see Supplemental Fig. S5. B: cumulative probability plots of fleeing (left), nest entry (middle), and freezing (right) for Rax:Cre; Brn3aCKOAP/WT (blue, 3–4 trials/mouse, n = 11 mice) and Rax:Cre; Brn3aCKOAP/KO (orange, 3–4 trials/mouse, n = 10 mice). C: behavior frequency during stimulus (First 0.75 s, left), or within 3 s (First 3 s, right) of stimulus presentation, for Rax:Cre; Brn3aCKOAP/WT (blue) and Rax:Cre; Brn3aCKOAP/KO (orange) mice. Data are normalized to total number of trials for each genotype. D: box-whisker plots for flee (left) and freeze (right) reaction times for trials where reaction was observed within 3 s of basic loom stimulus onset. Significance was determined using χ2 test for C and KS2 test for D. For all graphs: *P < 0.05, **P < 0.01.
Fig. 8.

Sweep-evoked freeze and flight responses in retinal Brn3a knockout (KO) mice. A: ethogram of log (mouse speed) across sweep response trials for Rax:Cre; Brn3aCKOAP/WT (left) and Rax:Cre; Brn3aCKOAP/KO (right) mice. Stimulus definition and ethogram description as in Fig. 7A. For behavior ethograms, see Supplemental Fig. S8. B: cumulative probability plots of freezing (left), fleeing (middle), and nest entry (right) for Rax:Cre; Brn3aCKOAP/WT (blue, 3–4 trials/mouse, n = 11 mice) and Rax:Cre; Brn3aCKOAP/KO (orange, 3–4 trials/mouse, n = 10 mice). C: behavior frequency during stimulus for Rax:Cre; Brn3aCKOAP/WT (blue) and Rax:Cre; Brn3aCKOAP/KO (orange) mice. Data are normalized to total number of trials for each genotype. D: box-whisker plots for freezing reaction times. For D, KS2 test was used, and for C, χ2 test was used to determine significance. For all graphs: *P < 0.05, **P < 0.01.
Fig. 4.

Diminished looming-evoked flight in Opn4Cre/WT; Brn3bcDTA/WT mice. A: ethogram of log (mouse speed) across looming response trials for Brn3bcDTA/WT (left), Opn4Cre/WT (middle), and Opn4Cre/WT; Brn3bcDTA/WT (right) mice. Stimulus definition and ethogram description as in Fig. 2A. For behavior ethograms, see Supplemental Fig. S6. B: cumulative probability plots of fleeing (i), nest entry (ii), and freezing (iii) for Brn3bcDTA/WT (blue, 4 trials/mouse, n = 9 mice), Opn4Cre/WT (green, 4 trials/mouse, n = 9 mice), and Opn4Cre/WT; Brn3bcDTA/WT (red, 4 trials/mouse, n = 11 mice). C: behavior frequency during stimulus (First 0.75 s, left), or within 3 s (First 3 s, right) of stimulus presentation, for Brn3bcDTA/WT (blue), Opn4Cre/WT (green), and Opn4Cre/WT; Brn3bcDTA/WT (red). Data are normalized to total number of trials for each genotype. D: box-whisker plots for flee (left) and freeze (right) reaction times for trials where reaction was observed within 3 s of basic loom stimulus onset. Significance was determined using χ2 test for C and KS2 test for D. For all graphs: *P < 0.05.
Fig. 9.

Flight and freeze reactions to sweeping stimuli are not affected in Opn4Cre/WT; Brn3bcDTA/WT mice. A: ethogram of log (mouse speed) across sweeping response trials for Brn3bcDTA/WT (left), Opn4Cre/WT (middle), and Opn4Cre/WT; Brn3bcDTA/WT (right) mice. Stimulus definition and ethogram description as in Fig. 7A. For behavior ethograms, see Supplemental Fig. S9. B: cumulative probability plots of freezing (left), fleeing (middle), and nest entry (right) for Brn3bcDTA/WT (blue, 4 trials/mouse, n = 9 mice), Opn4Cre/WT (green, 4 trials/mouse, n = 9 mice), and Opn4Cre/WT; Brn3bcDTA/WT (red, 4 trials/mouse, n = 11 mice). C: box-whisker plots for freeze reaction times. D: behavior frequency during stimulus, for Brn3bcDTA/WT (blue), Opn4Cre/WT (green), and Opn4Cre/WT; Brn3bcDTA/WT (red). Data are normalized to total number of trials for each genotype. For C, KS2 test was used, and for D, χ2 test was used to determine significance. For all graphs: *P < 0.05.
Fig. 5.

Looming-evoked flight-to-freeze shifts in Brn3cCre/WT; Brn3bcDTA/WT mice. A: ethogram of log (mouse speed) across looming response trials for Brn3cCre/WT (left) and Brn3cCre/WT; Brn3bcDTA/WT (right) mice. Stimulus definition and ethogram description as in Fig. 2A. For behavior ethograms, see Supplemental Fig. S6. B: cumulative probability plots of fleeing (left), nest entry (middle), and freezing (right) for Brn3cCre/WT (orange, 4 trials/mouse, n = 7 mice) and Brn3cCre/WT; Brn3bcDTA/WT (black, 4 trials/mouse, n = 10 mice). C: behavior frequency during stimulus (First 0.75 s, left), or within 3 s (First 3 s, right) of stimulus presentation, for Brn3cCre/WT (orange) and Brn3cCre/WT; Brn3bcDTA/WT (black). Data are normalized to total number of trials for each genotype. D: box-whisker plots for flee (left) and freeze (right) reaction times for trials where reaction was observed within 3 s of basic loom stimulus onset. Significance was determined using χ2 test for C and KS2 test for D.
Brn3bKO/KO mice show altered ratio of flee versus freeze behaviors in response to looming stimuli.
We first sought to establish responses to looming stimuli in our WT mice. Consistent with previous reports (De Franceschi et al. 2016), WT mice reacted primarily by fleeing to the nest and less frequently by freezing when presented with a single expansion of the loom stimulus (contrast = 0.55; Fig. 1A, top; Fig. 1, B, i–iii, blue line; Supplemental Fig. S4A; Supplemental Movie S1). During the stimulus period (0.75 s) WT mice fled toward the nest in the majority of trials (0.59), and entered the nest in 0.296 of trials, while freezing occurred only in 0.259 of trials (Fig. 1C, n = 9 WT mice, 3 trials/mouse). Some fleeing, freezing, and nest entries continue to accumulate in the time immediately following cessation of the stimulus and tend to reach a plateau at ∼3 s poststimulus presentation. In the 3-s period following stimulus, onset flight was still more common (0.63 of trials) than freezing (0.407 of trials), and the majority of mice managed to reach the nest (Fig. 1C, 0.593 of trials).
Interestingly, Brn3bKO/KO mice exhibited a strong preference for freezing over flight in response to the looming stimulus (Supplemental Movie S2; Fig. 1A, bottom; Supplemental Fig. S4B; Fig. 1, Bi–iii, red line, n = 12 mice, 3–4 trials/mouse). The during-stimulus flight response was nearly absent in Brn3bKO/KO mice (0.053 of trials, P = 1.63e-6, significance vs. Brn3bWT/WT, χ2 test), although some exhibited moderate and delayed flight responses over the 3-s period (Fig. 1, B and C, ct = 0.55, 0.29 of trials, P = 0.0063, significance vs. Brn3bWT/WT, χ2 test). In fact, the percentage of Brn3bKO/KO trials with a flight response during the stimulus period (0.75 s) did not differ significantly from that of blind mice (Supplemental Fig. S2, n= 5 blind mice, 3 trials/mouse; P = 0.5 at 3 s and P = 0.4 at 0.75 s, χ2 test). Unsurprisingly, Brn3bKO/KO mice reached the nest far less than Brn3bWT/WT mice both during the stimulus (0.026 of trials, P = 0.0019, χ2 test) and in the 3 s after stimulus onset (Fig. 1, B and C, ct = 0.55, 0.053 of trials P = 2e-6, χ2 test). However, both immediate (0.368 of trials over 0.75 s) and delayed (0.50 of trials over 3 s) freezing responses were increased in Brn3bKO/KO compared with Brn3bWT/WT mice, without reaching statistical significance (Fig. 1, B and C , ct = 0.55, χ2 test, P = 0.35 and P = 0.46, respectively). Recent work (Evans et al. 2018) shows that decreasing the contrast of the loom stimulus reduces stimulus saliency, as revealed by delayed reactions, reduced probability of flight, and lower maximum flight speed. To compare the visual response deficits we see in our Brn3bKO/KO mice to the effects of decreasing stimulus saliency, we subjected them to loom trials at three lower contrast levels (Fig. 1, B, iv–xii; Supplemental Fig. S4, C–H, ct: 0.38, 0.29, or 0.2; n = 3 Brn3bWT/WT mice; n = 4 Brn3bKO/KO mice; 3–4 trials/mouse/stimulus). Confirming previous reports, contrast reduction resulted in delayed fleeing and nest entry responses in Brn3bWT/WT controls (Fig. 1, B, i–ii, iv–v, vii–viii, and x–xi, blue traces), with almost complete loss of responses at 0.2 ct levels. No freezing was observed for any low-contrast Brn3bWT/WT trial during the stimulus period (0.75 s, Fig. 1B, vi, ix, and xii, blue, Fig. 1C). However, some delayed freezing responses were observed over the 3-s period (Fig. 1, B and C, WT, right). Interestingly, the ratio of fleeing to freezing reactions in Brn3bWT/WT animals was not significantly affected by contrast (P = 0.66 at 3 s, P = 0.49 at 0.75 s, χ2 test across all contrast levels). This shows that fleeing and freezing behaviors decrease at approximately the same rate in response to contrast and gives no evidence of a “switch” from flight to freezing as a result of a reduced saliency of the visual input to the brain. Whereas all responses are gradually reduced by contrast reduction in Brn3bKO/KO mice, freezing responses are predominant both during the stimulus period (0.75 s, Fig. 1B, iii, vi, ix, and xii, red traces, Fig. 1C), and over the entire 3-s interval following stimulus onset (3 s, Fig. 1B, iii, vi, ix, and xii, and C . Thus, regardless of the saliency of the looming stimulus, loss of Brn3b results in a switch in the response preference from fleeing to freezing.
Retina-specific Brn3b ablation is sufficient to induce a flee-to-freeze behavioral switch in response to looming stimuli.
To investigate whether the VEDB defects observed in Brn3bKO/KO mice were exclusively produced by RGC deficits and not by other neuronal defects, we used the basic looming stimulus (ct = 0.55) to test two lines of retina-specific Brn3b knockout mice (Rax:Cre; Brn3bCKOAP/KO and Rax:Cre; Brn3bCKOAP/CKOAP) as well as two controls: full-body (Brn3bKO/WT) and retinal (Rax:Cre; Brn3bCKOAP/WT) Brn3b heterozygotes (Fig. 2; Supplemental Fig. S5 and Supplemental Table S1). Both Rax:Cre; Brn3bCKOAP/KO, and Rax:Cre; Brn3bCKOAP/CKOAP mice had nearly no flights to the nest (Fig. 2, A, C, and D; Supplemental Fig. S5), both during stimulus (flight ratios = 0.029 and 0.042) and at 3 s (flight ratios = 0.114 and 0.083), showing significant reductions relative to the Rax:Cre; Brn3bCKOAP/WT heterozygote controls (flight ratio = 0.532, P = 1.27e-6 and 1.18e-7 during stimulus, and ratio = 0.553 at 3 s, P = 0.4e-4 and 0.8e-6 at 3 s). Not surprisingly, nest entries were nearly absent for the two retina-specific Brn3b null strains, both during stimulus and at 3 s (Fig. 2, C and D, middle; Supplemental Fig. S5). In contrast, freeze reactions were not significantly affected, both during stimulus or at the 3-s time point (Fig. 2, C and D, bottom; Supplemental Fig. S5). In addition, flight reaction times for full-body (Brn3bKO/KO) and retina-specific (Rax:Cre; Brn3bCKOAP/KO and Rax:Cre; Brn3bCKOAP/CKOAP) Brn3b null mice were delayed relative to controls (reaching significance for Brn3bKO/KO and Rax:Cre; Brn3bCKOAP/KO; Fig. 2E; Supplemental Table S1), while freeze reaction times were reduced (reaching significance for Rax:Cre; Brn3bCKOAP/KO and Brn3bCKOAP/CKOAP; Fig. 2F; Supplemental Table S1).
No looming response deficits in Brn3b heterozygote animals.
In Rax:Cre; Brn3bCKOAP/KO mice, in addition to loss of both Brn3b copies from the retina, the Brn3bKO allele results in whole body Brn3b heterozygosity. In some instances, phenotypes associated with heterozygote dosages of transcription factors have been described. We therefore analyzed VEDBs to loom responses in whole body (Brn3bKO/WT) and retina (Rax:Cre; Brn3bCKOAP/WT) Brn3b heterozygotes. Brn3bKO/WT mice had no significant differences from Brn3bWT/WT in flight, in-nest, or freeze reactions (Fig. 2, B, D, and E; Supplemental Fig. S5; Supplemental Table S1; P > 0.05 for all parameters, χ2 test). There was no difference in reaction time for fleeing behaviors between Brn3bWT/WT and Brn3bKO/WT mice (Fig. 2E, P = 0.29, KS2 test) and only a modest effect on freeze reaction time (Fig. 2F, P= 0.0157). Retinal Brn3b heterozygote mice (Rax:Cre; Brn3bCKOAP/WT) had a similar behavior profile to Brn3bWT/WT mice, both during the stimulus period (0.75 s; Fig. 2C, orange traces; Fig. 2D, fleeing = 0.532, nest entry = 0.128, and freezing = 0.213 of trials) and in the extended poststimulus period (3 s; Fig. 2D, fleeing = 0.553, nest entry = 0.361 and freezing = 0.383 of trials). We note that a fraction of Rax:Cre; Brn3bCKOAP/WT mice exhibited a variant of escape response that can also be observed in other genotypes: the animals will occasionally flee toward the nest without entering it and subsequently freeze along the nest’s perimeter. We have scored this behavior as simply fleeing, without recording a nest entry event. However, it is possible that this behavior indicates a mild visual deficit in retinal Brn3b heterozygotes.
For each genotype group, mice of both sexes were tested and no differences were found between sexes (data not shown). Furthermore, mouse position and angle within the arena at stimulus onset did not influence the results (Supplemental Fig. S3). Raw data traces for all experiments are presented in Figs. 1 and 2 and corresponding Supplemental Figs. S4 and S5, and the set of trials for each animal is encompassed by brackets, with the first trial on the top and the last at the bottom. In addition, the resulting behavior ethograms for all experiments are presented in Supplemental Figs. S4 and S5, documenting all flight, in nest, and freeze reactions for each mouse and each trial, beginning with the first trial at the top. Each mouse was tested for maximum four trials, and no significant adaptation was seen as a result of trial accumulation.
Together, these data indicate that retina-specific loss of Brn3b is sufficient to induce the switch from fleeing to freezing, likely due to loss of specific RGC populations. Brn3b heterozygosity, either globally or at the level of the retina, does not significantly impact responses to looming stimuli. To narrow down the RGC types required for responses to looming stimuli, we analyzed several genetic manipulation strategies, relying on RGC loss secondary to transcription factor ablation (Brn3a) or subpopulation-specific RGC ablation using Cre-dependent DTA activation based on intersectional genetics (Opn4 × Brn3b and Brn3c × Brn3b).
Mice with retinal Brn3a ablation have reduced flight responses to looming stimuli.
We tested responses to looming stimuli in mice with retina-specific Brn3a ablation (Rax:Cre; Brn3aCKOAP/KO, n = 10 mice, 3–4 trials/mouse) and Brn3a retina heterozygote controls (Rax:Cre; Brn3aCKOAP/WT, n = 11 mice, 3–4 trials/mouse) (Fig. 3; Supplemental Fig. S5; Supplemental Table S1). Rax:Cre; Brn3aCKOAP/WT flight, in nest, and freeze reactions were not significantly different from those of wild-type mice (e.g., the Brn3bWT/WT controls; see Supplemental Table S1 for statistics). However, Rax:Cre; Brn3aCKOAP/KO had somewhat reduced flight responses both during stimulus (ratios = 0.324 KO vs. 0.61 Het, P = 0.011, χ2 test) and after 3 s (ratios = 0.514 KO vs. 0.71 Het, P = 0.079, χ2 test), resulting in reduced nest entries both during stimulus (ratios = 0.054 vs 0.17, KO vs. Het, P = 0.107, χ2 test) and after 3 s (ratios = 0.351 vs. 0.659, KO vs. Het, P = 0.0067, χ2 test; Fig. 3, B and C; Supplemental Fig. S5). In contrast, the number of freeze reactions was mildly increased (n.s., χ2 test; Fig. 3, B and C). Flight and freeze reaction times were not significantly different between Rax:Cre; Brn3aCKOAP/KO and Rax:Cre; Brn3aCKOAP/WT mice (Fig. 3D). Overall, retinal loss of Brn3a results in a milder phenocopy of the Brn3b ablation, with a switch from flight to freeze in response to looming stimuli, but with a far less dramatic reduction in flight responses.
Genetic ablation of Opn4+Brn3b+ or Brn3c+Brn3b+ RGCs results in partial flight response deficits to looming stimuli.
To investigate the role of further Brn3b+ RGC subpopulations in looming responses, we tested Opn4Cre/WT; Brn3bcDTA/WT (n = 11 mice 4 trials/mouse) alongside Opn4Cre/WT (n = 9 mice, 4 trials/ mouse) and Brn3bcDTA/WT (n = 9 mice, 4 trials/ mouse) controls (Fig. 4; Supplemental Fig. S6; Supplemental Table S1). Opn4Cre/WT and Brn3bcDTA/WT had flight, in nest, and freeze reactions indistinguishable from the wild-type controls (Brn3bWT/WT; Fig. 4, A and B, blue and green traces; Fig. 4C, blue and green bars; Fig. 4D, blue and green dots; Supplemental Table S1). However Opn4Cre/WT; Brn3bcDTA/WT mice showed reduced flight responses during stimulus (flight ratio = 0.25, P = 0.0106 vs. Brn3bcDTA/WT and 0.0206 vs. Opn4Cre/WT, χ2 test) resulting in fewer nest entries (in nest ratio = 0.022, P = 0.0234 vs. Brn3bcDTA/WT and 0.1042 vs. Opn4Cre/WT, χ2 test; Fig. 4, B and C; Supplemental Table S1). While both flight and in nest responses were reduced at the 3 s time point, they were not statistically different from those of the two control strains, signifying perhaps a delayed reaction to the stimulus (Fig. 4, B and C). As for the other RGC defective lines, freeze reactions were somewhat increased in the Opn4Cre/WT; Brn3bcDTA/WT line relative to the controls (ratios of 0.318 and 0.431 during stimulus and at 3 s), without reaching statistical significance (Fig. 4, B and C). Flight reaction times were modestly delayed and freeze reaction times accelerated in Opn4Cre/WT; Brn3bcDTA/WT mice compared with controls, without reaching statistical significance (Fig. 4D). Thus ablation of Opn4+Brn3b+ RGCs results in a similar phenotype to the one seen in Brn3a KO mice, despite impacting a clearly distinct subpopulaton of RGCs.
To determine the roles of the Brn3b+Brn3c+ subpopulation of RGCs, we tested the responses to looming stimuli in Brn3cCre/WT; Brn3bcDTA/WT (n = 10 mice, 4 trials/ mouse) and Brn3cCre/WT controls (n = 7 mice, 4 trials/ mouse; Fig. 5; Supplemental Fig. S6). Brn3cCre/WT; Brn3bcDTA/WT mice exhibited reduced flight (ratio = 0.1 during stimulus and 0.3 at 3 s) and in nest (ratio = 0.05 during stimulus and 0.175 at 3 s) responses while freezing responses were comparable to those of the wild-type (Brn3bWT/WT) strain (Fig. 5, A–C, black traces and bars). However, flight, in nest and freezing reactions of Brn3cCre/WT controls were also reduced, albeit to a lesser degree, suggesting that the Brn3cCre/WT line carries a looming phenotype, resulting either from a line background effect or Brn3c heterozygosity. Due to this effect, flight and in nest responses in Brn3cCre/WT; Brn3bcDTA/WT mice were statistically significant reduced in comparison to the Brn3bcDTA/WT parental strain (Fig. 4, B and C; Supplemental Fig. S6 and Supplemental Table S1) or to wild types (Brn3bWT/WT) but not to those in Brn3cCre/WT mice (Fig. 5, C and D; Supplemental Table S1).
Taken together, results in Figs. 1–5 strongly suggest that flight responses to looming stimuli depend on several nonoverlapping RGCs populations, while freezing reactions are surprisingly robust to loosing either a large fraction of RGCs (75% in the Brn3b-null strains, Figs. 1 and 2) or several distinct subpopulations (Figs. 3–5). It is possible that freezing responses are relatively easier to trigger, perhaps by a variety of visual stimuli and/or RGC subpopulations.
Loss of Brn3b attenuates freezing responses to sweeping stimuli.
Freezing is the predominant reaction observed when mice are exposed to a sweep stimulus that mimics a predator flying over the mouse (De Franceschi et al. 2016). We therefore asked how Brn3bWT/WT and Brn3bKO/KO mice react to sweeping stimuli over a range of conditions centered on the previously described optimal stimulus (“basic”, speed = 21.8°/s, visual angle = 4.3°; Fig. 6; Supplemental Fig. S7). For each of these variations on the sweeping stimulus, we either doubled or halved size (Fig. 6B, “big”: speed = 21.8°/s, visual angle = 7.67°; “small”: speed = 21.8°/s, visual angle = 1.92°) or speed (“fast”: speed = 43.5°/s, visual angle = 4.3°; “slow”: speed = 10.9°/s, visual angle = 4.3°) of the moving disk. Under basic ( = optimal) conditions, freezing during stimulus presentation was observed in 0.714 of Brn3bWT/WT trials (Fig. 6, A, Bi, and C, n = 10 mice, 3–4 trials/mouse), compared with very low rates of fleeing and nest entry (0.086 and 0.057, respectively; Supplemental Movie S3; Fig. 6, A, B, and ii–iii , blue traces; Fig. 6C, blue bars, n = 10 mice, 3–4 trials/mouse). Freezing was predominant in Brn3bWT/WT mice regardless of stimulus size or speed, but the number of responses was reduced to about half when the small stimulus was used, and not significantly altered in any other condition (Fig. 6B, i, iv, vii, x, xiii, and C, big: 0.727, P = 0.91 vs. basic; small: 0.375, P = 0.001 vs. basic; fast: 0.791, P = 0.50 vs. basic; slow: 0.72, P = 0.96 vs. basic; for all stimulus variants, n = 8 mice, 2–4 trials/mouse/stimulus, χ2 test).
For basic stimulus conditions, we observed a significantly reduced freeze response in Brn3bKO/KO mice as compared with Brn3bWT/WT mice (Fig. 6, Bi and C P = 0.02, χ2 test). Freezing occurred in 0.444 of Brn3bKO/KO trials, fleeing in 0.111 of trials, and nest entry in 0.083 of trials (Fig. 6, A, B, i-iii, and C, n = 11 mice, 3–4 trials/mouse). The freezing responses of Brn3bKO/KO mice were moderately reduced compared with Brn3bWT/WT mice under all stimulus conditions but reached statistical significance only for the fast and slow stimulus variants (Fig. 6, B and C, big: 0.529, P = 0.2; small: 0.294, P = 0.6; fast: 0.444, P = 0.02; slow: 0.263, P = 0.003, for all genotypes, n = 6 mice, 2–4 trials/mouse/ stimulus, P values vs. Brn3bWT/WT, χ2 test). In addition, for all sweep stimuli except the fast condition, Brn3bKO/KO mice had significantly longer reaction times than Brn3bWT/WT mice (Fig. 6E, basic: P = 5.5e-05, big: P = 0.001 small: P = 0.04, fast: P = 0.39, slow: P = 0.04, KS2 test).
Overall, these results indicate that Brn3b loss moderately but significantly impairs freezing in response to sweeping stimuli, but the stimulus is still “correctly” interpreted in terms of the behavioral choice made, regardless of the stimulus properties investigated here. Interestingly, for the trials in which the mice froze, the amount of time spent freezing was not significantly affected, indicating that the strength of the reaction once the threat is detected is not significantly altered (Fig. 6D). Analysis shows no sex differences or correlation between position at start of freeze relative to stimulus and genotype for any of the four genotypes studied (Supplemental Fig. S3, A and B, and data not shown).
Global or retinal Brn3b allele dosage effects on responses to sweeping stimuli.
Freeze responses to sweep stimuli were predominant in all lines of our Brn3b allelic series (Fig. 7; Supplemental Fig. S8; Supplemental Table S1 for statistics). Similar to the full Brn3b null line (Brn3bKO/KO), freezing was somewhat reduced in the two retina Brn3b null lines (Fig. 7, A, right, C, and E, Rax:Cre; Brn3bCKOAP/CKOAP, black traces/bars, ratio = 0.542, P = 0.595, n = 12 mice, 4 trials/mouse, and Rax:Cre; Brn3bCKOAP/KO, violet traces/bars, ratio = 0.371, P = 0.044, n = 10 mice, 3–4 trials/mouse, P values vs. Rax:Cre; Brn3bCKOAP/WT, χ2 test). Flee and in nest reactions were very rare in all Brn3b null lines (Brn3bKO/KO, Rax:Cre; Brn3bCKOAP/CKOAP and Rax:Cre; Brn3bCKOAP/KO, Fig. 7, B, C, and E), similar to their prevalence in the Brn3bWT/WT controls.
The global and retinal heterozygote lines had similar rates of freezing when compared with wild type (Fig. 7, B, left, C, and E, Brn3bKO/WT, green traces/bars, ratio = 0.872, n = 10 mice, 3–4 trials/mouse, P = 0.092, Rax:Cre; Brn3bCKOAP/WT, orange traces/bars, ratio = 0.596, n = 14 mice, 3–4 trials/mouse, P = 0.266, χ2 tests vs. Brn3bWT/WT), and their freeze reaction times were comparable to those in the wild-type controls (Fig. 7D, P > 0.5, KS2 test). However, both heterozygote lines showed markedly more fleeing and entries into the nest than Brn3bWT/WT mice (Fig. 7, B, left, C, and E, Brn3bKO/WT, flight ratio = 0.282, P = 0.011, in nest ratio = 0.128, P = 0.117. Rax:Cre; Brn3bCKOAP/WT, flight ratio = 0.426, P = 0.2e-3, in nest ratio = 0.277, P = 0.003, χ2 tests vs. Brn3bWT/WT). These surprising findings suggest that missing one copy of Brn3b in the retina and/or the body is sufficient to affect fleeing but not freezing reactions to sweeping stimuli. Two further observations suggest that this heterozygote phenotype is distinct from a complete loss of function. First, increased fleeing and entries into the nest were also observed comparing Rax:Cre; Brn3bCKOAP/KO (which are retinal null and global heterozygotes) with both Rax:Cre; Brn3bCKOAP/CKOAP (retina-specific knockouts) and Brn3bKO/KO (general knockouts), although the difference was not significant (Fig. 7E). Second, general heterozygotes (Brn3bKO/WT) froze significantly more often than Rax:Cre; Brn3bCKOAP/KO mice (Fig. 7E, P = 0.8e-5, χ2 test) but fled and entered the nest in a comparable percentage of trials (Fig. 7E, P = 0.411 for fleeing, P = 0.5557 for nest entries, χ2 test). Thus the three “heterozygote” groups we studied, Brn3bKO/WT (general), Rax:Cre; Brn3bCKOAP/WT (retina specific), and Rax:Cre; Brn3bCKOAP/KO (body heterozygote), exhibit unique phenotypes in sweeping responses that are somewhat distinct from both wild-type (Brn3bWT/WT) and null strains (Brn3bKO/KO and Rax:Cre; Brn3bCKOAP/CKOAP).
Retinal Brn3a ablation affects flight but not freeze reactions to sweeping stimuli.
Sweep stimuli induced mostly freeze responses in both retinal Brn3a knockouts (Fig. 8, A, B, and D; Supplemental Fig. S8H, Rax:Cre; Brn3aCKOAP/KO, red traces/bars, n = 10 mice, 3–4 trials/mouse, freeze ratio = 0.703, P = 0.294 vs. Rax:Cre; Brn3aCKOAP/WT, χ2 test) and heterozygote controls (Fig. 8, A, B, and D, Supplemental Fig. S8G, Rax:Cre; Brn3aCKOAP/WT, blue traces/bars, n = 11 mice, 3–4 trials/mouse, freeze ratio = 0.805, P = 0.354 vs. wild-type, χ2 test). Freeze reaction times were not different between the two genotypes (Fig. 8C). However, flight and in nest responses were more frequent in Rax:Cre; Brn3aCKOAP/WT mice (Fig. 8, B and C, flight ratio = 0.268 vs. 0.027, P = 0.003, in nest ratio = 0.122 vs. 0, P = 0.028, Het vs. KO, χ2 test). This could be due in part to an increase in flight frequency in retinal Brn3a heterozyogte mice (Rax:Cre; Brn3aCKOAP/WT) as compared with wild-type mice (i.e., Brn3bWT/WT, compare Fig. 8, B and C , with Fig. 7, B and E, flight ratio = 0.268 vs. 0.057, P = 0.015, Het vs. WT, χ2 test; Supplemental Table S1).
Freeze reactions to sweeping stimuli are not affected by genetic ablation of Opn4+Brn3b+ or Brn3c+Brn3b+ RGC subpopulations.
We tested Opn4Cre/WT; Brn3bcDTA/WT (n = 11 mice, 4 trials/mouse) alongside Opn4Cre/WT (n = 9 mice, 4 trials/ mouse) and Brn3bcDTA/WT (n = 9 mice, 4 trials/ mouse) controls in our sweep stimulus paradigm (Fig. 9; Supplemental Fig. S9; Supplemental Table S1). While all three lines responded overwhelmingly with freeze reactions, comparable to the wild-type (Brn3bWT/WT), the Opn4Cre/WT line had somewhat increased flight and in nest reactions compared with the Opn4Cre/WT; Brn3bcDTA/WT (Fig. 9, B and D, flight ratio = 0.361 vs. 0.159, P = 0.038, in nest ratio = 0.25 vs. 0.068, P = 0.023, χ2 test). Freeze reaction times were not significantly different from each other (Fig. 9C).
In contrast to the somewhat subdued looming stimulus reactions, Brn3cCre/WT; Brn3bcDTA/WT (n = 10 mice, 4 trials/mouse) and Brn3cCre/WT (n = 7 mice, 4 trials/mouse) had very robust responses to sweep stimuli, dominated by freezing (Fig. 10; Supplemental Fig. S9; Supplemental Table S1). Interestingly, Brn3cCre/WT; Brn3bcDTA/WT mice had increased freeze responses (ratios = 0.875 vs. 0.607, P = 0.0103, χ2 test) and decreased flight and in nest responses (flight ratios = 0.125 vs. 0.321, P = 0.049, in nest ratios = 0.025 vs. 0.179, P = 0.028, χ2 tests), relative to the Brn3cCre/WT line (Fig. 10, B and C; Supplemental Fig. S9, C and D; Supplemental Table S1). It should be pointed out that flight reactions were modestly but significantly increased in Opn4Cre/WT (ratio = 0.361), Brn3cCre/WT (ratio = 0.321) and Brn3bcDTA/WT mice (ratio = 0.222) when compared with wild-type mice (i.e., Brn3bWT/WT, ratio = 0.057, compare Fig. 9, B and D, and 10 to Fig. 7, B and E, P values vs. WT are 0.002, 0.006, and 0.046 respectively, χ2 test; Supplemental Table S1).
Impact of gene dosage or RGC ablation on optomotor responses.
Given the surprising effects of Brn3b heterozygosity on flight responses to sweep stimuli, we looked at the impact of heterozygote gene dosage on another visually driven behavior, the optomotor reflex (OMR). OMR reflects the functionality of the accessory optic system that serves as the visual arm of the vestibulo-ocular coordination system and is significantly affected by global loss of Brn3b (Badea et al. 2009; Kretschmer et al. 2017). We compared OMR responses for our genetically modified strains (Supplemental Fig. S10). As previously published, Brn3bKO/KO mice had significantly lower OMRi amplitudes than Brn3bWT/WT, while Brn3bKO/WT OMR amplitudes were intermediate between the two (Supplemental Fig. S10, A–C, OMRi = 1.86 for Brn3bWT/WT, 1.408 for Brn3bKO/WT, and 1.26 for Brn3bKO/KO at spatial frequency = 0.2; P = 0.033 WT vs. KO, P = 0.0174 WT vs. Het and P = 0.047 KO vs. Het, KS2 tests). OMR responses of retinal Brn3b heterozygotes (Rax:Cre; Brn3bCKOAP/WT, OMRi = 1.29 at 0.2 spatial frequency, Supplemental Fig. S10D) were comparable to general heterozygotes (Brn3bKO/WT, P = 0.11, KS2 test), while retina-specific Brn3b KOs had significantly lower OMR responses compared with the Rax:Cre; Brn3bCKOAP/WT controls (Rax:Cre; Brn3bCKOAP/CKOAP OMRi = 1.155, P = 0.010; Rax:Cre; Brn3bCKOAP/KO OMRi = 1.2, P = 0.024; comparisons at spatial frequency 0.2, KS2 tests; Supplemental Fig. S10, E and F). Finally, OMR responses were not significantly reduced in mice with retina-specific Brn3a ablation or genetic ablation of Brn3c+Brn3b+ and Opn4+Brn3b+ RGCs compared with the respective control lines (Supplemental Fig. S10, G, H, and I–M). This is not surprising since we and others have previously shown that none of these genetic manipulations target ON-DS RGCs, which specifically project to the accessory optic system and subserve the optomotor response. However, we should note that, in general, the OMR amplitudes of both experimental and control lines for these experiments were lower than the ones seen with the Brn3bWT/WT line. This is likely due to the strain background differences and argues for always comparing genetically modified lines with littermates bread in the same background.
DISCUSSION
Here we show that ablation of transcription factor Brn3b in mice is sufficient to induce a behavioral “switch” from flight to freezing in reaction to an approaching stimulus (looming) and to lower the frequency of freezing in response to a “fly-over” stimulus (sweep) (Table 2 for a summary of the observed phenotypes). The switch in responses to looming stimuli is primarily a result of a deficit in fleeing in KO mice and to a lesser extent a result of (insignificantly) increased freezing. The phenotypes are also observed when Brn3b deletion is retina specific, indicating that interpretation of these stimuli starts in the retina. This points to the intriguing possibility that loss of Brn3b selectively affects the RGCs responsible for eliciting flight responses to approach motion while only moderately affecting other object motion-sensing RGCs. Although Brn3b was initially characterized as a transcription factor globally controlling RGC cell fate determination, subsequent characterization revealed more subtle defects in specific RGC types, associated with dedicated projections to specific retinorecipient areas and, consequently, discrete visual deficits (Badea et al. 2009; Erkman et al. 1996; Gan et al. 1996; Kretschmer et al. 2017). Surprisingly, ablating three more narrow and nonoverlapping RGC subpopulations (Brn3a+ betta-like, Opn+Brn3b+ and Brn3c+Brn3b+ RGCs) produces milder, but similar phenotypes reductions in flight with preserved freezing reactions, resulting in flight-to-freeze shifts in response to looming stimuli, Table 2).
Table 2.
Summary of defensive responses to looming/sweeping stimuli in mice with RGC subpopulation defects
| Genotype | Looming |
Sweeping |
RGCs Affected | ||
|---|---|---|---|---|---|
| Flight | Freeze | Freeze | Flight | ||
| Brn3bWT/WT | 0.59 | 0.26 | 0.71 | 0.06 | None |
| Brn3bKO/WT | 0.45 | 0.25 | 0.87 | ↑0.28 | None described |
| Brn3bKO/KO | ↓↓0.05 | 0.37 | ↓0.39 | 0.08 | 75% loss |
| Rax:Cre; Brn3bCKOAP/WT | 0.53 | 0.21 | 0.60 | 0.43 | None described |
| Rax:Cre; Brn3bCKOAP/CKOAP | ↓↓0.04 | 0.35 | 0.54 | ↓0.15 | 75% loss |
| Rax:Cre; Brn3bCKOAP/KO | ↓↓0.03 | 0.34 | ↓0.37 | ↓0.20 | 75% loss |
| Rax:Cre; Brn3aCKOAP/WT | 0.61 | 0.15 | 0.80 | 0.27 | None described |
| Rax:Cre; Brn3aCKOAP/KO | ↓0.32 | 0.27 | 0.70 | ↓0.03 | 20% ≅ “betta RGCs” |
| Brn3bcDTA/WT | 0.53 | 0.22 | 0.64 | 0.22 | None described |
| Opn4Cre/WT | 0.50 | 0.11 | 0.69 | 0.36 | None described |
| Opn4Cre/WT; Brn3bcDTA/WT | ↓0.25 | 0.32 | 0.80 | ↓0.16 | ipRGCs except M1-SCN |
| Brn3cCre/WT | 0.25 | 0.11 | 0.61 | 0.32 | None described |
| Brn3cCre/WT; Brn3bcDTA/WT | ↓0.10 | 0.28 | ↑0.88 | ↓0.13 | OFF widefield |
For each genotype, the flight and freeze response frequencies during stimulus are reported (columns 2–5). The last column reports the affected retinal ganglion cell (RGC) populations, based on previous publications. The arrows indicate significant changes, relative to control strains. Two arrows signify larger differentials. SCN, suprachiasmatic nucleus; ip, intrinsically photosensitive. Spacing highlights the groups of experimental and control animals (i.e., Brn3bKO/KO vs. Brn3bWT/WT, Rax:Cre; Brn3bCKOAP/CKOAP or Rax:Cre; Brn3bCKOAP/KO vs. Rax:Cre; Brn3bCKOAP/WT, Rax:Cre; Brn3aCKOAP/KO vs. Rax:Cre; Brn3aCKOAP/WT, Opn4Cre/WT; Brn3bcDTA/WT vs. Opn4Cre/WT or Brn3bcDTA/WT, Brn3cCre/WT; Brn3bcDTA/WT vs. Brn3cCre/WT).
In contrast, the predominant response to sweep stimuli consists of freezing and is remarkably resilient to RGC genetic manipulations, as it is only modestly reduced in Brn3b null mice (both global and retinal) and is not affected in mice missing either of the three RGC subpopulations (Table 2). This could mean that visual information required to trigger freezing reactions is either very nonspecific (e.g., any kind of perception of motion) or conveyed by a very specific RGC population that has not been impacted by any of the four genetic ablation strategies. Interestingly, for both OMR and sweeping stimuli, retina-specific Brn3b KO mice closely mimic the behavior of global Brn3b KO mice, whereas global or retina-specific Brn3b heterozygotes show mild deficits when compared with WT mice. This could point to an as of yet unnoticed phenotypic change in Brn3b heterozygote mice that merits further investigation. Finally, maximal OMRi amplitudes for control strains in the C57Bl6 background (Brn3bKO/KO and Brn3bWT/WT) and are significantly higher than in mixed C57Bl6/SV129 backgrounds (Brn3a+ betta-like, Opn+Brn3b+ and Brn3c+Brn3b+ experiments), arguing that careful experimentation should always be done by comparing littermate controls, rather than generic wild-type controls. Supporting this conclusion, we note that the control heterozygotes in the mixed strains (Rax:Cre; Brn3bCKOAP/WT, Rax:Cre; Brn3aCKOAP/WT, Brn3bcDTA/WT, Opn4Cre/WT, Brn3cCre/WT) have somewhat increased flight ratios to sweeping stimuli, compared with the WT (Brn3bWT/WT) strain, while the corresponding strain littermates with known RGC defects (Rax:Cre; Brn3bCKOAP/CKOAP, Rax:Cre; Brn3bCKOAP/KO, Rax:Cre; Brn3aCKOAP/KO, Opn4Cre/WT; Brn3bcDTA/WT, Brn3cCre/WT; Brn3bcDTA/WT) have flight response frequencies comparable to the WT (Brn3bWT/WT) and hence significantly reduced compared with their respective controls (Table 2, Supplemental Table S1).
Ablation of Brn3b from the retina results in the loss of 75% of all RGCs but not all populations are equally affected. SCN-projecting M1 ipRGCs, ON-OFF-DS RGCs, and several ON and OFF alpha morphological types are spared, while ON-DS RGCs projecting to the AOS, ipRGCs projecting to the OPN and IGL, and small-dense (“betta-like”) RGCs are completely absent (Badea et al. 2009; Badea and Nathans 2011; Shi et al. 2013). Retina-specific ablation of Brn3a produces a ∼20% loss of RGCs, and betta-like RGCs are essentially absent (Badea et al. 2009; Badea and Nathans 2011; Shi et al. 2013). It should be noted that RGCs surviving Brn3b or Brn3a ablation could still have functional defects not revealed by the analysis of their dendritic arbor and axonal projections. Ablation of Opn4+Brn3b+ ipRGCs in Opn4Cre/WT; Brn3bcDTA/WT mice results in selective elimination of M1 ipRGCs projecting to the OPN and deletion of M2-M6 types that project to the IGL, LGN, and SC. Among these cell types, the ON-alpha sustained and M5 cells have functions beyond control of circadian photoentrainment and pupillary light reflex. One should note that, in principle, any defect of the PLR could affect other visual functions requiring sharp visual contrast and resolution, by eliminating the pinhole effect provided by the pupil. Finally, Brn3c+Brn3b+ RGCs, targeted in Brn3cCre/WT; Brn3bcDTA/WT mice, are restricted to some 10% of RGCs (Parmhans et al. 2020), project exclusively to the dLGN and SC, and belong morphologically to the OFF-widefield classes and bistratified RGCs with recurrent dendrites (Badea and Nathans 2011; Parmhans et al. 2020; Shi et al. 2013). Topographically, they are concentrated in a region of high density with dorso-temporal to ventro-nasal orientation, reminiscent of an area centralis (Parmhans et al. 2020). There is no Opn4 expression in Brn3a+ or Brn3c+ RGCs (Badea et al. 2009; Chen et al. 2011; Jain et al. 2012; Shi et al. 2013). It therefore appears that there is no RGC type overlap between the three more restricted RGC populations targeted (Brn3a+ betta-like, Opn+Brn3b+, and Brn3c+Brn3b+, Table 2).
Most RGC subpopulations targeted in this study project to the SC. Several laboratories have investigated the role of the SC in defense response choices to looming stimuli (Evans et al. 2018; Liang et al. 2015; Shang et al. 2015, 2018; Wei et al. 2015). The decision is partially dependent on context: in the absence of a refuge, looming stimuli can elicit either flight followed by freezing [mediated by parvalbumin (PV)-positive glutamatergic neurons in the superficial gray (SuG) layer of the SC that project to the parabigeminal nucleus (PBGN)] or freezing not preceded by flight [mediated by PV-positive glutamatergic neurons in the optic nerve layer (OP) and/or the medial aspect of the intermediate layer of the SC (ILSCm) that project to the lateral posterior thalamic nucleus (LP)] (Shang et al. 2015, 2018; Wei et al. 2015). In the presence of a refuge, inhibiting the medial aspect of SC deep layers blocks both escape and freeze responses to looming stimuli, while inhibiting the dorsal periaqueductal gray (dPAG; a SC target) results in a switch from escape to freezing responses, similar to the one seen in our genetic manipulations (Evans et al. 2018).
Is the loom stimulus response (flight or freeze) the result of dedicated retinal information pathways or is it computed at the level of the SC? Previous studies suggested two specific RGC populations as likely candidates for looming stimulus detectors: bistratified RGCs that project to both the dorsal raphe nucleus (DRN) and the SC cells synapsing with the LP; and the monostratified OFF-alpha (OFF-transient) PV-5 RGC (Huang et al. 2017; Münch et al. 2009). While it is difficult for us to unambiguously identify the DRN projecting bistratified RGC reported by Huang (Huang et al. 2017), their broad lamination in the IPL bear resemblance to the recursive RGCs expressing Brn3b and/or Brn3c. Based on previous work, both RGC types are still present, even though reduced in numbers in the Brn3bKO/KO mouse (Badea et al. 2009; Badea and Nathans 2011; Chen et al. 2011; Ecker et al. 2010; Parmhans et al. 2018; Shi et al. 2013), and the PV-5 RGC should not be affected in any of the three more restricted manipulations presented here. Previous data suggests that RGCs with recursive arbors could be targeted in the Brn3cCre/WT; Brn3bcDTA/WT mice but not in the other two restricted manipulations, neither of which has complete loss of flight responses. This would then suggest that these cell morphologies are not essential for the flight aspect of the looming VEDB.
A recent study has systematically identified RGC types that synapse onto SC neurons projecting to either the PBGN or the LP (Reinhard et al. 2019). Interestingly, the two circuits comprise partially overlapping RGC subpopulations (morphological types according to http://museum.eyewire.org – physiological types according to RGCtypes.org), with four cell types preferentially innervating the PBGN (physiological type: 27 – “sustained suppressed by contrast”, 37 – “ON-OFF DS”, 5to – “ON transient,” and 8w – “ON-alpha-sustained”), four the LP (2an – “F-mini-OFF”, 4i/4on – “OFF transient small and medium RF”, 6sn “ON transient small RF,” and 6sw – “ON transient medium RF”), and a further six communicating with both circuits (Eyewire = 1wt, 4ow, 5si, 63, 6t, and 8n/9n) (Bae et al. 2018; Reinhard et al. 2019). In addition, Reinhard et al. have recorded PBGN and LP neurons while presenting head-fixed mice with a variety of visual stimuli including two that resemble loom (“expanding discs”) and sweep stimuli (“small-fast”), and found that significant fractions of cells in both nuclei responded to both types of stimuli, with the PBGN showing some preference for sweep stimuli when compared with the LP. The four RGC subpopulations ablated in our current study are not aligned (either completely included or excluded) with the four groups classified by Reinhard (projecting to: PBGN only, LPN only, PBGN + LPN or neither). In fact, one or more cells from each group are affected by our genetic manipulations. As examples, 8w = sONalpha is PBGN preferring and ablated in Opn4Cre/WT; Brn3bcDTA/WT mice, 5to prefers the PBGN and is ablated in Brn3bKO/KO and Rax:Cre; Brn3aCKOAP/KO mice, and 63 = Fmini-ON and 5si = HD1/HD2 connect to both PBGN and LP and are ablated in Brn3bKO/KO and Rax:Cre; Brn3aCKOAP/KO mice. Nevertheless, all four genetic manipulations we attempted affected the flight response. Thus SC neurons projecting to the LP and PBGN (and potentially the dPAG) integrate visual information from several RGC types to generate output that could bias the flight vs. freeze decision in looming. Ablating one or more of these populations, as we have done, completely or partially impairs the flight decision mechanism, while still being able to trigger the freeze reaction. The SC-LP pathway modulates freezing (Shang et al. 2018; Wei et al. 2015), while the SC-PAG (periaqueductal gray) and SC-PBGN pathways tend to modulate flight (Evans et al. 2018; Wei et al. 2015). In a variety of stimulus paradigms, corticotectal projections from the primary visual cortex (V1) can facilitate or enhance reactions to light induced defensive behaviors, (Evans et al. 2018; Liang et al. 2015; Zhao et al. 2014) but do not affect the defensive behavior choice (e.g., fleeing or freezing). Since RGCs provide input to V1 through the LGN and LGN projections are also significantly affected in Brn3bKO/KO animals and all three manipulated subsets, such an indirect pathway could also be involved in the flee-looming deficit.
Another potential interpretation of the behavioral switch in Brn3bKO/KO mice during the looming paradigm is that Brn3b ablation could result in a global RGC defect that reduces the general saliency of the stimulus. It is possible that the reduced number of RGCs in Brn3bKO/KO mice may make it difficult to identify the looming stimulus as anything more specific than “object motion”, thus resulting in a “default” freeze response. This would imply that mice generally freeze in response to low-saliency moving stimuli they cannot interpret. For instance, light flashes can induce temporary arrest behaviors in mice (Liang et al. 2015). These temporary arrest responses were observed during several Brn3bKO/KO loom trials, but they did not last long enough to qualify as freezing by our definition and were difficult to distinguish from noise (e.g., the mouse briefly pausing, grooming, or attending to something else), so they were not quantified. The default freeze interpretation is rendered less likely by our (Fig. 1, B and C) and Evans’s (Evans et al. 2018) observation that reducing the saliency of the loom stimulus by decreasing contrast results in diminished fleeing and freezing responses in WT mice but does not alter the flee to freeze ratio.
Finally, it is still possible that genetic ablation of Brn3b from the SC also has an effect on visually evoked defensive behavior, although this possibility is less likely, given that retina-specific Brn3b KO mice (Rax:Cre; Brn3bCKOAP/KO and Rax:Cre; Brn3bCKOAP/CKOAP) phenocopy fairly faithfully the phenotype seen in full body Brn3b KO mice (Brn3bKO/KO).
We find as previously reported (De Franceschi et al. 2016) that wild-type reactions to sweep stimuli are dominated overwhelmingly by freezing reactions and that these reactions are surprisingly resilient to our genetic manipulations (Table 2). Indeed, freezing is only modestly reduced in full Brn3bKO/KO mice, while still remaining the dominant reaction, and is not affected by the three RGC subpopulation ablations (Table 2). What cell population is mediating responses to the sweep stimuli? An object moving across the visual field could be detected in two ways: a population response involving the successive appearance of the object (or it’s edges) in the receptive fields of a mosaic of one (or more) RGC types that tile the retina or responses of individual RGCs that are specialized for motion detection. Among the currently described motion-sensitive mouse RGCs [ON-direction-selective (DS), ON-OFF-DS, OFF-DS, Foxp2+ RGCs, local edge detectors (LEDs/W3bs), or high-resolution detectors (Jacoby and Schwartz 2017; Kim et al. 2008; Rousso et al. 2016; Sun et al. 2006; Weng et al. 2005; Zhang et al. 2012)], the LEDs or high-resolution detectors are the most likely candidates. A dense-spiny RGC with morphology similar to the high-definition (HD) cells coexpresses Brn3c and Ret but does not express Brn3b (Badea et al. 2009; Parmhans et al. 2018; Shi et al. 2013). The dendritic arbors of these RGCs are enlarged in Brn3bKO/KO mice (Shi et al. 2013), while their total numbers are reduced, mirroring the mildly but significantly reduced freeze responses to sweeping stimuli in Brn3bKO/KO mice. This morphology is not affected by the three more restricted genetic manipulations. They could report object motion using either the single detector or the tiling mechanism. In contrast, if LED (W3b) cells (which are Brn3b positive and nearly completely missing from Brn3bKO/KO animals) mediate the interpretation of the sweeping stimulus, the defect noted in our Brn3bKO/KO animals should have been more pronounced. Of note, Rax:Cre; Brn3aCKOAP/KO mice are missing most, perhaps all, RGC types with small, dense, and thick dendritic arbors such as LED (W3b) cells and high-density motion detectors (betta-like morphologies) but do not show a marked freeze response deficit to sweep stimuli. It is possible that sweep stimulus detection is mediated by one of the motion sensitivity RGCs mildly or not affected in our manipulations. For instance, ON-OFF DS RGCs are only somewhat reduced in numbers in Brn3bKO/KO mice (Shi et al. 2013), and not in the other three manipulations. Alternatively, as discussed above, freezing may represent a default reaction that is easily triggered by incompletely defined motion perceptions, and thus is more resilient to our genetic manipulations.
Taken together, we find that ablating broader (Brn3bKO/KO) or more narrow, nonoverlapping RGC subpopulations (Rax:Cre; Brn3aCKOAP/KO, Opn4Cre/WT; Brn3bcDTA/WT, Brn3cCre/WT; Brn3bcDTA/WT) has surprisingly selective effects on two visually evoked defensive behaviors. Flight responses to looming stimuli are essentially abolished in Brn3bKO/KO mice and affected by deletion of several nonoverlapping RGC subsets, while freeze responses to looming and sweeping stimuli are only mildly or not affected. This leads us to propose that the behavioral significance of these basic, very ancient responses is encoded early in the visual system, likely by integrating visual information from several distinct classes of RGCs in the SC. Freeze responses may be engaged by broader, less precise movement information, while flight responses may require more complete, unaltered, and specific visual stimulus information.
GRANTS
The work was supported through National Eye Institute Intramural Research Project 1ZIAEY000504-07/09 (to T.C. Badea).
DISCLOSURES
No conflicts of interest, financial or otherwise, are declared by the authors.
AUTHOR CONTRIBUTIONS
R.N.L., A.F.A., and T.B. conceived and designed research; R.N.L., A.F.A., and T.B. performed experiments; R.N.L., A.F.A., and T.B. analyzed data; R.N.L., A.F.A., and T.B. interpreted results of experiments; R.N.L., A.F.A., and T.B. prepared figures; R.N.L., and T.B. drafted manuscript; R.N.L., A.F.A., and T.B. edited and revised manuscript; R.N.L., A.F.A., and T.B. approved final version of manuscript.
ACKNOWLEDGMENTS
We acknowledge Momina Tariq for help with the early stages of setup building and stimulus design, Nadia Parmhans for genotyping, and Rich Krauzlis, Jeff Diamond, Samer Hattar, and Bruce Cumming for helpful comments on the manuscript.
REFERENCES
- Badea TC, Cahill H, Ecker J, Hattar S, Nathans J. Distinct roles of transcription factors brn3a and brn3b in controlling the development, morphology, and function of retinal ganglion cells. Neuron 61: 852–864, 2009. doi: 10.1016/j.neuron.2009.01.020. [DOI] [PMC free article] [PubMed] [Google Scholar]
- Badea TC, Nathans J. Morphologies of mouse retinal ganglion cells expressing transcription factors Brn3a, Brn3b, and Brn3c: analysis of wild type and mutant cells using genetically-directed sparse labeling. Vision Res 51: 269–279, 2011. doi: 10.1016/j.visres.2010.08.039. [DOI] [PMC free article] [PubMed] [Google Scholar]
- Badea TC, Williams J, Smallwood P, Shi M, Motajo O, Nathans J. Combinatorial expression of Brn3 transcription factors in somatosensory neurons: genetic and morphologic analysis. J Neurosci 32: 995–1007, 2012. doi: 10.1523/JNEUROSCI.4755-11.2012. [DOI] [PMC free article] [PubMed] [Google Scholar]
- Bae JA, Mu S, Kim JS, Turner NL, Tartavull I, Kemnitz N, Jordan CS, Norton AD, Silversmith WM, Prentki R, Sorek M, David C, Jones DL, Bland D, Sterling AL, Park J, Briggman KL, Seung HS; Eyewirers . Digital museum of retinal ganglion cells with dense anatomy and physiology. Cell 173: 1293–1306.e19, 2018. doi: 10.1016/j.cell.2018.04.040. [DOI] [PMC free article] [PubMed] [Google Scholar]
- Ben-Shaul Y. OptiMouse: a comprehensive open source program for reliable detection and analysis of mouse body and nose positions. BMC Biol 15: 41, 2017. doi: 10.1186/s12915-017-0377-3. [DOI] [PMC free article] [PubMed] [Google Scholar]
- Bowes C, Li T, Danciger M, Baxter LC, Applebury ML, Farber DB. Retinal degeneration in the rd mouse is caused by a defect in the beta subunit of rod cGMP-phosphodiesterase. Nature 347: 677–680, 1990. doi: 10.1038/347677a0. [DOI] [PubMed] [Google Scholar]
- Brainard DH. The Psychophysics Toolbox. Spat Vis 10: 433–436, 1997. doi: 10.1163/156856897X00357. [DOI] [PubMed] [Google Scholar]
- Budnik U, Hindi-Attar C, Hamburger K, Pinna B, Hennig J, Speck O. Perceptual experience of visual motion activates hMT+ independently from the physical reality: fMRI insights from the looming Pinna figure. Perception 45: 1211–1221, 2016. doi: 10.1177/0301006616652051. [DOI] [PubMed] [Google Scholar]
- Chen SK, Badea TC, Hattar S. Photoentrainment and pupillary light reflex are mediated by distinct populations of ipRGCs. Nature 476: 92–95, 2011. doi: 10.1038/nature10206. [DOI] [PMC free article] [PubMed] [Google Scholar]
- De Franceschi G, Vivattanasarn T, Saleem AB, Solomon SG. Vision guides selection of freeze or flight defense strategies in mice. Curr Biol 26: 2150–2154, 2016. doi: 10.1016/j.cub.2016.06.006. [DOI] [PubMed] [Google Scholar]
- Diamond ME, von Heimendahl M, Knutsen PM, Kleinfeld D, Ahissar E. ‘Where’ and ‘what’ in the whisker sensorimotor system. Nat Rev Neurosci 9: 601–612, 2008. [Erratum in Nat Rev Neurosci 9: 709, 2008]. doi: 10.1038/nrn2411. [DOI] [PubMed] [Google Scholar]
- Dick PC, Michel NL, Gray JR. Complex object motion represented by context-dependent correlated activity of visual interneurones. Physiol Rep 5: e13355, 2017. doi: 10.14814/phy2.13355. [DOI] [PMC free article] [PubMed] [Google Scholar]
- Dill LM. The escape response of the zebra danio (Brachydanio rerio) I. The stimulus for escape. Anim Behav 22: 711–722, 1974. doi: 10.1016/S0003-3472(74)80022-9. [DOI] [Google Scholar]
- Dräger UC, Hubel DH. Studies of visual function and its decay in mice with hereditary retinal degeneration. J Comp Neurol 180: 85–114, 1978. doi: 10.1002/cne.901800107. [DOI] [PubMed] [Google Scholar]
- Dunn TW, Gebhardt C, Naumann EA, Riegler C, Ahrens MB, Engert F, Del Bene F. Neural circuits underlying visually evoked escapes in larval zebrafish. Neuron 89: 613–628, 2016. doi: 10.1016/j.neuron.2015.12.021. [DOI] [PMC free article] [PubMed] [Google Scholar]
- Ecker JL, Dumitrescu ON, Wong KY, Alam NM, Chen SK, LeGates T, Renna JM, Prusky GT, Berson DM, Hattar S. Melanopsin-expressing retinal ganglion-cell photoreceptors: cellular diversity and role in pattern vision. Neuron 67: 49–60, 2010. doi: 10.1016/j.neuron.2010.05.023. [DOI] [PMC free article] [PubMed] [Google Scholar]
- Erkman L, McEvilly RJ, Luo L, Ryan AK, Hooshmand F, O’Connell SM, Keithley EM, Rapaport DH, Ryan AF, Rosenfeld MG. Role of transcription factors Brn-3.1 and Brn-3.2 in auditory and visual system development. Nature 381: 603–606, 1996. doi: 10.1038/381603a0. [DOI] [PubMed] [Google Scholar]
- Evans DA, Stempel AV, Vale R, Ruehle S, Lefler Y, Branco T. A synaptic threshold mechanism for computing escape decisions. Nature 558: 590–594, 2018. doi: 10.1038/s41586-018-0244-6. [DOI] [PMC free article] [PubMed] [Google Scholar]
- Gale SD, Murphy GJ. Distinct representation and distribution of visual information by specific cell types in mouse superficial superior colliculus. J Neurosci 34: 13458–13471, 2014. doi: 10.1523/JNEUROSCI.2768-14.2014. [DOI] [PMC free article] [PubMed] [Google Scholar]
- Gale SD, Murphy GJ. Active dendritic properties and local inhibitory input enable selectivity for object motion in mouse superior colliculus neurons. J Neurosci 36: 9111–9123, 2016. doi: 10.1523/JNEUROSCI.0645-16.2016. [DOI] [PMC free article] [PubMed] [Google Scholar]
- Gale SD, Murphy GJ. Distinct cell types in the superficial superior colliculus project to the dorsal lateral geniculate and lateral posterior thalamic nuclei. J Neurophysiol 120: 1286–1292, 2018. doi: 10.1152/jn.00248.2018. [DOI] [PMC free article] [PubMed] [Google Scholar]
- Gan L, Xiang M, Zhou L, Wagner DS, Klein WH, Nathans J. POU domain factor Brn-3b is required for the development of a large set of retinal ganglion cells. Proc Natl Acad Sci USA 93: 3920–3925, 1996. doi: 10.1073/pnas.93.9.3920. [DOI] [PMC free article] [PubMed] [Google Scholar]
- Gerrero MR, McEvilly RJ, Turner E, Lin CR, O’Connell S, Jenne KJ, Hobbs MV, Rosenfeld MG. Brn-3.0: a POU-domain protein expressed in the sensory, immune, and endocrine systems that functions on elements distinct from known octamer motifs. Proc Natl Acad Sci USA 90: 10841–10845, 1993. doi: 10.1073/pnas.90.22.10841. [DOI] [PMC free article] [PubMed] [Google Scholar]
- Geva-Sagiv M, Las L, Yovel Y, Ulanovsky N. Spatial cognition in bats and rats: from sensory acquisition to multiscale maps and navigation. Nat Rev Neurosci 16: 94–108, 2015. doi: 10.1038/nrn3888. [DOI] [PubMed] [Google Scholar]
- Hattar S, Liao HW, Takao M, Berson DM, Yau KW. Melanopsin-containing retinal ganglion cells: architecture, projections, and intrinsic photosensitivity. Science 295: 1065–1070, 2002. doi: 10.1126/science.1069609. [DOI] [PMC free article] [PubMed] [Google Scholar]
- Hayes WN, Saiff EI. Visual alarm reactions in turtles. Anim Behav 15: 102–106, 1967. doi: 10.1016/S0003-3472(67)80018-6. [DOI] [PubMed] [Google Scholar]
- Holmqvist MH, Srinivasan MV. A visually evoked escape response of the housefly. J Comp Physiol A Neuroethol Sens Neural Behav Physiol 169: 451–459, 1991. doi: 10.1007/BF00197657. [DOI] [PubMed] [Google Scholar]
- Huang EJ, Liu W, Fritzsch B, Bianchi LM, Reichardt LF, Xiang M. Brn3a is a transcriptional regulator of soma size, target field innervation and axon pathfinding of inner ear sensory neurons. Development 128: 2421–2432, 2001. [DOI] [PMC free article] [PubMed] [Google Scholar]
- Huang EJ, Zang K, Schmidt A, Saulys A, Xiang M, Reichardt LF. POU domain factor Brn-3a controls the differentiation and survival of trigeminal neurons by regulating Trk receptor expression. Development 126: 2869–2882, 1999. [DOI] [PMC free article] [PubMed] [Google Scholar]
- Huang L, Yuan T, Tan M, Xi Y, Hu Y, Tao Q, Zhao Z, Zheng J, Han Y, Xu F, Luo M, Sollars PJ, Pu M, Pickard GE, So KF, Ren C. A retinoraphe projection regulates serotonergic activity and looming-evoked defensive behaviour. Nat Commun 8: 14908, 2017. doi: 10.1038/ncomms14908. [DOI] [PMC free article] [PubMed] [Google Scholar]
- Ichikawa H, Mo Z, Xiang M, Sugimoto T. Effect of Brn-3a deficiency on nociceptors and low-threshold mechanoreceptors in the trigeminal ganglion. Brain Res Mol Brain Res 104: 240–245, 2002a. doi: 10.1016/S0169-328X(02)00355-8. [DOI] [PubMed] [Google Scholar]
- Ichikawa H, Mo Z, Xiang M, Sugimoto T. Effect of Brn-3a deficiency on parvalbumin-immunoreactive primary sensory neurons in the dorsal root ganglion. Brain Res Dev Brain Res 150: 41–45, 2004. doi: 10.1016/j.devbrainres.2004.02.004. [DOI] [PubMed] [Google Scholar]
- Ichikawa H, Mo Z, Xiang M, Sugimoto T. Brn-3a deficiency increases tyrosine hydroxylase-immunoreactive neurons in the dorsal root ganglion. Brain Res 1036: 192–195, 2005a. doi: 10.1016/j.brainres.2004.10.028. [DOI] [PubMed] [Google Scholar]
- Ichikawa H, Qiu F, Xiang M, Sugimoto T. Brn-3a is required for the generation of proprioceptors in the mesencephalic trigeminal tract nucleus. Brain Res 1053: 203–206, 2005b. doi: 10.1016/j.brainres.2005.06.026. [DOI] [PubMed] [Google Scholar]
- Ichikawa H, Schulz S, Höllt V, Mo Z, Xiang M, Sugimoto T. Effect of Brn-3a deficiency on primary nociceptors in the trigeminal ganglion. Neurosci Res 51: 445–451, 2005c. doi: 10.1016/j.neures.2004.12.014. [DOI] [PubMed] [Google Scholar]
- Ichikawa H, Terayama R, Yamaai T, Jacobowitz DM, Qiu F, Xiang M, Sugimoto T. Brn-3a deficiency transiently increases expression of calbindin D-28 k and calretinin in the trigeminal ganglion during embryonic development. Cell Mol Neurobiol 29: 691–698, 2009. doi: 10.1007/s10571-009-9383-5. [DOI] [PMC free article] [PubMed] [Google Scholar]
- Ichikawa H, Yamaai T, Jacobowitz DM, Mo Z, Xiang M, Sugimoto T. Effect of Brn-3a deficiency on parvalbumin-, calbindin D-28k-, calretinin- and calcitonin gene-related peptide-immunoreactive primary sensory neurons in the trigeminal ganglion. Neuroscience 113: 537–546, 2002b. doi: 10.1016/S0306-4522(02)00182-3. [DOI] [PubMed] [Google Scholar]
- Ichikawa H, Yamaai T, Mo Z, Xiang M, Sugimoto T. Effect of Brn-3a deficiency on CGRP-immunoreactivity in the dorsal root ganglion. Neuroreport 13: 409–412, 2002c. doi: 10.1097/00001756-200203250-00009. [DOI] [PubMed] [Google Scholar]
- Jacoby J, Schwartz GW. Three small-receptive-field ganglion cells in the mouse retina are distinctly tuned to size, speed, and object motion. J Neurosci 37: 610–625, 2017. doi: 10.1523/JNEUROSCI.2804-16.2016. [DOI] [PMC free article] [PubMed] [Google Scholar]
- Jain V, Ravindran E, Dhingra NK. Differential expression of Brn3 transcription factors in intrinsically photosensitive retinal ganglion cells in mouse. J Comp Neurol 520: 742–755, 2012. doi: 10.1002/cne.22765. [DOI] [PubMed] [Google Scholar]
- Jang EV, Ramirez-Vizcarrondo C, Aizenman CD, Khakhalin AS. Emergence of selectivity to looming stimuli in a spiking network model of the optic tectum. Front Neural Circuits 10: 95, 2016. doi: 10.3389/fncir.2016.00095. [DOI] [PMC free article] [PubMed] [Google Scholar]
- Kim IJ, Zhang Y, Yamagata M, Meister M, Sanes JR. Molecular identification of a retinal cell type that responds to upward motion. Nature 452: 478–482, 2008. doi: 10.1038/nature06739. [DOI] [PubMed] [Google Scholar]
- Kleiner M, Brainard DH, Pelli D, Ingling A, Murray R, Broussard C. What’s new in Psychtoolbox-3. Perception 36: 1–16, 2007. [Google Scholar]
- Klimova L, Lachova J, Machon O, Sedlacek R, Kozmik Z. Generation of mRx-Cre transgenic mouse line for efficient conditional gene deletion in early retinal progenitors. PLoS One 8: e63029, 2013. doi: 10.1371/journal.pone.0063029. [DOI] [PMC free article] [PubMed] [Google Scholar]
- Kretschmer F, Kretschmer V, Kunze VP, Kretzberg J. OMR-arena: automated measurement and stimulation system to determine mouse visual thresholds based on optomotor responses. PLoS One 8: e78058, 2013. doi: 10.1371/journal.pone.0078058. [DOI] [PMC free article] [PubMed] [Google Scholar]
- Kretschmer F, Sajgo S, Kretschmer V, Badea TC. A system to measure the optokinetic and optomotor response in mice. J Neurosci Methods 256: 91–105, 2015. doi: 10.1016/j.jneumeth.2015.08.007. [DOI] [PMC free article] [PubMed] [Google Scholar]
- Kretschmer F, Tariq M, Chatila W, Wu B, Badea TC. Comparison of optomotor and optokinetic reflexes in mice. J Neurophysiol 118: 300–316, 2017. doi: 10.1152/jn.00055.2017. [DOI] [PMC free article] [PubMed] [Google Scholar]
- Laurens J, Angelaki DE. The brain compass: a perspective on how self-motion updates the head direction cell attractor. Neuron 97: 275–289, 2018. doi: 10.1016/j.neuron.2017.12.020. [DOI] [PMC free article] [PubMed] [Google Scholar]
- Liang F, Xiong XR, Zingg B, Ji XY, Zhang LI, Tao HW. Sensory cortical control of a visually induced arrest behavior via corticotectal projections. Neuron 86: 755–767, 2015. doi: 10.1016/j.neuron.2015.03.048. [DOI] [PMC free article] [PubMed] [Google Scholar]
- Mittelstaedt ML, Mittelstaedt H. Homing by path integration in a mammal. Naturwissenschaften 67: 566–567, 1980. doi: 10.1007/BF00450672. [DOI] [Google Scholar]
- Mu X, Fu X, Sun H, Liang S, Maeda H, Frishman LJ, Klein WH. Ganglion cells are required for normal progenitor- cell proliferation but not cell-fate determination or patterning in the developing mouse retina. Curr Biol 15: 525–530, 2005. doi: 10.1016/j.cub.2005.01.043. [DOI] [PubMed] [Google Scholar]
- Münch TA, da Silveira RA, Siegert S, Viney TJ, Awatramani GB, Roska B. Approach sensitivity in the retina processed by a multifunctional neural circuit. Nat Neurosci 12: 1308–1316, 2009. doi: 10.1038/nn.2389. [DOI] [PubMed] [Google Scholar]
- Parmhans N, Fuller AD, Nguyen E, Chuang K, Swygart DI, Wienbar SR, Lin T, Kozmik Z, Dong L, Schwartz GW, Badea TC. Identification of retinal ganglion cell types and brain nuclei expressing the transcription factor Brn3c/Pou4f3 using a Cre recombinase knock-in allele (Preprint). bioRxiv 2020.2006.2020.162859, 2020. doi: 10.1101/2020.06.20.162859. [DOI] [PMC free article] [PubMed]
- Parmhans N, Sajgo S, Niu J, Luo W, Badea TC. Characterization of retinal ganglion cell, horizontal cell, and amacrine cell types expressing the neurotrophic receptor tyrosine kinase Ret. J Comp Neurol 526: 742–766, 2018. doi: 10.1002/cne.24367. [DOI] [PMC free article] [PubMed] [Google Scholar]
- Pelli DG. The VideoToolbox software for visual psychophysics: transforming numbers into movies. Spat Vis 10: 437–442, 1997. doi: 10.1163/156856897X00366. [DOI] [PubMed] [Google Scholar]
- Pittler SJ, Baehr W. Identification of a nonsense mutation in the rod photoreceptor cGMP phosphodiesterase beta-subunit gene of the rd mouse. Proc Natl Acad Sci USA 88: 8322–8326, 1991. doi: 10.1073/pnas.88.19.8322. [DOI] [PMC free article] [PubMed] [Google Scholar]
- Poulter S, Hartley T, Lever C. The neurobiology of mammalian navigation. Curr Biol 28: R1023–R1042, 2018. doi: 10.1016/j.cub.2018.05.050. [DOI] [PubMed] [Google Scholar]
- Quina LA, Pak W, Lanier J, Banwait P, Gratwick K, Liu Y, Velasquez T, O’Leary DD, Goulding M, Turner EE. Brn3a-expressing retinal ganglion cells project specifically to thalamocortical and collicular visual pathways. J Neurosci 25: 11595–11604, 2005. doi: 10.1523/JNEUROSCI.2837-05.2005. [DOI] [PMC free article] [PubMed] [Google Scholar]
- Reinhard K, Li C, Do Q, Burke EG, Heynderickx S, Farrow K. A projection specific logic to sampling visual inputs in mouse superior colliculus. eLife 8: e50697, 2019. doi: 10.7554/eLife.50697. [DOI] [PMC free article] [PubMed] [Google Scholar]
- Rousso DL, Qiao M, Kagan RD, Yamagata M, Palmiter RD, Sanes JR. Two pairs of ON and OFF Retinal Ganglion Cells Are Defined by Intersectional Patterns of Transcription Factor Expression. Cell Reports 15: 1930–1944, 2016. doi: 10.1016/j.celrep.2016.04.069. [DOI] [PMC free article] [PubMed] [Google Scholar]
- Rueden CT, Schindelin J, Hiner MC, DeZonia BE, Walter AE, Arena ET, Eliceiri KW. ImageJ2: ImageJ for the next generation of scientific image data. BMC Bioinformatics 18: 529, 2017. doi: 10.1186/s12859-017-1934-z. [DOI] [PMC free article] [PubMed] [Google Scholar]
- Sajgo S, Ali S, Popescu O, Badea TC. Dynamic expression of transcription factor Brn3b during mouse cranial nerve development. J Comp Neurol 524: 1033–1061, 2016. doi: 10.1002/cne.23890. [DOI] [PMC free article] [PubMed] [Google Scholar]
- Salay LD, Ishiko N, Huberman AD. A midline thalamic circuit determines reactions to visual threat. Nature 557: 183–189, 2018. doi: 10.1038/s41586-018-0078-2. [DOI] [PMC free article] [PubMed] [Google Scholar]
- Schiff W. Perception of impending collision: a study of visually directed avoidant behavior. Psychol Monogr 79: 11–26, 1965. doi: 10.1037/h0093887. [DOI] [PubMed] [Google Scholar]
- Schiff W, Caviness JA, Gibson JJ. Persistent fear responses in rhesus monkeys to the optical stimulus of “looming”. Science 136: 982–983, 1962. doi: 10.1126/science.136.3520.982. [DOI] [PubMed] [Google Scholar]
- Schmidt TM, Chen SK, Hattar S. Intrinsically photosensitive retinal ganglion cells: many subtypes, diverse functions. Trends Neurosci 34: 572–580, 2011. doi: 10.1016/j.tins.2011.07.001. [DOI] [PMC free article] [PubMed] [Google Scholar]
- Sen R, Wu M, Branson K, Robie A, Rubin GM, Dickson BJ. Moonwalker descending neurons mediate visually evoked retreat in Drosophila. Curr Biol 27: 766–771, 2017. doi: 10.1016/j.cub.2017.02.008. [DOI] [PubMed] [Google Scholar]
- Shang C, Chen Z, Liu A, Li Y, Zhang J, Qu B, Yan F, Zhang Y, Liu W, Liu Z, Guo X, Li D, Wang Y, Cao P. Divergent midbrain circuits orchestrate escape and freezing responses to looming stimuli in mice. Nat Commun 9: 1232, 2018. doi: 10.1038/s41467-018-03580-7. [DOI] [PMC free article] [PubMed] [Google Scholar]
- Shang C, Liu Z, Chen Z, Shi Y, Wang Q, Liu S, Li D, Cao P. BRAIN CIRCUITS. A parvalbumin-positive excitatory visual pathway to trigger fear responses in mice. Science 348: 1472–1477, 2015. doi: 10.1126/science.aaa8694. [DOI] [PubMed] [Google Scholar]
- Shi M, Kumar SR, Motajo O, Kretschmer F, Mu X, Badea TC. Genetic interactions between Brn3 transcription factors in retinal ganglion cell type specification. PLoS One 8: e76347, 2013. doi: 10.1371/journal.pone.0076347. [DOI] [PMC free article] [PubMed] [Google Scholar]
- Shragai T, Ping X, Arakaki C, Garlick D, Blumstein DT, Blaisdell AP. Hermit crab response to a visual threat is sensitive to looming cues. PeerJ 5: e4058, 2017. doi: 10.7717/peerj.4058. [DOI] [PMC free article] [PubMed] [Google Scholar]
- Simmons PJ, Sztarker J, Rind FC. Looming detection by identified visual interneurons during larval development of the locust Locusta migratoria. J Exp Biol 216: 2266–2275, 2013. doi: 10.1242/jeb.083360. [DOI] [PubMed] [Google Scholar]
- Sun W, Deng Q, Levick WR, He S. ON direction-selective ganglion cells in the mouse retina. J Physiol 576: 197–202, 2006. doi: 10.1113/jphysiol.2006.115857. [DOI] [PMC free article] [PubMed] [Google Scholar]
- Temizer I, Donovan JC, Baier H, Semmelhack JL. A visual pathway for looming-evoked escape in larval zebrafish. Curr Biol 25: 1823–1834, 2015. doi: 10.1016/j.cub.2015.06.002. [DOI] [PubMed] [Google Scholar]
- Vale R, Evans DA, Branco T. Rapid spatial learning controls instinctive defensive behavior in mice. Curr Biol 27: 1342–1349, 2017. doi: 10.1016/j.cub.2017.03.031. [DOI] [PMC free article] [PubMed] [Google Scholar]
- Wei P, Liu N, Zhang Z, Liu X, Tang Y, He X, Wu B, Zhou Z, Liu Y, Li J, Zhang Y, Zhou X, Xu L, Chen L, Bi G, Hu X, Xu F, Wang L. Processing of visually evoked innate fear by a non-canonical thalamic pathway. Nat Commun 6: 6756, 2015. [Erratum in Nat Commun 6: 8228, 2016]. doi: 10.1038/ncomms7756. [DOI] [PMC free article] [PubMed] [Google Scholar]
- Weng S, Sun W, He S. Identification of ON-OFF direction-selective ganglion cells in the mouse retina. J Physiol 562: 915–923, 2005. doi: 10.1113/jphysiol.2004.076695. [DOI] [PMC free article] [PubMed] [Google Scholar]
- Whishaw IQ. Cholinergic receptor blockade in the rat impairs locale but not taxon strategies for place navigation in a swimming pool. Behav Neurosci 99: 979–1005, 1985. doi: 10.1037/0735-7044.99.5.979. [DOI] [PubMed] [Google Scholar]
- Wu M, Nern A, Williamson WR, Morimoto MM, Reiser MB, Card GM, Rubin GM. Visual projection neurons in the Drosophila lobula link feature detection to distinct behavioral programs. eLife 5: e21022, 2016. doi: 10.7554/eLife.21022. [DOI] [PMC free article] [PubMed] [Google Scholar]
- Xiang M, Gan L, Li D, Chen ZY, Zhou L, O’Malley BW Jr, Klein W, Nathans J. Essential role of POU-domain factor Brn-3c in auditory and vestibular hair cell development. Proc Natl Acad Sci USA 94: 9445–9450, 1997. doi: 10.1073/pnas.94.17.9445. [DOI] [PMC free article] [PubMed] [Google Scholar]
- Xiang M, Gan L, Zhou L, Klein WH, Nathans J. Targeted deletion of the mouse POU domain gene Brn-3a causes selective loss of neurons in the brainstem and trigeminal ganglion, uncoordinated limb movement, and impaired suckling. Proc Natl Acad Sci USA 93: 11950–11955, 1996. doi: 10.1073/pnas.93.21.11950. [DOI] [PMC free article] [PubMed] [Google Scholar]
- Xiang M, Zhou L, Macke JP, Yoshioka T, Hendry SH, Eddy RL, Shows TB, Nathans J. The Brn-3 family of POU-domain factors: primary structure, binding specificity, and expression in subsets of retinal ganglion cells and somatosensory neurons. J Neurosci 15: 4762–4785, 1995. doi: 10.1523/JNEUROSCI.15-07-04762.1995. [DOI] [PMC free article] [PubMed] [Google Scholar]
- Xiang M, Zhou L, Peng YW, Eddy RL, Shows TB, Nathans J. Brn-3b: a POU domain gene expressed in a subset of retinal ganglion cells. Neuron 11: 689–701, 1993. doi: 10.1016/0896-6273(93)90079-7. [DOI] [PubMed] [Google Scholar]
- Yamamoto K, Nakata M, Nakagawa H. Input and output characteristics of collision avoidance behavior in the frog Rana catesbeiana. Brain Behav Evol 62: 201–211, 2003. doi: 10.1159/000073272. [DOI] [PubMed] [Google Scholar]
- Yamawaki Y. Unraveling the functional organization of lobula complex in the mantis brain by identification of visual interneurons. J Comp Neurol 527: 1161-1178, 2019. doi: 10.1002/cne.24603. [DOI] [PubMed] [Google Scholar]
- Yilmaz M, Meister M. Rapid innate defensive responses of mice to looming visual stimuli. Curr Biol 23: 2011–2015, 2013. doi: 10.1016/j.cub.2013.08.015. [DOI] [PMC free article] [PubMed] [Google Scholar]
- Yin C, Li X, Du J. Optic tectal superficial interneurons detect motion in larval zebrafish. Protein Cell 10: 238–248, 2019. doi: 10.1007/s13238-018-0587-7. [DOI] [PMC free article] [PubMed] [Google Scholar]
- Yonas A, Goldsmith LT, Hallstrom JL. Development of sensitivity to information provided by cast shadows in pictures. Perception 7: 333–341, 1978. doi: 10.1068/p070333. [DOI] [PubMed] [Google Scholar]
- Zhang Y, Kim IJ, Sanes JR, Meister M. The most numerous ganglion cell type of the mouse retina is a selective feature detector. Proc Natl Acad Sci USA 109: E2391–E2398, 2012. doi: 10.1073/pnas.1211547109. [DOI] [PMC free article] [PubMed] [Google Scholar]
- Zhao X, Liu M, Cang J. Visual cortex modulates the magnitude but not the selectivity of looming-evoked responses in the superior colliculus of awake mice. Neuron 84: 202–213, 2014. doi: 10.1016/j.neuron.2014.08.037. [DOI] [PMC free article] [PubMed] [Google Scholar]
- Zou M, Li S, Klein WH, Xiang M. Brn3a/Pou4f1 regulates dorsal root ganglion sensory neuron specification and axonal projection into the spinal cord. Dev Biol 364: 114–127, 2012. doi: 10.1016/j.ydbio.2012.01.021. [DOI] [PMC free article] [PubMed] [Google Scholar]